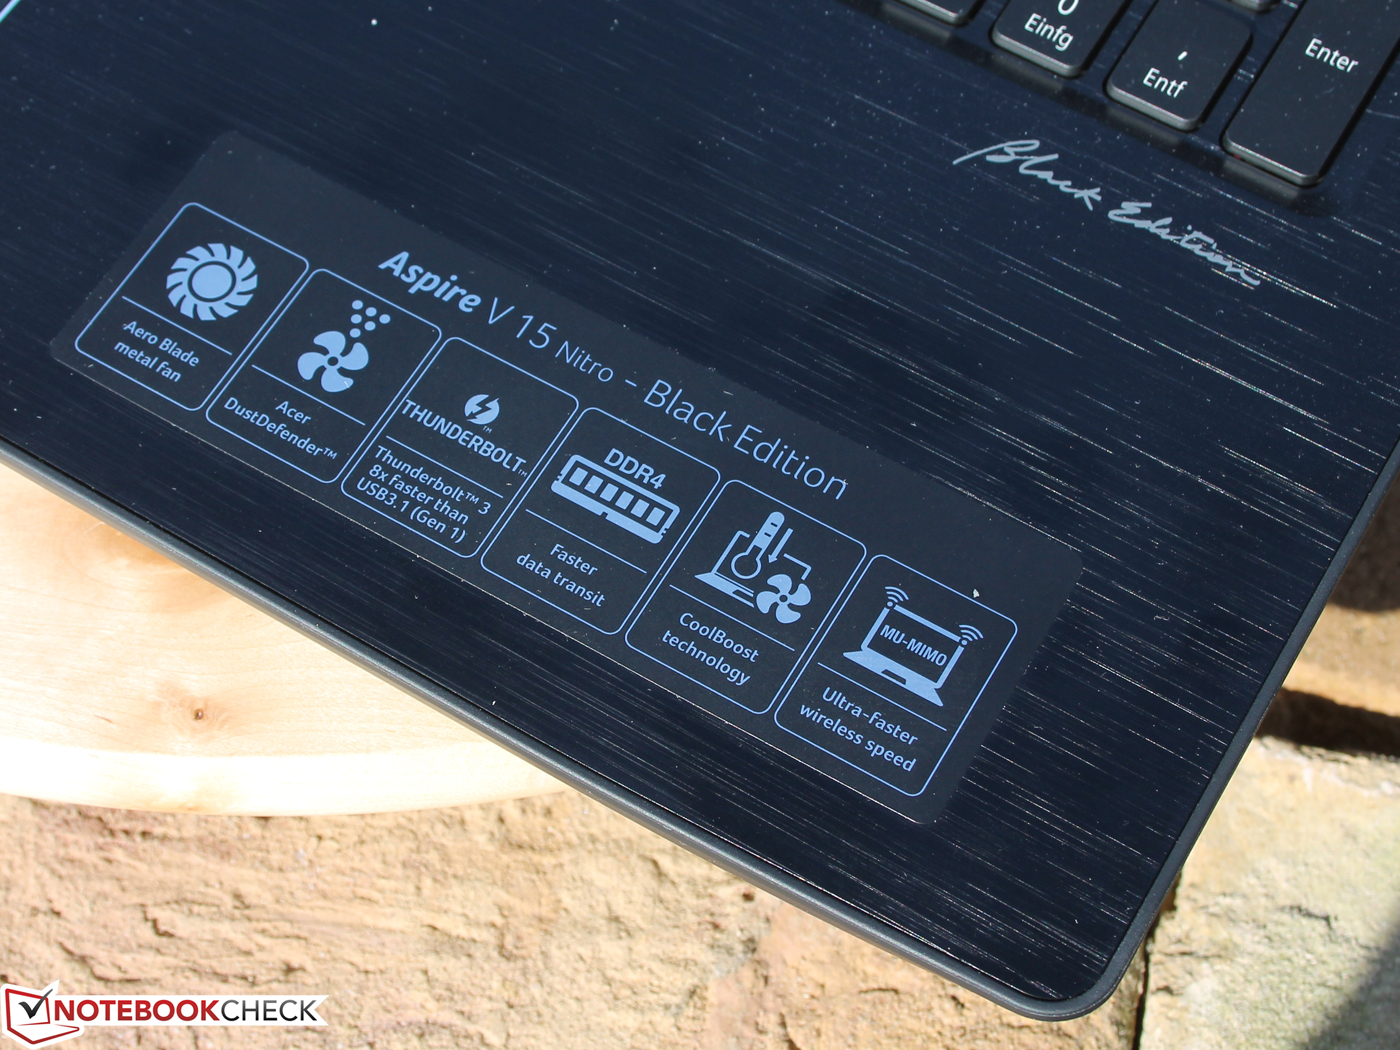
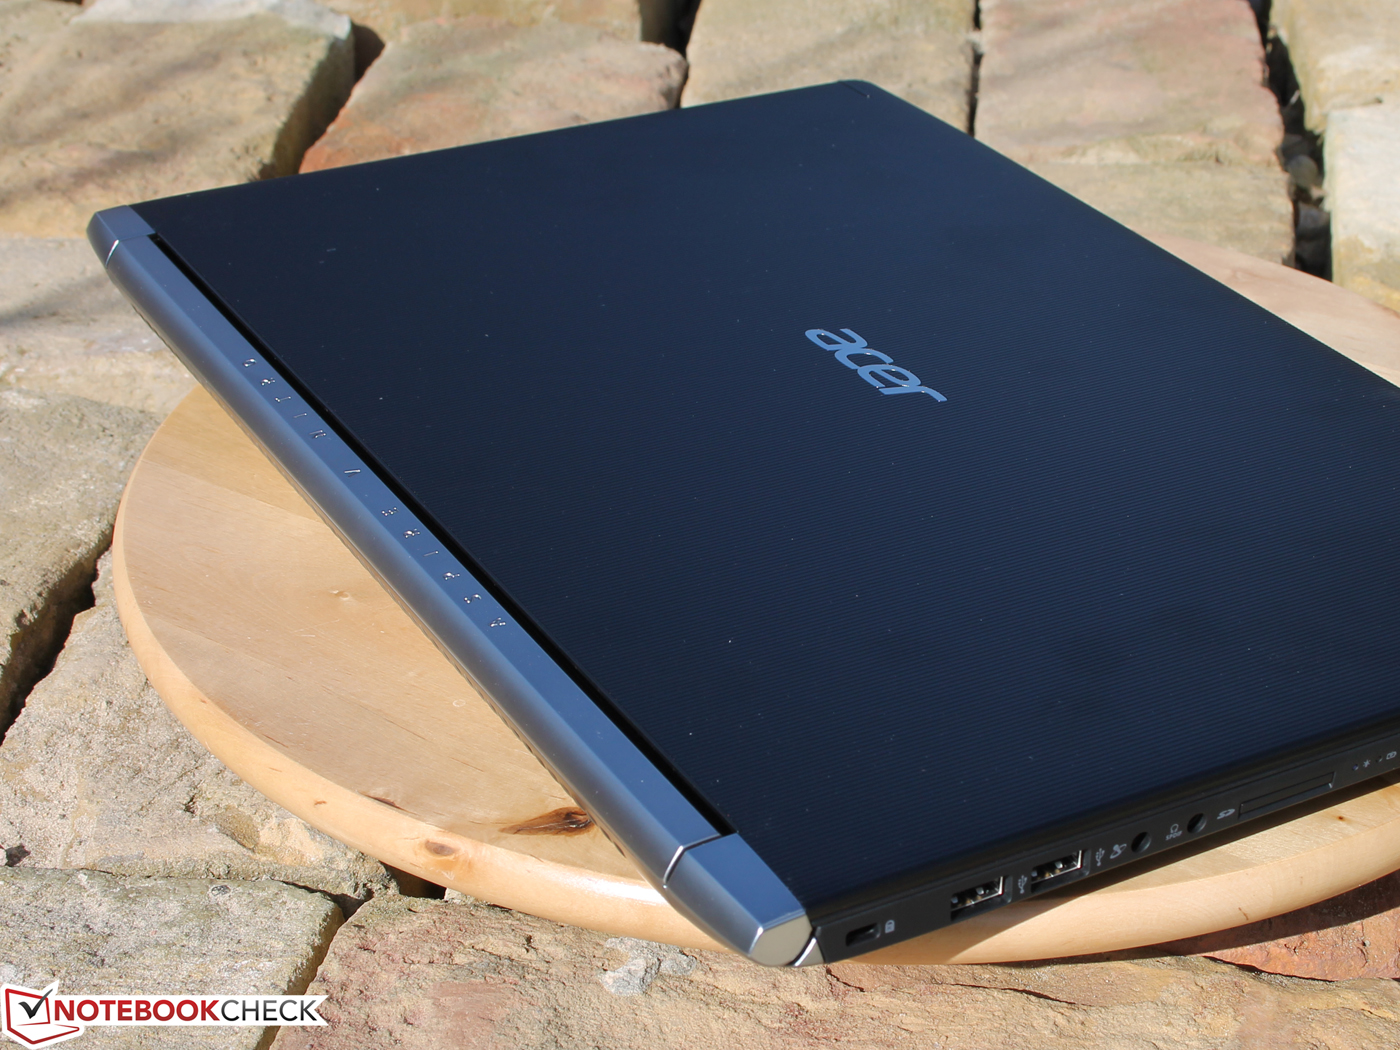
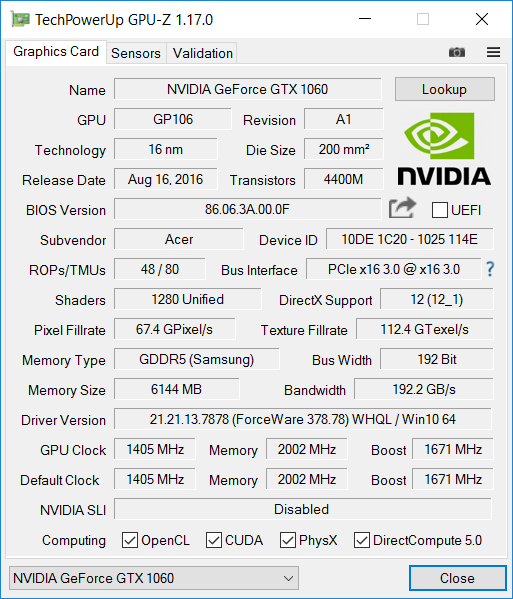
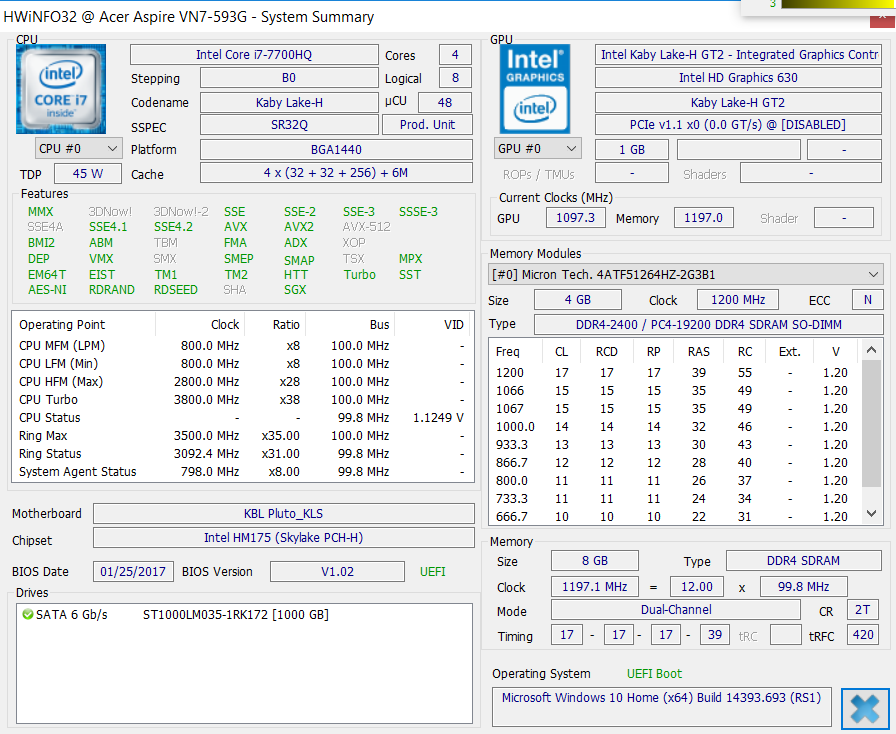
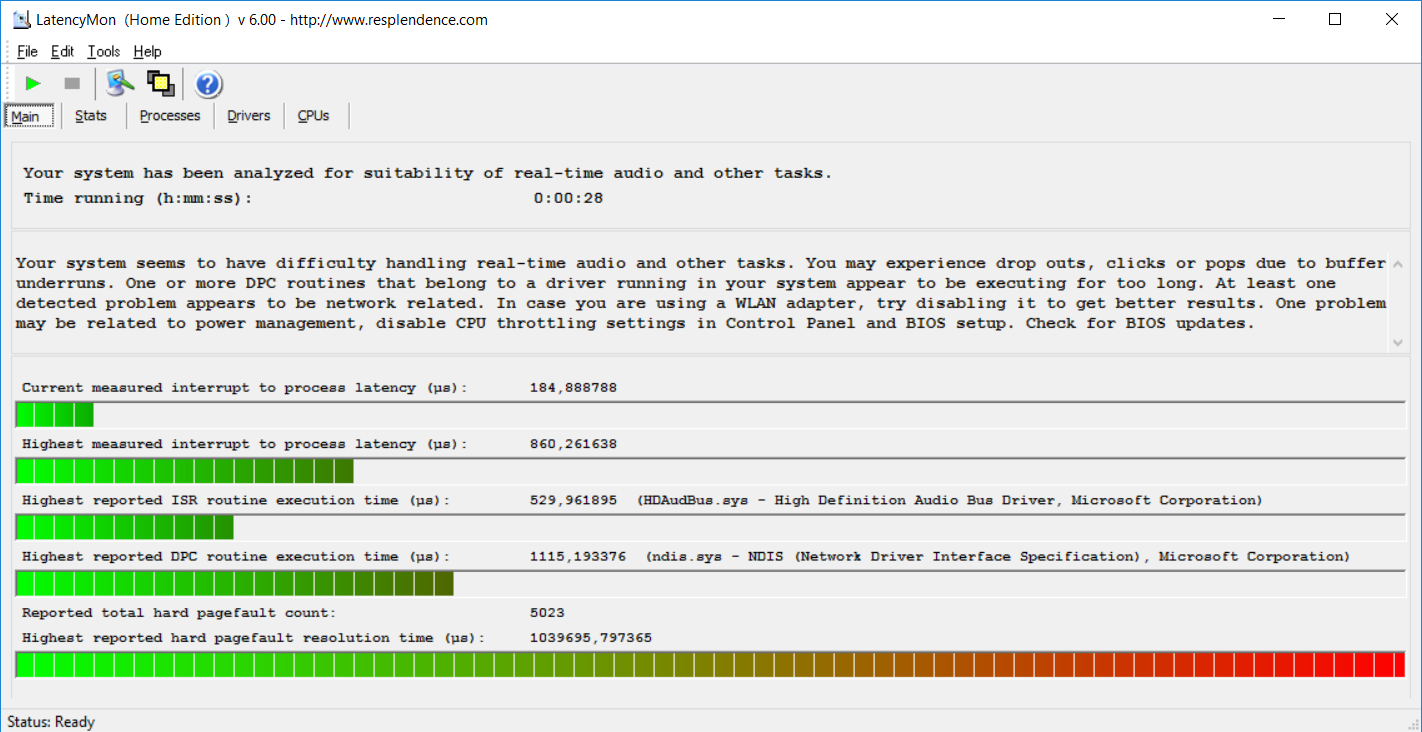
Breve análisis del Acer Aspire V15 Nitro BE VN7-593G (7700HQ, GTX 1060)


| |||||||||||||||||||||||||
iluminación: 86 %
Brillo con batería: 322 cd/m²
Contraste: 1039:1 (Negro: 0.31 cd/m²)
ΔE ColorChecker Calman: 4.73 | ∀{0.5-29.43 Ø4.73}
ΔE Greyscale Calman: 2.99 | ∀{0.09-98 Ø4.97}
85% sRGB (Argyll 1.6.3 3D)
56% AdobeRGB 1998 (Argyll 1.6.3 3D)
62.2% AdobeRGB 1998 (Argyll 3D)
85.1% sRGB (Argyll 3D)
65.8% Display P3 (Argyll 3D)
Gamma: 2.32
CCT: 6905 K
| Acer Aspire VN7-593G-73HP V15 Nitro BE LG Display LP156WF6-SPP1, , 1920x1080, 15.6" | Acer Aspire V15 Nitro BE VN7-592G-79DV Sharp LQ156D1JW02D, , 3840x2160, 15.6" | Asus Strix GL502VM-FY039T LG Philips LP156WF6-SPB6 (LGD046F), , 1920x1080, 15.6" | MSI GT62VR 7RE-223 LG Philips LP156WF6 (LGD046F), , 1920x1080, 15.6" | Gigabyte P55W v7 LG Philips LP156WF6 (LGD046F), , 1920x1080, 15.6" | Dell XPS 15 2017 9560 (7300HQ, Full-HD) Sharp SHP1453 LQ156M1, , 1920x1080, 15.6" | Acer Aspire VX5-591G-75C4 VX15 LG Philips LGD0550 / LP156WF6-SPK4, , 1920x1080, 15.6" | Dell Inspiron 15 7000 7567 AU Optronics AUO38ED B156HTN 28H80, , 1920x1080, 15.6" | MSI GL62M 7RD-077 Chi Mei N156HGE-EAL, , 1920x1080, 15.6" | |
|---|---|---|---|---|---|---|---|---|---|
| Display | 36% | -2% | -2% | -4% | 12% | -36% | -40% | 28% | |
| Display P3 Coverage (%) | 65.8 | 86.2 31% | 64.5 -2% | 63.9 -3% | 63.5 -3% | 68.9 5% | 38.88 -41% | 36.42 -45% | 85.4 30% |
| sRGB Coverage (%) | 85.1 | 100 18% | 83.4 -2% | 83.1 -2% | 82 -4% | 98.9 16% | 58.2 -32% | 54.9 -35% | 100 18% |
| AdobeRGB 1998 Coverage (%) | 62.2 | 99.5 60% | 60.9 -2% | 60.8 -2% | 59.9 -4% | 70.9 14% | 40.2 -35% | 37.62 -40% | 83.8 35% |
| Response Times | 3% | 14% | 18% | 18% | -43% | 39% | 3% | 4% | |
| Response Time Grey 50% / Grey 80% * (ms) | 41 ? | 49 ? -20% | 40 ? 2% | 37 ? 10% | 37 ? 10% | 54 ? -32% | 22 ? 46% | 36 ? 12% | 44 ? -7% |
| Response Time Black / White * (ms) | 34 ? | 25 ? 26% | 25 ? 26% | 25 ? 26% | 25 ? 26% | 52.4 ? -54% | 23 ? 32% | 36 ? -6% | 29 ? 15% |
| PWM Frequency (Hz) | 1000 ? | 198 ? | |||||||
| Screen | 26% | 0% | -2% | -4% | 2% | -15% | -86% | -54% | |
| Brightness middle (cd/m²) | 322 | 303 -6% | 321 0% | 310 -4% | 287 -11% | 400 24% | 281 -13% | 246 -24% | 258 -20% |
| Brightness (cd/m²) | 297 | 291 -2% | 296 0% | 311 5% | 289 -3% | 392 32% | 257 -13% | 235 -21% | 234 -21% |
| Brightness Distribution (%) | 86 | 83 -3% | 88 2% | 85 -1% | 87 1% | 89 3% | 85 -1% | 75 -13% | 79 -8% |
| Black Level * (cd/m²) | 0.31 | 0.22 29% | 0.33 -6% | 0.3 3% | 0.29 6% | 0.26 16% | 0.32 -3% | 0.55 -77% | 0.54 -74% |
| Contrast (:1) | 1039 | 1377 33% | 973 -6% | 1033 -1% | 990 -5% | 1538 48% | 878 -15% | 447 -57% | 478 -54% |
| Colorchecker dE 2000 * | 4.73 | 3.47 27% | 4.42 7% | 4.82 -2% | 4.92 -4% | 4.9 -4% | 5.16 -9% | 10.97 -132% | 9.74 -106% |
| Colorchecker dE 2000 max. * | 12.37 | 6.79 45% | 9.78 21% | 10.14 18% | 11 11% | 11 11% | 9.09 27% | 14.6 -18% | |
| Greyscale dE 2000 * | 2.99 | 1.17 61% | 3.34 -12% | 3.94 -32% | 3.66 -22% | 7.2 -141% | 4.57 -53% | 14.25 -377% | 11.59 -288% |
| Gamma | 2.32 95% | 2.35 94% | 2.4 92% | 2.45 90% | 2.32 95% | 2.11 104% | 2.59 85% | 1.83 120% | 2.19 100% |
| CCT | 6905 94% | 6658 98% | 6213 105% | 6877 95% | 6482 100% | 6911 94% | 6931 94% | 11200 58% | 11851 55% |
| Color Space (Percent of AdobeRGB 1998) (%) | 56 | 86 54% | 55 -2% | 54 -4% | 54 -4% | 64.2 15% | 37 -34% | 35 -37% | 76 36% |
| Color Space (Percent of sRGB) (%) | 85 | 100 18% | 83 -2% | 83 -2% | 82 -4% | 98.9 16% | 58 -32% | 55 -35% | 100 18% |
| Media total (Programa/Opciones) | 22% /
25% | 4% /
2% | 5% /
1% | 3% /
-1% | -10% /
-2% | -4% /
-12% | -41% /
-63% | -7% /
-30% |
* ... más pequeño es mejor
Tiempos de respuesta del display
| ↔ Tiempo de respuesta de Negro a Blanco | ||
|---|---|---|
| 34 ms ... subida ↗ y bajada ↘ combinada | ↗ 21 ms subida | 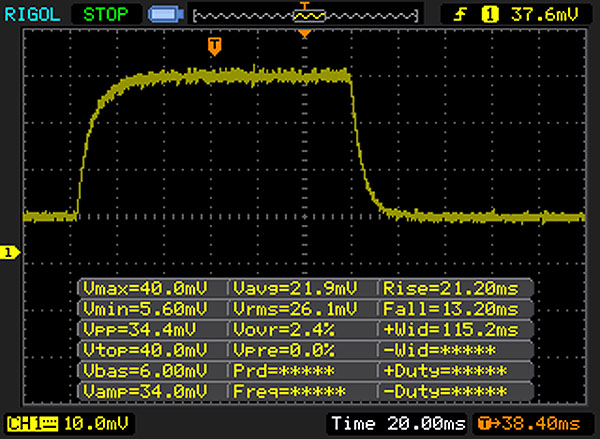 |
| ↘ 13 ms bajada | ||
| La pantalla mostró tiempos de respuesta lentos en nuestros tests y podría ser demasiado lenta para los jugones. En comparación, todos los dispositivos de prueba van de ##min### (mínimo) a 240 (máximo) ms. » 91 % de todos los dispositivos son mejores. Eso quiere decir que el tiempo de respuesta es peor que la media (19.9 ms) de todos los dispositivos testados. | ||
| ↔ Tiempo de respuesta 50% Gris a 80% Gris | ||
| 41 ms ... subida ↗ y bajada ↘ combinada | ↗ 21 ms subida | 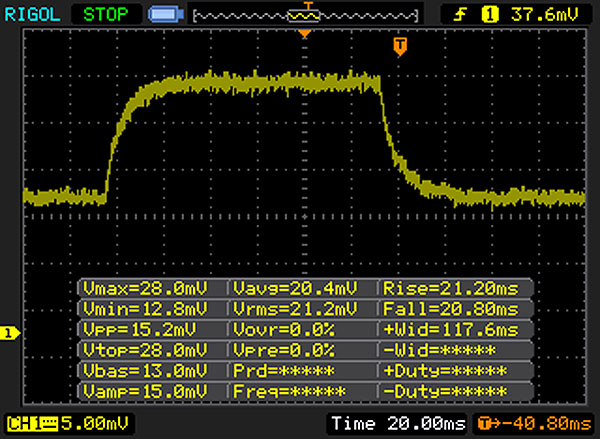 |
| ↘ 20 ms bajada | ||
| La pantalla mostró tiempos de respuesta lentos en nuestros tests y podría ser demasiado lenta para los jugones. En comparación, todos los dispositivos de prueba van de ##min### (mínimo) a 636 (máximo) ms. » 65 % de todos los dispositivos son mejores. Eso quiere decir que el tiempo de respuesta es peor que la media (31.1 ms) de todos los dispositivos testados. | ||
Parpadeo de Pantalla / PWM (Pulse-Width Modulation)
| Parpadeo de Pantalla / PWM no detectado | 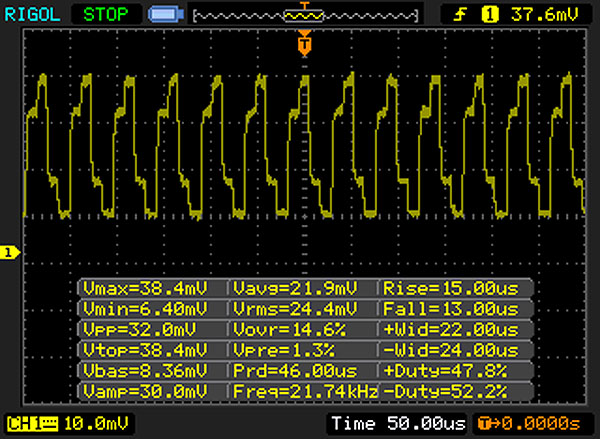 | ||
Comparación: 52 % de todos los dispositivos testados no usaron PWM para atenuar el display. Si se usó, medimos una media de 7798 (mínimo: 5 - máxmo: 343500) Hz. | |||
| Acer Aspire VN7-593G-73HP V15 Nitro BE Seagate Mobile HDD 1TB ST1000LM035 | Acer Aspire V15 Nitro BE VN7-592G-79DV Lite-On CV1-8B512 M.2 512 GB | Asus Strix GL502VM-FY039T Micron SSD 1100 (MTFDDAV256TBN) | MSI GL62M 7RD-077 HGST Travelstar 7K1000 HTS721010A9E630 | |
|---|---|---|---|---|
| CrystalDiskMark 3.0 | 18615% | 20775% | 74% | |
| Read Seq (MB/s) | 120.9 | 531 339% | 462.5 283% | 112.4 -7% |
| Write Seq (MB/s) | 101.8 | 415.6 308% | 462.7 355% | 107.3 5% |
| Read 512 (MB/s) | 37.83 | 338.9 796% | 335 786% | 43.19 14% |
| Write 512 (MB/s) | 84.4 | 415.6 392% | 407.1 382% | 57 -32% |
| Read 4k (MB/s) | 0.473 | 24.77 5137% | 25.61 5314% | 0.494 4% |
| Write 4k (MB/s) | 0.313 | 78.4 24948% | 86.3 27472% | 1.122 258% |
| Read 4k QD32 (MB/s) | 1.133 | 278.8 24507% | 246.7 21674% | 1.088 -4% |
| Write 4k QD32 (MB/s) | 0.274 | 253.7 92491% | 301.5 109936% | 1.234 350% |

| 3DMark 11 Performance | 12181 puntos | |
| 3DMark Cloud Gate Standard Score | 23269 puntos | |
| 3DMark Fire Strike Score | 9621 puntos | |
| 3DMark Time Spy Score | 3594 puntos | |
ayuda | ||
| BioShock Infinite - 1920x1080 Ultra Preset, DX11 (DDOF) | |
| MSI GT62VR 7RE-223 | |
| Asus Strix GL502VM-FY039T | |
| HP Omen 17-w100ng | |
| Acer Aspire VN7-593G-73HP V15 Nitro BE | |
| Dell Inspiron 15 7000 7567 | |
| MSI GL62M 7RD-077 | |
| Acer Aspire V15 Nitro BE VN7-592G-79DV | |
| Thief - 1920x1080 Very High Preset AA:FXAA & High SS AF:8x | |
| Acer Aspire VN7-593G-73HP V15 Nitro BE | |
| MSI GL62M 7RD-077 | |
| The Witcher 3 - 1920x1080 Ultra Graphics & Postprocessing (HBAO+) | |
| Gigabyte P55W v7 | |
| Acer Aspire VN7-593G-73HP V15 Nitro BE | |
| Acer Aspire VX5-591G-75C4 VX15 | |
| Dell XPS 15 2017 9560 (7300HQ, Full-HD) | |
| Rise of the Tomb Raider - 1920x1080 Very High Preset AA:FX AF:16x | |
| Gigabyte P55W v7 | |
| Acer Aspire VN7-593G-73HP V15 Nitro BE | |
| Dell Inspiron 15 7000 7567 | |
| MSI GL62M 7RD-077 | |
| Acer Aspire V15 Nitro BE VN7-592G-79DV | |
| Deus Ex Mankind Divided - 1920x1080 Ultra Preset AA:2xMS AF:8x | |
| MSI GT62VR 7RE-223 | |
| Acer Aspire VN7-593G-73HP V15 Nitro BE | |
| HP Omen 17-w100ng | |
| MSI GL62M 7RD-077 | |
| Battlefield 1 - 1920x1080 Ultra Preset AA:T | |
| MSI GT62VR 7RE-223 | |
| HP Omen 17-w100ng | |
| Gigabyte P55W v7 | |
| Acer Aspire VN7-593G-73HP V15 Nitro BE | |
| Dell Inspiron 15 7000 7567 | |
| Dell XPS 15 2017 9560 (7300HQ, Full-HD) | |
| MSI GL62M 7RD-077 | |
| Titanfall 2 - 1920x1080 Very High (Insane Texture Quality) / Enabled AA:TS AF:16x | |
| MSI GT62VR 7RE-223 | |
| Acer Aspire VN7-593G-73HP V15 Nitro BE | |
| HP Omen 17-w100ng | |
| Asus Strix GL502VM-FY039T | |
| Dell Inspiron 15 7000 7567 | |
| Dell XPS 15 2017 9560 (7300HQ, Full-HD) | |
| MSI GL62M 7RD-077 | |
| Dishonored 2 - 1920x1080 Ultra Preset AA:TX | |
| Asus Strix GL502VM-FY039T | |
| Acer Aspire VN7-593G-73HP V15 Nitro BE | |
| Gigabyte P55W v7 | |
| Dell Inspiron 15 7000 7567 | |
| bajo | medio | alto | ultra | |
|---|---|---|---|---|
| BioShock Infinite (2013) | 142 | 128 | 88 | |
| Thief (2014) | 63.8 | |||
| The Witcher 3 (2015) | 68 | 38.3 | ||
| Rise of the Tomb Raider (2016) | 74.5 | 60.7 | ||
| Deus Ex Mankind Divided (2016) | 55.9 | 29.4 | ||
| Battlefield 1 (2016) | 60 | 57 | ||
| Titanfall 2 (2016) | 143.5 | 124.2 | 99.4 | |
| Dishonored 2 (2016) | 60.5 | 53.9 |
Ruido
| Ocioso |
| 30.9 / 30.9 / 31.5 dB(A) |
| HDD |
| 32.3 dB(A) |
| Carga |
| 40.7 / 43.9 dB(A) |
 | ||
30 dB silencioso 40 dB(A) audible 50 dB(A) ruidosamente alto |
||
min: | ||
(-) La temperatura máxima en la parte superior es de 51.9 °C / 125 F, frente a la media de 36.8 °C / 98 F, que oscila entre 21 y 71 °C para la clase Multimedia.
(-) El fondo se calienta hasta un máximo de 54.6 °C / 130 F, frente a la media de 39.1 °C / 102 F
(+) En reposo, la temperatura media de la parte superior es de 26.3 °C / 79# F, frente a la media del dispositivo de 31.3 °C / 88 F.
(-) Jugando a The Witcher 3, la temperatura media de la parte superior es de 39.4 °C / 103 F, frente a la media del dispositivo de 31.3 °C / 88 F.
(+) Los reposamanos y el panel táctil alcanzan como máximo la temperatura de la piel (34 °C / 93.2 F) y, por tanto, no están calientes.
(-) La temperatura media de la zona del reposamanos de dispositivos similares fue de 28.7 °C / 83.7 F (-5.3 °C / -9.5 F).
Acer Aspire VN7-593G-73HP V15 Nitro BE análisis de audio
(±) | la sonoridad del altavoz es media pero buena (80 dB)
Graves 100 - 315 Hz
(±) | lubina reducida - en promedio 11.8% inferior a la mediana
(±) | la linealidad de los graves es media (13.5% delta a frecuencia anterior)
Medios 400 - 2000 Hz
(±) | medias más altas - de media 5.5% más altas que la mediana
(+) | los medios son lineales (6.6% delta a la frecuencia anterior)
Altos 2 - 16 kHz
(+) | máximos equilibrados - a sólo 1.1% de la mediana
(+) | los máximos son lineales (4% delta a la frecuencia anterior)
Total 100 - 16.000 Hz
(+) | el sonido global es lineal (14.6% de diferencia con la mediana)
En comparación con la misma clase
» 35% de todos los dispositivos probados de esta clase eran mejores, 4% similares, 61% peores
» El mejor tuvo un delta de 5%, la media fue 17%, el peor fue ###max##%
En comparación con todos los dispositivos probados
» 19% de todos los dispositivos probados eran mejores, 4% similares, 77% peores
» El mejor tuvo un delta de 4%, la media fue 24%, el peor fue ###max##%
Asus Strix GL502VM-FY039T análisis de audio
(±) | la sonoridad del altavoz es media pero buena (76 dB)
Graves 100 - 315 Hz
(-) | casi sin bajos - de media 19.1% inferior a la mediana
(-) | los graves no son lineales (18.1% delta a la frecuencia anterior)
Medios 400 - 2000 Hz
(+) | medios equilibrados - a sólo 2.9% de la mediana
(+) | los medios son lineales (4% delta a la frecuencia anterior)
Altos 2 - 16 kHz
(±) | máximos más altos - de media 5.6% más altos que la mediana
(±) | la linealidad de los máximos es media (8% delta a frecuencia anterior)
Total 100 - 16.000 Hz
(±) | la linealidad del sonido global es media (23% de diferencia con la mediana)
En comparación con la misma clase
» 83% de todos los dispositivos probados de esta clase eran mejores, 5% similares, 12% peores
» El mejor tuvo un delta de 6%, la media fue 18%, el peor fue ###max##%
En comparación con todos los dispositivos probados
» 69% de todos los dispositivos probados eran mejores, 5% similares, 26% peores
» El mejor tuvo un delta de 4%, la media fue 24%, el peor fue ###max##%
| Off / Standby | |
| Ocioso | |
| Carga |
|
Clave:
min: | |
| Acer Aspire VN7-593G-73HP V15 Nitro BE i7-7700HQ, GeForce GTX 1060 Mobile, Seagate Mobile HDD 1TB ST1000LM035, AH-IPS, Normally Black, Transmissive, 1920x1080, 15.6" | Acer Aspire V15 Nitro BE VN7-592G-79DV 6700HQ, GeForce GTX 960M, Lite-On CV1-8B512 M.2 512 GB, IPS, 3840x2160, 15.6" | Asus Strix GL502VM-FY039T 6700HQ, GeForce GTX 1060 Mobile, Micron SSD 1100 (MTFDDAV256TBN), IPS, 1920x1080, 15.6" | MSI GT62VR 7RE-223 i7-7700HQ, GeForce GTX 1070 Mobile, Samsung SSD PM871a MZNLN256HMHQ, IPS, 1920x1080, 15.6" | Gigabyte P55W v7 i7-7700HQ, GeForce GTX 1060 Mobile, Liteonit CV3-8D256, IPS, 1920x1080, 15.6" | Dell XPS 15 2017 9560 (7300HQ, Full-HD) i5-7300HQ, GeForce GTX 1050 Mobile, WDC WD10SPCX-75KHST0 + SanDisk Z400s M.2 2242 32 GB Cache, LED IGZO IPS InfinityEdge, 1920x1080, 15.6" | Acer Aspire VX5-591G-75C4 VX15 i7-7700HQ, GeForce GTX 1050 Ti Mobile, Toshiba MQ01ABD100, IPS, 1920x1080, 15.6" | Dell Inspiron 15 7000 7567 i7-7700HQ, GeForce GTX 1050 Ti Mobile, Intel SSDSCKKF256H6, TN, 1920x1080, 15.6" | MSI GL62M 7RD-077 i7-7700HQ, GeForce GTX 1050 Mobile, HGST Travelstar 7K1000 HTS721010A9E630, TN LED, 1920x1080, 15.6" | |
|---|---|---|---|---|---|---|---|---|---|
| Power Consumption | -8% | -46% | -83% | -7% | 15% | 8% | 28% | -15% | |
| Idle Minimum * (Watt) | 7.2 | 8.9 -24% | 16 -122% | 20 -178% | 8 -11% | 6.6 8% | 7 3% | 4.4 39% | 10.6 -47% |
| Idle Average * (Watt) | 10.5 | 13.9 -32% | 19 -81% | 24 -129% | 13 -24% | 9 14% | 10.2 3% | 6.8 35% | 14.5 -38% |
| Idle Maximum * (Watt) | 16 | 15.6 2% | 23 -44% | 29 -81% | 18 -13% | 10.7 33% | 14 12% | 8.3 48% | 15 6% |
| Load Average * (Watt) | 82 | 89 -9% | 68 17% | 82 -0% | 76 7% | 77.5 5% | 78 5% | 81 1% | 90 -10% |
| Witcher 3 ultra * (Watt) | 124 | ||||||||
| Load Maximum * (Watt) | 155 | 118 24% | 157 -1% | 193 -25% | 143 8% | 130 16% | 127 18% | 127 18% | 135 13% |
* ... más pequeño es mejor
| Acer Aspire VN7-593G-73HP V15 Nitro BE i7-7700HQ, GeForce GTX 1060 Mobile, 69 Wh | Acer Aspire V15 Nitro BE VN7-592G-79DV 6700HQ, GeForce GTX 960M, 52 Wh | Asus Strix GL502VM-FY039T 6700HQ, GeForce GTX 1060 Mobile, 64 Wh | MSI GT62VR 7RE-223 i7-7700HQ, GeForce GTX 1070 Mobile, 75 Wh | Gigabyte P55W v7 i7-7700HQ, GeForce GTX 1060 Mobile, 63 Wh | Dell XPS 15 2017 9560 (7300HQ, Full-HD) i5-7300HQ, GeForce GTX 1050 Mobile, 56 Wh | Acer Aspire VX5-591G-75C4 VX15 i7-7700HQ, GeForce GTX 1050 Ti Mobile, 52.5 Wh | Dell Inspiron 15 7000 7567 i7-7700HQ, GeForce GTX 1050 Ti Mobile, 74 Wh | MSI GL62M 7RD-077 i7-7700HQ, GeForce GTX 1050 Mobile, 41 Wh | |
|---|---|---|---|---|---|---|---|---|---|
| Duración de Batería | -27% | -37% | -30% | 7% | -12% | -32% | 55% | -44% | |
| Reader / Idle (h) | 8.4 | 8.8 5% | 5.3 -37% | 6.3 -25% | 13.2 57% | 9.4 12% | 5.4 -36% | 19.6 133% | 6.5 -23% |
| WiFi v1.3 (h) | 6 | 3.6 -40% | 3.7 -38% | 4.1 -32% | 5.8 -3% | 5.6 -7% | 5 -17% | 10.4 73% | 3.8 -37% |
| Load (h) | 2.4 | 1.3 -46% | 1.5 -37% | 1.6 -33% | 1.6 -33% | 1.4 -42% | 1.4 -42% | 1.4 -42% | 0.7 -71% |
| H.264 (h) | 3.9 | 3.9 | 4.2 | 7.6 | 3.6 |
Pro
Contra
Acer vuelve a demostrar su habilidad y crea una máquina de 15" que es tan adecuada para el juego como para el entretenimiento doméstico o para el trabajo. Pero primero lo primero.
El rendimiento es aquí el claro ganador. Se pueden jugar a todos los juegos actuales con detalles altos gracias a la GeForce GTX 1060. El fresco sistema de ventilación con dos ventiladores asegura unos frame rates consistentemente altos durante el estrés gaming. Recomendamos el GTX 1060 a gamers que busquen un portátil que ofrezca la mejor relación precio-rendimiento.
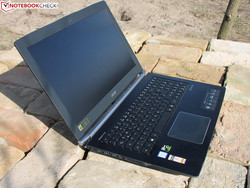
El Aspire V15 Nitro Black Edition 2017 trae potencia gaming al escritorio.
Si bien el V15 apenas produce ruido en inactivo, es bastante ruidoso durante los juegos. Los altavoces son buenísimos, y sus agudos y graves pueden ahogarlo fácilmente, empero. Los dispositivos de entrada son relativamente decentes y las opciones de mantenimiento son casi ejemplares. Un panel IPS mate de alto contraste remata las cosas. Aunque no cubre todos los espectros de color, no usa PWM.
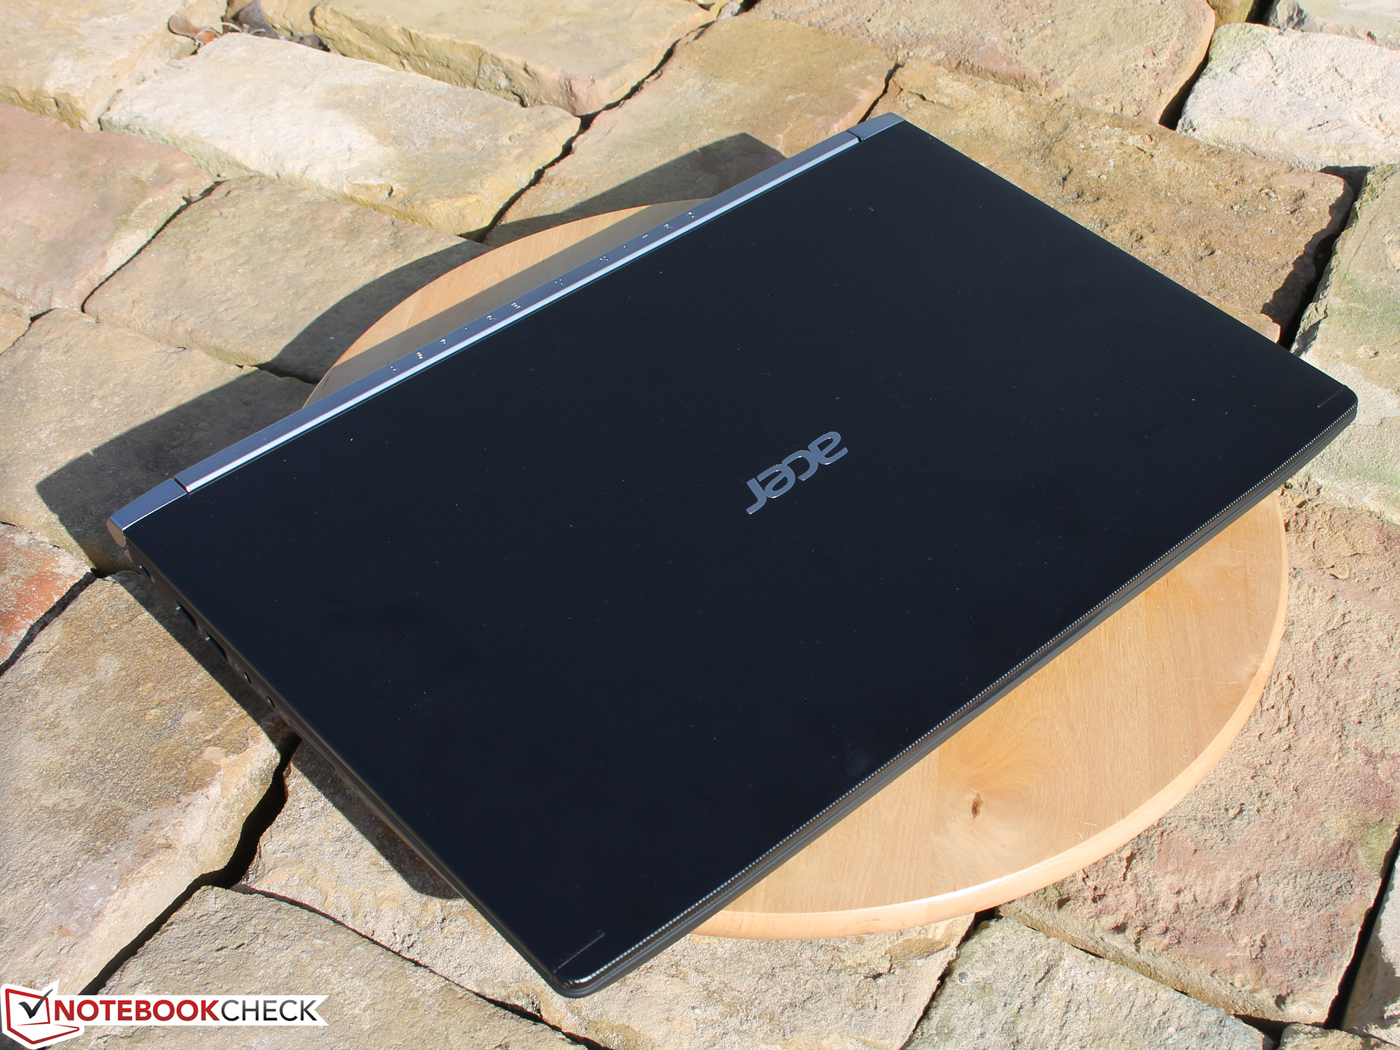
La eficiencia energética y el buen aguante de batería de seis horas puede competir con rivales igualmente fuertes. Esto nos lleva a los defectos: La delgada e insegura tapa es algo inestable. Lo que es más, la webcam es mala, y el disco duro es lento y repiquetea. Este último problema se puede eliminar optando por un modelo del V15 con SSD.
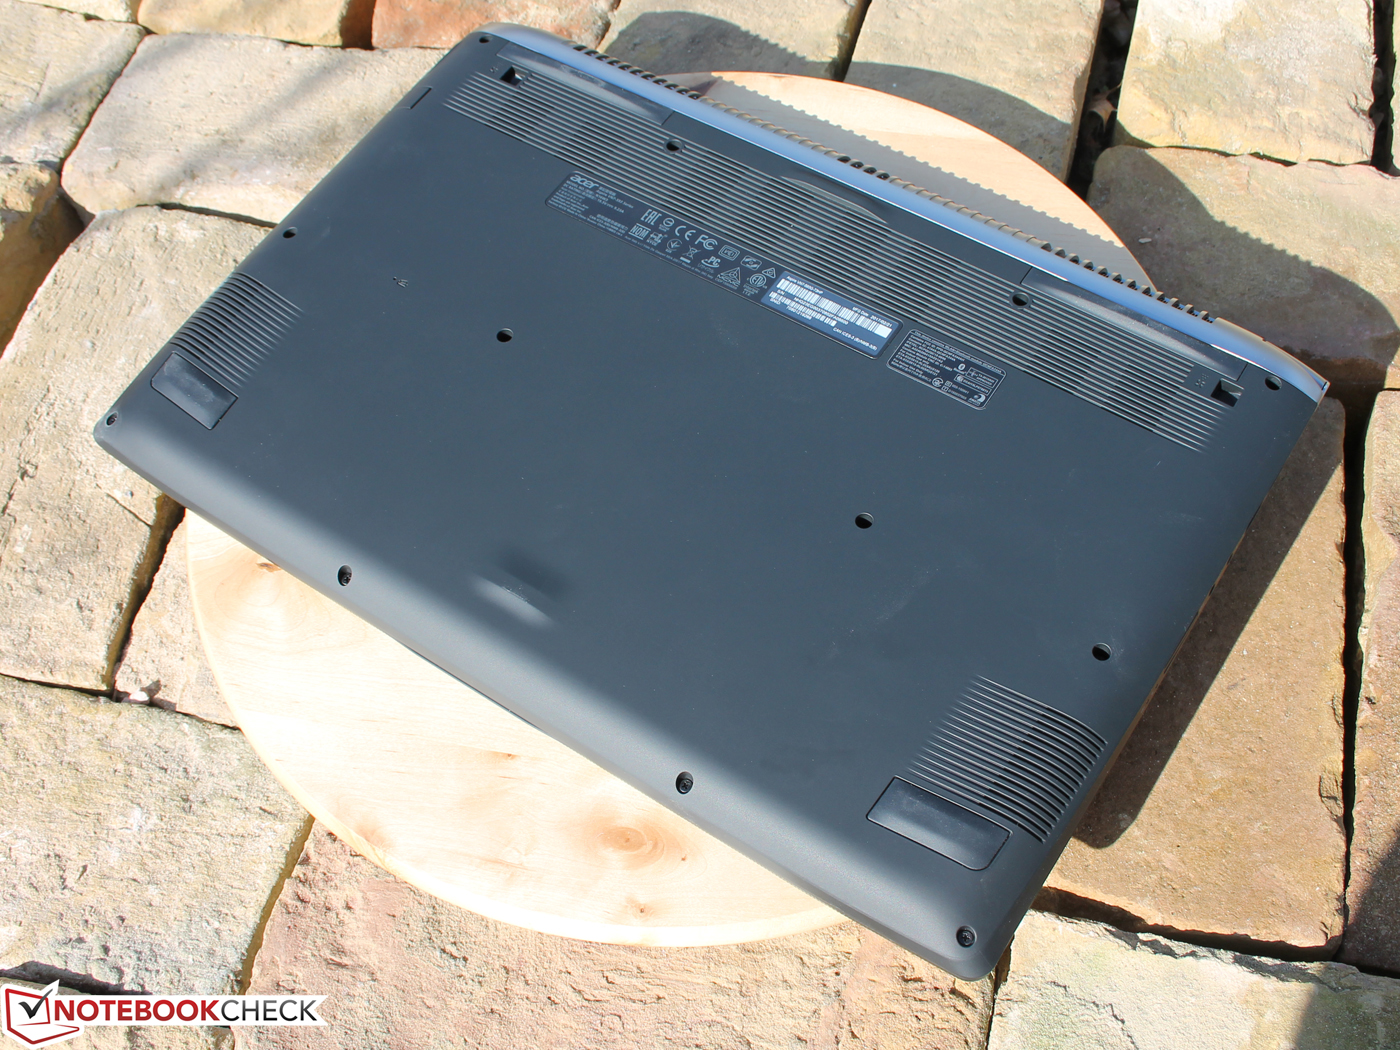
La carcasa inestable en algunos puntos a pesar del acabado metálico sigue ahí. A cambio, nunca ha sido más fácil cambiar componentes.
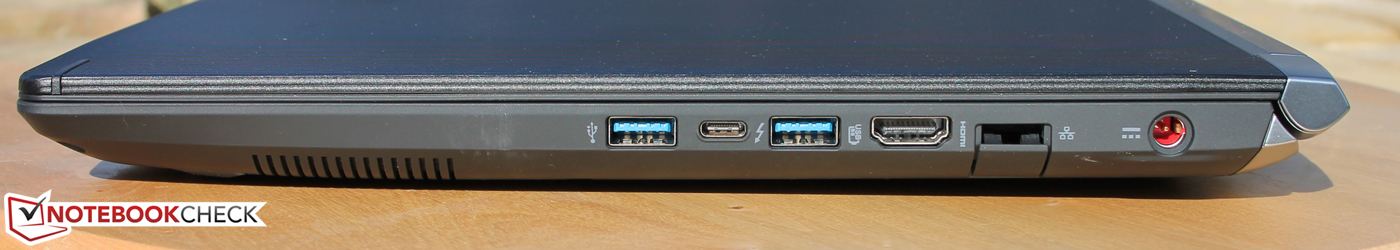
Los jugones definitivamente deberían echar un vistazo también al Asus Strix GL502VM como alternativa. Aunque sigue llevando un quad-core Broadwell, cuesta tanto como nuestro Aspire VN7-593G-73HP pero viene con un SSD (1400 Euros). No es mejor en todos los aspectos: el Strix GL502VM no tiene Thunderbolt 3 y sólo tiene el estándar USB 3.0 Type-C.
Acer Aspire VN7-593G-73HP V15 Nitro BE
- 03/18/2017 v6 (old)
Sebastian Jentsch