Breve análisis del Asus ZenBook UX310UQ (7500U, 940MX, Full HD)
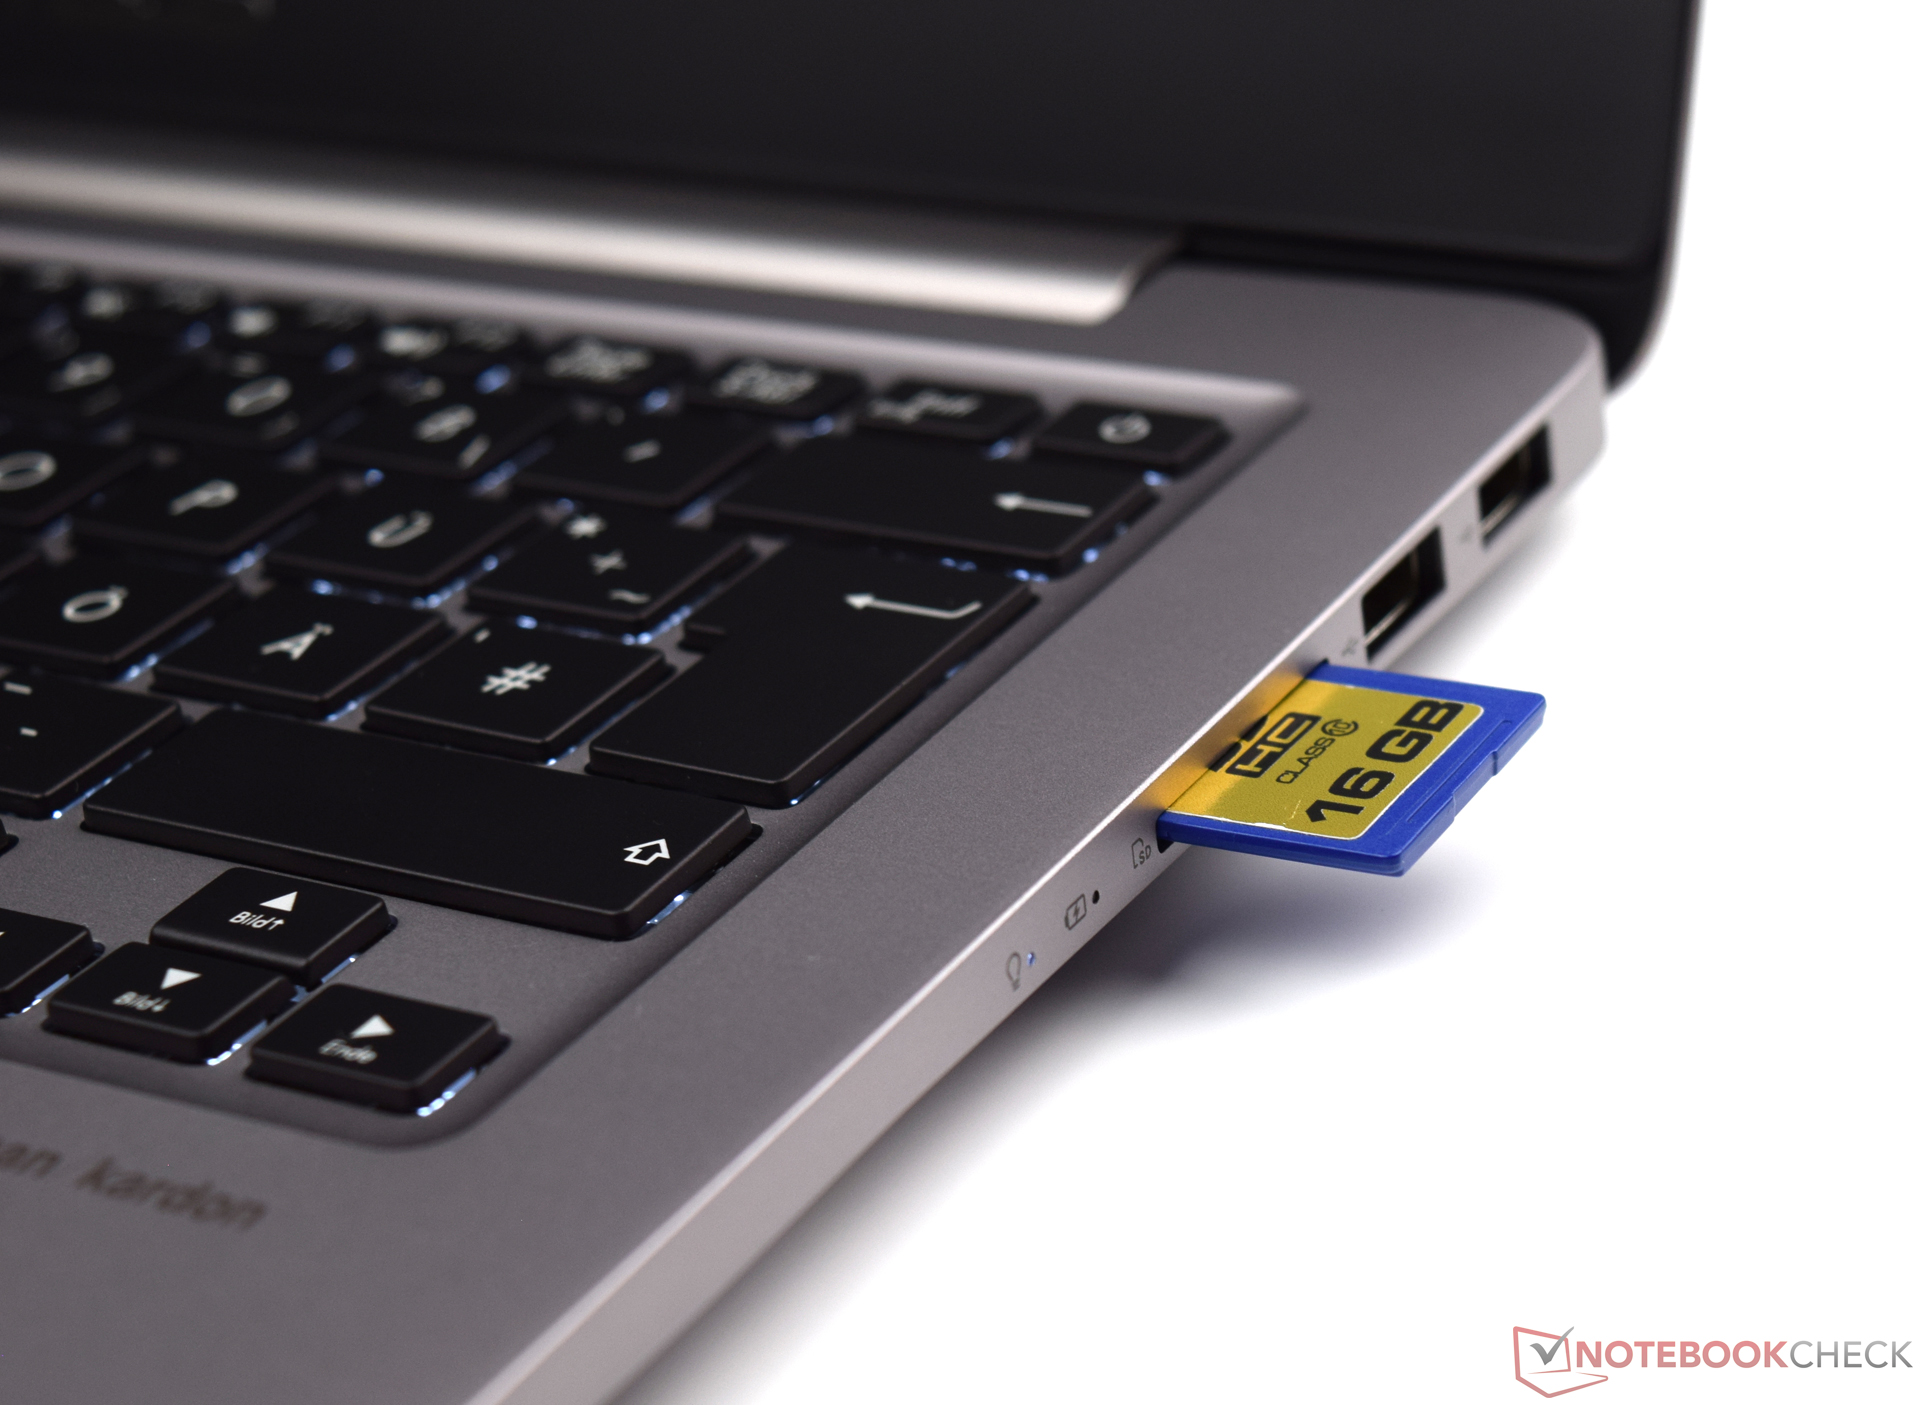
| SD Card Reader | |
| average JPG Copy Test (av. of 3 runs) | |
| Dell XPS 13 9360 FHD i5 | |
| Asus Zenbook UX310UQ-GL011T | |
| Asus UX310UQ-FC396T | |
| Asus Zenbook UX3410UA | |
| Asus Zenbook UX310UA-FC347T iGP | |
| maximum AS SSD Seq Read Test (1GB) | |
| Dell XPS 13 9360 FHD i5 | |
| Asus Zenbook UX310UQ-GL011T | |
| Asus Zenbook UX3410UA | |
| Asus UX310UQ-FC396T | |
| Asus Zenbook UX310UA-FC347T iGP | |
| Networking | |
| iperf3 transmit AX12 | |
| Asus Zenbook UX310UA-FC347T iGP (jseb) | |
| Asus UX310UQ-FC396T (jseb) | |
| Dell XPS 13 9360 FHD i5 | |
| Asus Zenbook UX3410UA | |
| iperf3 receive AX12 | |
| Dell XPS 13 9360 FHD i5 | |
| Asus UX310UQ-FC396T (jseb) | |
| Asus Zenbook UX310UA-FC347T iGP (jseb) | |
| Asus Zenbook UX3410UA | |
| |||||||||||||||||||||||||
iluminación: 92 %
Brillo con batería: 362 cd/m²
Contraste: 1293:1 (Negro: 0.28 cd/m²)
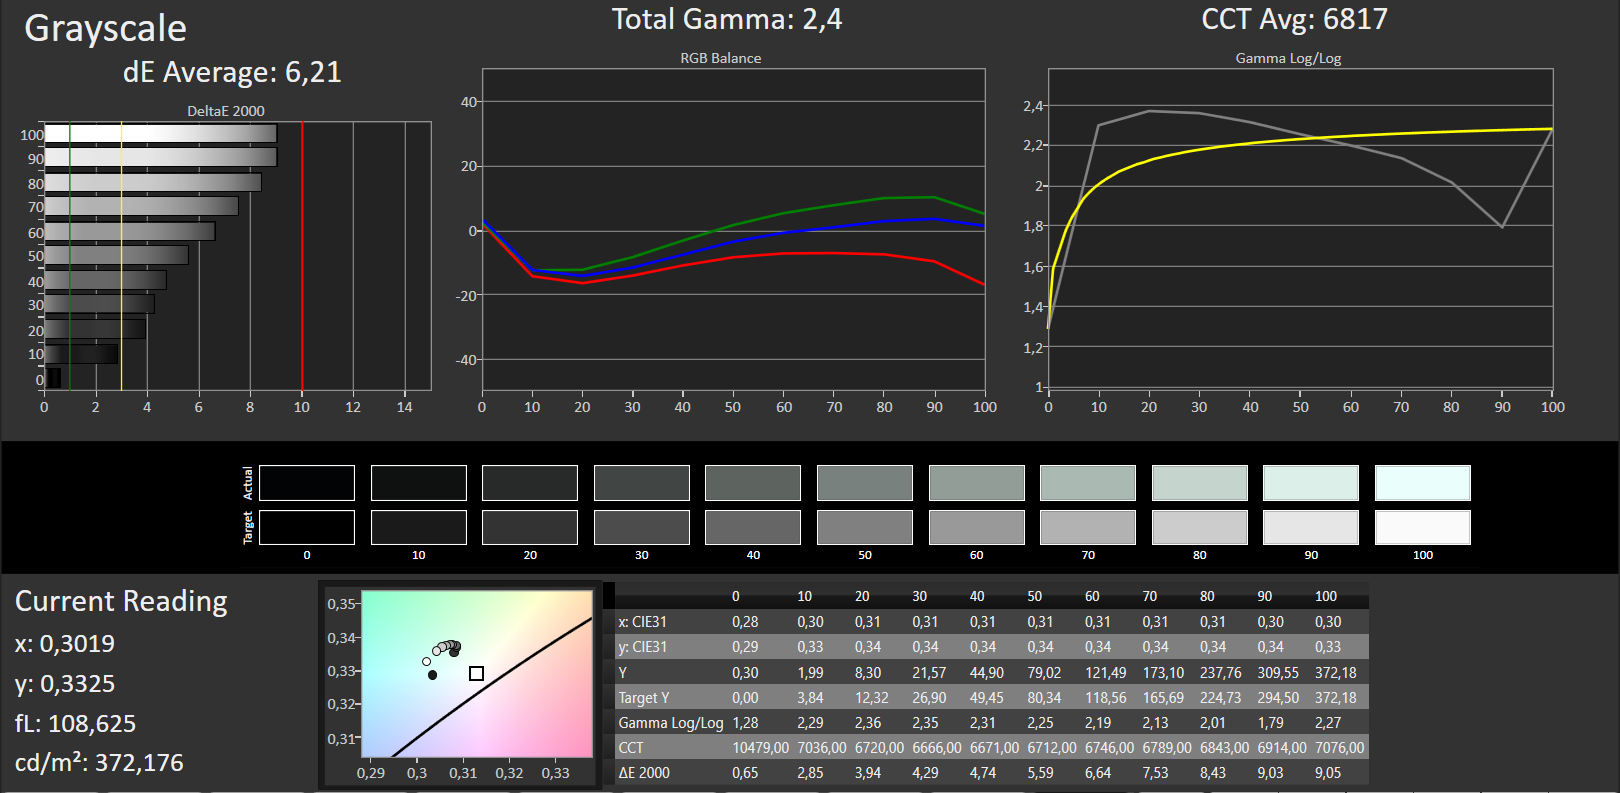
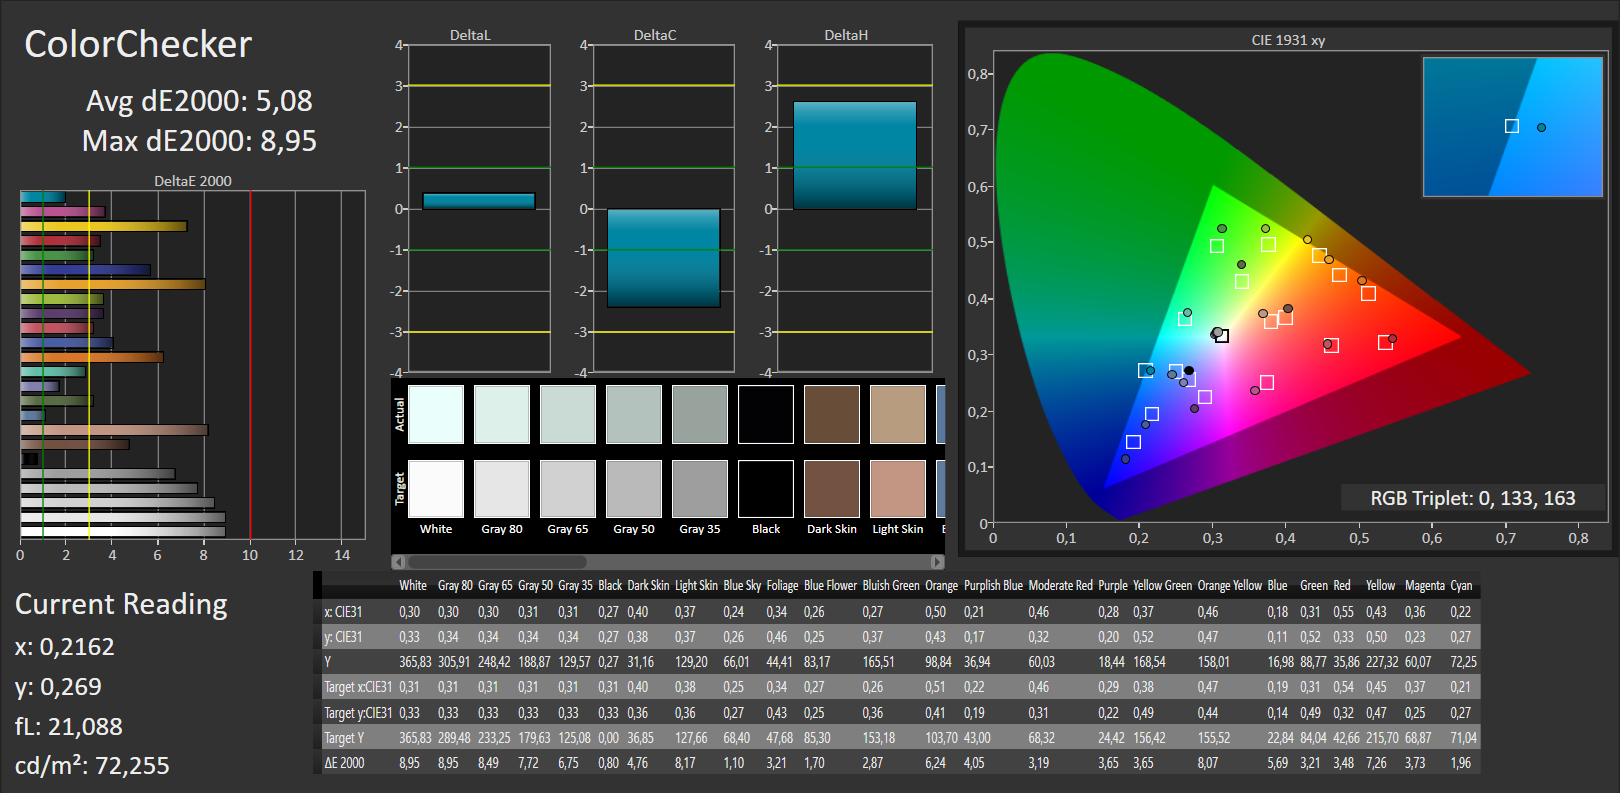
ΔE ColorChecker Calman: 5.08 | ∀{0.5-29.43 Ø4.73}
ΔE Greyscale Calman: 6.21 | ∀{0.09-98 Ø4.97}
92% sRGB (Argyll 1.6.3 3D)
60% AdobeRGB 1998 (Argyll 1.6.3 3D)
65.3% AdobeRGB 1998 (Argyll 3D)
92.2% sRGB (Argyll 3D)
64.1% Display P3 (Argyll 3D)
Gamma: 2.4
CCT: 6817 K
| Asus UX310UQ-FC396T AU Optronics AUO272D, 1920x1080, 13.3" | Asus Zenbook UX310UQ-GL011T AU Optronics AUO142D, 1920x1080, 13.3" | Asus Zenbook UX310UA-FC347T iGP AU Optronics AUO272D, 1920x1080, 13.3" | Asus Zenbook UX3410UA ChiMei N140HCE-EN1, 1920x1080, 14" | Acer Swift 7 SF713-51 Chimei Innolux, N133HCE-GP1, 1920x1080, 13.3" | Dell XPS 13 9360 FHD i5 Sharp SHP1449 LQ133M1, 1920x1080, 13.3" | |
|---|---|---|---|---|---|---|
| Display | -4% | -10% | 6% | -1% | -22% | |
| Display P3 Coverage (%) | 64.1 | 61.9 -3% | 64.2 0% | 67.7 6% | 64.6 1% | 48.94 -24% |
| sRGB Coverage (%) | 92.2 | 88.3 -4% | 65.3 -29% | 99.1 7% | 89.1 -3% | 73.3 -20% |
| AdobeRGB 1998 Coverage (%) | 65.3 | 63 -4% | 65.3 0% | 69.4 6% | 64.8 -1% | 50.5 -23% |
| Response Times | -20% | -17% | -34% | -15% | -32% | |
| Response Time Grey 50% / Grey 80% * (ms) | 31 ? | 39 ? -26% | 40 ? -29% | 33 ? -6% | 31 ? -0% | 32.8 ? -6% |
| Response Time Black / White * (ms) | 21 ? | 24 ? -14% | 22 ? -5% | 34 ? -62% | 27 ? -29% | 33.2 ? -58% |
| PWM Frequency (Hz) | 192 ? | 50 ? | 200 ? | |||
| Screen | -16% | -1% | 8% | 4% | -3% | |
| Brightness middle (cd/m²) | 362 | 247 -32% | 358 -1% | 376 4% | 359 -1% | 351.2 -3% |
| Brightness (cd/m²) | 343 | 240 -30% | 347 1% | 355 3% | 344 0% | 325 -5% |
| Brightness Distribution (%) | 92 | 90 -2% | 87 -5% | 87 -5% | 92 0% | 89 -3% |
| Black Level * (cd/m²) | 0.28 | 0.43 -54% | 0.26 7% | 0.32 -14% | 0.25 11% | 0.195 30% |
| Contrast (:1) | 1293 | 574 -56% | 1377 6% | 1175 -9% | 1436 11% | 1801 39% |
| Colorchecker dE 2000 * | 5.08 | 4.74 7% | 5.22 -3% | 3.2 37% | 4.57 10% | 7.4 -46% |
| Colorchecker dE 2000 max. * | 8.95 | 9.14 -2% | 9.19 -3% | 7.1 21% | 9.25 -3% | 9.08 -1% |
| Greyscale dE 2000 * | 6.21 | 4.87 22% | 6.69 -8% | 4.4 29% | 5.2 16% | 6.71 -8% |
| Gamma | 2.4 92% | 2.57 86% | 2.35 94% | 2.12 104% | 2.47 89% | 2.74 80% |
| CCT | 6817 95% | 7450 87% | 6745 96% | 7440 87% | 6887 94% | 7222 90% |
| Color Space (Percent of AdobeRGB 1998) (%) | 60 | 57 -5% | 59 -2% | 63.78 6% | 58 -3% | 50.48 -16% |
| Color Space (Percent of sRGB) (%) | 92 | 88 -4% | 91 -1% | 98.98 8% | 89 -3% | 73.31 -20% |
| Media total (Programa/Opciones) | -13% /
-14% | -9% /
-5% | -7% /
2% | -4% /
0% | -19% /
-11% |
* ... más pequeño es mejor
Tiempos de respuesta del display
| ↔ Tiempo de respuesta de Negro a Blanco | ||
|---|---|---|
| 21 ms ... subida ↗ y bajada ↘ combinada | ↗ 4 ms subida | 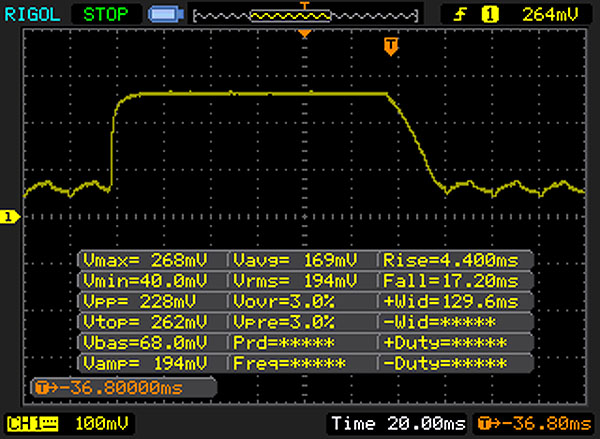 |
| ↘ 17 ms bajada | ||
| La pantalla mostró buenos tiempos de respuesta en nuestros tests pero podría ser demasiado lenta para los jugones competitivos. En comparación, todos los dispositivos de prueba van de ##min### (mínimo) a 240 (máximo) ms. » 47 % de todos los dispositivos son mejores. Eso quiere decir que el tiempo de respuesta es similar al dispositivo testado medio (19.9 ms). | ||
| ↔ Tiempo de respuesta 50% Gris a 80% Gris | ||
| 31 ms ... subida ↗ y bajada ↘ combinada | ↗ 12 ms subida | 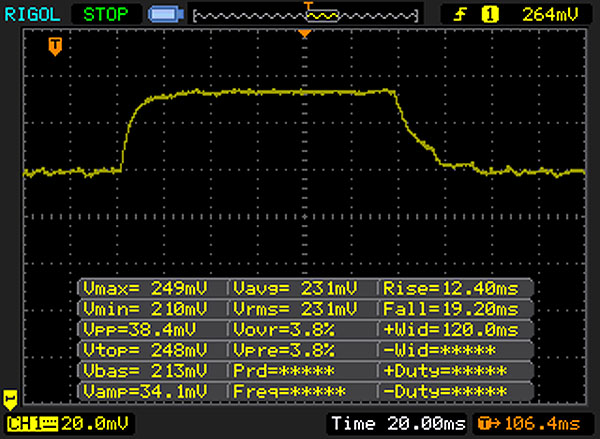 |
| ↘ 19 ms bajada | ||
| La pantalla mostró tiempos de respuesta lentos en nuestros tests y podría ser demasiado lenta para los jugones. En comparación, todos los dispositivos de prueba van de ##min### (mínimo) a 636 (máximo) ms. » 42 % de todos los dispositivos son mejores. Eso quiere decir que el tiempo de respuesta es similar al dispositivo testado medio (31.1 ms). | ||
Parpadeo de Pantalla / PWM (Pulse-Width Modulation)
| Parpadeo de Pantalla / PWM detectado | 192 Hz | ≤ 10 % de brillo | 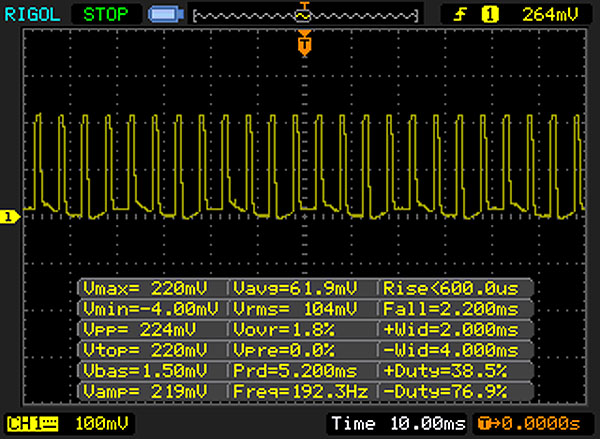 |
La retroiluminación del display parpadea a 192 Hz (seguramente usa PWM - Pulse-Width Modulation) a un brillo del 10 % e inferior. Sobre este nivel de brillo no debería darse parpadeo / PWM. La frecuencia de 192 Hz es relativamente baja, por lo que la gente sensible debería ver parpadeos y padecer fatiga visual por la pantalla (usado al brillo indicado a continuación). Comparación: 52 % de todos los dispositivos testados no usaron PWM para atenuar el display. Si se usó, medimos una media de 7798 (mínimo: 5 - máxmo: 343500) Hz. | |||
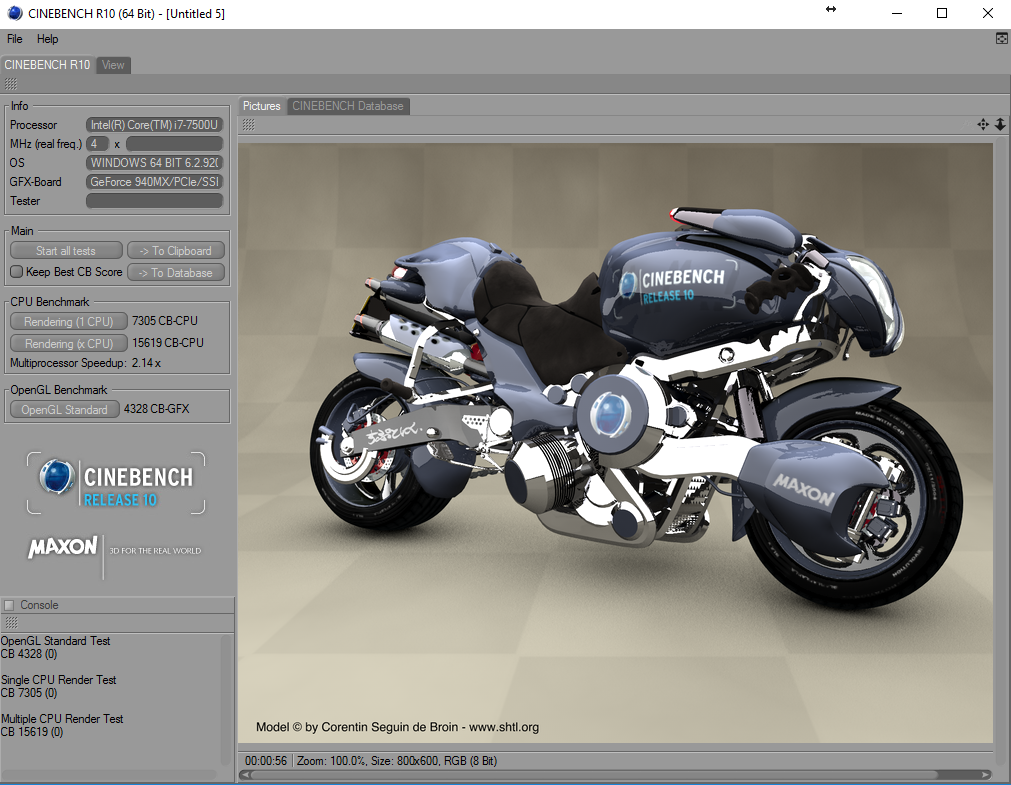
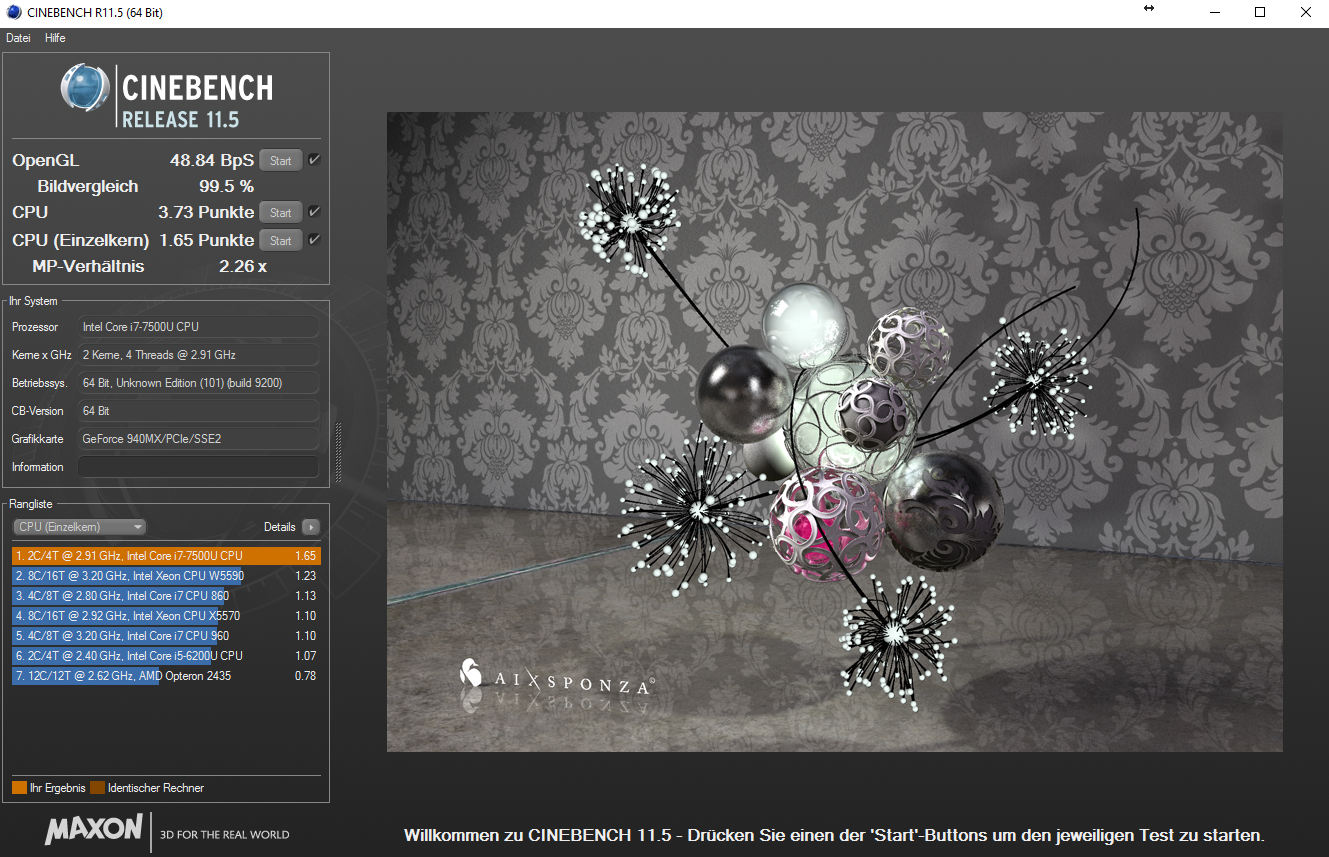
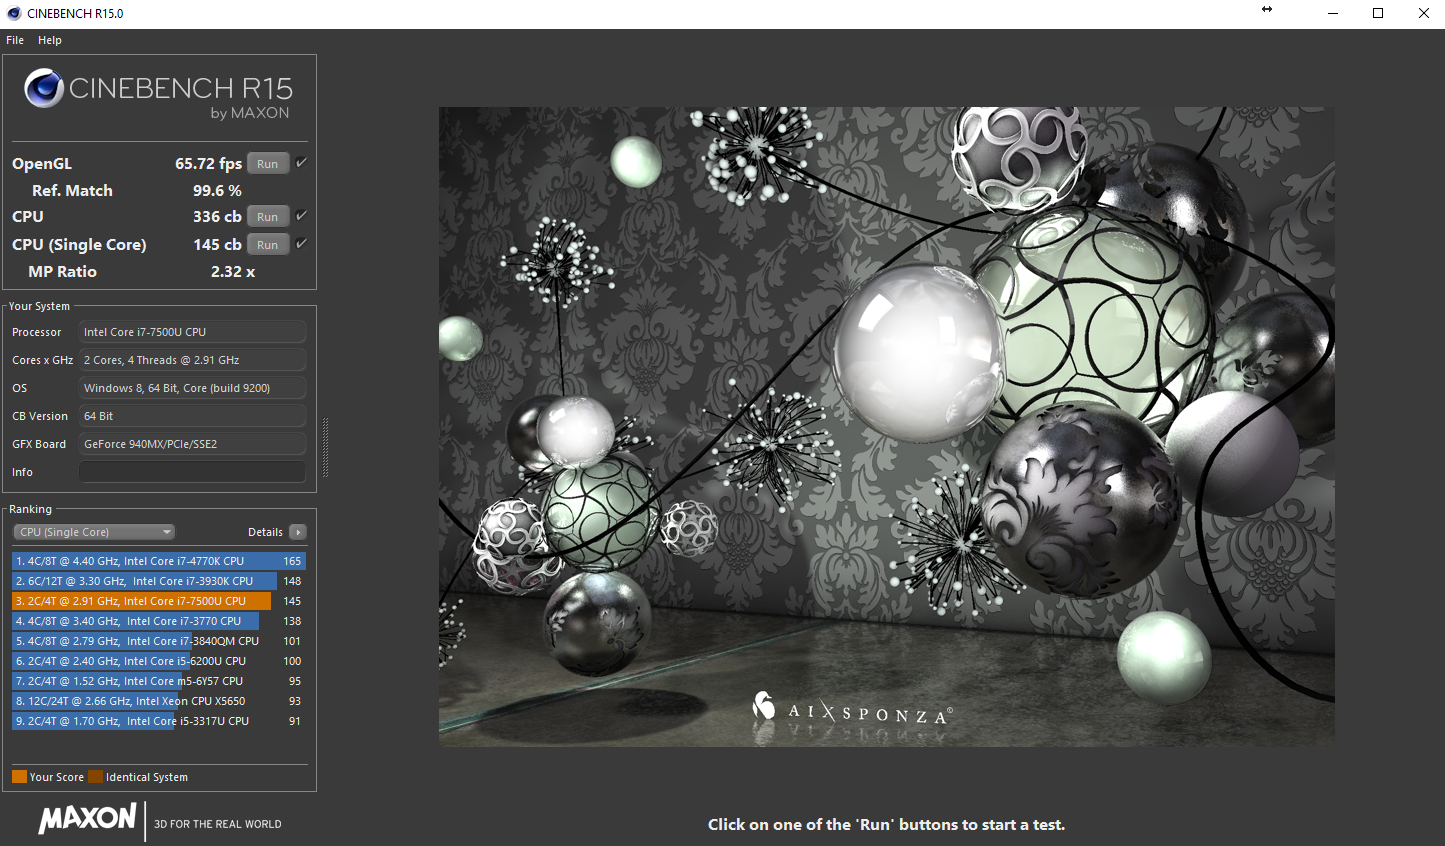
| Cinebench R10 | |
| Rendering Single CPUs 64Bit | |
| Asus UX310UQ-FC396T | |
| Asus Zenbook UX310UA-FC347T iGP | |
| Asus Zenbook UX310UQ-GL011T | |
| Acer Swift 7 SF713-51 | |
| Rendering Multiple CPUs 64Bit | |
| Asus Zenbook UX310UA-FC347T iGP | |
| Asus UX310UQ-FC396T | |
| Asus Zenbook UX310UQ-GL011T | |
| Acer Swift 7 SF713-51 | |
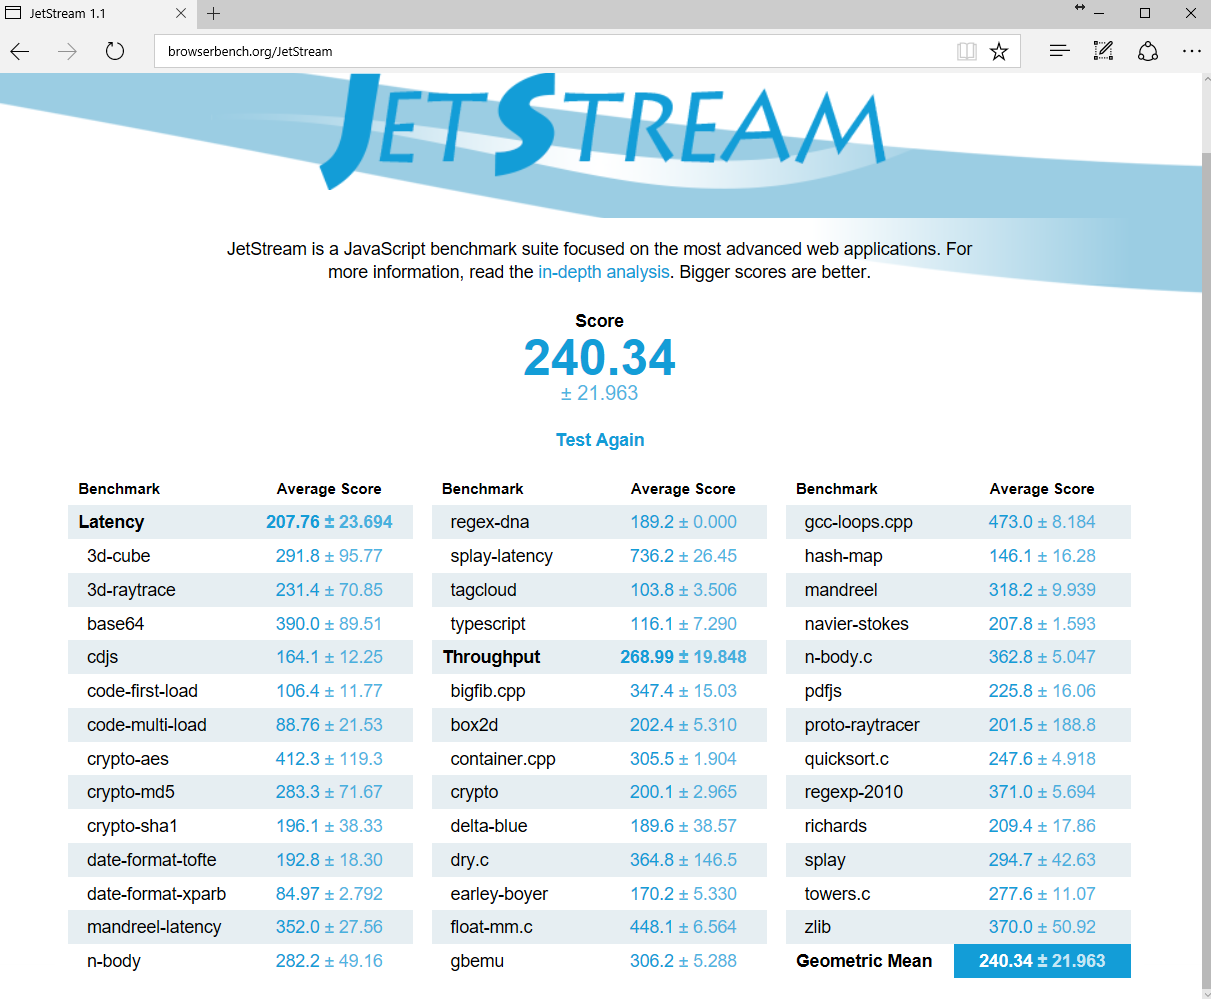
| JetStream 1.1 - 1.1 Total | |
| Asus UX310UQ-FC396T | |
| Asus Zenbook UX310UA-FC347T iGP | |
| Asus Zenbook UX310UQ-GL011T | |
| Asus Zenbook UX3410UA | |
| Acer Swift 7 SF713-51 | |
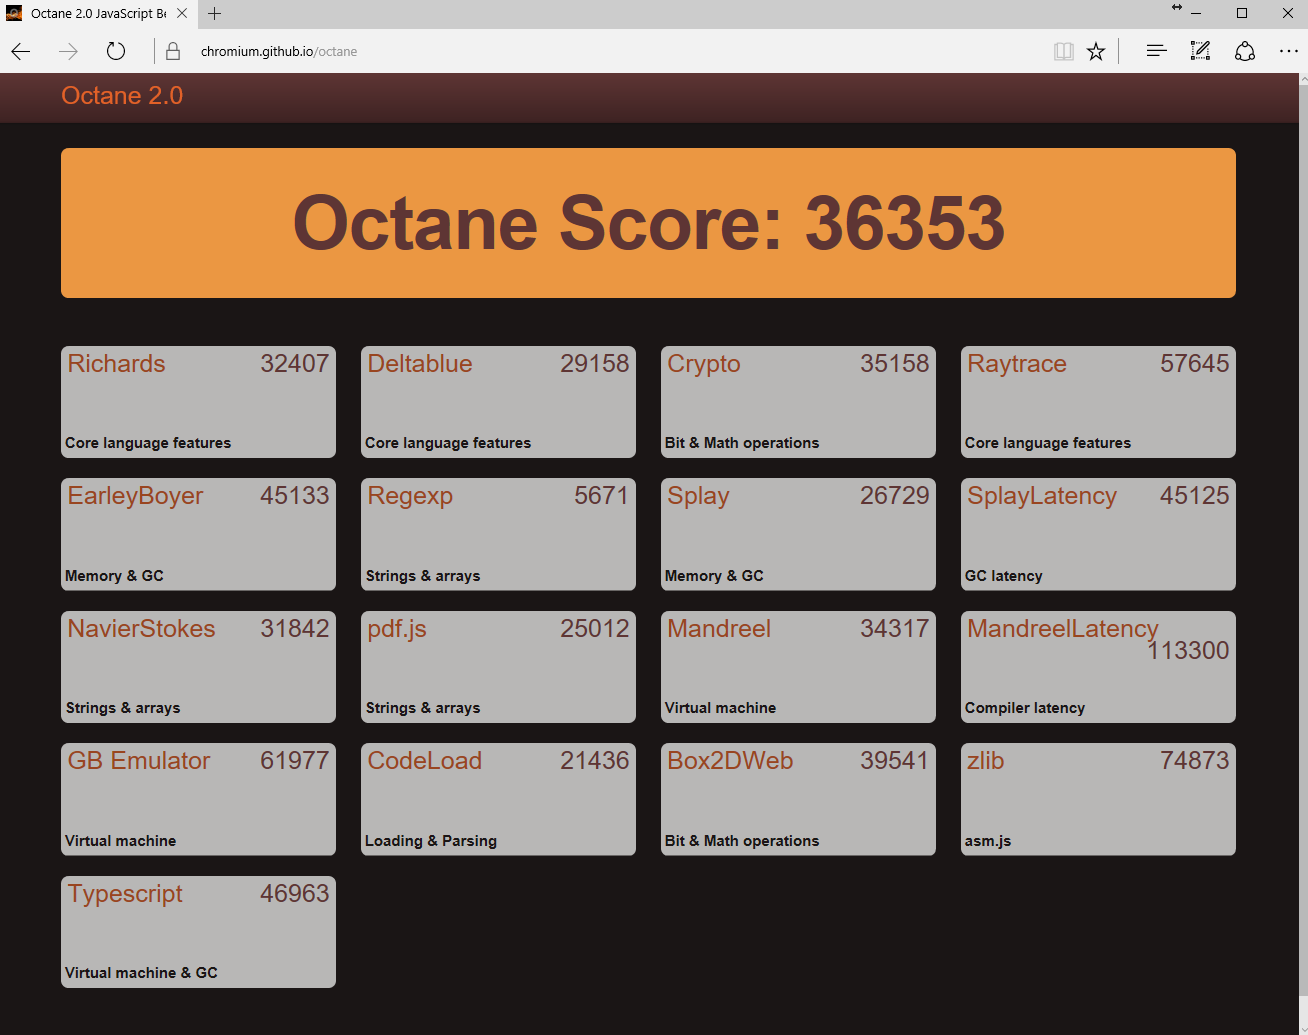
| Octane V2 - Total Score | |
| Asus UX310UQ-FC396T | |
| Asus Zenbook UX310UA-FC347T iGP | |
| Dell XPS 13 9360 FHD i5 | |
| Asus Zenbook UX3410UA | |
| Asus Zenbook UX310UQ-GL011T | |
| Acer Swift 7 SF713-51 | |
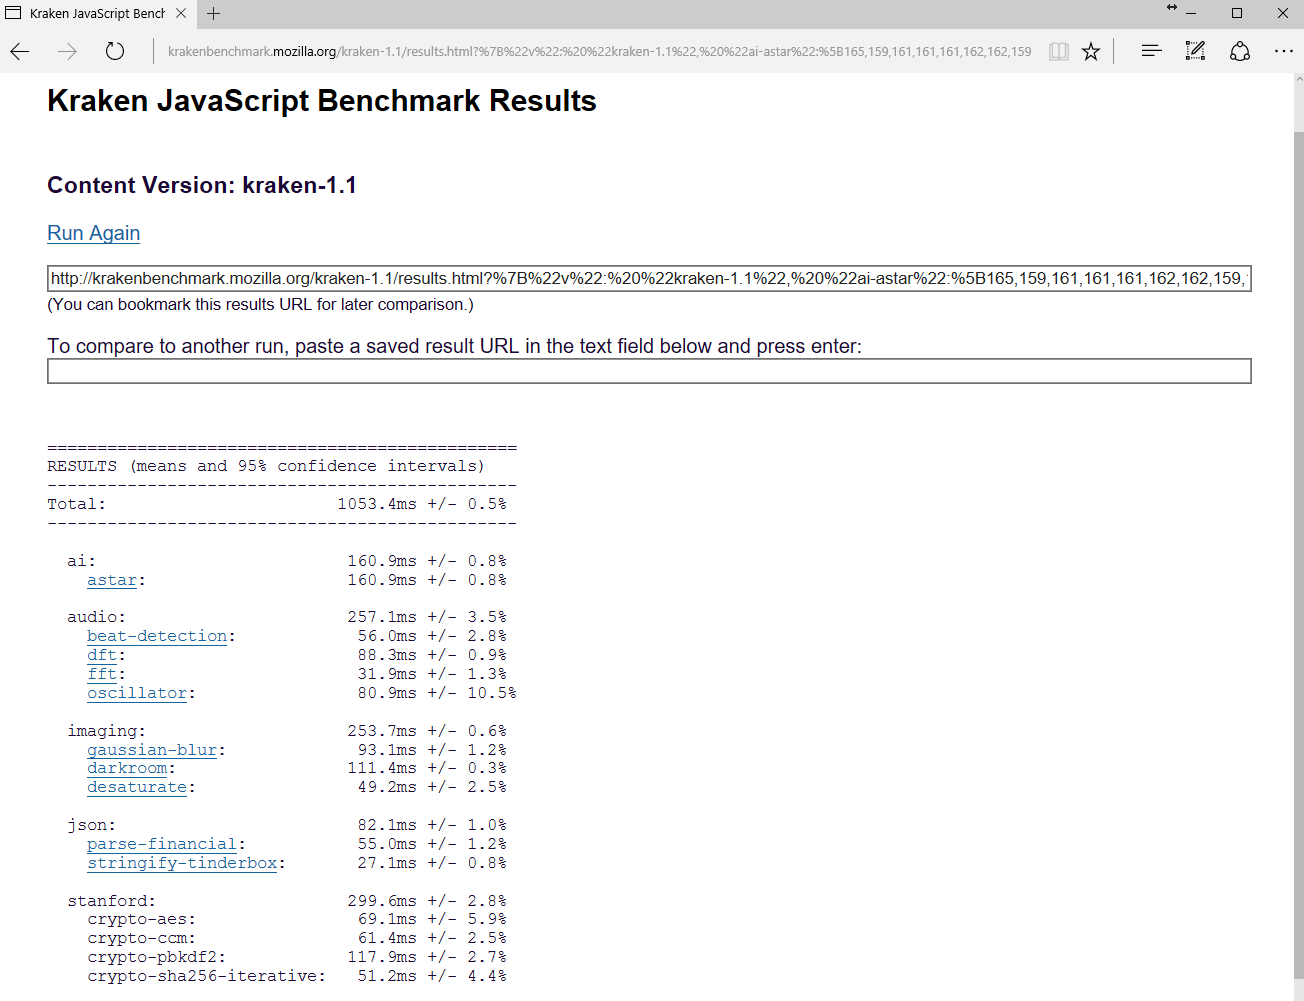
| Mozilla Kraken 1.1 - Total | |
| Acer Swift 7 SF713-51 | |
| Asus Zenbook UX310UQ-GL011T | |
| Asus Zenbook UX3410UA | |
| Asus Zenbook UX310UA-FC347T iGP | |
| Asus UX310UQ-FC396T | |
* ... más pequeño es mejor
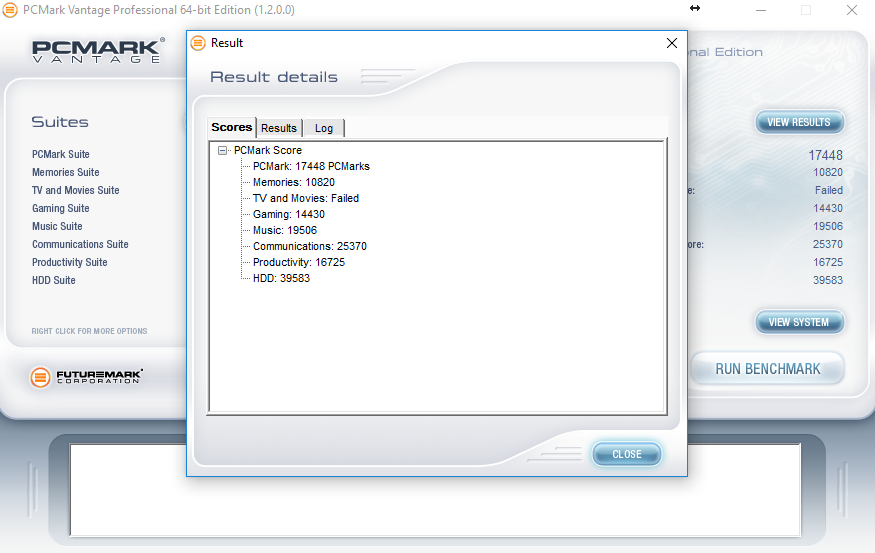
| PCMark Vantage Result | 17448 puntos | |
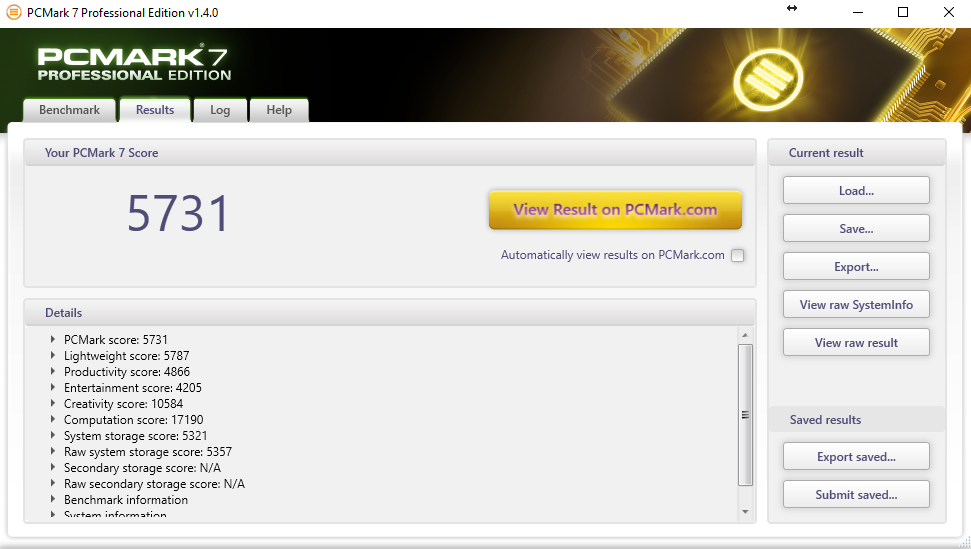
| PCMark 7 Score | 5731 puntos | |
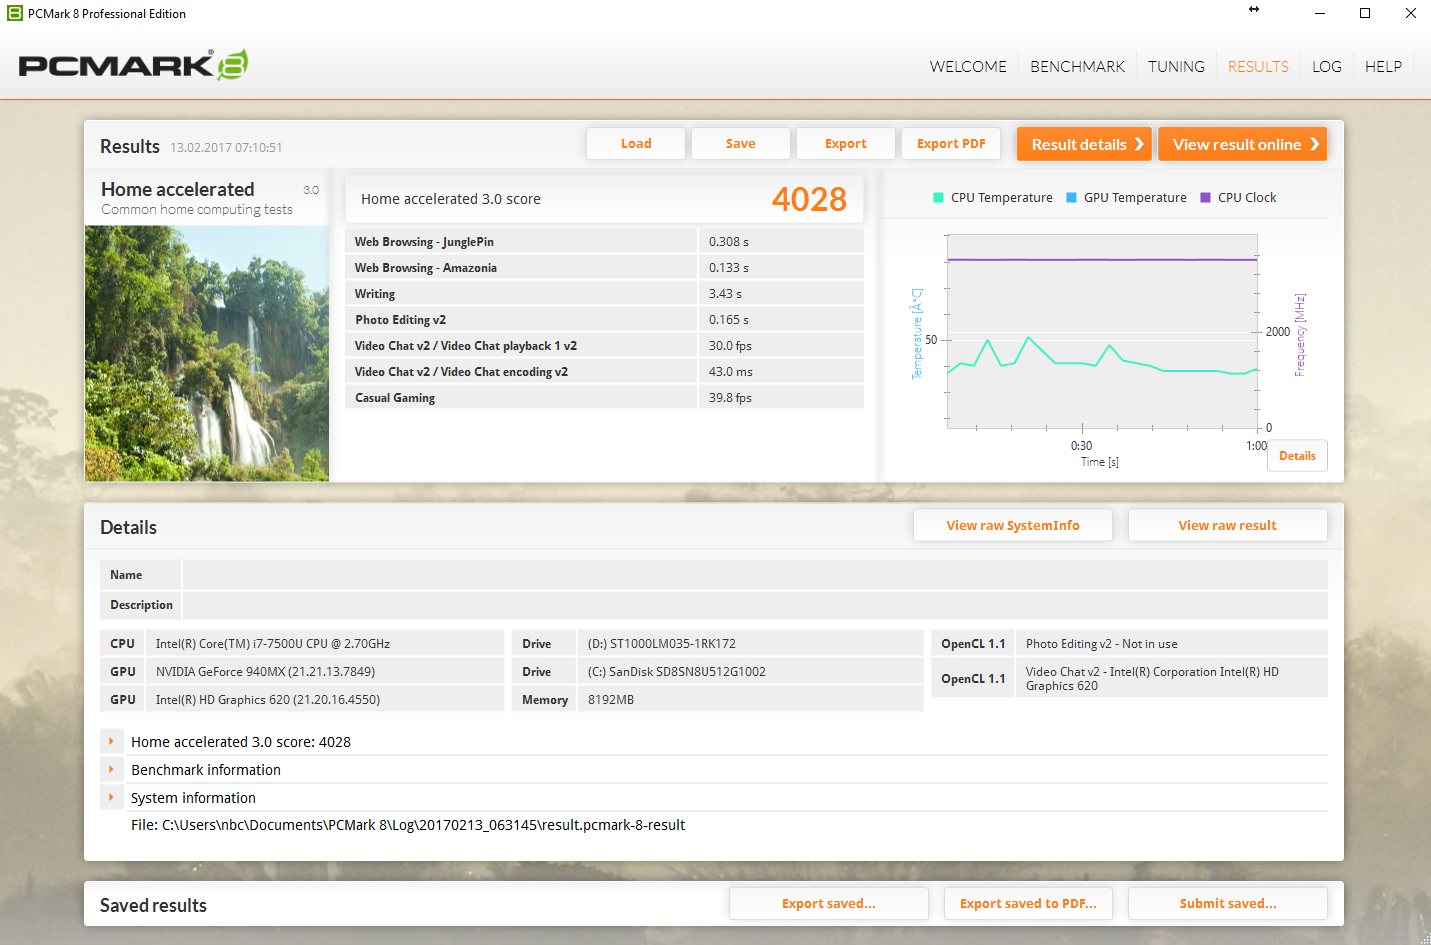
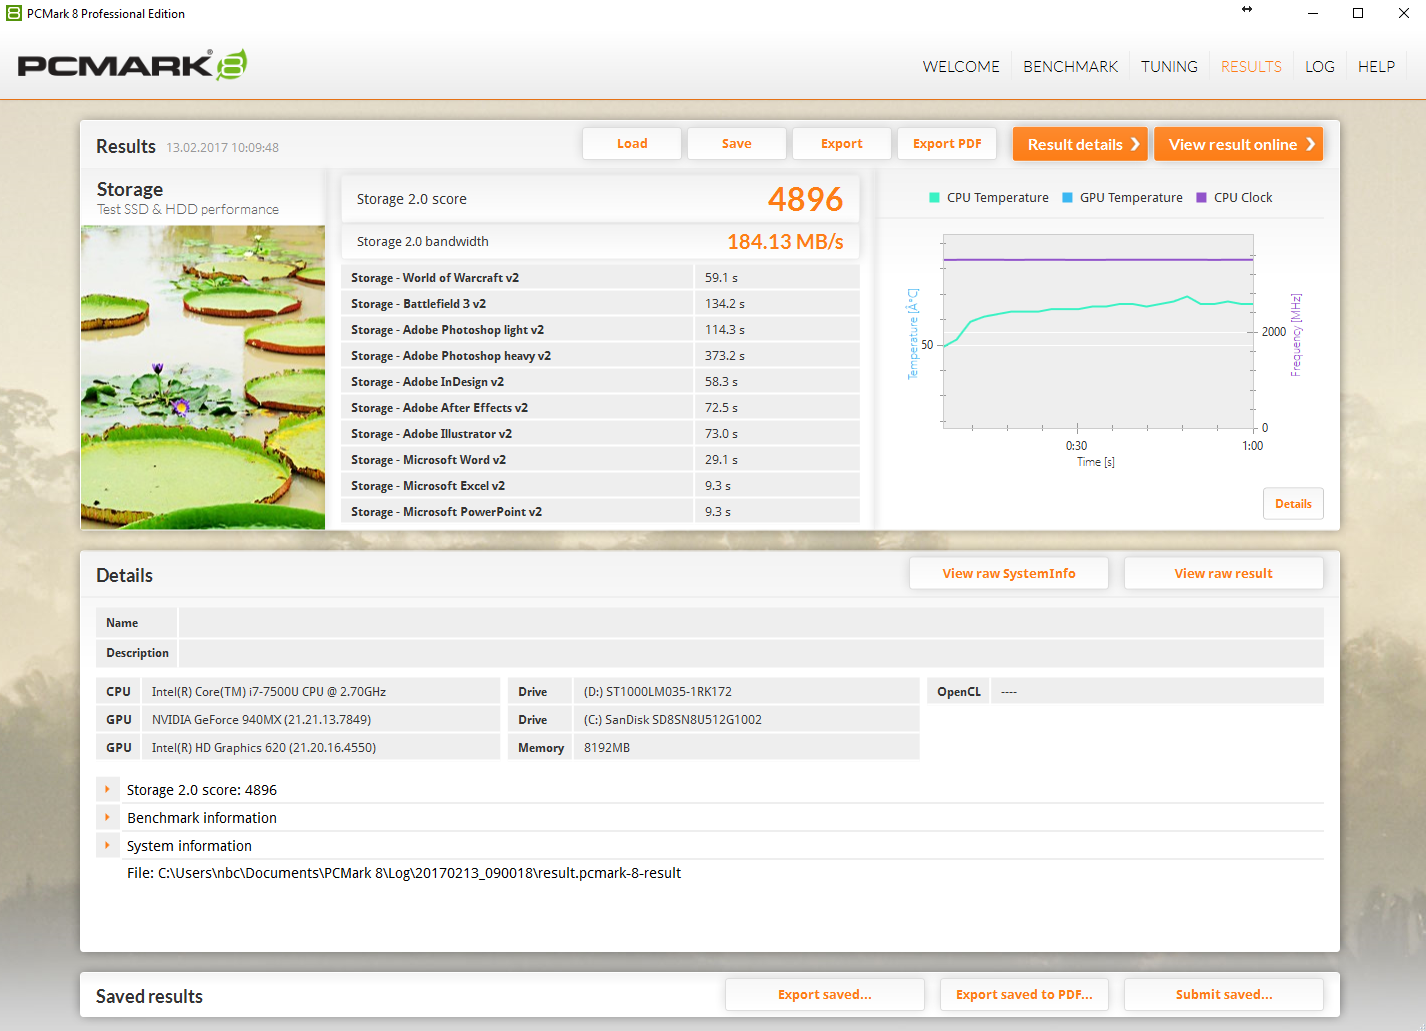
| PCMark 8 Home Score Accelerated v2 | 4028 puntos | |
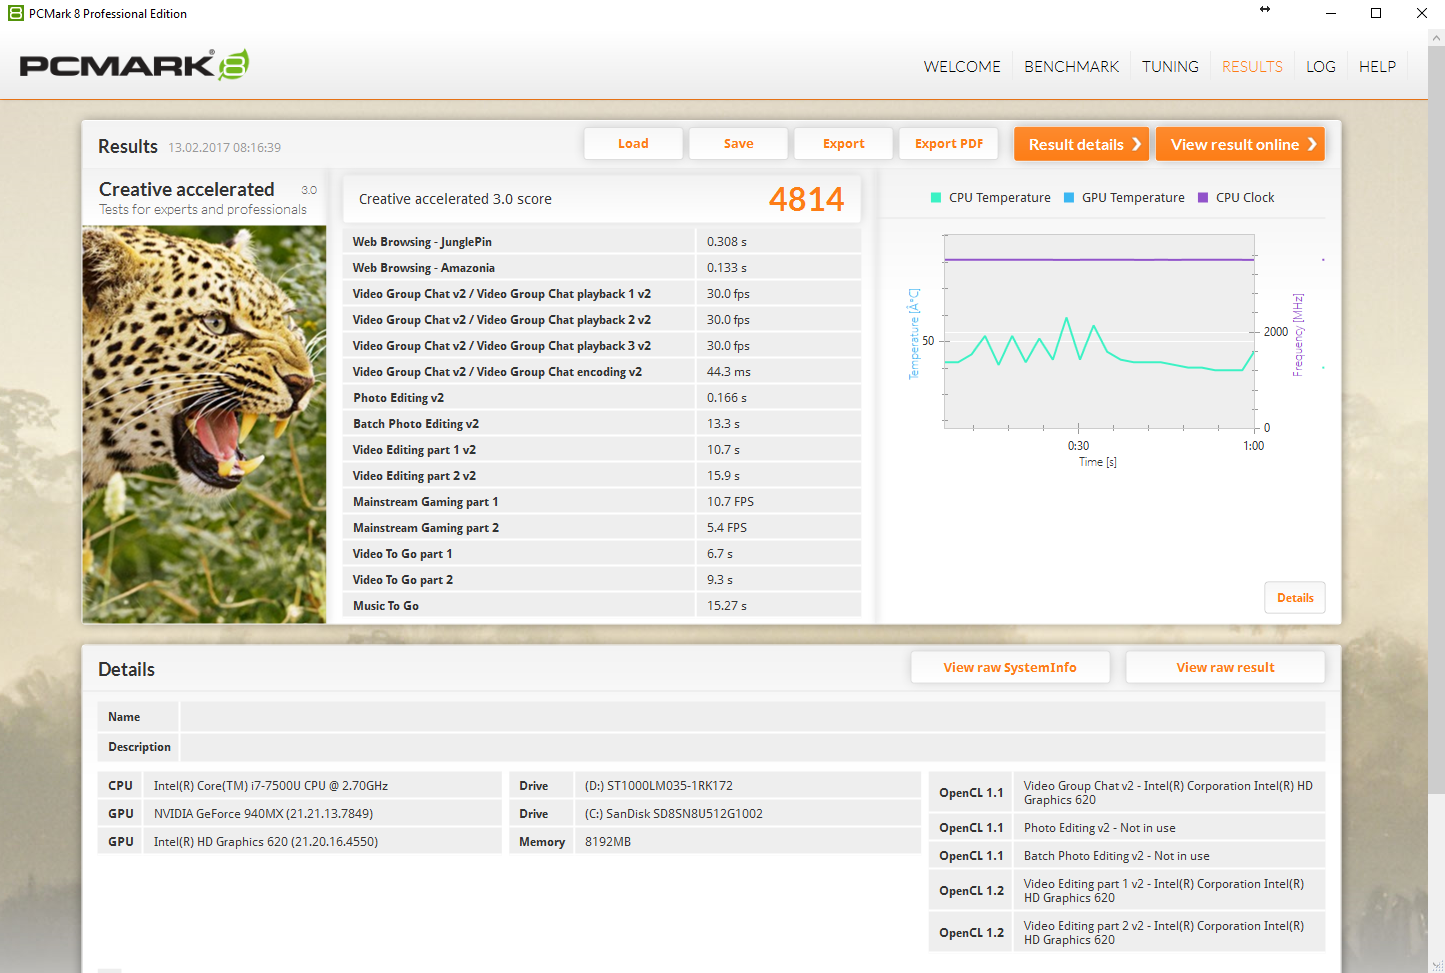
| PCMark 8 Creative Score Accelerated v2 | 4814 puntos | |
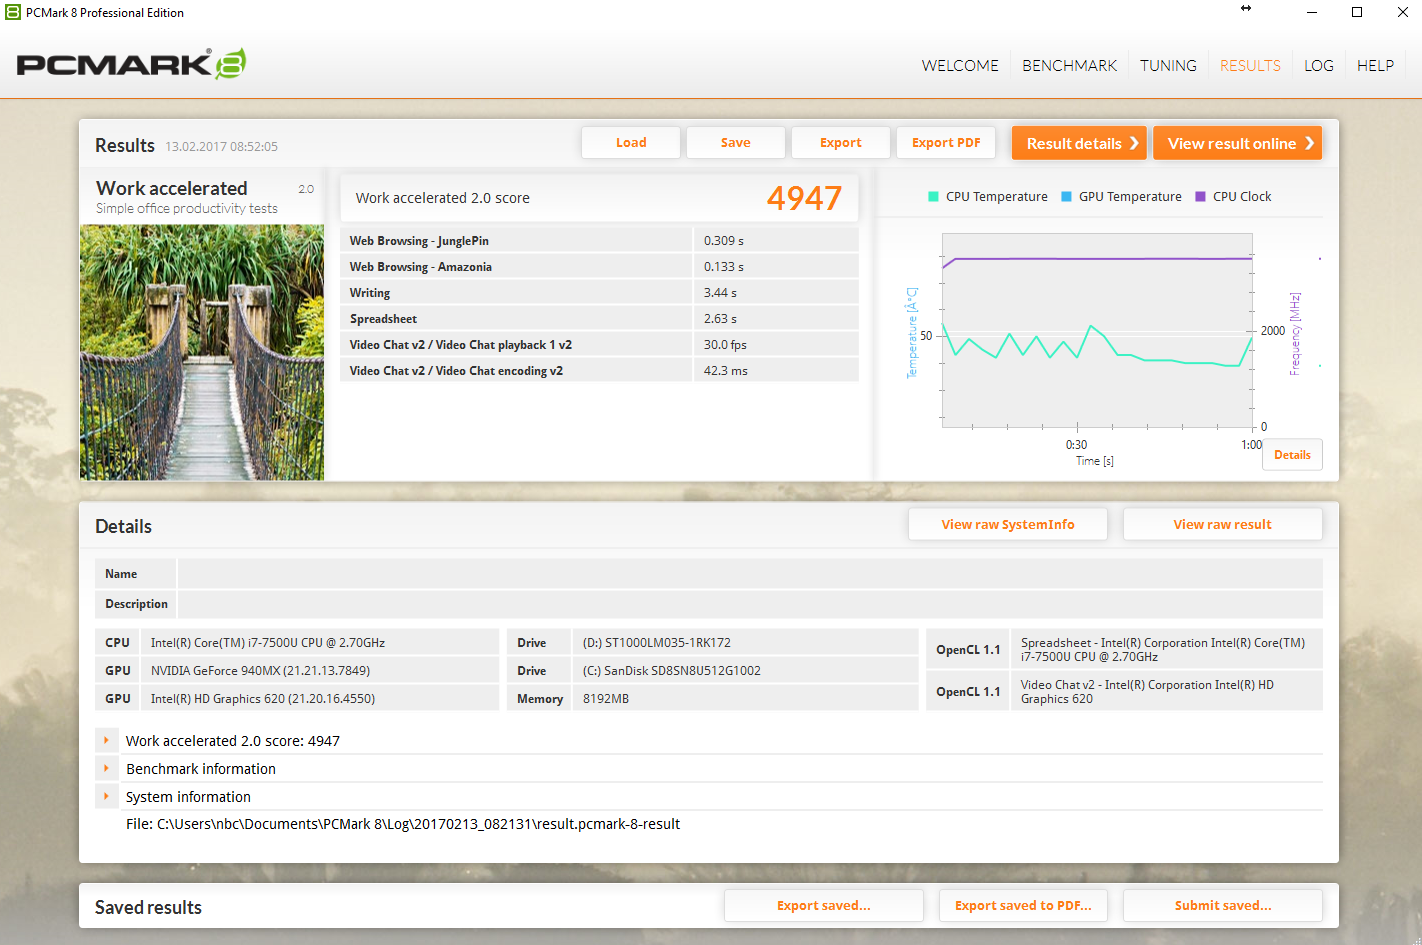
| PCMark 8 Work Score Accelerated v2 | 4947 puntos | |
ayuda | ||
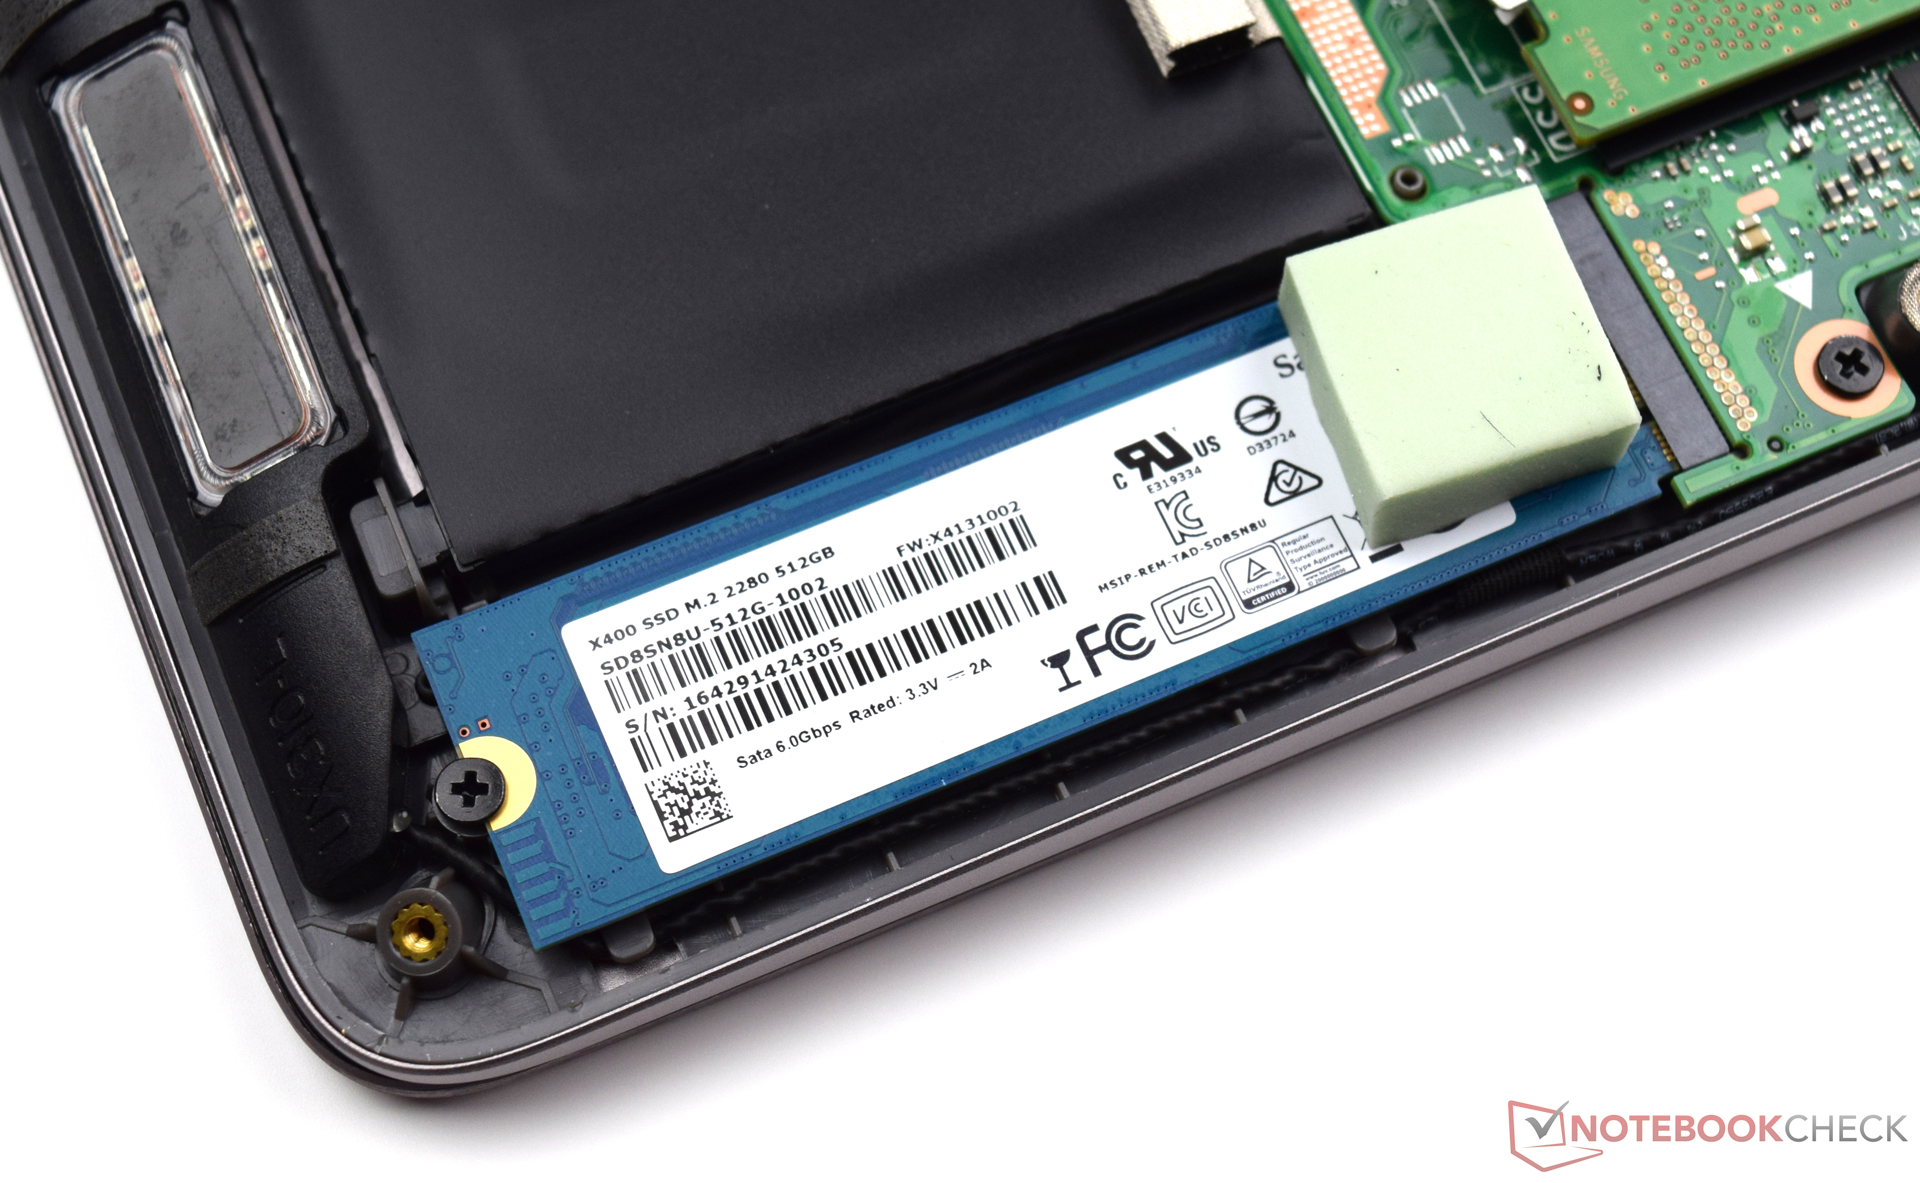
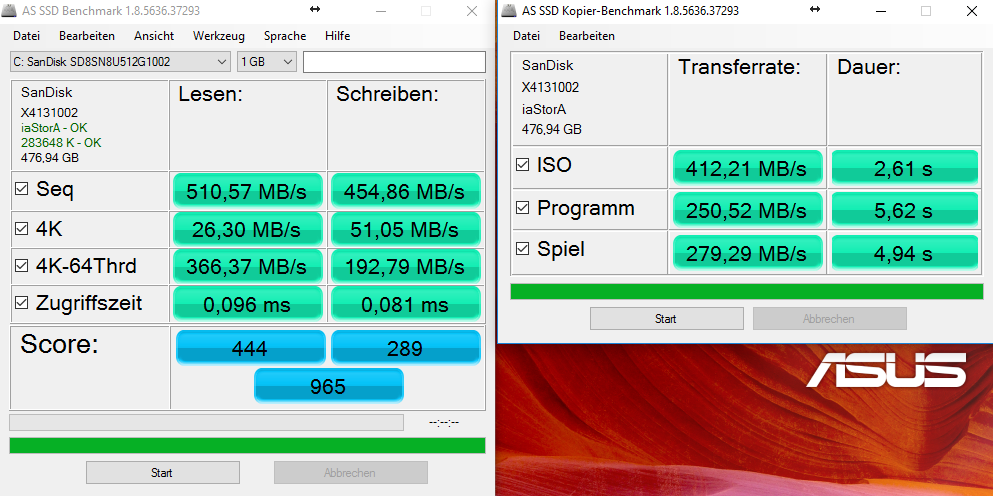
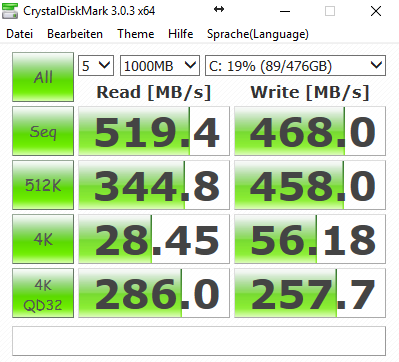
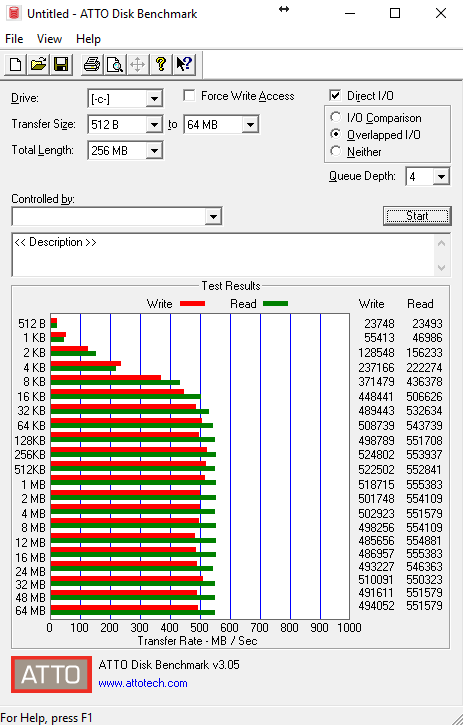
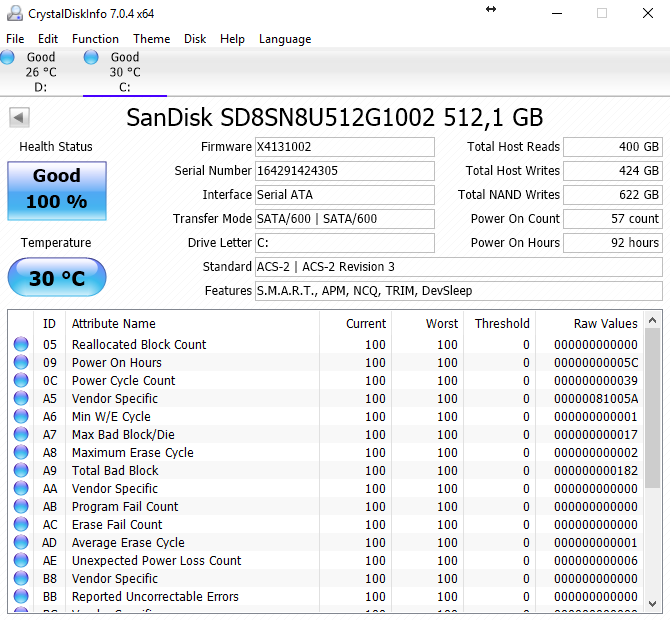

| Asus UX310UQ-FC396T SanDisk SD8SN8U512G1002 | Asus Zenbook UX310UQ-GL011T SanDisk SD8SNAT256G1002 | Asus Zenbook UX310UA-FC347T iGP Micron SSD 1100 (MTFDDAV256TBN) | Asus Zenbook UX3410UA SanDisk SD8SN8U512G1002 | Acer Swift 7 SF713-51 Kingston RBU-SNS4180S3256GG | Dell XPS 13 9360 FHD i5 Toshiba NVMe THNSN5256GPUK | |
|---|---|---|---|---|---|---|
| CrystalDiskMark 3.0 | -19% | 1% | -0% | 3% | 69% | |
| Read Seq (MB/s) | 519 | 468.1 -10% | 489.4 -6% | 494.5 -5% | 431.2 -17% | 1233 138% |
| Write Seq (MB/s) | 468 | 319.2 -32% | 431.6 -8% | 461.7 -1% | 401 -14% | 733 57% |
| Read 512 (MB/s) | 344.8 | 318.6 -8% | 356.7 3% | 328 -5% | 283.7 -18% | 1036 200% |
| Write 512 (MB/s) | 458 | 272.8 -40% | 389.1 -15% | 419.7 -8% | 313.6 -32% | 439.9 -4% |
| Read 4k (MB/s) | 28.45 | 22.03 -23% | 26.68 -6% | 27.53 -3% | 36.62 29% | 29.31 3% |
| Write 4k (MB/s) | 56.2 | 72.1 28% | 88.7 58% | 56.5 1% | 76.1 35% | 116.9 108% |
| Read 4k QD32 (MB/s) | 286 | 147.4 -48% | 246.3 -14% | 351 23% | 329.4 15% | 479.2 68% |
| Write 4k QD32 (MB/s) | 257.7 | 200.2 -22% | 251.5 -2% | 249.3 -3% | 325.6 26% | 218.3 -15% |

| 3DMark | |
| 1280x720 Cloud Gate Standard Graphics | |
| Asus Zenbook UX310UA-FC347T iGP | |
| Asus Zenbook UX3410UA | |
| Asus UX310UQ-FC396T | |
| Asus Zenbook UX310UQ-GL011T | |
| Dell XPS 13 9360 FHD i5 | |
| Acer Swift 7 SF713-51 | |
| 1920x1080 Fire Strike Graphics | |
| Asus Zenbook UX310UQ-GL011T | |
| Asus UX310UQ-FC396T | |
| Asus Zenbook UX310UA-FC347T iGP | |
| Asus Zenbook UX3410UA | |
| Dell XPS 13 9360 FHD i5 | |
| Acer Swift 7 SF713-51 | |
| 3DMark 11 - 1280x720 Performance GPU | |
| Asus Zenbook UX310UQ-GL011T | |
| Asus UX310UQ-FC396T | |
| Asus Zenbook UX3410UA | |
| Asus Zenbook UX310UA-FC347T iGP | |
| Dell XPS 13 9360 FHD i5 | |
| Acer Swift 7 SF713-51 | |
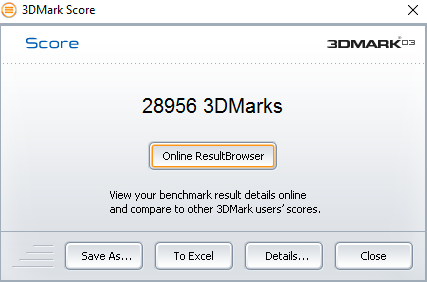
| 3DMark 03 Standard | 28956 puntos | |
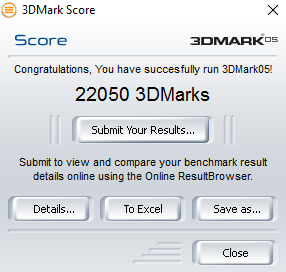
| 3DMark 05 Standard | 22050 puntos | |
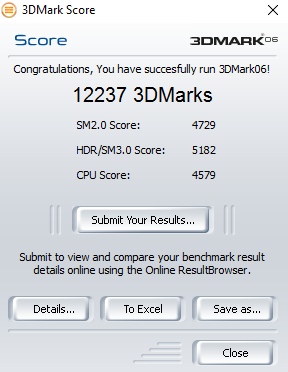
| 3DMark 06 Standard Score | 12237 puntos | |
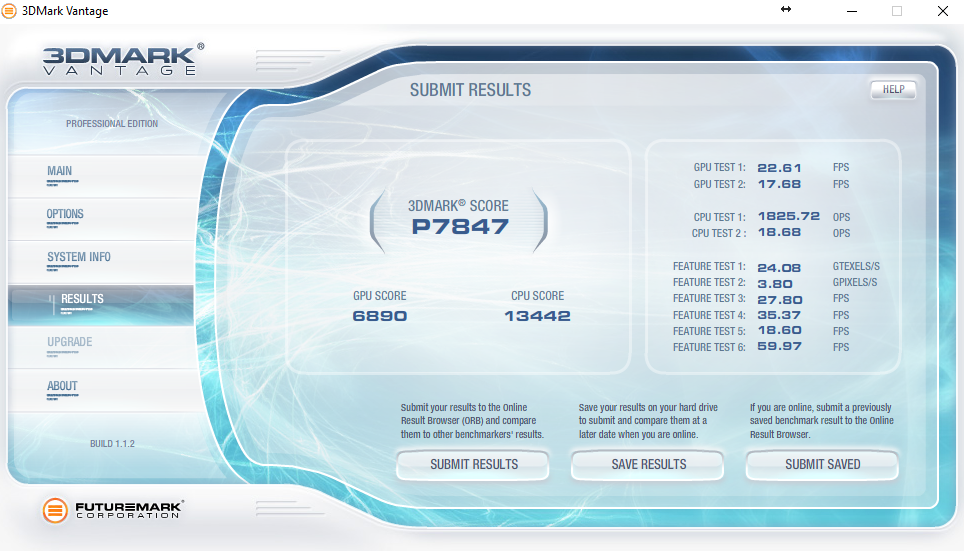
| 3DMark Vantage P Result | 7847 puntos | |
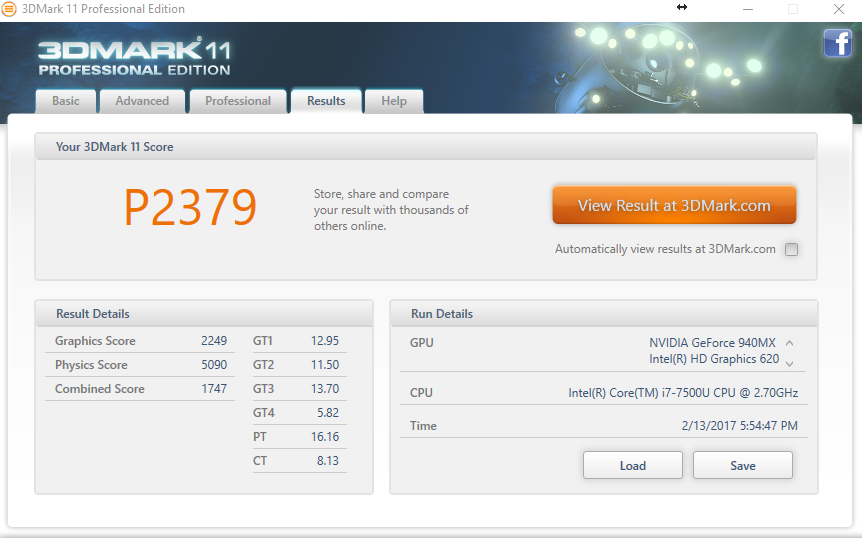
| 3DMark 11 Performance | 2379 puntos | |
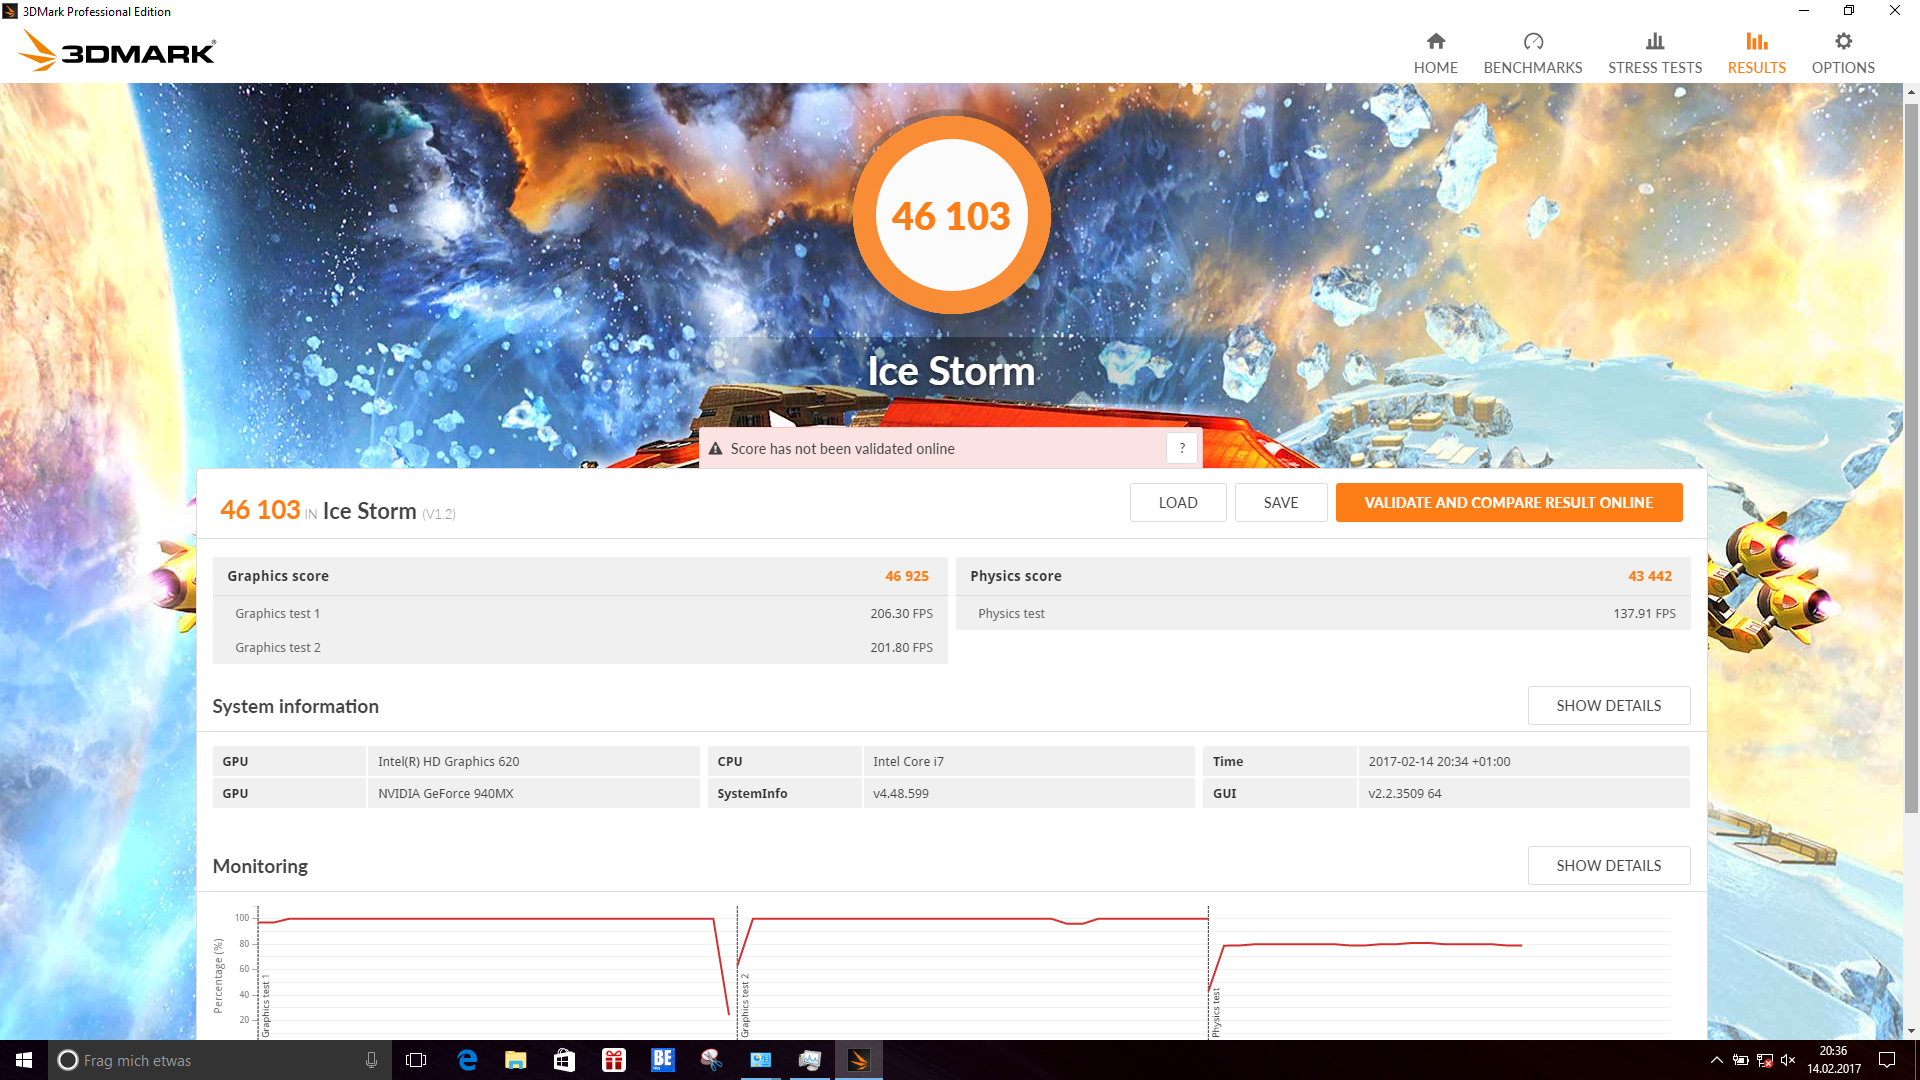
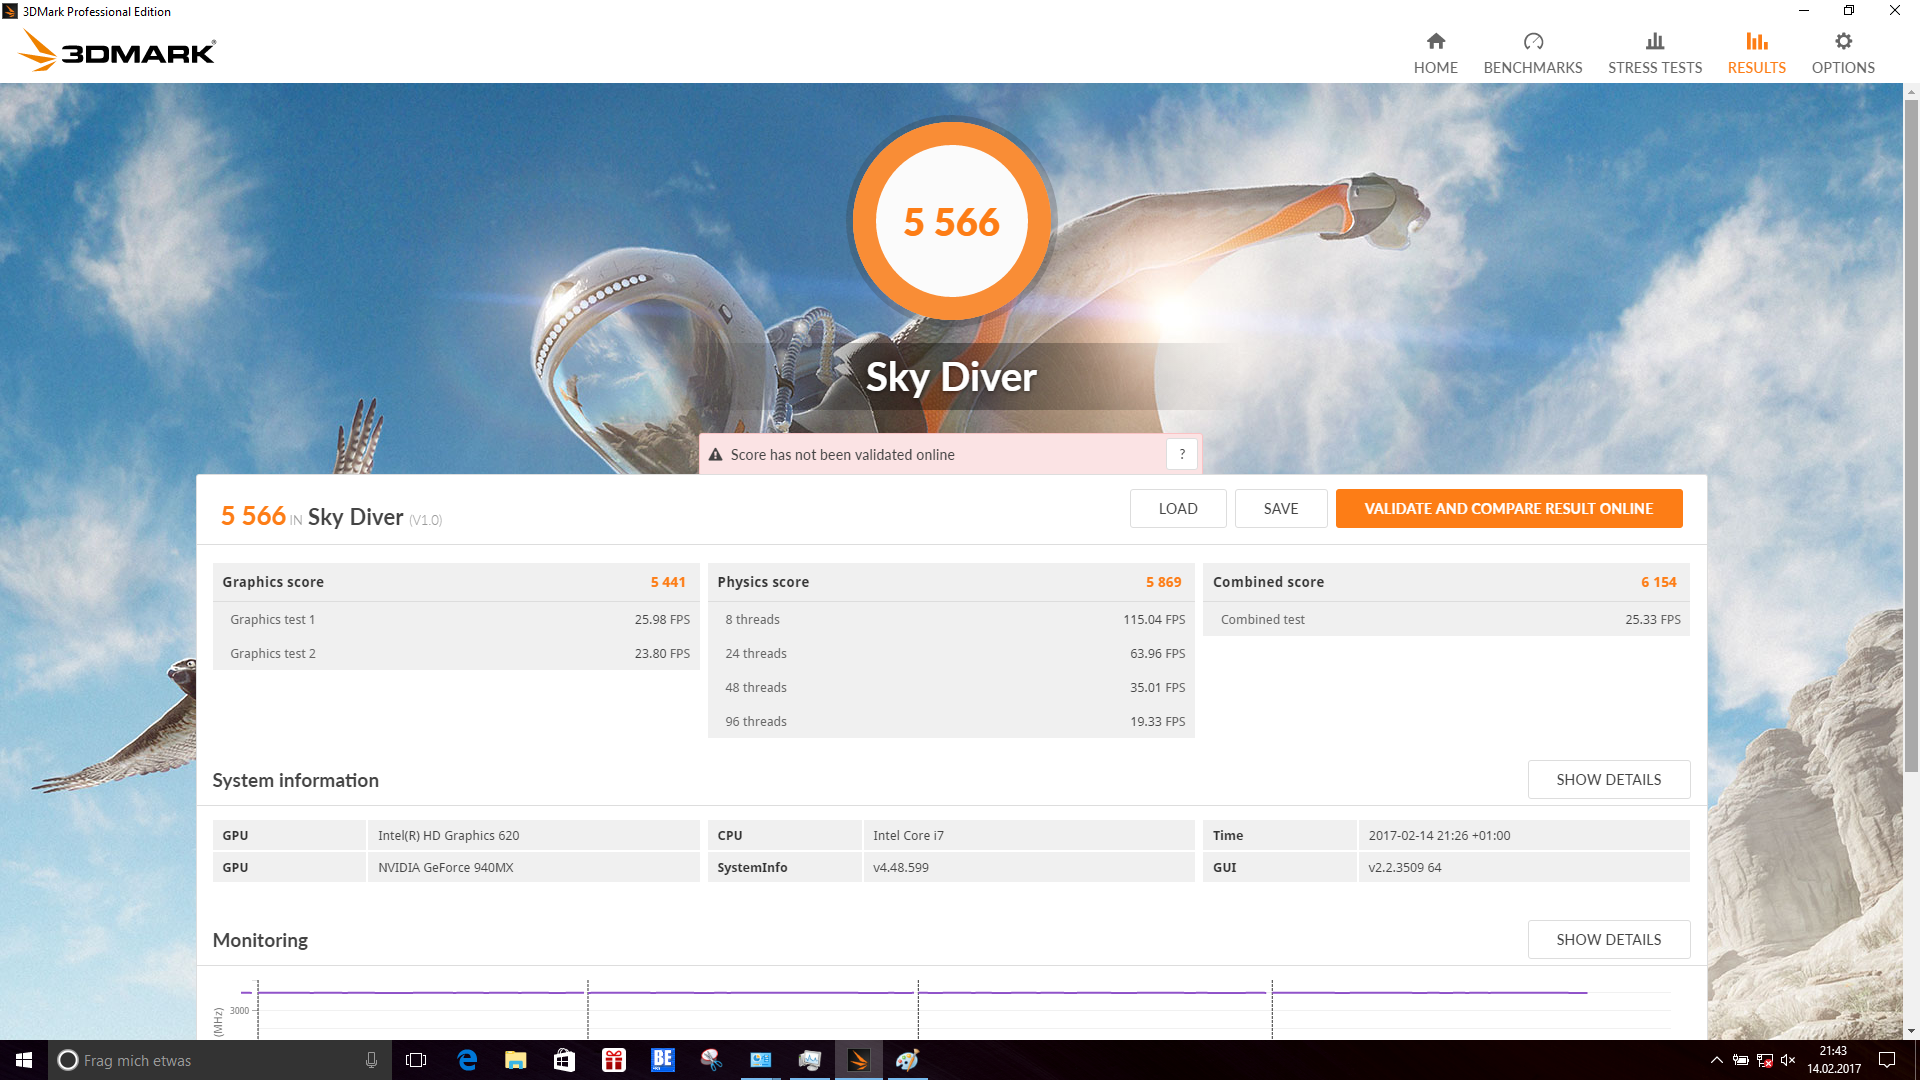
| 3DMark Ice Storm Standard Score | 46103 puntos | |
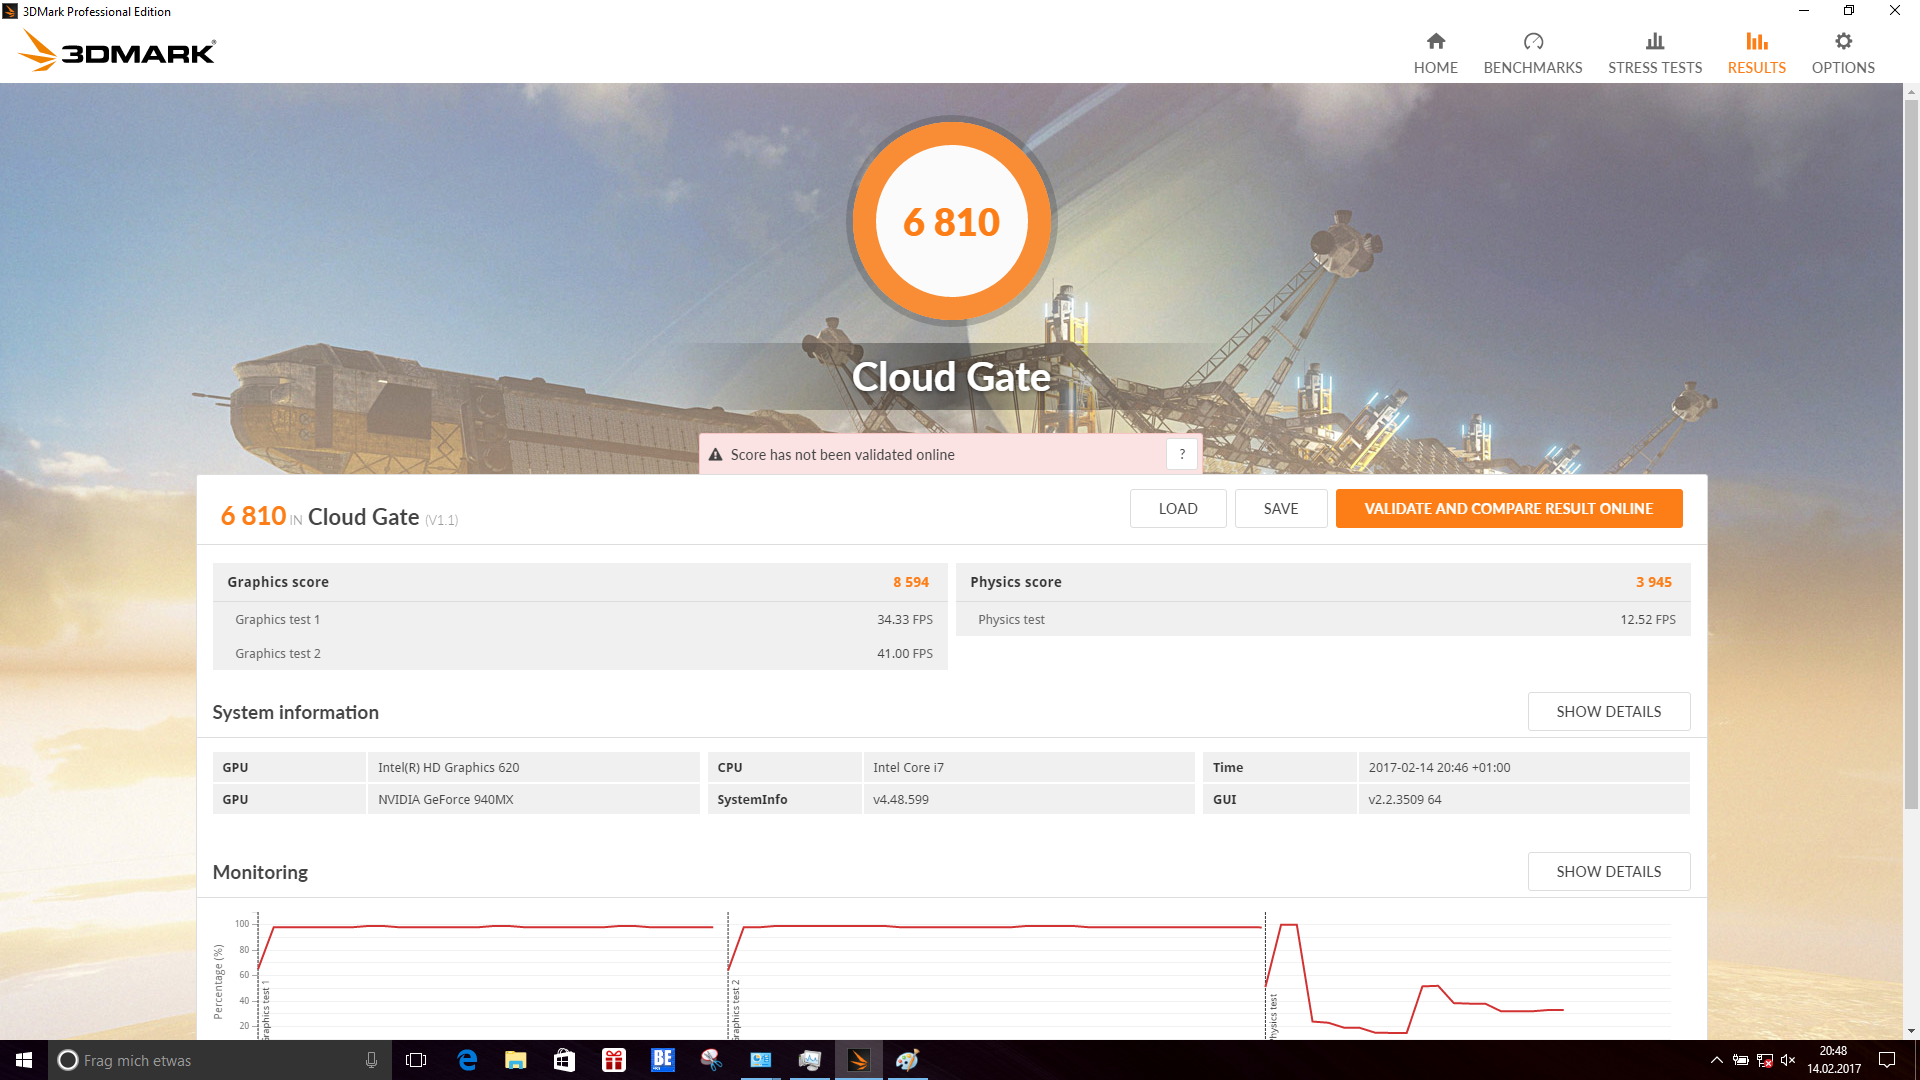
| 3DMark Cloud Gate Standard Score | 6810 puntos | |
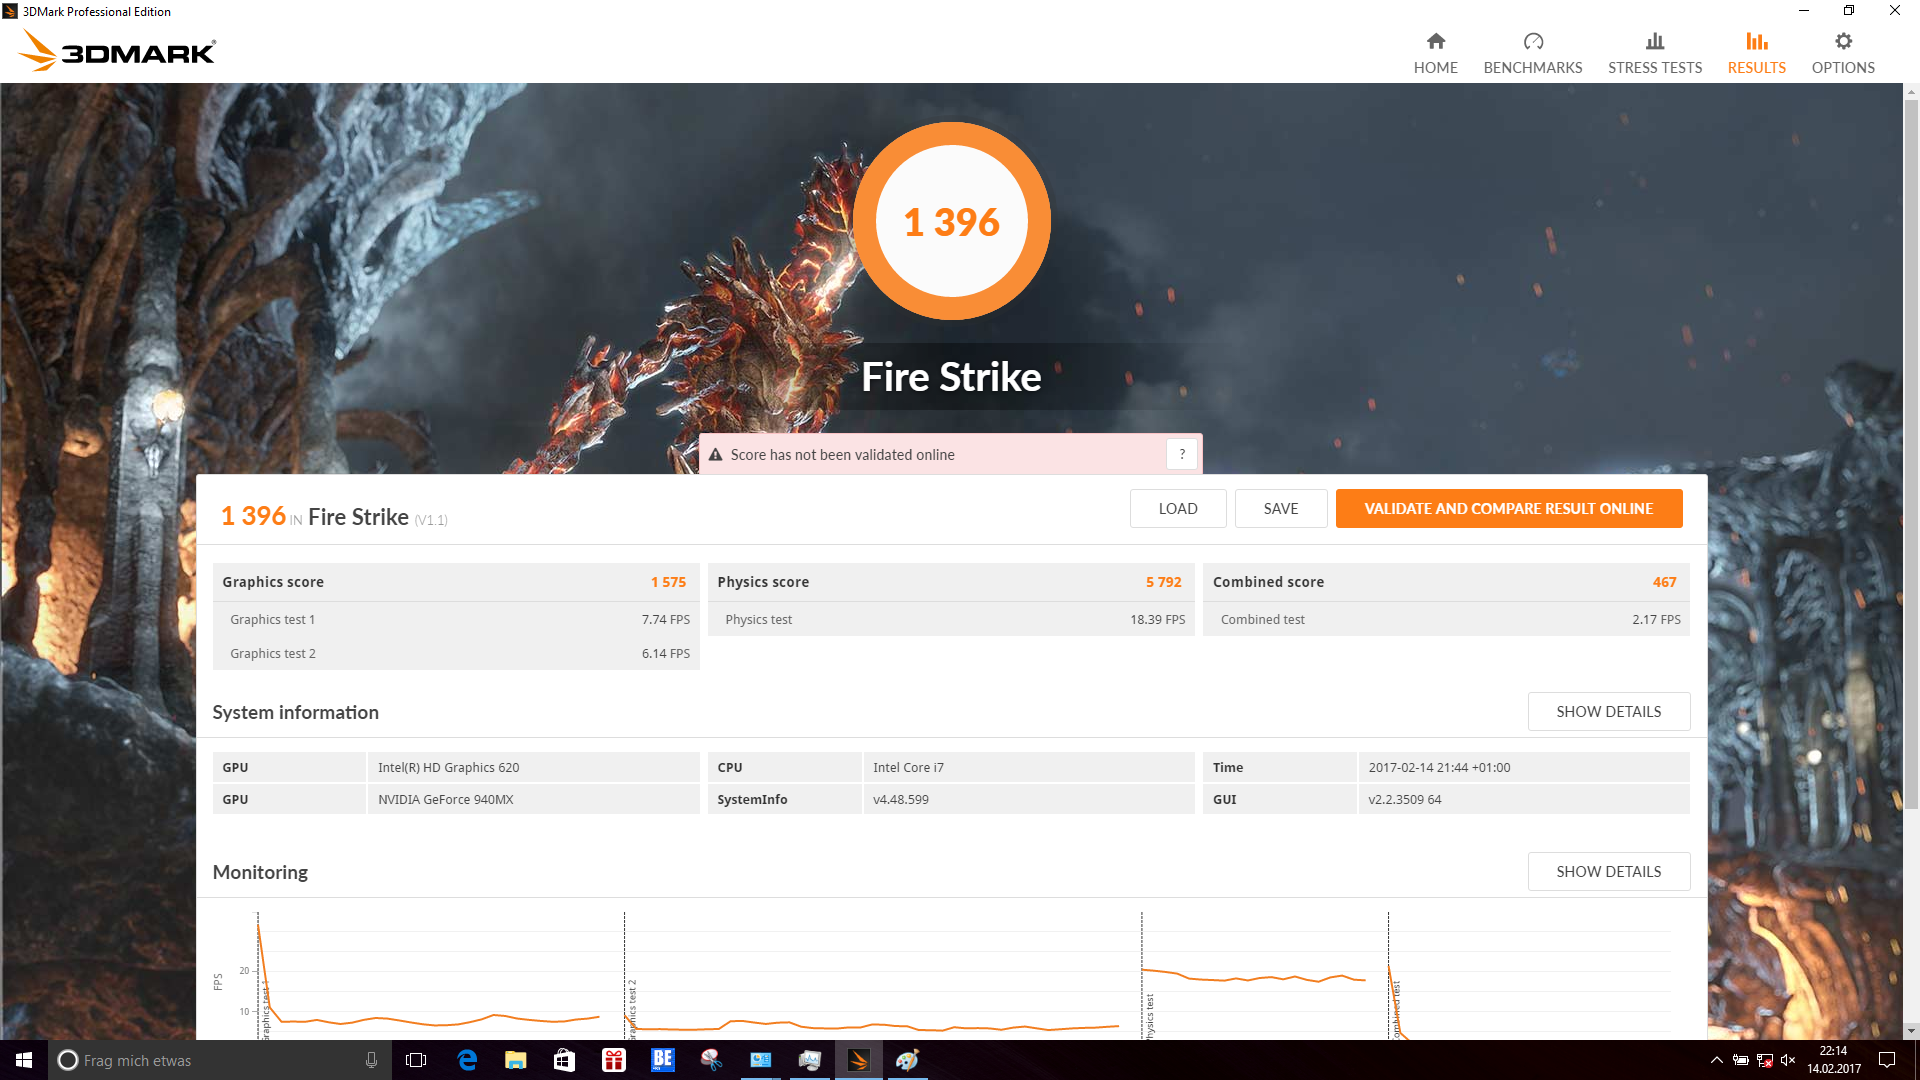
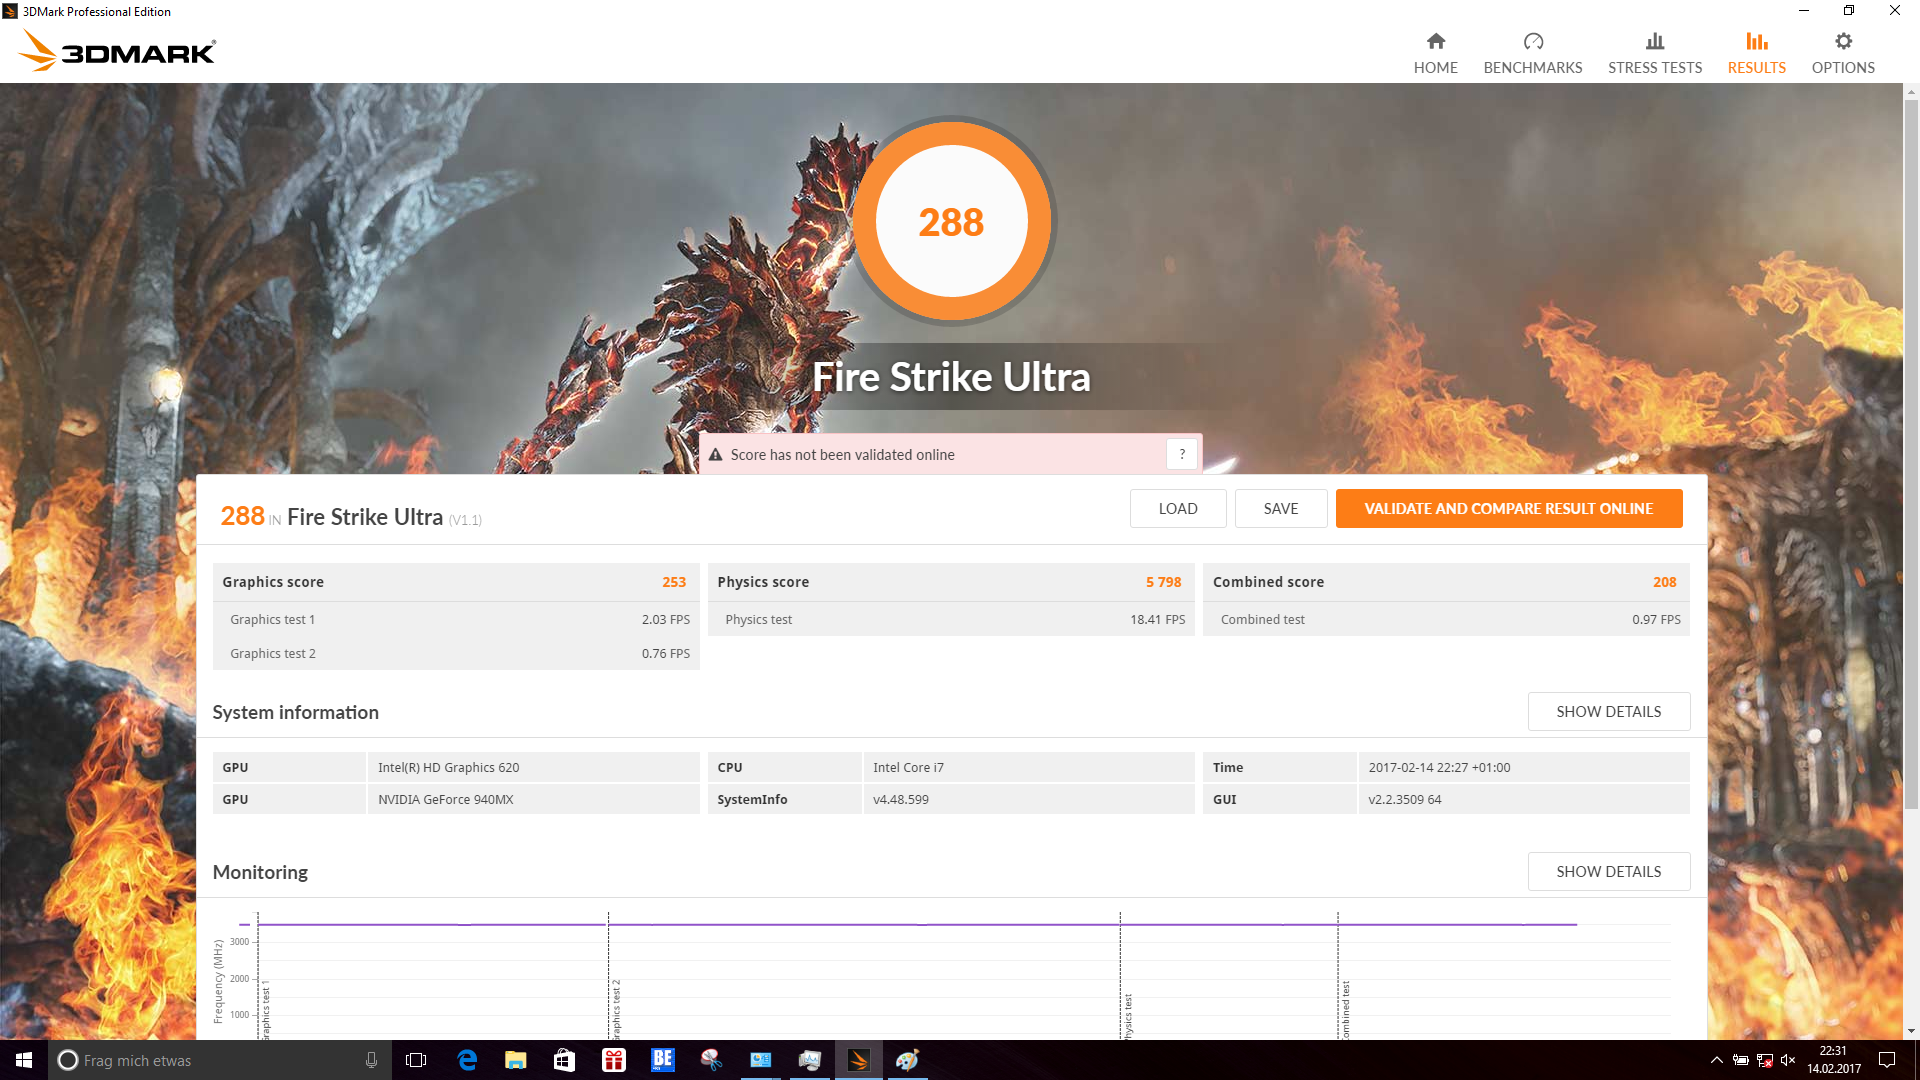
| 3DMark Fire Strike Score | 1396 puntos | |
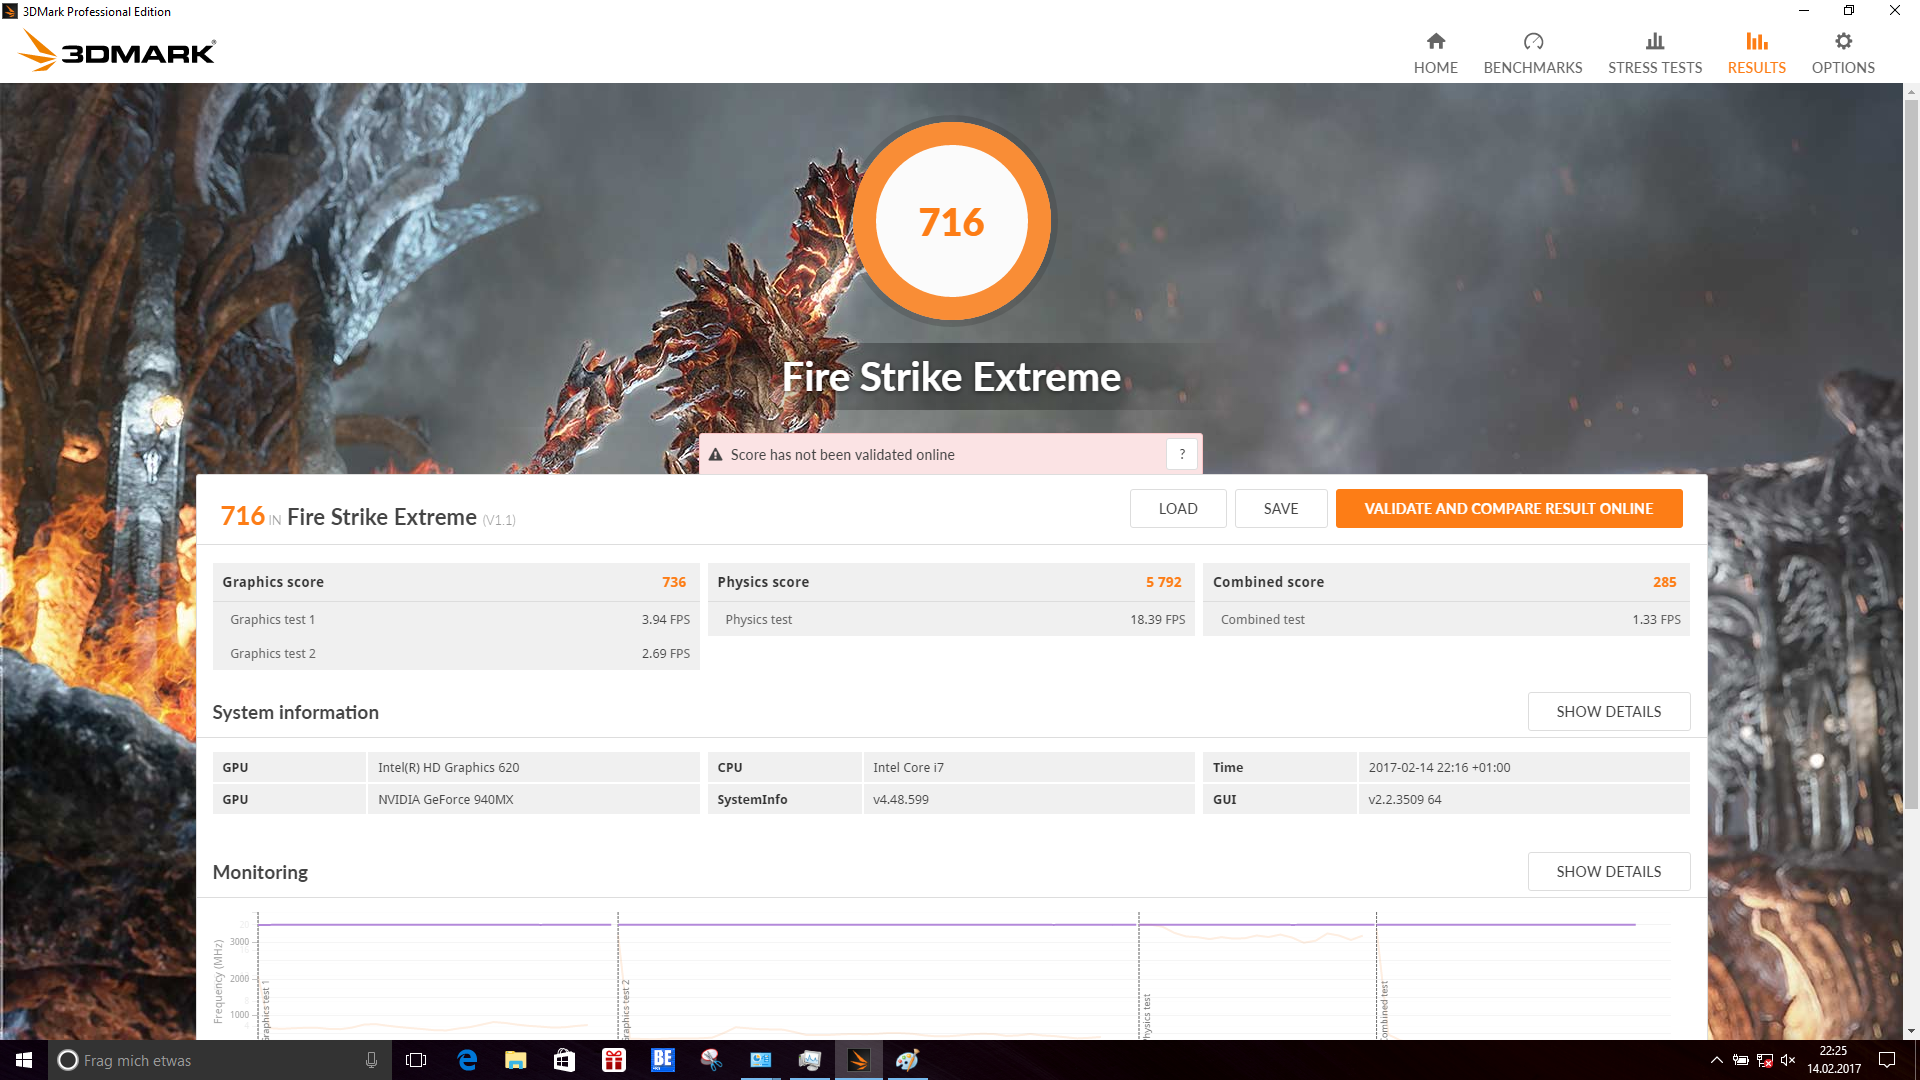
| 3DMark Fire Strike Extreme Score | 716 puntos | |
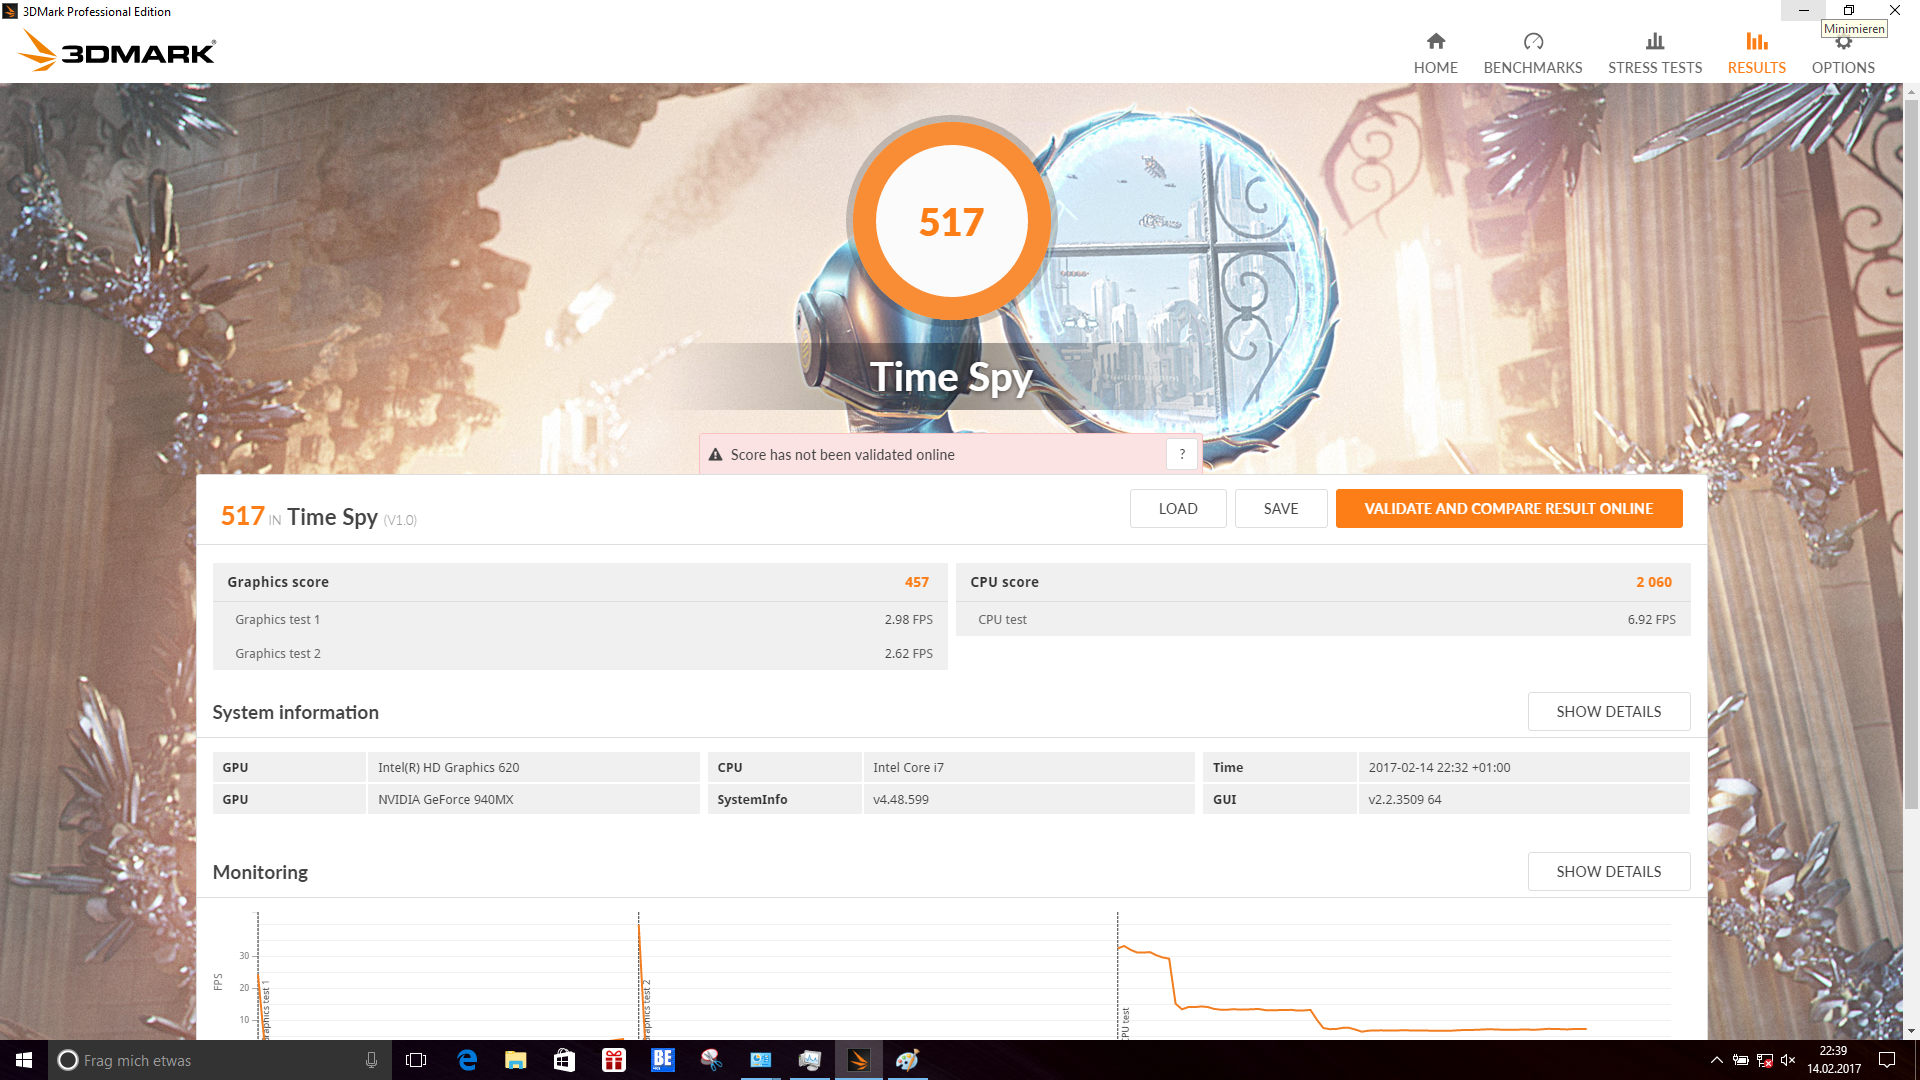
| 3DMark Time Spy Score | 517 puntos | |
ayuda | ||
| BioShock Infinite - 1366x768 Medium Preset | |
| Asus UX310UQ-FC396T | |
| Asus Zenbook UX310UQ-GL011T | |
| Asus Zenbook UX310UA-FC347T iGP | |
| Asus Zenbook UX3410UA | |
| Acer Swift 7 SF713-51 | |
| Battlefield 4 - 1366x768 Medium Preset | |
| Asus UX310UQ-FC396T | |
| Asus Zenbook UX310UQ-GL011T | |
| Asus Zenbook UX3410UA | |
| Asus Zenbook UX310UA-FC347T iGP | |
| Acer Swift 7 SF713-51 | |
| The Witcher 3 - 1366x768 Medium Graphics & Postprocessing | |
| Asus Zenbook UX310UA-FC347T iGP | |
| Asus UX310UQ-FC396T | |
| Asus Zenbook UX310UQ-GL011T | |
| Asus Zenbook UX3410UA | |
| bajo | medio | alto | ultra | |
|---|---|---|---|---|
| BioShock Infinite (2013) | 85.3 | 49.4 | 39.8 | 13.6 |
| Battlefield 4 (2013) | 67.6 | 44.1 | 29.5 | 11.2 |
| The Witcher 3 (2015) | 24.6 | 16.8 | 8.9 | 5.6 |
Ruido
| Ocioso |
| 31.1 / 31.1 / 31.5 dB(A) |
| HDD |
| 31.3 dB(A) |
| Carga |
| 38.5 / 39.7 dB(A) |
 | ||
30 dB silencioso 40 dB(A) audible 50 dB(A) ruidosamente alto |
||
min: | ||
| Asus UX310UQ-FC396T Intel Core i7-7500U, GeForce 940MX | Asus Zenbook UX310UQ-GL011T Intel Core i7-6500U, GeForce 940MX | Asus Zenbook UX310UA-FC347T iGP Intel Core i7-7500U, HD Graphics 620 | Asus Zenbook UX3410UA Intel Core i7-7500U, HD Graphics 620 | Acer Swift 7 SF713-51 Intel Core i5-7Y54, HD Graphics 615 | Dell XPS 13 9360 FHD i5 Intel Core i5-7200U, HD Graphics 620 | |
|---|---|---|---|---|---|---|
| Noise | 2% | 4% | -4% | 12% | ||
| apagado / medio ambiente * (dB) | 30.7 | 30.5 1% | 30.7 -0% | 29.9 3% | ||
| Idle Minimum * (dB) | 31.1 | 30.5 2% | 30.9 1% | 29.9 4% | 28.9 7% | |
| Idle Average * (dB) | 31.1 | 30.5 2% | 30.9 1% | 29.9 4% | 28.9 7% | |
| Idle Maximum * (dB) | 31.5 | 31.5 -0% | 30.9 2% | 35.2 -12% | 28.9 8% | |
| Load Average * (dB) | 38.5 | 36.2 6% | 35.6 8% | 43.5 -13% | 30.9 20% | |
| Load Maximum * (dB) | 39.7 | 40 -1% | 34.1 14% | 43.8 -10% | 33.5 16% |
* ... más pequeño es mejor
| Asus UX310UQ-FC396T GeForce 940MX, i7-7500U, SanDisk SD8SN8U512G1002 | Asus Zenbook UX310UQ-GL011T GeForce 940MX, 6500U, SanDisk SD8SNAT256G1002 | Asus Zenbook UX310UA-FC347T iGP HD Graphics 620, i7-7500U, Micron SSD 1100 (MTFDDAV256TBN) | Asus Zenbook UX3410UA HD Graphics 620, i7-7500U, SanDisk SD8SN8U512G1002 | Acer Swift 7 SF713-51 HD Graphics 615, i5-7Y54, Kingston RBU-SNS4180S3256GG | Dell XPS 13 9360 FHD i5 HD Graphics 620, i5-7200U, Toshiba NVMe THNSN5256GPUK | |
|---|---|---|---|---|---|---|
| Heat | 6% | 12% | 0% | -6% | -6% | |
| Maximum Upper Side * (°C) | 40 | 38.5 4% | 33.7 16% | 39.4 1% | 45.7 -14% | 43.4 -9% |
| Maximum Bottom * (°C) | 42.4 | 40.4 5% | 34.1 20% | 35.2 17% | 48.7 -15% | 49.2 -16% |
| Idle Upper Side * (°C) | 23.9 | 24.8 -4% | 25.2 -5% | 29.4 -23% | 25.5 -7% | 26.4 -10% |
| Idle Bottom * (°C) | 29.3 | 23.8 19% | 24.1 18% | 27.6 6% | 25.2 14% | 26.4 10% |
* ... más pequeño es mejor
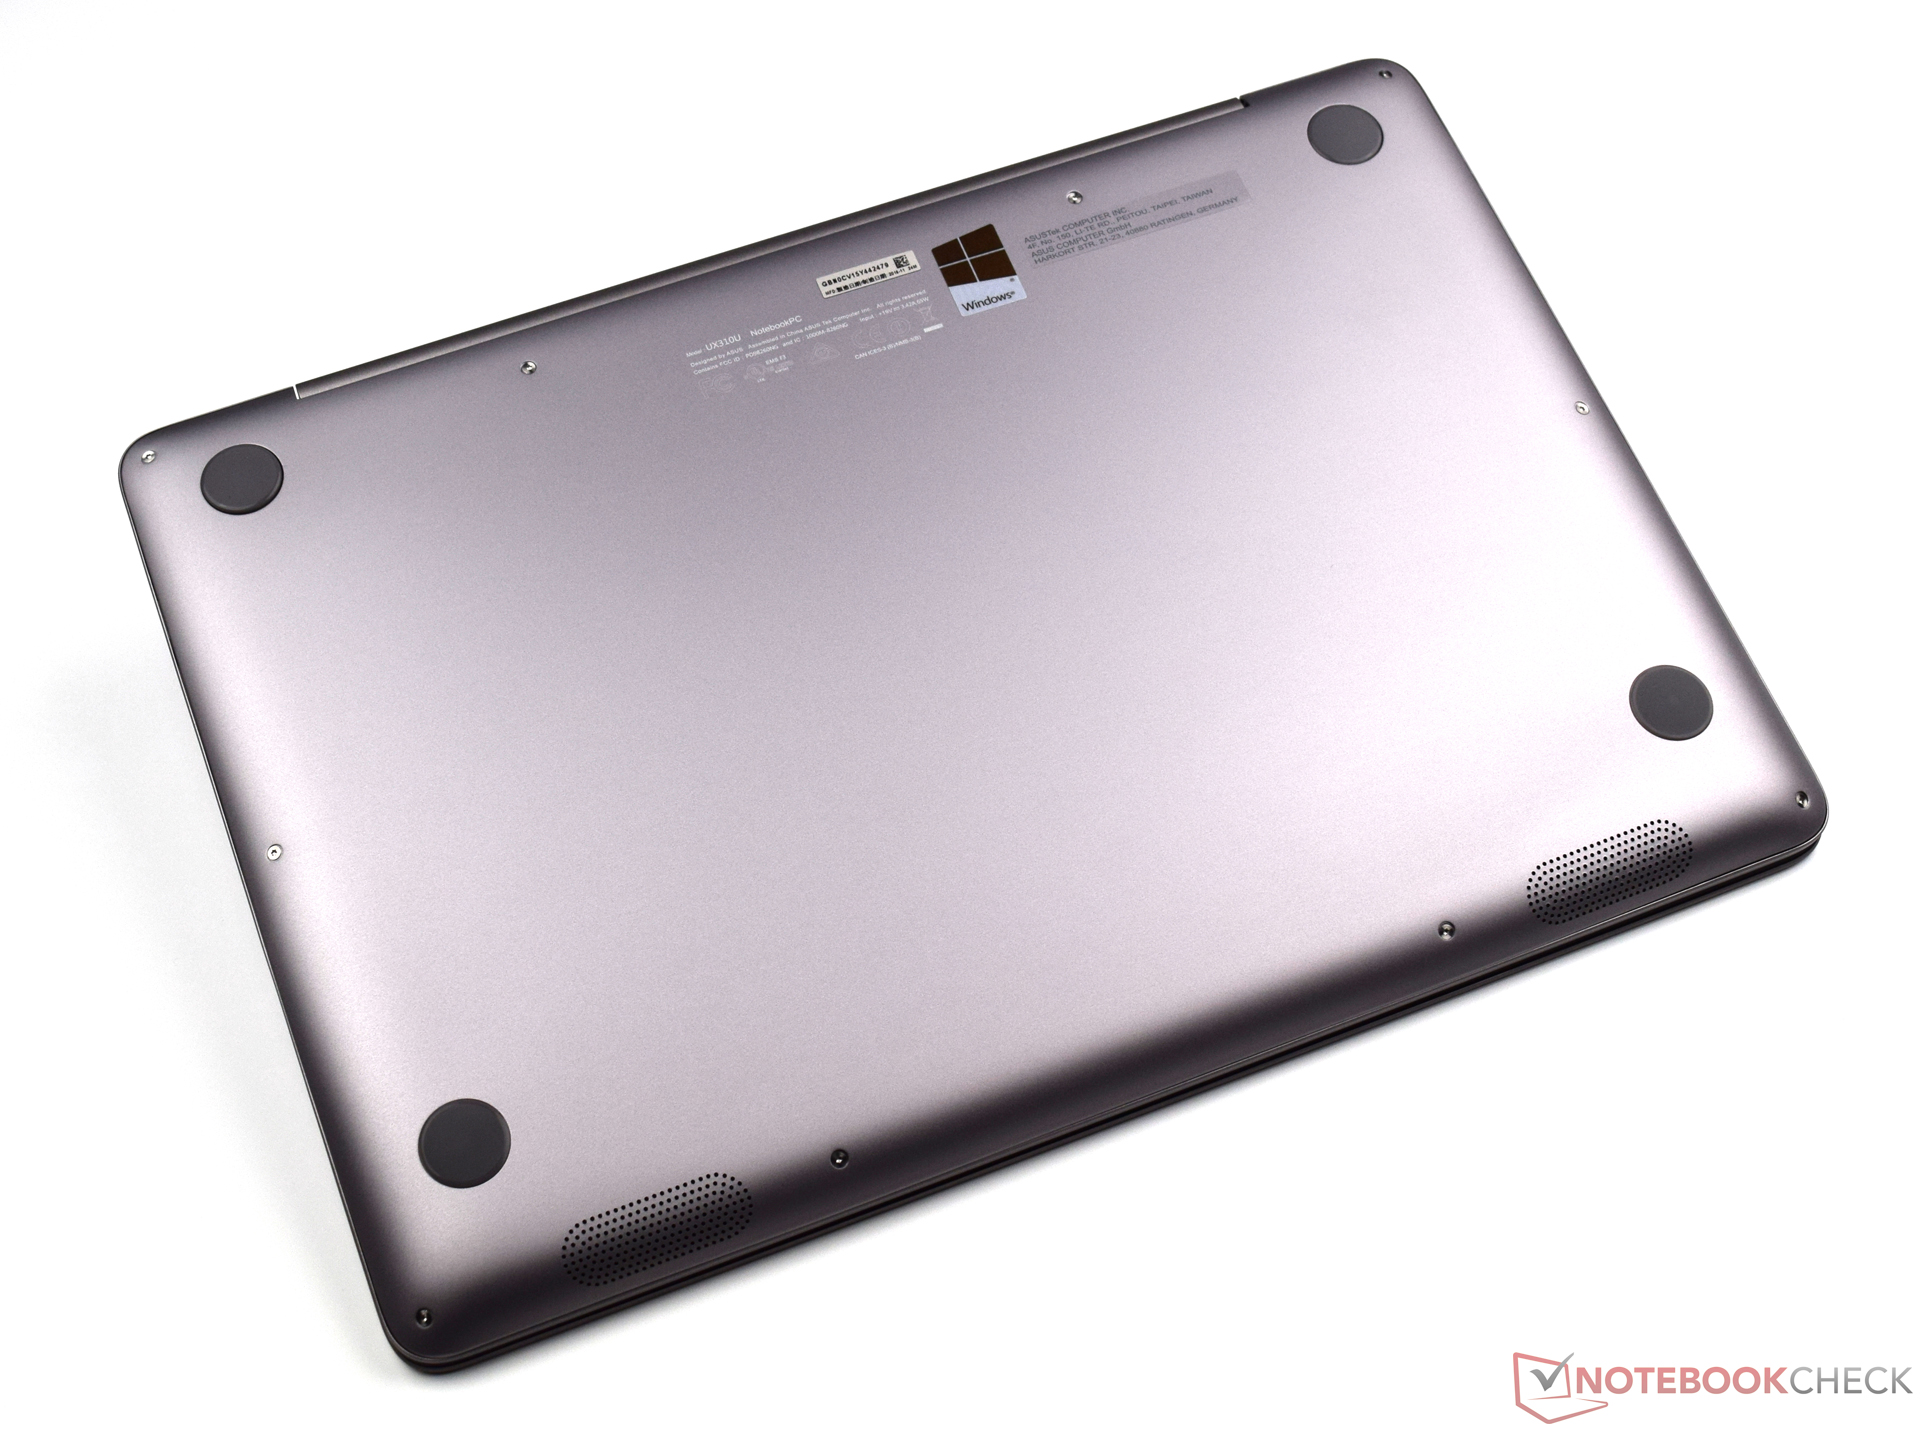
(±) La temperatura máxima en la parte superior es de 40 °C / 104 F, frente a la media de 35.9 °C / 97 F, que oscila entre 21.4 y 59 °C para la clase Subnotebook.
(±) El fondo se calienta hasta un máximo de 42.4 °C / 108 F, frente a la media de 39.2 °C / 103 F
(+) En reposo, la temperatura media de la parte superior es de 22.9 °C / 73# F, frente a la media del dispositivo de 30.8 °C / 87 F.
(+) El reposamanos y el panel táctil están a una temperatura inferior a la de la piel, con un máximo de 29 °C / 84.2 F y, por tanto, son fríos al tacto.
(±) La temperatura media de la zona del reposamanos de dispositivos similares fue de 28.2 °C / 82.8 F (-0.8 °C / -1.4 F).

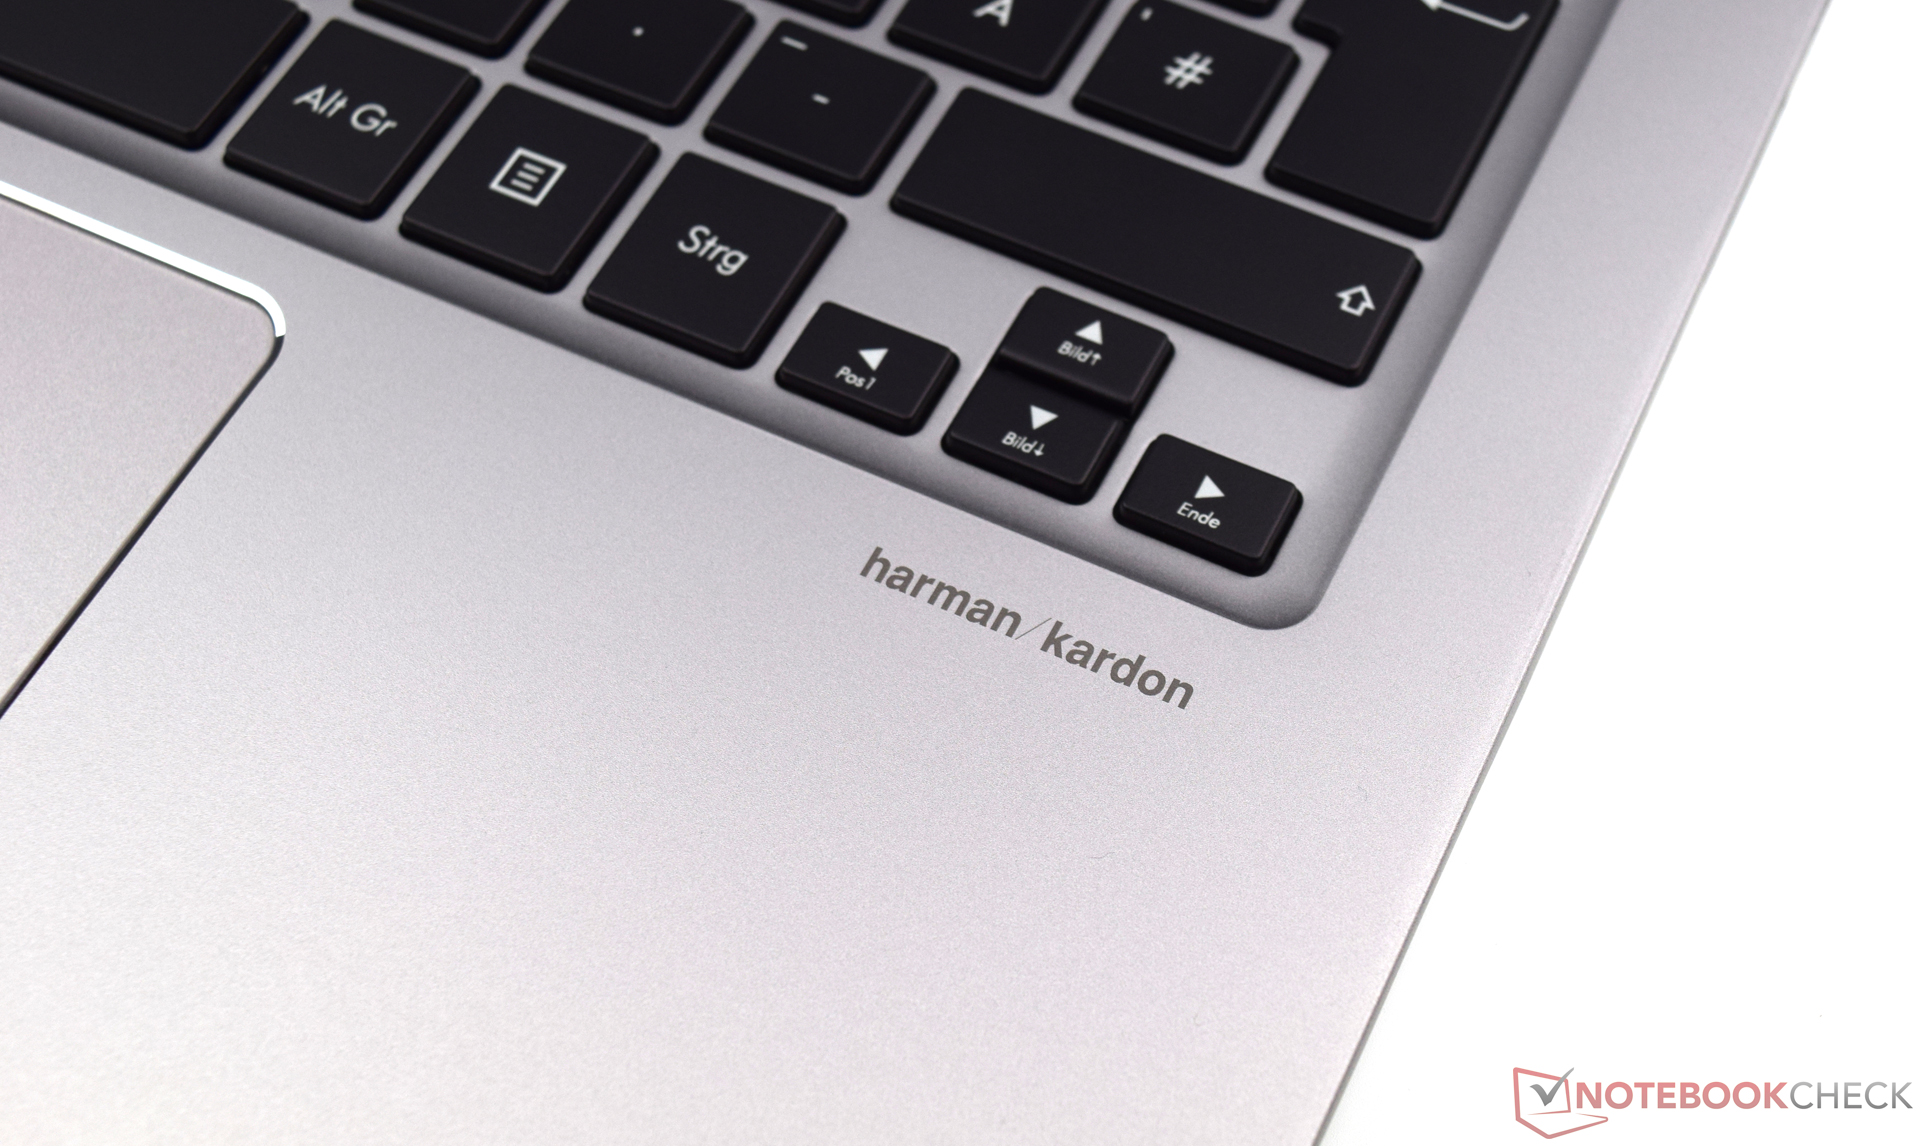
Asus UX310UQ-FC396T análisis de audio
(±) | la sonoridad del altavoz es media pero buena (72 dB)
Graves 100 - 315 Hz
(±) | lubina reducida - en promedio 13.1% inferior a la mediana
(+) | el bajo es lineal (6.5% delta a la frecuencia anterior)
Medios 400 - 2000 Hz
(+) | medios equilibrados - a sólo 2.8% de la mediana
(+) | los medios son lineales (3.3% delta a la frecuencia anterior)
Altos 2 - 16 kHz
(±) | máximos más altos - de media 6.6% más altos que la mediana
(+) | los máximos son lineales (4.3% delta a la frecuencia anterior)
Total 100 - 16.000 Hz
(±) | la linealidad del sonido global es media (16.1% de diferencia con la mediana)
En comparación con la misma clase
» 39% de todos los dispositivos probados de esta clase eran mejores, 4% similares, 57% peores
» El mejor tuvo un delta de 5%, la media fue 18%, el peor fue ###max##%
En comparación con todos los dispositivos probados
» 26% de todos los dispositivos probados eran mejores, 5% similares, 69% peores
» El mejor tuvo un delta de 4%, la media fue 24%, el peor fue ###max##%
Apple MacBook 12 (Early 2016) 1.1 GHz análisis de audio
(+) | los altavoces pueden reproducir a un volumen relativamente alto (#83.6 dB)
Graves 100 - 315 Hz
(±) | lubina reducida - en promedio 11.3% inferior a la mediana
(±) | la linealidad de los graves es media (14.2% delta a frecuencia anterior)
Medios 400 - 2000 Hz
(+) | medios equilibrados - a sólo 2.4% de la mediana
(+) | los medios son lineales (5.5% delta a la frecuencia anterior)
Altos 2 - 16 kHz
(+) | máximos equilibrados - a sólo 2% de la mediana
(+) | los máximos son lineales (4.5% delta a la frecuencia anterior)
Total 100 - 16.000 Hz
(+) | el sonido global es lineal (10.2% de diferencia con la mediana)
En comparación con la misma clase
» 7% de todos los dispositivos probados de esta clase eran mejores, 2% similares, 91% peores
» El mejor tuvo un delta de 5%, la media fue 18%, el peor fue ###max##%
En comparación con todos los dispositivos probados
» 5% de todos los dispositivos probados eran mejores, 1% similares, 94% peores
» El mejor tuvo un delta de 4%, la media fue 24%, el peor fue ###max##%
| Off / Standby | |
| Ocioso | |
| Carga |
|
Clave:
min: | |
| Asus UX310UQ-FC396T i7-7500U, GeForce 940MX, SanDisk SD8SN8U512G1002, IPS, LED, 1920x1080, 13.3" | Asus Zenbook UX310UQ-GL011T 6500U, GeForce 940MX, SanDisk SD8SNAT256G1002, TN LED, 1920x1080, 13.3" | Asus Zenbook UX310UA-FC347T iGP i7-7500U, HD Graphics 620, Micron SSD 1100 (MTFDDAV256TBN), IPS, LED, 1920x1080, 13.3" | Asus Zenbook UX3410UA i7-7500U, HD Graphics 620, SanDisk SD8SN8U512G1002, IPS, 1920x1080, 14" | Acer Swift 7 SF713-51 i5-7Y54, HD Graphics 615, Kingston RBU-SNS4180S3256GG, IPS, WLED, 1920x1080, 13.3" | Dell XPS 13 9360 FHD i5 i5-7200U, HD Graphics 620, Toshiba NVMe THNSN5256GPUK, IPS, 1920x1080, 13.3" | |
|---|---|---|---|---|---|---|
| Power Consumption | 17% | 23% | 22% | 37% | 40% | |
| Idle Minimum * (Watt) | 4.1 | 3 27% | 3.5 15% | 3.7 10% | 4.1 -0% | 4.1 -0% |
| Idle Average * (Watt) | 8.2 | 5.6 32% | 6.6 20% | 6 27% | 6.4 22% | 4.2 49% |
| Idle Maximum * (Watt) | 8.9 | 6.8 24% | 7.5 16% | 6.78 24% | 6.8 24% | 5.1 43% |
| Load Average * (Watt) | 48 | 48.7 -1% | 34.7 28% | 37.3 22% | 16 67% | 22.1 54% |
| Load Maximum * (Watt) | 64.1 | 63 2% | 39.6 38% | 47.4 26% | 18.7 71% | 29.4 54% |
* ... más pequeño es mejor

| Asus UX310UQ-FC396T i7-7500U, GeForce 940MX, 48 Wh | Asus Zenbook UX310UQ-GL011T 6500U, GeForce 940MX, 48 Wh | Asus Zenbook UX310UA-FC347T iGP i7-7500U, HD Graphics 620, 48 Wh | Asus Zenbook UX3410UA i7-7500U, HD Graphics 620, 48 Wh | Acer Swift 7 SF713-51 i5-7Y54, HD Graphics 615, 41.58 Wh | Dell XPS 13 9360 FHD i5 i5-7200U, HD Graphics 620, 60 Wh | |
|---|---|---|---|---|---|---|
| Duración de Batería | -6% | 4% | 7% | 7% | 38% | |
| Reader / Idle (h) | 15.3 | 14.6 -5% | 16.1 5% | 17.7 16% | 13.2 -14% | 21.6 41% |
| H.264 (h) | 7.3 | 7 -4% | 6.9 -5% | 10.1 38% | 6.8 -7% | |
| WiFi v1.3 (h) | 8.8 | 8.1 -8% | 9.6 9% | 7.4 -16% | 7.3 -17% | 11.3 28% |
| Load (h) | 1.8 | 1.7 -6% | 1.9 6% | 1.6 -11% | 3 67% | 2.6 44% |
Pro
Contra

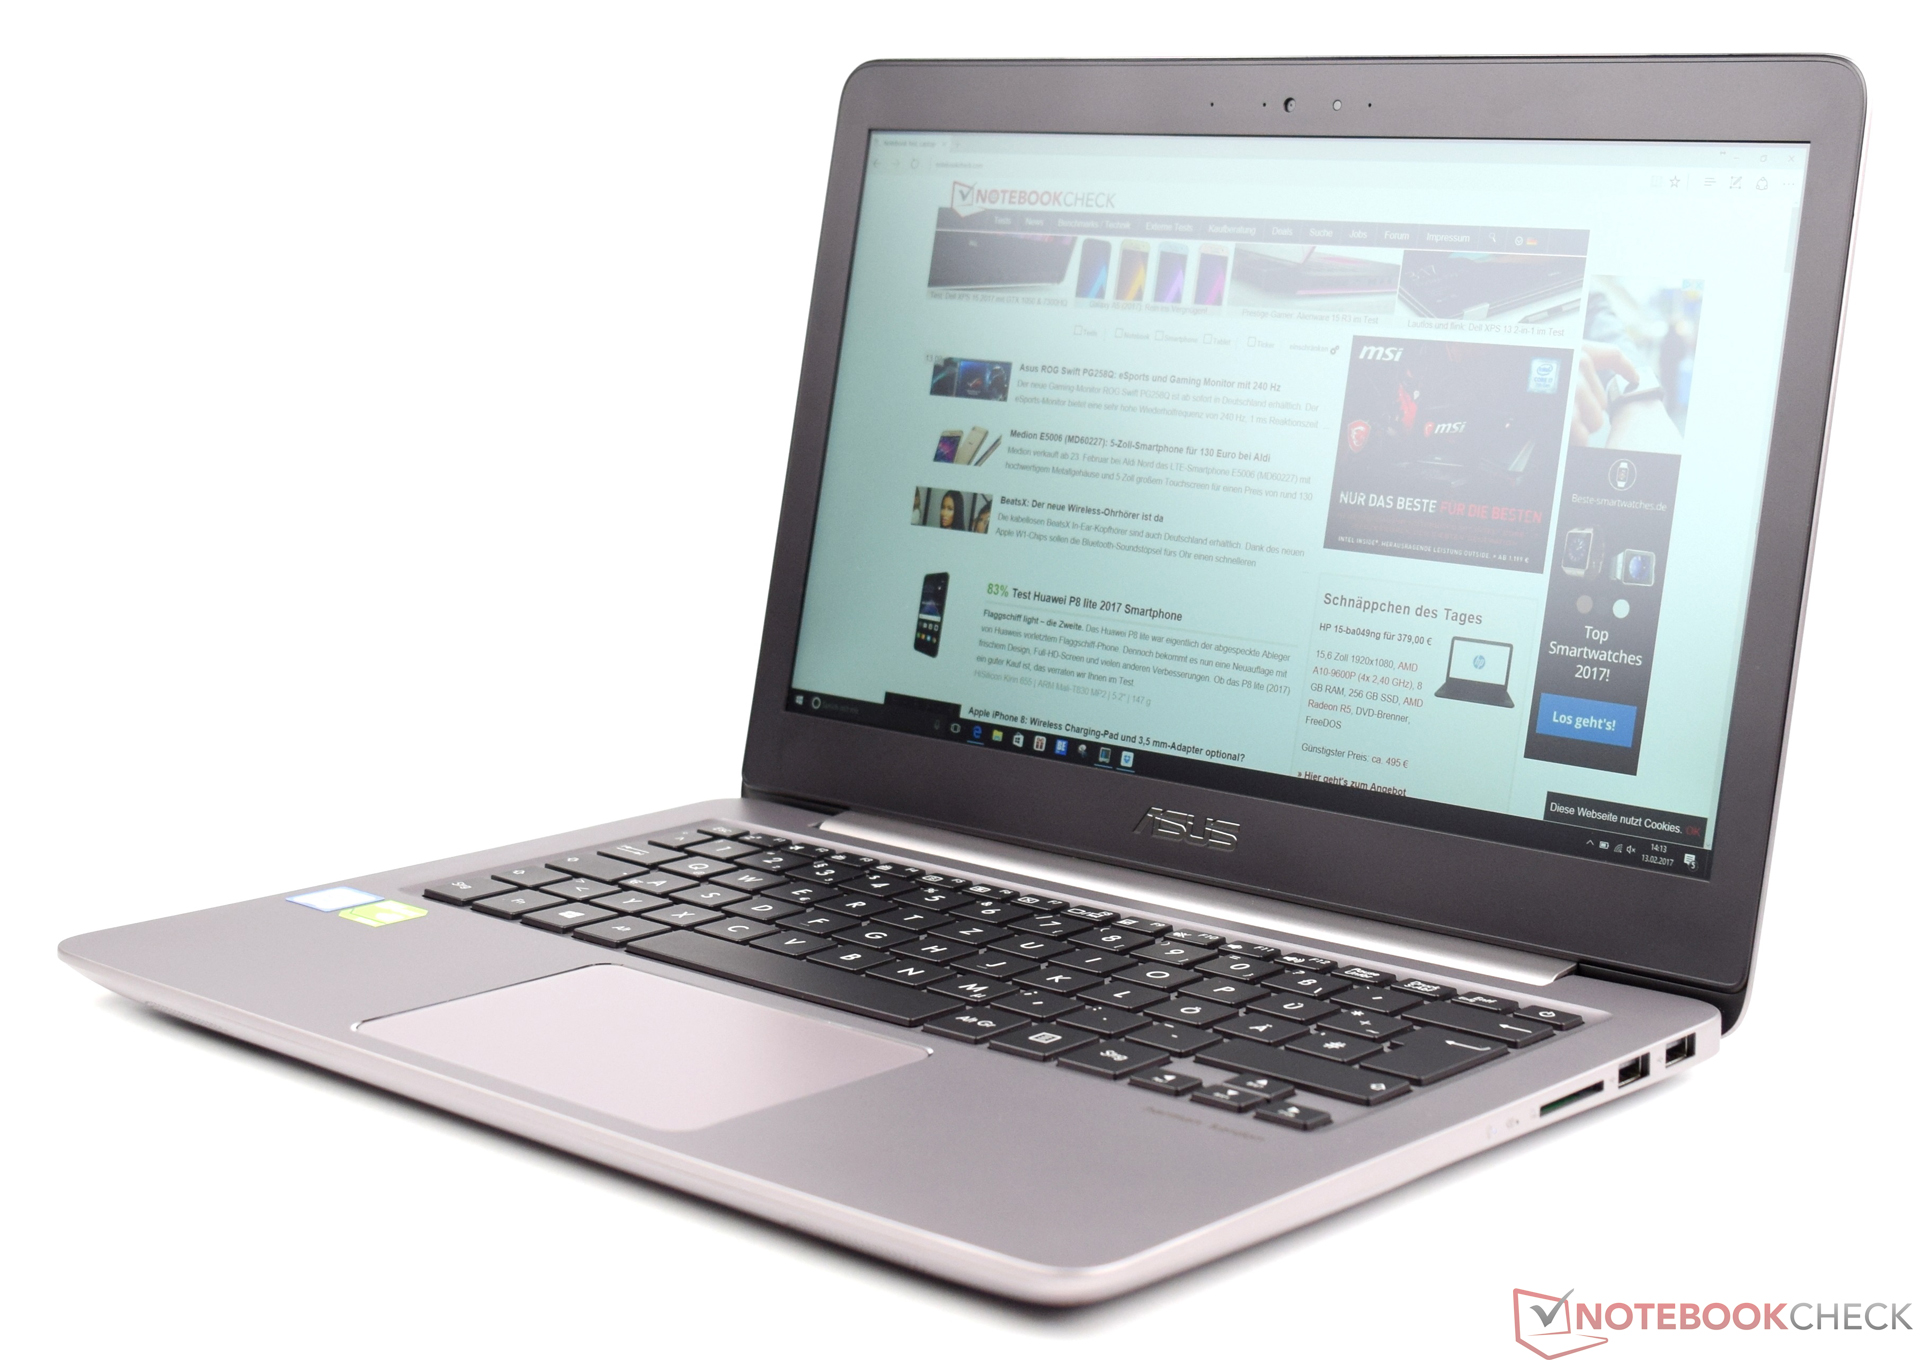
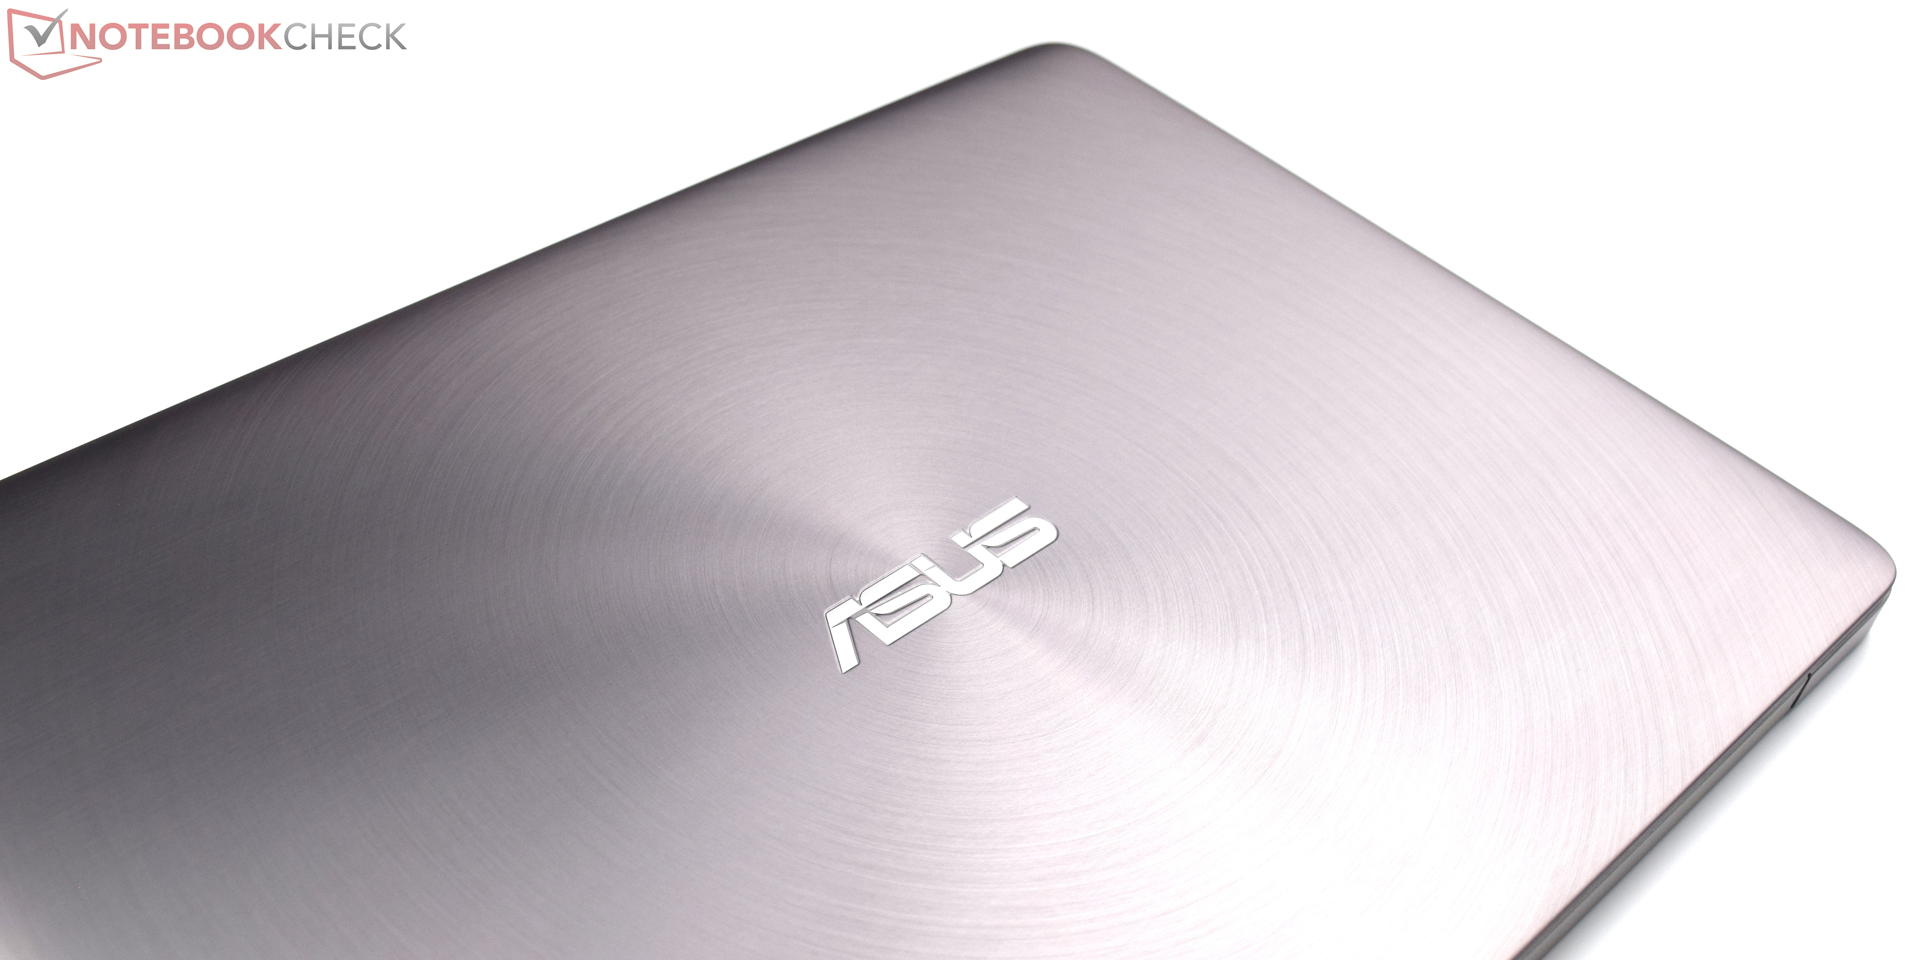
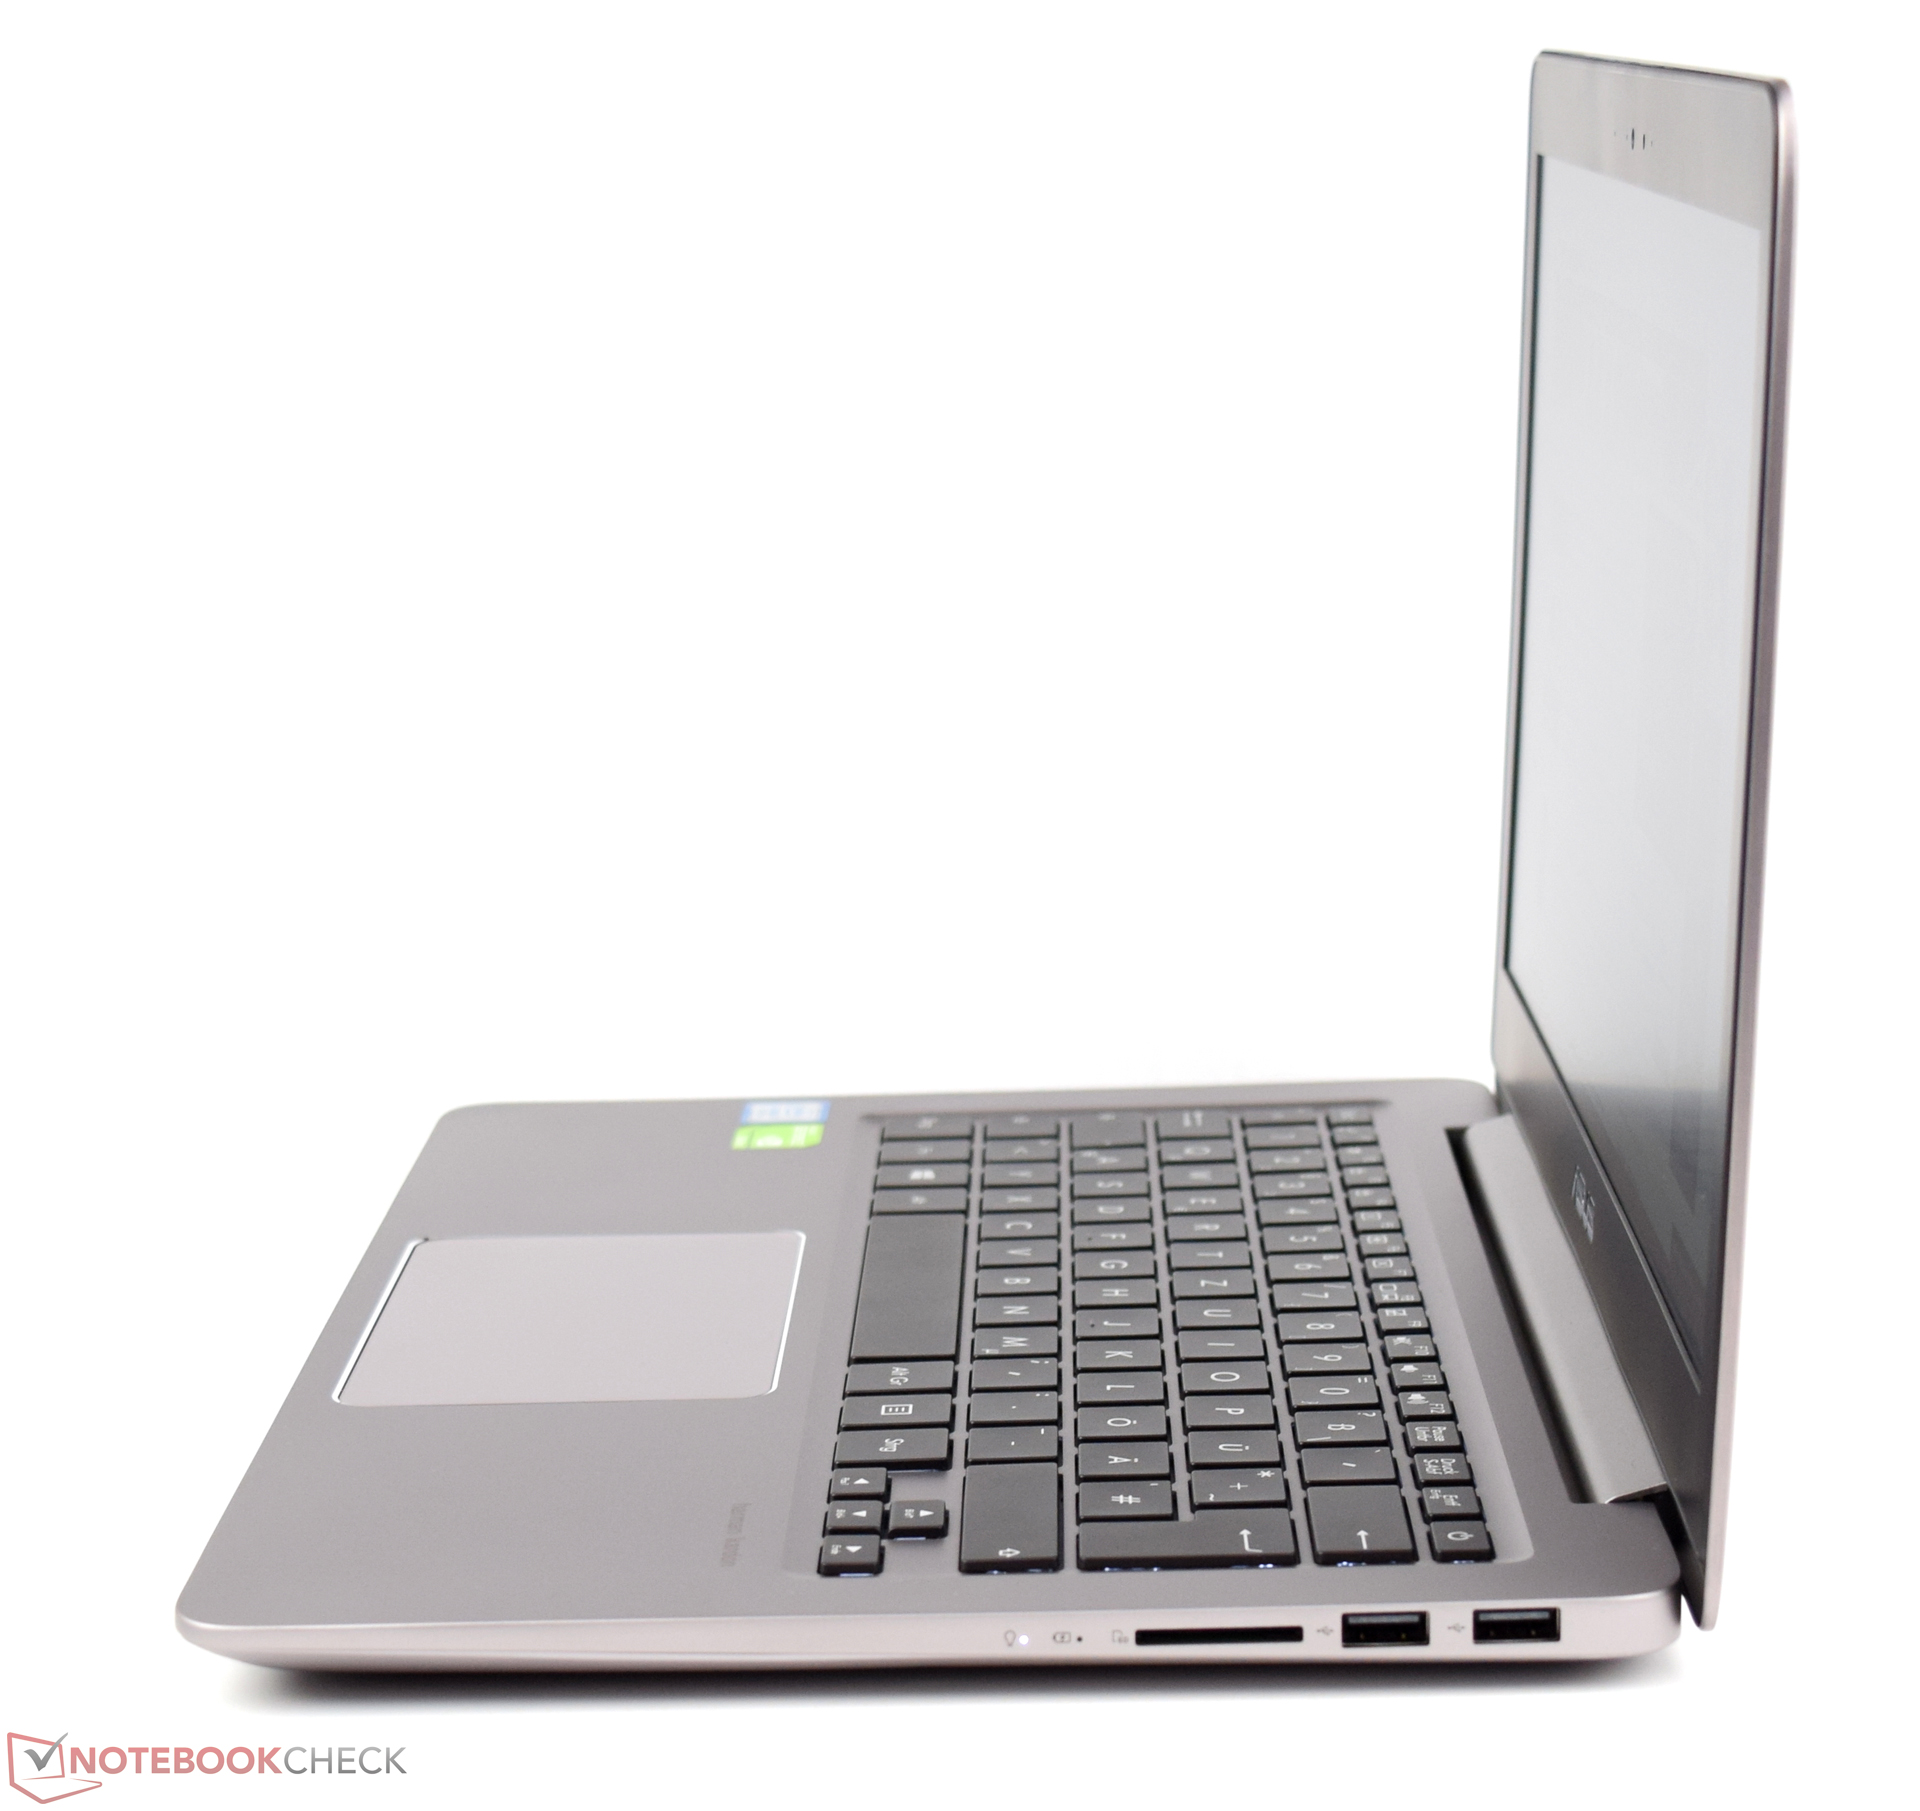
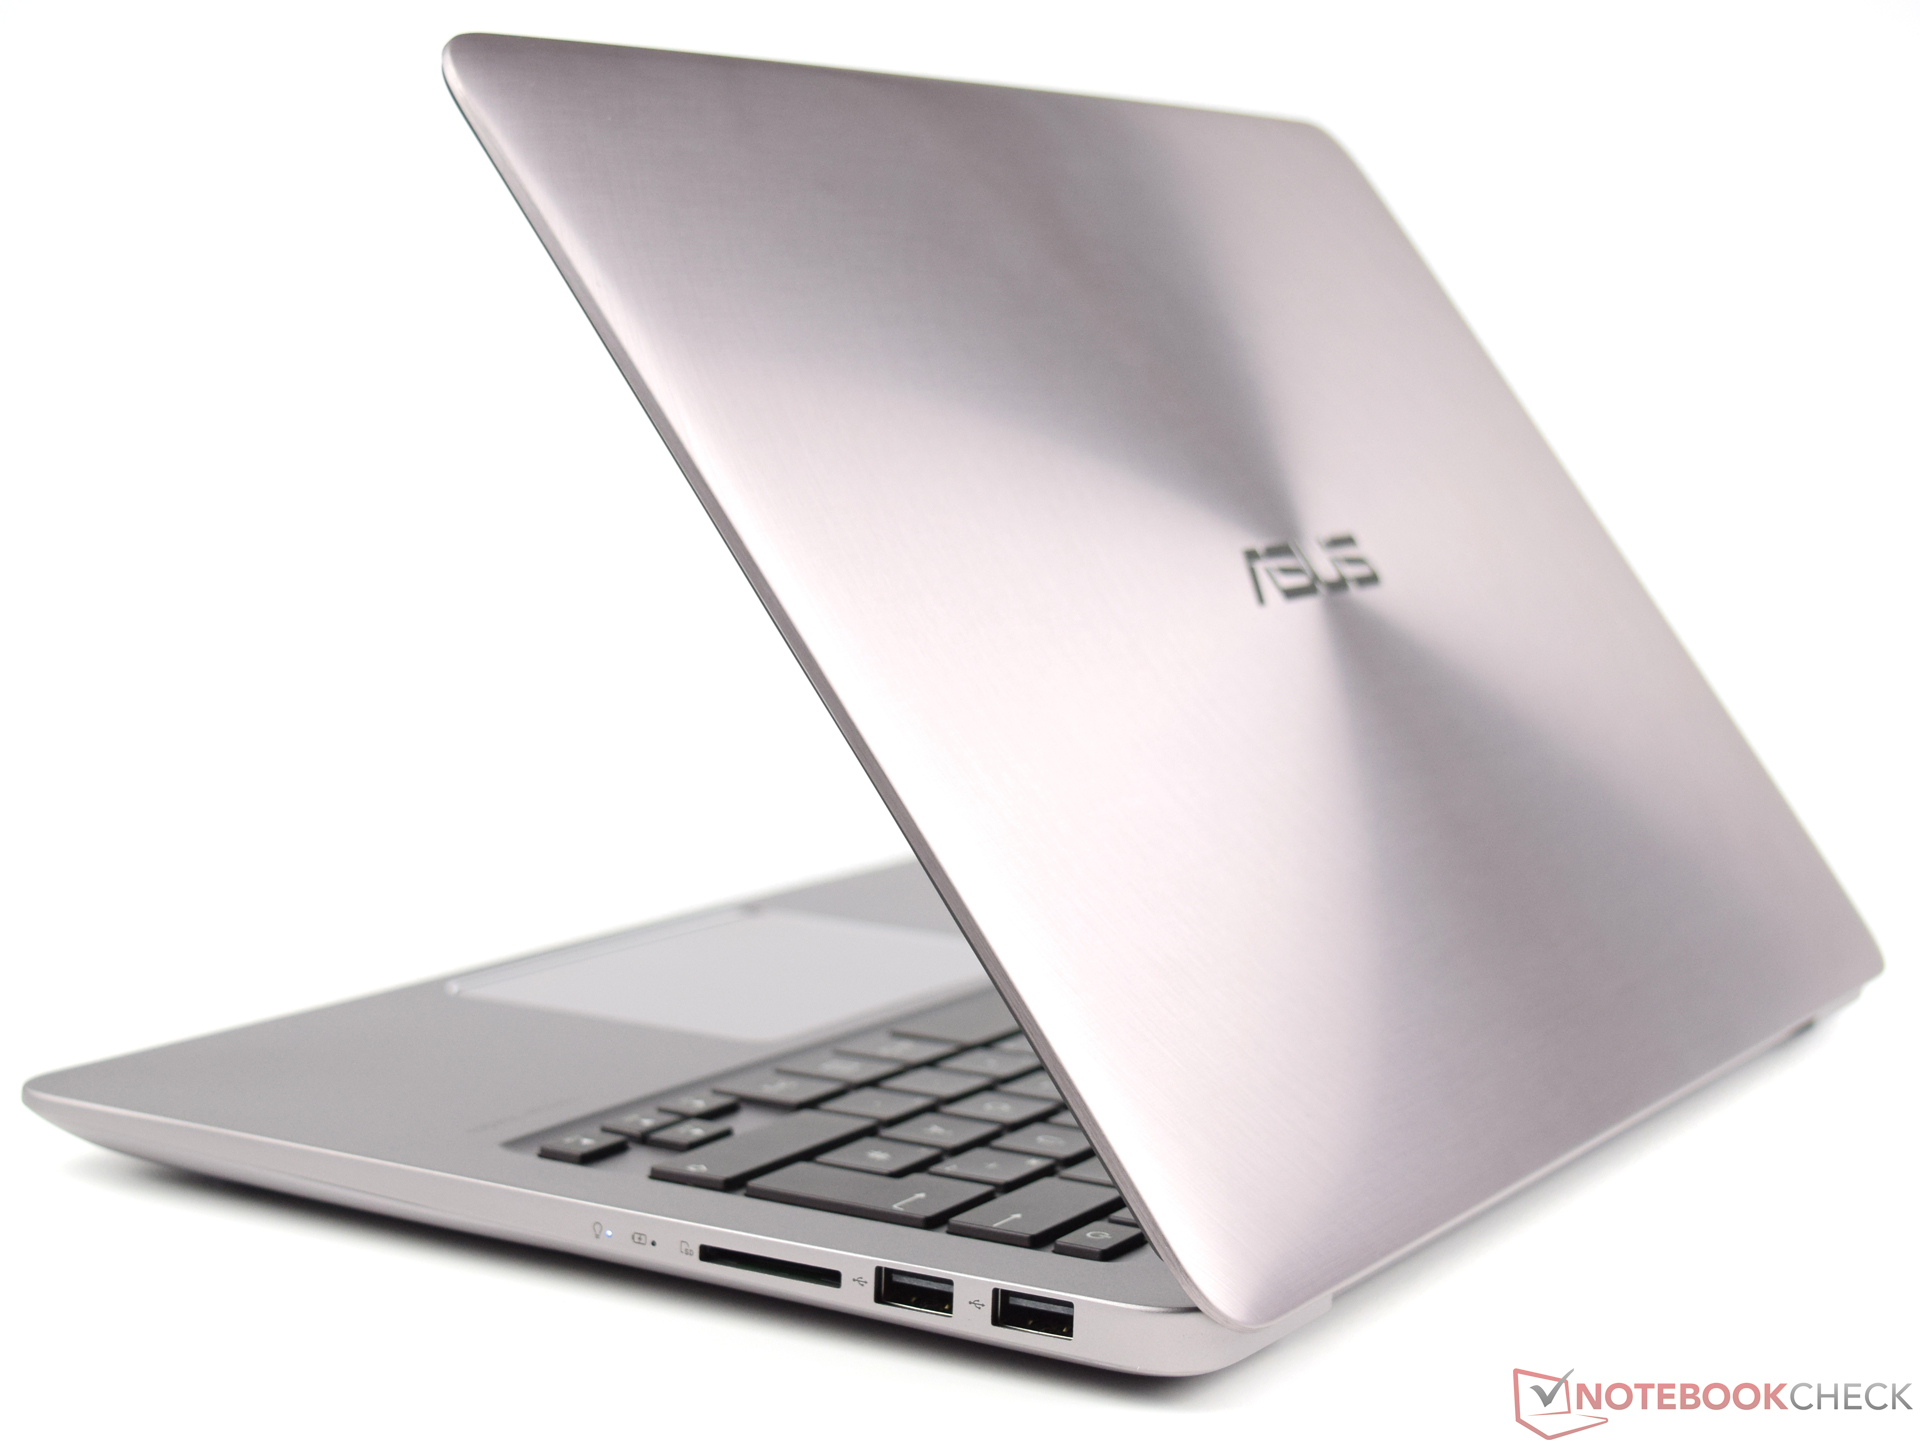
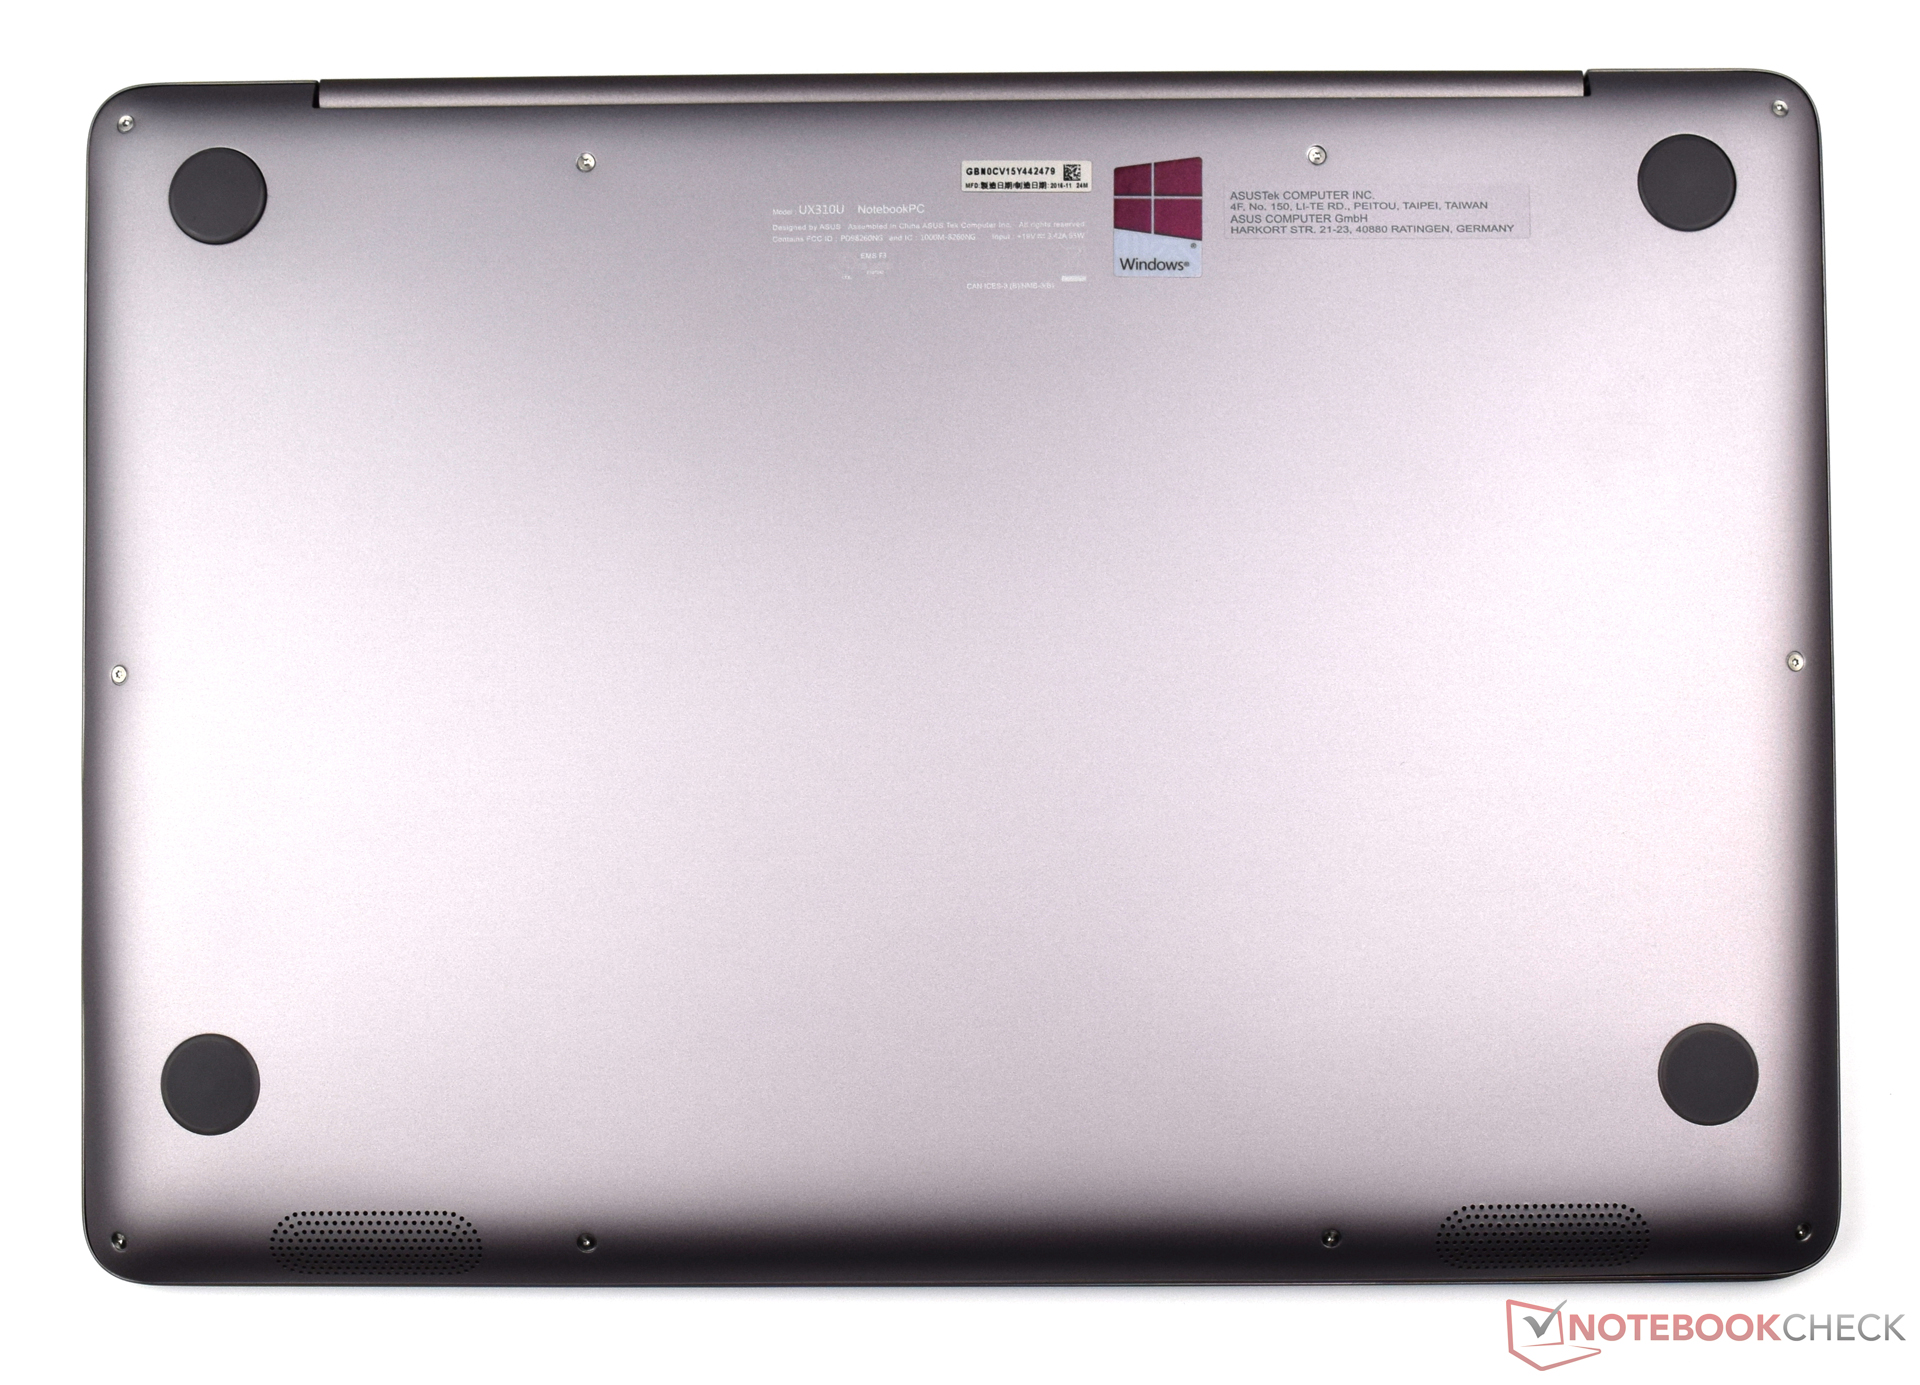
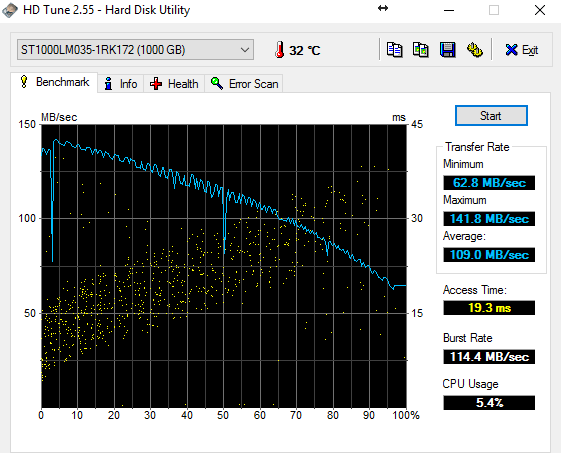
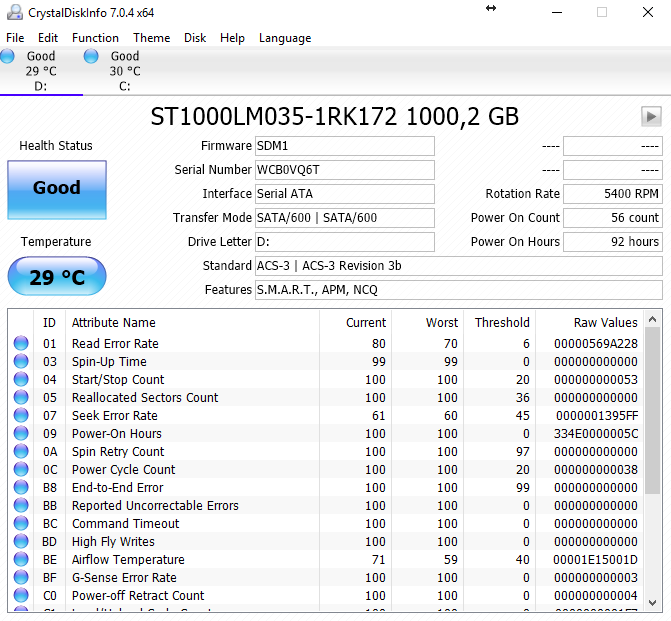
El Asus ZenBook UX310UQ-FC396T retiene muchos aspectos positivos de su predecesor, ya que las características externas del portátil no han cambiado. El Asus ZenBook UX310UQ-FC396T es un subportátil ligero, elegante, y que puede presumir de una calidad de manufactura excelente. Con su nuevo procesador Kaby Lake, su rendimiento de sistema es ligeramente mejor al de su predecesor. El Intel Core i7-7500U ofrece potencia más que suficiente para nuestro ZenBook. También tiene mucha memoria (16 GB de RAM DDR4), y una capacidad de almacenamiento total de 1.5 TB, el usuario tardará un tiempo en quedarse sin sitio.
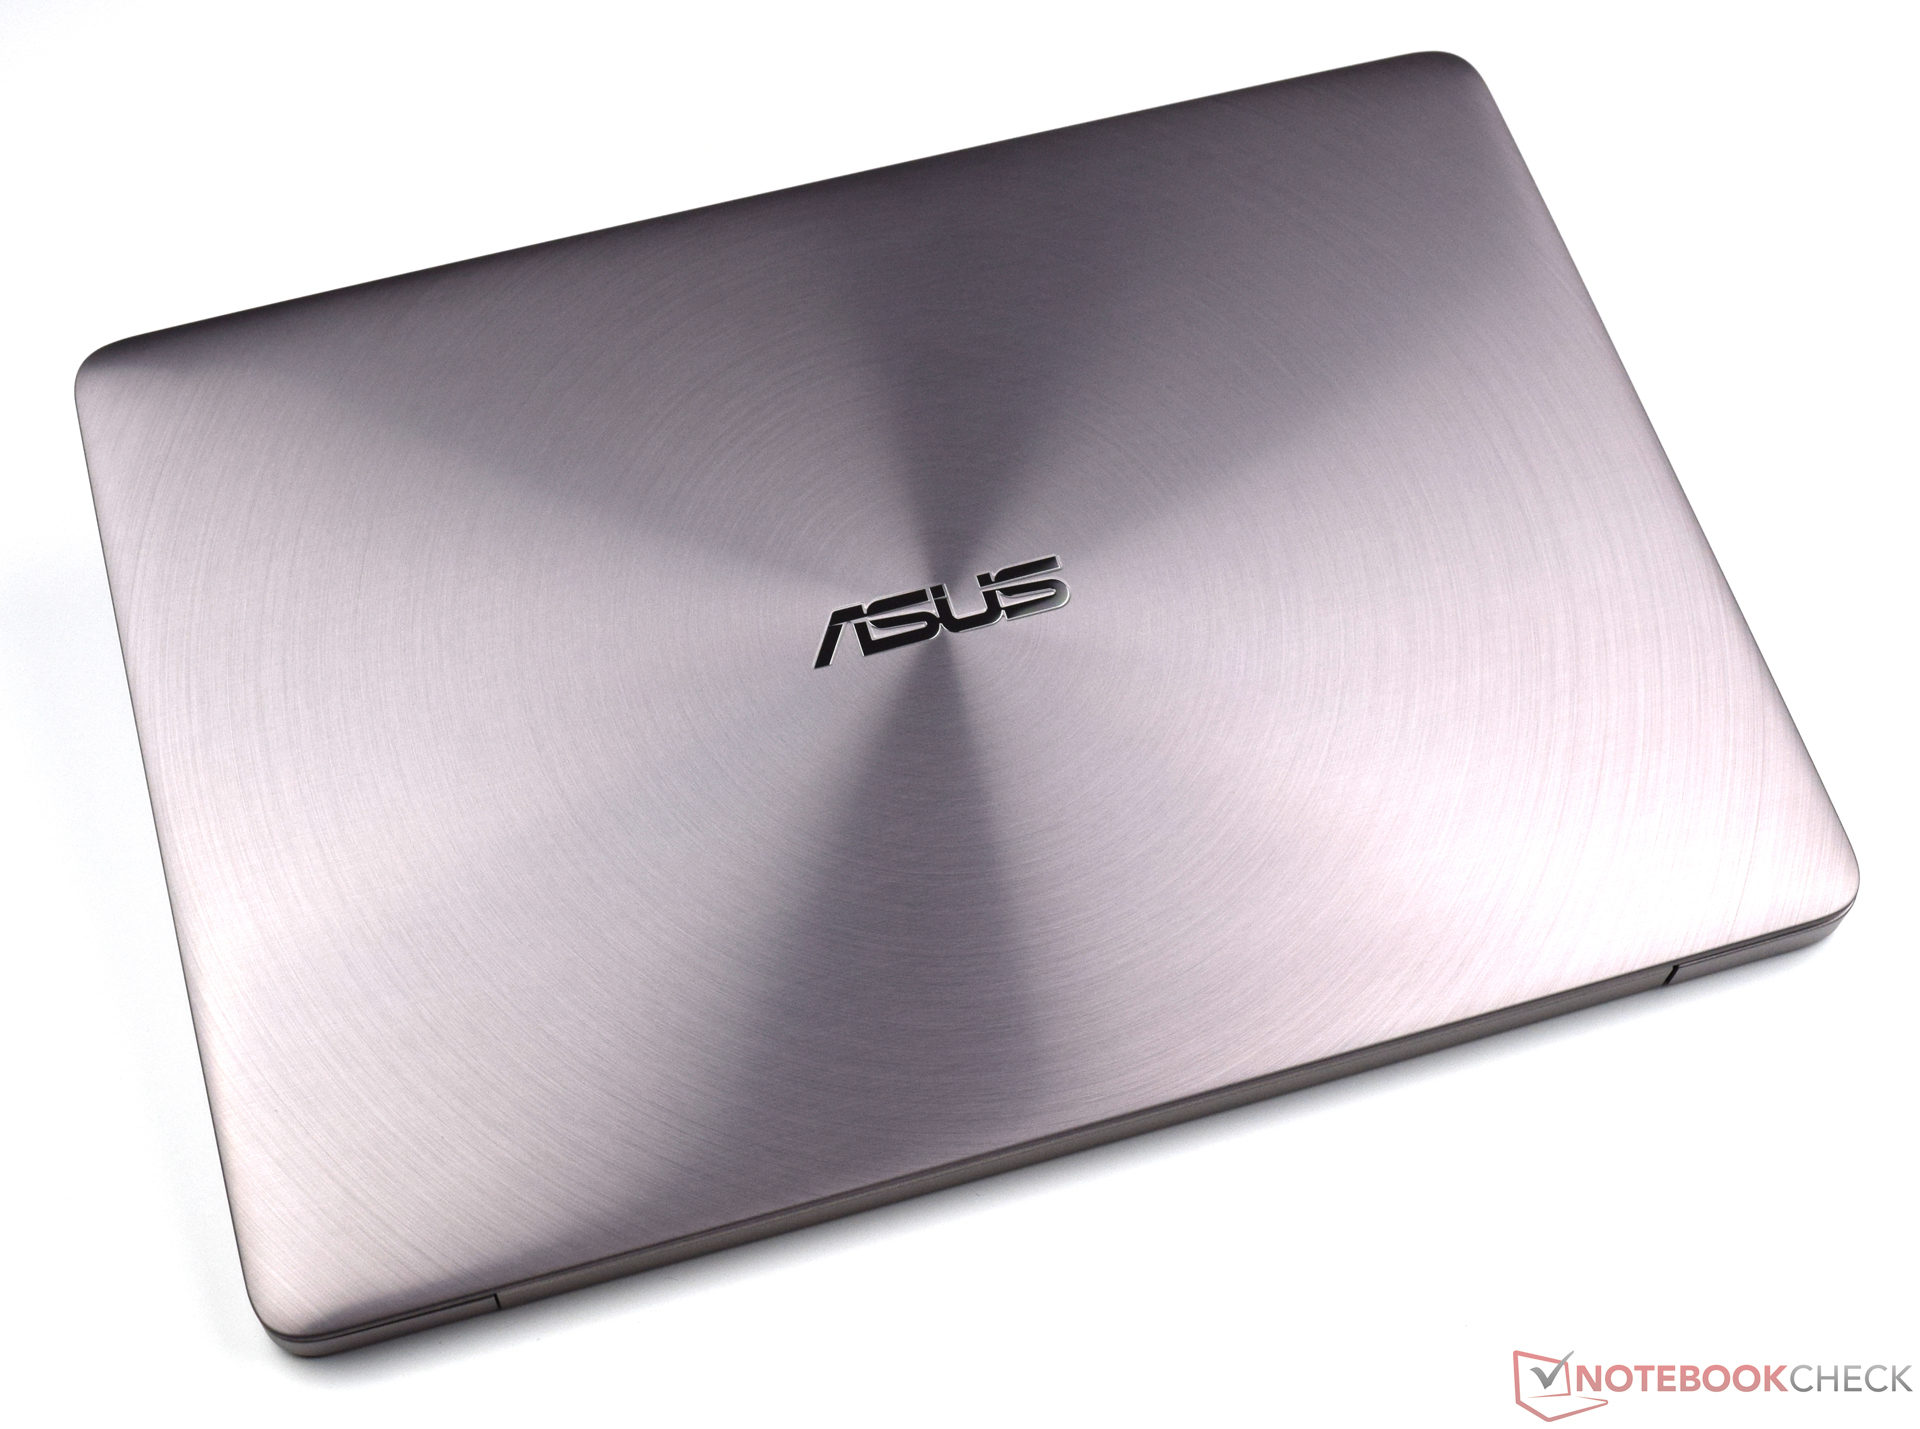
El delgado diseño con clase del Asus ZenBook UX310UQ-FC396T llama la atención, y está hecho de materiales de gran calidad. Ni el display ni el rendimiento de sistema deja mucho que desear.
En resumen, podemos confirmar que Asus ha vuelto a hacerlo: el ZenBook UX310UQ-FC396T ofrece mucho aguante de batería y suficientes reservas de rendimiento para mantenerse al día los próximos años. Su display ofrece buena calidad de imagen, y gracias a IPS, el contenido de la pantalla resulta estable desde casi cualquier ángulo. Un buen extra: El dispositivo que testamos viene con una funda a juego para proteger al portátil del polvo y los arañazos durante el transporte.
Ésta es una versión acortada del análisis original. Puedes leer el análisis completo en inglés aquí.
Asus UX310UQ-FC396T
- 02/24/2017 v6 (old)
Sebastian Bade