Breve análisis del portátil Dell XPS 13 9360 FHD i5
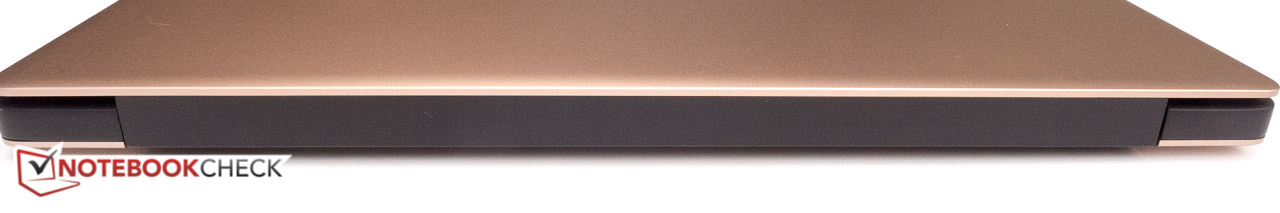
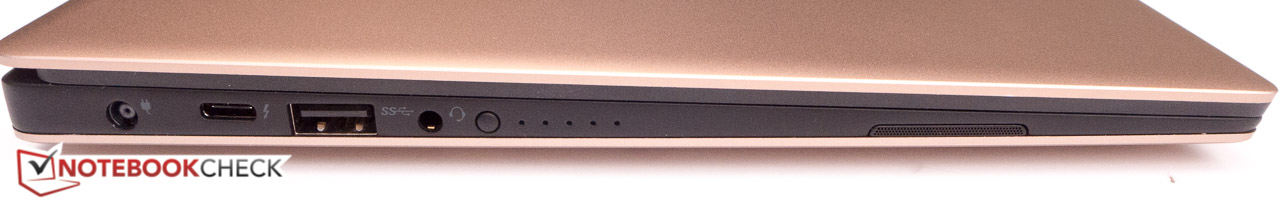

| SD Card Reader | |
| average JPG Copy Test (av. of 3 runs) | |
| Dell XPS 13 9360 QHD+ i7 | |
| Dell XPS 13 9360 FHD i5 | |
| Lenovo IdeaPad 710S-13ISK | |
| Asus Zenbook UX330UA-FC059T | |
| maximum AS SSD Seq Read Test (1GB) | |
| Dell XPS 13 9360 FHD i5 | |
| Dell XPS 13 9360 QHD+ i7 | |
| Lenovo IdeaPad 710S-13ISK | |
| Asus Zenbook UX330UA-FC059T | |
| |||||||||||||||||||||||||
iluminación: 89 %
Brillo con batería: 328 cd/m²
Contraste: 1801:1 (Negro: 0.195 cd/m²)
ΔE ColorChecker Calman: 7.4 | ∀{0.5-29.43 Ø4.73}
ΔE Greyscale Calman: 6.71 | ∀{0.09-98 Ø4.97}
73.31% sRGB (Argyll 1.6.3 3D)
50.48% AdobeRGB 1998 (Argyll 1.6.3 3D)
50.5% AdobeRGB 1998 (Argyll 3D)
73.3% sRGB (Argyll 3D)
48.94% Display P3 (Argyll 3D)
Gamma: 2.74
CCT: 7222 K
| Dell XPS 13 9360 FHD i5 Sharp SHP1449 LQ133M1, IPS, 13.3", 1920x1080 | Dell XPS 13 2016 9350 (FHD, i7-6560U) Sharp SHP1449 LQ133M1, IPS, 13.3", 1920x1080 | Asus Zenbook UX330UA-FC059T AU Optronics AUO272D / B133HAN02.7, IPS, 13.3", 1920x1080 | Dell XPS 13 9360 QHD+ i7 Sharp SHP144A, IPS, 13.3", 3200x1800 | Lenovo IdeaPad 710S-13ISK Sharp SHP 1447 / LQ133M1JW15, IPS, 13.3", 1920x1080 | HP Spectre 13 IPS UWVA, 13.3", 1920x1080 | Acer Aspire S 13 S5-371-71QZ AUO B133HAN04.1, IPS, 13.3", 1920x1080 | Razer Blade Stealth QHD i7-7500U Sharp SHP142F (LQ125T1JW02), , 12.5", 2560x1440 | |
|---|---|---|---|---|---|---|---|---|
| Display | 12% | 28% | 26% | 35% | 32% | 36% | ||
| Display P3 Coverage (%) | 48.94 | 54.8 12% | 64.2 31% | 62.8 28% | 66.4 36% | 65.6 34% | 68.7 40% | |
| sRGB Coverage (%) | 73.3 | 82.3 12% | 90.6 24% | 89.4 22% | 97.5 33% | 94.7 29% | 95.8 31% | |
| AdobeRGB 1998 Coverage (%) | 50.5 | 56.6 12% | 65.3 29% | 64.6 28% | 68.4 35% | 67.5 34% | 69.9 38% | |
| Response Times | -3% | 14% | -11% | -16% | -28% | -21% | -7% | |
| Response Time Grey 50% / Grey 80% * (ms) | 32.8 ? | 42.8 ? -30% | 32 ? 2% | 43.6 ? -33% | 52.4 ? -60% | 50.8 ? -55% | 50 ? -52% | 37 ? -13% |
| Response Time Black / White * (ms) | 33.2 ? | 24.8 ? 25% | 25 ? 25% | 29.2 ? 12% | 23.6 ? 29% | 33.2 ? -0% | 29.6 ? 11% | 33.4 ? -1% |
| PWM Frequency (Hz) | 200 ? | 220 ? | 200 ? | |||||
| Screen | 19% | 6% | 10% | -5% | 18% | -2% | 1% | |
| Brightness middle (cd/m²) | 351.2 | 385 10% | 360 3% | 396.2 13% | 344 -2% | 300.5 -14% | 375 7% | 402 14% |
| Brightness (cd/m²) | 325 | 350 8% | 337 4% | 357 10% | 326 0% | 305 -6% | 358 10% | 382 18% |
| Brightness Distribution (%) | 89 | 86 -3% | 86 -3% | 84 -6% | 87 -2% | 76 -15% | 87 -2% | 88 -1% |
| Black Level * (cd/m²) | 0.195 | 0.17 13% | 0.22 -13% | 0.266 -36% | 0.36 -85% | 0.184 6% | 0.39 -100% | 0.45 -131% |
| Contrast (:1) | 1801 | 2265 26% | 1636 -9% | 1489 -17% | 956 -47% | 1633 -9% | 962 -47% | 893 -50% |
| Colorchecker dE 2000 * | 7.4 | 4.17 44% | 5.21 30% | 3.9 47% | 6.09 18% | 2.64 64% | 4.6 38% | 3.6 51% |
| Colorchecker dE 2000 max. * | 9.08 | 7.61 16% | 8.85 3% | 7.58 17% | 10 -10% | 5.06 44% | 8.8 3% | 7.5 17% |
| Greyscale dE 2000 * | 6.71 | 5.39 20% | 6.23 7% | 4.16 38% | 5.36 20% | 2.8 58% | 4 40% | 4.3 36% |
| Gamma | 2.74 80% | 2.12 104% | 2.5 88% | 2.31 95% | 2.01 109% | 2.16 102% | 2.34 94% | 2.1 105% |
| CCT | 7222 90% | 7404 88% | 6506 100% | 6514 100% | 7230 90% | 6999 93% | 7304 89% | 6572 99% |
| Color Space (Percent of AdobeRGB 1998) (%) | 50.48 | 62.7 24% | 59 17% | 57.5 14% | 62.25 23% | 60.9 21% | 57.9 15% | 62.3 23% |
| Color Space (Percent of sRGB) (%) | 73.31 | 99.8 36% | 90 23% | 88.7 21% | 97.54 33% | 94.3 29% | 88.7 21% | 95.7 31% |
| Media total (Programa/Opciones) | 9% /
15% | 16% /
12% | 8% /
11% | 5% /
1% | 7% /
15% | -12% /
-5% | 10% /
7% |
* ... más pequeño es mejor
Tiempos de respuesta del display
| ↔ Tiempo de respuesta de Negro a Blanco | ||
|---|---|---|
| 33.2 ms ... subida ↗ y bajada ↘ combinada | ↗ 10.8 ms subida | 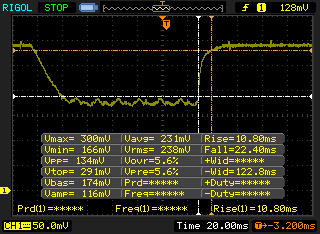 |
| ↘ 22.4 ms bajada | ||
| La pantalla mostró tiempos de respuesta lentos en nuestros tests y podría ser demasiado lenta para los jugones. En comparación, todos los dispositivos de prueba van de ##min### (mínimo) a 240 (máximo) ms. » 90 % de todos los dispositivos son mejores. Eso quiere decir que el tiempo de respuesta es peor que la media (19.9 ms) de todos los dispositivos testados. | ||
| ↔ Tiempo de respuesta 50% Gris a 80% Gris | ||
| 32.8 ms ... subida ↗ y bajada ↘ combinada | ↗ 16 ms subida | 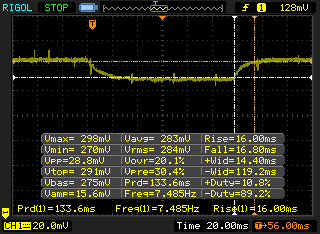 |
| ↘ 16.8 ms bajada | ||
| La pantalla mostró tiempos de respuesta lentos en nuestros tests y podría ser demasiado lenta para los jugones. En comparación, todos los dispositivos de prueba van de ##min### (mínimo) a 636 (máximo) ms. » 44 % de todos los dispositivos son mejores. Eso quiere decir que el tiempo de respuesta es similar al dispositivo testado medio (31.1 ms). | ||
Parpadeo de Pantalla / PWM (Pulse-Width Modulation)
| Parpadeo de Pantalla / PWM no detectado | 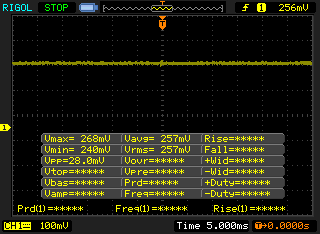 | ||
Comparación: 52 % de todos los dispositivos testados no usaron PWM para atenuar el display. Si se usó, medimos una media de 7784 (mínimo: 5 - máxmo: 343500) Hz. | |||
| Cinebench R10 | |
| Rendering Multiple CPUs 32Bit | |
| Dell XPS 13 9360 QHD+ i7 | |
| Dell XPS 13 9360 FHD i5 | |
| HP Spectre 13 | |
| Rendering Single 32Bit | |
| Dell XPS 13 9360 QHD+ i7 | |
| Dell XPS 13 9360 FHD i5 | |
| HP Spectre 13 | |
| wPrime 2.10 - 1024m | |
| Dell XPS 13 9360 QHD+ i5 | |
| HP Spectre 13 | |
| Dell XPS 13 9360 QHD+ i7 | |
| Super Pi Mod 1.5 XS 32M - 32M | |
| HP Spectre 13 | |
| Dell XPS 13 9360 FHD i5 | |
| Dell XPS 13 9360 QHD+ i7 | |
* ... más pequeño es mejor
| PCMark 8 Home Score Accelerated v2 | 3535 puntos | |
| PCMark 8 Creative Score Accelerated v2 | 4211 puntos | |
| PCMark 8 Work Score Accelerated v2 | 4568 puntos | |
ayuda | ||
| Dell XPS 13 9360 FHD i5 Toshiba NVMe THNSN5256GPUK | HP Spectre 13 Samsung PM951 NVMe MZVLV256 | Acer Aspire S 13 S5-371-71QZ LiteOn CV1-8B512 | Asus Zenbook UX330UA-FC059T SanDisk SD8SNAT256G1002 | Lenovo IdeaPad 710S-13ISK Samsung PM951 NVMe MZVLV256 | Razer Blade Stealth QHD i7-7500U Samsung PM951 NVMe MZVLV256 | Dell XPS 13 9360 QHD+ i7 Toshiba NVMe THNSN5256GPUK | |
|---|---|---|---|---|---|---|---|
| CrystalDiskMark 3.0 | -9% | -31% | -46% | -1% | -0% | 1% | |
| Read Seq (MB/s) | 1233 | 1322 7% | 502 -59% | 447.6 -64% | 1193 -3% | 1178 -4% | 1214 -2% |
| Write Seq (MB/s) | 733 | 305.5 -58% | 418.9 -43% | 309.4 -58% | 309.6 -58% | 305.4 -58% | 655 -11% |
| Read 512 (MB/s) | 1036 | 621 -40% | 341.3 -67% | 265.9 -74% | 613 -41% | 638 -38% | 1019 -2% |
| Write 512 (MB/s) | 439.9 | 306 -30% | 389.7 -11% | 275.2 -37% | 311 -29% | 305.7 -31% | 445.7 1% |
| Read 4k (MB/s) | 29.31 | 40.09 37% | 29.69 1% | 18.89 -36% | 42.43 45% | 38.54 31% | 35.55 21% |
| Write 4k (MB/s) | 116.9 | 119 2% | 86.8 -26% | 75.1 -36% | 144.9 24% | 153.4 31% | 130 11% |
| Read 4k QD32 (MB/s) | 479.2 | 513 7% | 301.3 -37% | 142.2 -70% | 549 15% | 614 28% | 537 12% |
| Write 4k QD32 (MB/s) | 218.3 | 231.5 6% | 211.2 -3% | 228.9 5% | 311.3 43% | 302.7 39% | 173.8 -20% |

| 3DMark | |
| 1280x720 Cloud Gate Standard Graphics | |
| Lenovo IdeaPad 710S-13ISK | |
| Dell XPS 13 2016 9350 (FHD, i7-6560U) | |
| Dell XPS 13 9360 FHD i5 | |
| Dell XPS 13 9360 QHD+ i7 | |
| Asus Zenbook UX330UA-FC059T | |
| HP Spectre 13 | |
| Dell XPS 13 9360 QHD+ i5 | |
| 1920x1080 Fire Strike Graphics | |
| Dell XPS 13 2016 9350 (FHD, i7-6560U) | |
| Dell XPS 13 9360 FHD i5 | |
| Dell XPS 13 9360 QHD+ i7 | |
| Dell XPS 13 9360 QHD+ i5 | |
| HP Spectre 13 | |
| 3DMark 11 Performance | 1699 puntos | |
| 3DMark Ice Storm Standard Score | 64297 puntos | |
| 3DMark Cloud Gate Standard Score | 6349 puntos | |
| 3DMark Fire Strike Score | 892 puntos | |
| 3DMark Fire Strike Extreme Score | 405 puntos | |
ayuda | ||
| Tomb Raider | |
| 1024x768 Low Preset (ordenar por valor) | |
| Dell XPS 13 9360 FHD i5 | |
| 1366x768 Normal Preset AA:FX AF:4x (ordenar por valor) | |
| Dell XPS 13 9360 FHD i5 | |
| 1366x768 High Preset AA:FX AF:8x (ordenar por valor) | |
| Dell XPS 13 9360 FHD i5 | |
| 1920x1080 Ultra Preset AA:FX AF:16x (ordenar por valor) | |
| Dell XPS 13 9360 FHD i5 | |
| bajo | medio | alto | ultra | |
|---|---|---|---|---|
| Tomb Raider (2013) | 83.8 | 42.6 | 25.9 | 12 |
| GRID 2 (2013) | 79.7 | 46.4 | 33.7 | 12.5 |
Ruido
| Ocioso |
| 28.9 / 28.9 / 28.9 dB(A) |
| Carga |
| 30.9 / 33.5 dB(A) |
 | ||
30 dB silencioso 40 dB(A) audible 50 dB(A) ruidosamente alto |
||
min: | ||
| Dell XPS 13 9360 FHD i5 HD Graphics 620, i5-7200U, Toshiba NVMe THNSN5256GPUK | HP Spectre 13 HD Graphics 520, 6500U, Samsung PM951 NVMe MZVLV256 | Acer Aspire S 13 S5-371-71QZ HD Graphics 520, 6500U, LiteOn CV1-8B512 | Asus Zenbook UX330UA-FC059T HD Graphics 520, 6500U, SanDisk SD8SNAT256G1002 | Lenovo IdeaPad 710S-13ISK Iris Graphics 540, 6560U, Samsung PM951 NVMe MZVLV256 | Razer Blade Stealth QHD i7-7500U HD Graphics 620, i7-7500U, Samsung PM951 NVMe MZVLV256 | Dell XPS 13 2016 9350 (FHD, i7-6560U) Iris Graphics 540, 6560U, Samsung PM951 NVMe MZ-VLV256D | Dell XPS 13 9360 QHD+ i5 HD Graphics 620, i5-7200U, Toshiba NVMe THNSN5256GPUK | |
|---|---|---|---|---|---|---|---|---|
| Noise | -13% | -10% | -14% | -11% | -11% | -9% | -8% | |
| Idle Minimum * (dB) | 28.9 | 28.5 1% | 31.2 -8% | 31.2 -8% | 30.1 -4% | 31 -7% | 30 -4% | 30.6 -6% |
| Idle Average * (dB) | 28.9 | 30.9 -7% | 31.2 -8% | 31.2 -8% | 30.1 -4% | 31 -7% | 30 -4% | 30.6 -6% |
| Idle Maximum * (dB) | 28.9 | 31.6 -9% | 31.5 -9% | 31.2 -8% | 30.1 -4% | 31 -7% | 30 -4% | 32.2 -11% |
| Load Average * (dB) | 30.9 | 38.8 -26% | 35.7 -16% | 37.4 -21% | 39.2 -27% | 35 -13% | 36.5 -18% | 32.2 -4% |
| Load Maximum * (dB) | 33.5 | 41.4 -24% | 35.8 -7% | 41.4 -24% | 39.3 -17% | 40.5 -21% | 38.3 -14% | 38.5 -15% |
| apagado / medio ambiente * (dB) | 28.5 | 31.2 | 31.2 | 29 | 31 | 30 | 30.3 |
* ... más pequeño es mejor
(±) La temperatura máxima en la parte superior es de 43.4 °C / 110 F, frente a la media de 35.9 °C / 97 F, que oscila entre 21.4 y 59 °C para la clase Subnotebook.
(-) El fondo se calienta hasta un máximo de 49.2 °C / 121 F, frente a la media de 39.2 °C / 103 F
(+) En reposo, la temperatura media de la parte superior es de 25.1 °C / 77# F, frente a la media del dispositivo de 30.8 °C / 87 F.
(+) El reposamanos y el panel táctil están a una temperatura inferior a la de la piel, con un máximo de 29.4 °C / 84.9 F y, por tanto, son fríos al tacto.
(±) La temperatura media de la zona del reposamanos de dispositivos similares fue de 28.2 °C / 82.8 F (-1.2 °C / -2.1 F).
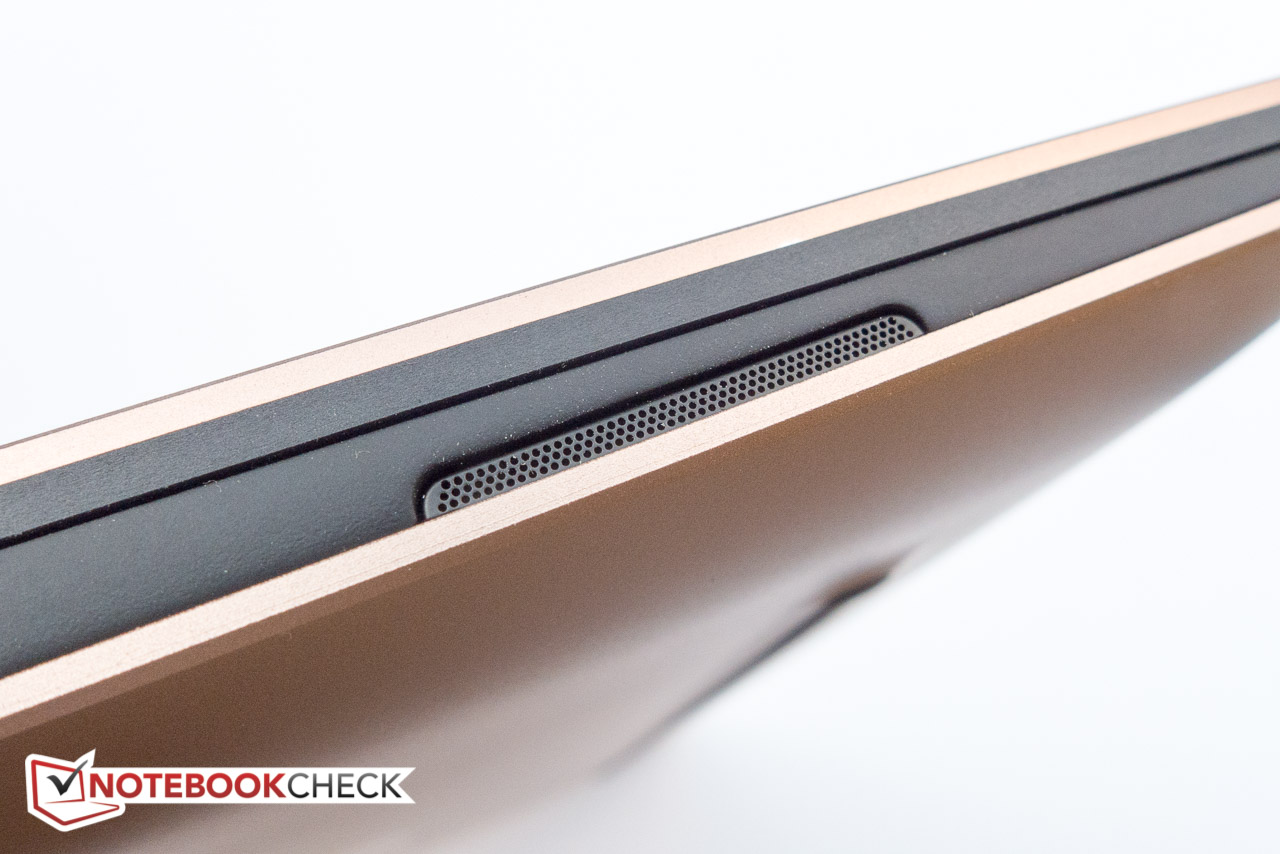
Dell XPS 13 9360 FHD i5 análisis de audio
(-) | altavoces no muy altos (#70.3 dB)
Graves 100 - 315 Hz
(±) | lubina reducida - en promedio 6.9% inferior a la mediana
(±) | la linealidad de los graves es media (10.5% delta a frecuencia anterior)
Medios 400 - 2000 Hz
(+) | medios equilibrados - a sólo 3.7% de la mediana
(+) | los medios son lineales (4% delta a la frecuencia anterior)
Altos 2 - 16 kHz
(+) | máximos equilibrados - a sólo 2% de la mediana
(±) | la linealidad de los máximos es media (10.3% delta a frecuencia anterior)
Total 100 - 16.000 Hz
(±) | la linealidad del sonido global es media (18.3% de diferencia con la mediana)
En comparación con la misma clase
» 53% de todos los dispositivos probados de esta clase eran mejores, 7% similares, 40% peores
» El mejor tuvo un delta de 5%, la media fue 18%, el peor fue ###max##%
En comparación con todos los dispositivos probados
» 40% de todos los dispositivos probados eran mejores, 8% similares, 52% peores
» El mejor tuvo un delta de 4%, la media fue 24%, el peor fue ###max##%
Apple MacBook 12 (Early 2016) 1.1 GHz análisis de audio
(+) | los altavoces pueden reproducir a un volumen relativamente alto (#83.6 dB)
Graves 100 - 315 Hz
(±) | lubina reducida - en promedio 11.3% inferior a la mediana
(±) | la linealidad de los graves es media (14.2% delta a frecuencia anterior)
Medios 400 - 2000 Hz
(+) | medios equilibrados - a sólo 2.4% de la mediana
(+) | los medios son lineales (5.5% delta a la frecuencia anterior)
Altos 2 - 16 kHz
(+) | máximos equilibrados - a sólo 2% de la mediana
(+) | los máximos son lineales (4.5% delta a la frecuencia anterior)
Total 100 - 16.000 Hz
(+) | el sonido global es lineal (10.2% de diferencia con la mediana)
En comparación con la misma clase
» 7% de todos los dispositivos probados de esta clase eran mejores, 2% similares, 91% peores
» El mejor tuvo un delta de 5%, la media fue 18%, el peor fue ###max##%
En comparación con todos los dispositivos probados
» 5% de todos los dispositivos probados eran mejores, 1% similares, 94% peores
» El mejor tuvo un delta de 4%, la media fue 24%, el peor fue ###max##%
| Off / Standby | |
| Ocioso | |
| Carga |
|
Clave:
min: | |
| Dell XPS 13 9360 FHD i5 i5-7200U, HD Graphics 620, Toshiba NVMe THNSN5256GPUK, IPS, 1920x1080, 13.3" | HP Spectre 13 6500U, HD Graphics 520, Samsung PM951 NVMe MZVLV256, IPS UWVA, 1920x1080, 13.3" | Acer Aspire S 13 S5-371-71QZ 6500U, HD Graphics 520, LiteOn CV1-8B512, IPS, 1920x1080, 13.3" | Asus Zenbook UX330UA-FC059T 6500U, HD Graphics 520, SanDisk SD8SNAT256G1002, IPS, 1920x1080, 13.3" | Lenovo IdeaPad 710S-13ISK 6560U, Iris Graphics 540, Samsung PM951 NVMe MZVLV256, IPS, 1920x1080, 13.3" | Razer Blade Stealth QHD i7-7500U i7-7500U, HD Graphics 620, Samsung PM951 NVMe MZVLV256, , 2560x1440, 12.5" | Dell XPS 13 9360 QHD+ i7 i7-7500U, HD Graphics 620, Toshiba NVMe THNSN5256GPUK, IPS, 3200x1800, 13.3" | Dell XPS 13 2016 9350 (FHD, i7-6560U) 6560U, Iris Graphics 540, Samsung PM951 NVMe MZ-VLV256D, IPS, 1920x1080, 13.3" | Dell XPS 13 9360 QHD+ i5 i5-7200U, HD Graphics 620, Toshiba NVMe THNSN5256GPUK, , 3200x1800, 13.3" | |
|---|---|---|---|---|---|---|---|---|---|
| Power Consumption | -94% | -32% | -28% | -46% | -50% | -36% | -46% | -21% | |
| Idle Minimum * (Watt) | 4.1 | 8.6 -110% | 4.1 -0% | 3 27% | 3.3 20% | 4.4 -7% | 6.4 -56% | 5.8 -41% | 3.7 10% |
| Idle Average * (Watt) | 4.2 | 11 -162% | 6.7 -60% | 6.3 -50% | 7.4 -76% | 5.8 -38% | 6.6 -57% | 7.3 -74% | 6.1 -45% |
| Idle Maximum * (Watt) | 5.1 | 11.3 -122% | 7.4 -45% | 7.5 -47% | 8.2 -61% | 8.6 -69% | 6.8 -33% | 8.5 -67% | 6.5 -27% |
| Load Average * (Watt) | 22.1 | 33.8 -53% | 32.4 -47% | 36 -63% | 36.5 -65% | 35.2 -59% | 27.5 -24% | 30.6 -38% | 29.5 -33% |
| Load Maximum * (Watt) | 29.4 | 36.2 -23% | 32.4 -10% | 31.5 -7% | 43.7 -49% | 52 -77% | 32.4 -10% | 32.5 -11% | 33 -12% |
* ... más pequeño es mejor
| Dell XPS 13 9360 FHD i5 i5-7200U, HD Graphics 620, 60 Wh | HP Spectre 13 6500U, HD Graphics 520, 38 Wh | Acer Aspire S 13 S5-371-71QZ 6500U, HD Graphics 520, 45 Wh | Asus Zenbook UX330UA-FC059T 6500U, HD Graphics 520, 57 Wh | Lenovo IdeaPad 710S-13ISK 6560U, Iris Graphics 540, 46 Wh | Razer Blade Stealth QHD i7-7500U i7-7500U, HD Graphics 620, 53.6 Wh | Dell XPS 13 9360 QHD+ i7 i7-7500U, HD Graphics 620, 60 Wh | Dell XPS 13 9360 QHD+ i5 i5-7200U, HD Graphics 620, 60 Wh | |
|---|---|---|---|---|---|---|---|---|
| Duración de Batería | -48% | -29% | -14% | -39% | -32% | -19% | -17% | |
| Reader / Idle (h) | 21.6 | 11.9 -45% | 17.1 -21% | 20.4 -6% | 13.5 -37% | 13.6 -37% | 17.6 -19% | |
| WiFi v1.3 (h) | 11.3 | 5.6 -50% | 7.9 -30% | 10.2 -10% | 7 -38% | 8.3 -27% | 8.6 -24% | 8.8 -22% |
| Load (h) | 2.6 | 1.3 -50% | 1.7 -35% | 1.9 -27% | 1.5 -42% | 1.8 -31% | 2.2 -15% | 2.3 -12% |
Pro
Contra
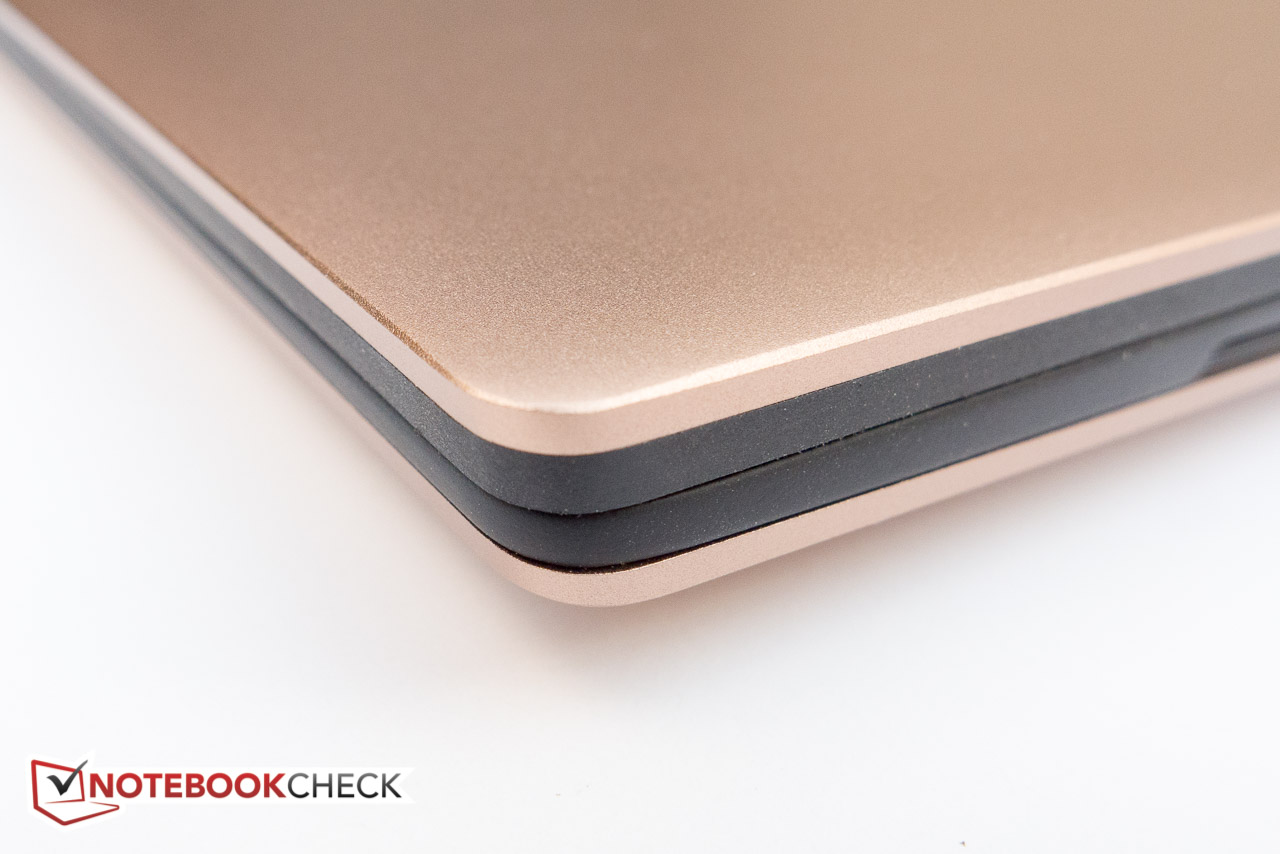
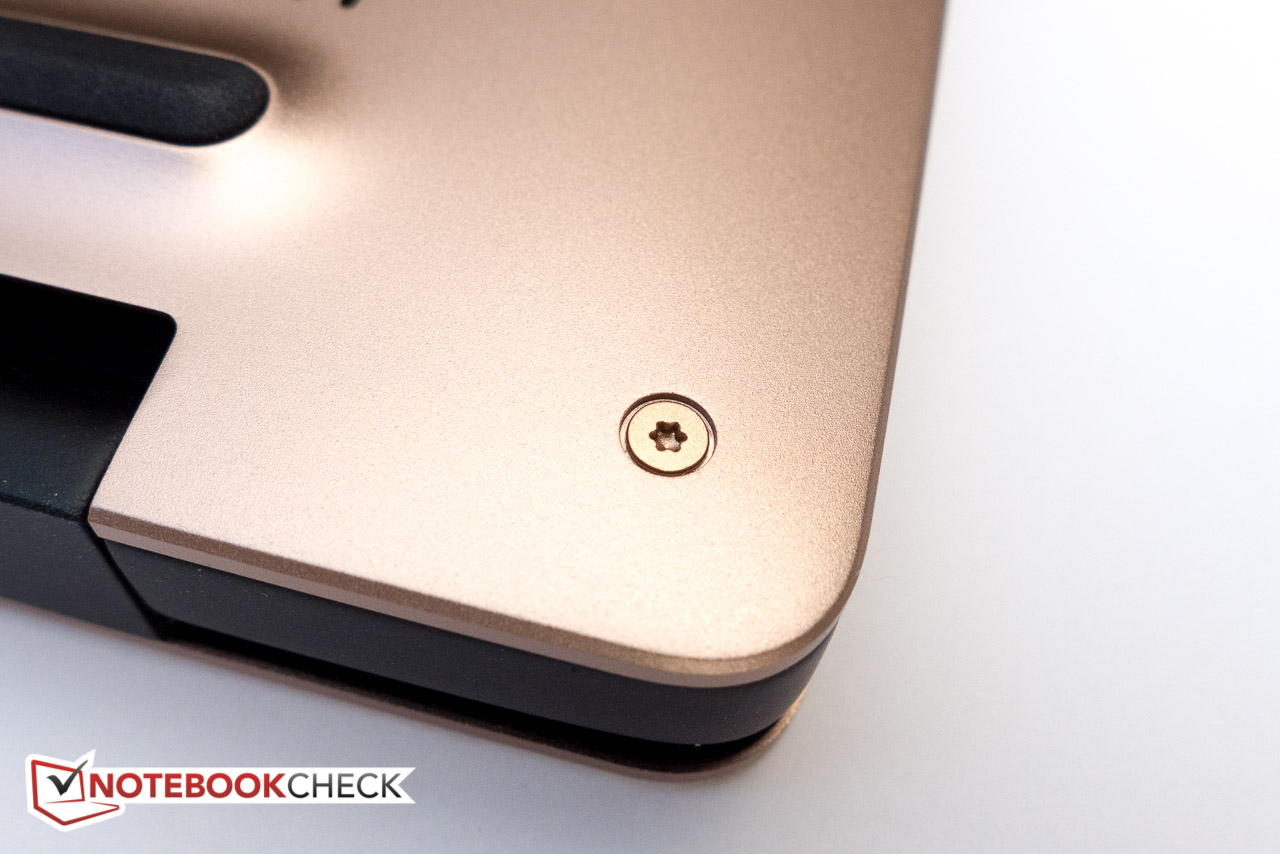
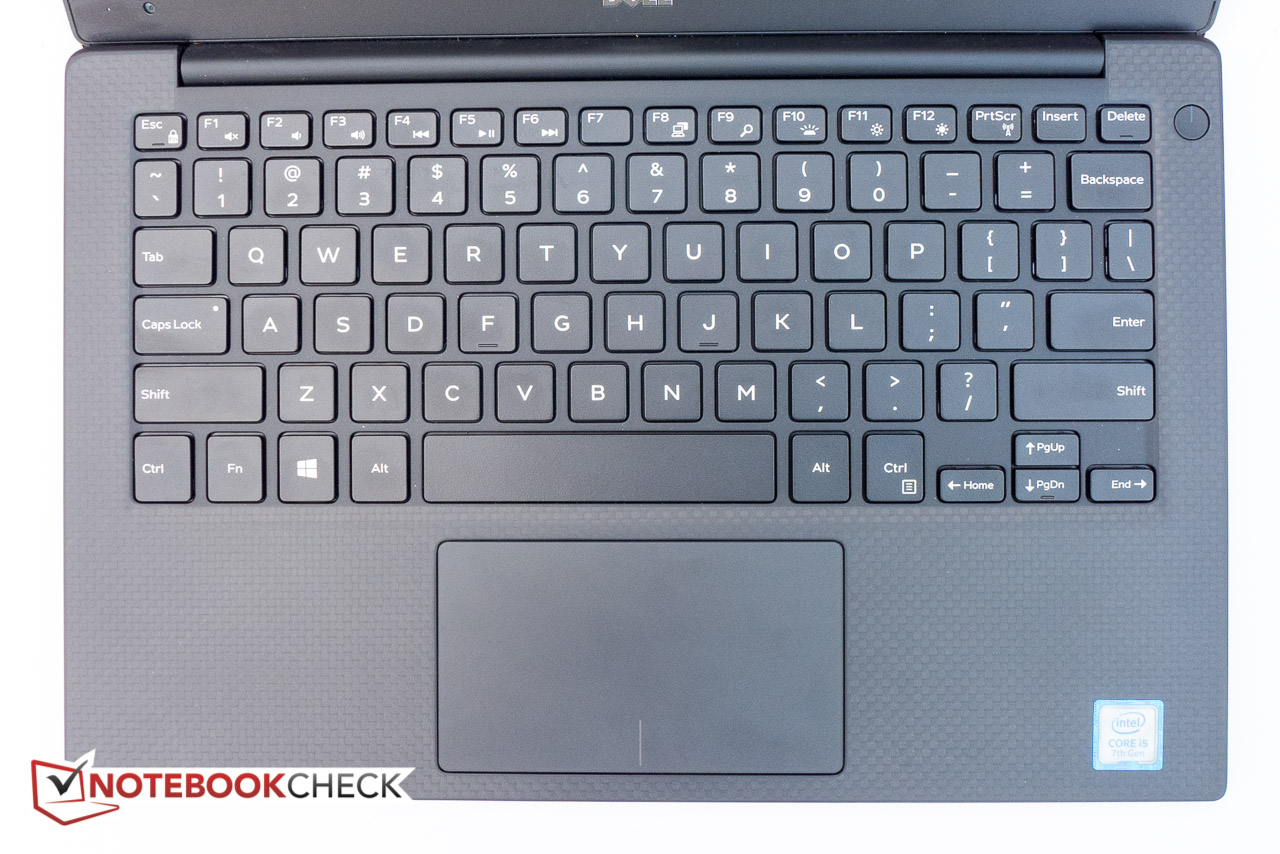
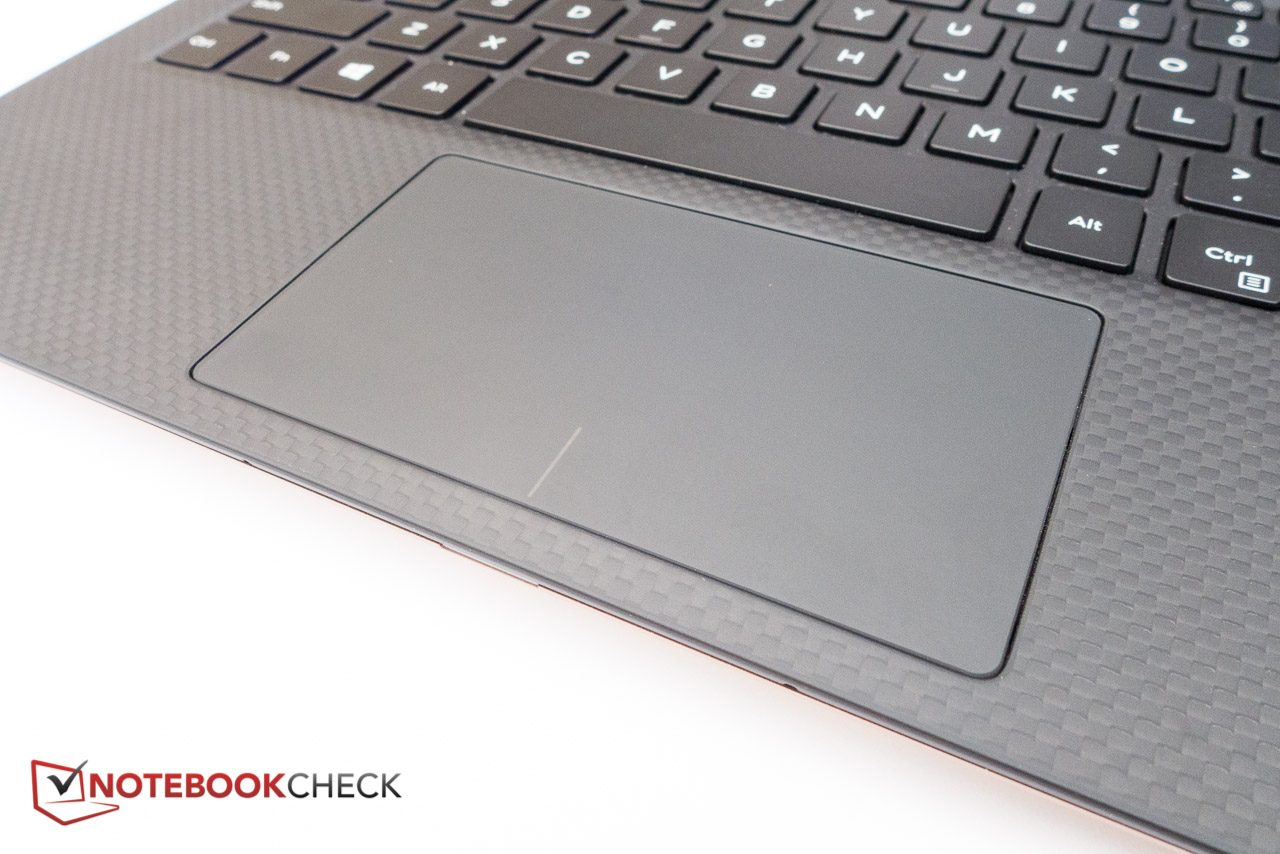
El Dell XPS 13 9360 con pantalla FHD y procesador i5 de séptima generación toma el testigo donde lo dejo su predecesor. El chipset Kaby Lake rinde como esperábamos, el funcionamiento es fluido y rápido y el portátil se mantiene en silencio en casi todos los escenarios. El nuevo procesador i5 rinde más o menos a la par que los i7 de la generación previa (Skylake). Actualizar a la nueva CPU i7 por 200 euros no proporciona mucho rendimiento extra - especialmente porque la GPU Intel Iris no está incluida en la actualización. Para la mayoría de los usuarios. la configuración analizada con i5-7200U, 8 GB de RAM y 256 GB de SSD es la más adecuada. Actualizar a la pantalla QHD+ solo tendría sentido para aquellos que deseen una resolución mucho más alta y quieran pantalla táctil - nosotros estamos muy satisfechos con la pantalla Full HD. Con una duración de batería real que casi alcanza las 12 horas, dobla a algunos modelos de la competencia. Nuestras quejas son mejores: nos habría gustado una pantalla con mayor precisión de color y más brillante, el sistema puede calentarse mucho bajo mucha carga de trabajo, y nuestro modelo de prueba a veces emitía un chisporroteo. También la situación de la webcam en la parte inferior izquierda de la pantalla puede resultar molesta a algunos usuarios.
El XPS 13 acierta en casi todos los aspectos importantes. La pantalla puede no estar a la par con los mejores ultraportátiles de la competencia, pero es una queja menor.
Los otros sistemas en nuestro análisis son todos -cada uno a su manera - grandes elecciones. A pesar de que ya está en su cuarta generación, el XPS 13 resulta único con su marco ultra fino y el equilibrio entre portabilidad, diseño, potencia y valor. Se encuentra en los puestos más altos de su categoría.
Ésta es una versión acortada del análisis original. Puedes leer el análisis completo en inglés aquí.
Dell XPS 13 9360 FHD i5
- 12/07/2016 v6 (old)
Bernhard Pechlaner
Price comparison
