Breve análisis del portátil Asus Zenbook UX310UQ-GL011T
| SD Card Reader | |
| average JPG Copy Test (av. of 3 runs) | |
| Lenovo Yoga 710-14ISK | |
| HP Pavilion 14-al003ng | |
| Lenovo ThinkPad T460p-20FXS05500 | |
| Asus Zenbook UX310UQ-GL011T | |
| Asus Zenbook UX330UA-FC059T | |
| maximum AS SSD Seq Read Test (1GB) | |
| Lenovo Yoga 710-14ISK | |
| Lenovo ThinkPad T460p-20FXS05500 | |
| HP Pavilion 14-al003ng | |
| Asus Zenbook UX310UQ-GL011T | |
| Asus Zenbook UX330UA-FC059T | |
| Networking | |
| iperf Server (receive) TCP 1 m | |
| Asus Zenbook UX310UQ-GL011T (jseb) | |
| Asus Zenbook UX330UA-FC059T | |
| Asus Zenbook UX360UA-C4159T | |
| HP Spectre x2 12-a001ng | |
| iperf Client (transmit) TCP 1 m | |
| Asus Zenbook UX310UQ-GL011T (jseb) | |
| Asus Zenbook UX360UA-C4159T | |
| Asus Zenbook UX330UA-FC059T (jseb) | |
| HP Spectre x2 12-a001ng | |
| |||||||||||||||||||||||||
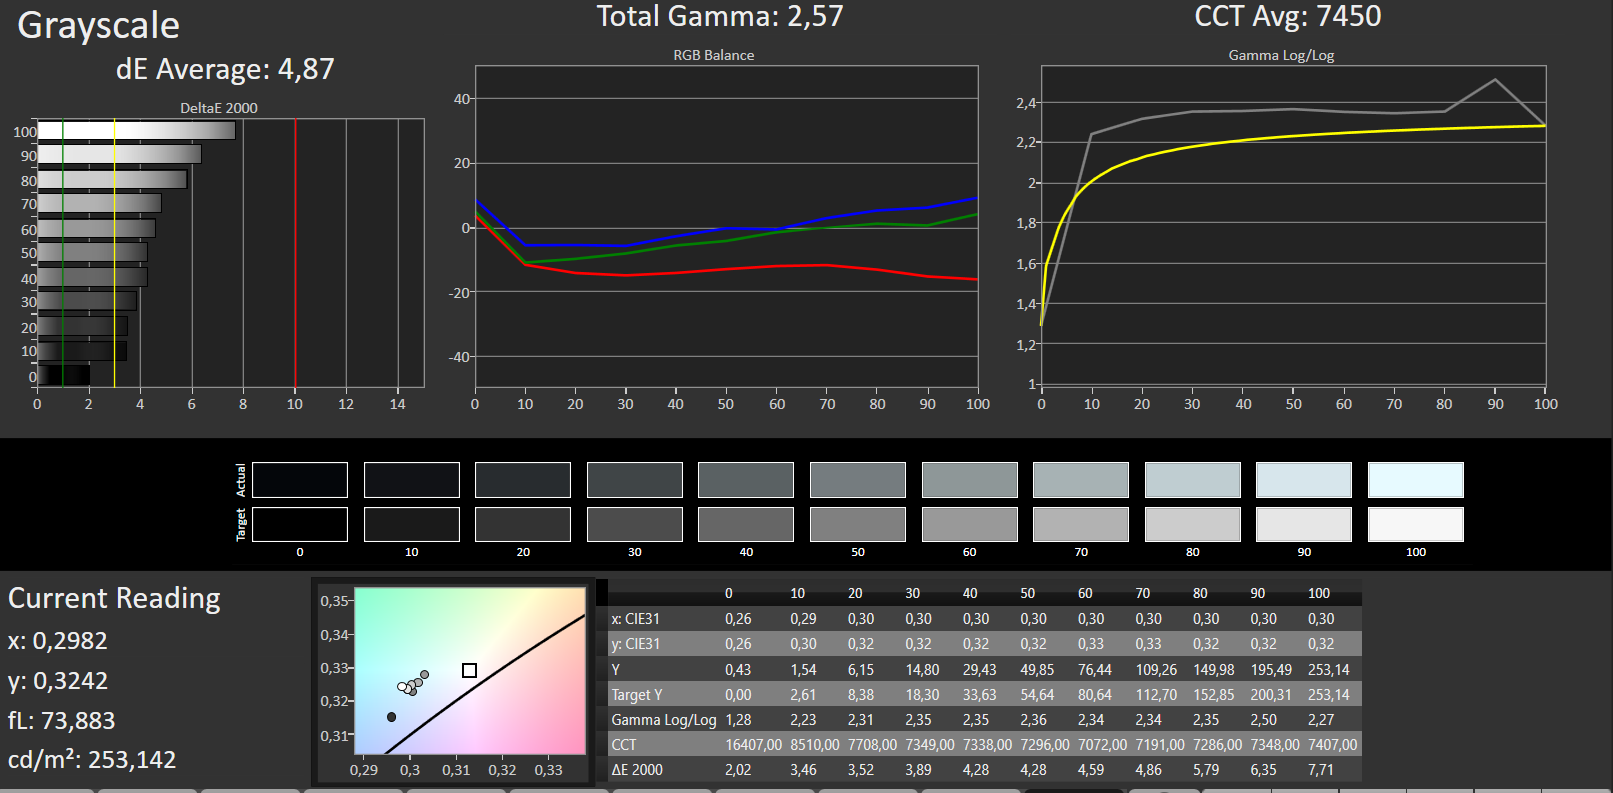
iluminación: 90 %
Brillo con batería: 247 cd/m²
Contraste: 574:1 (Negro: 0.43 cd/m²)
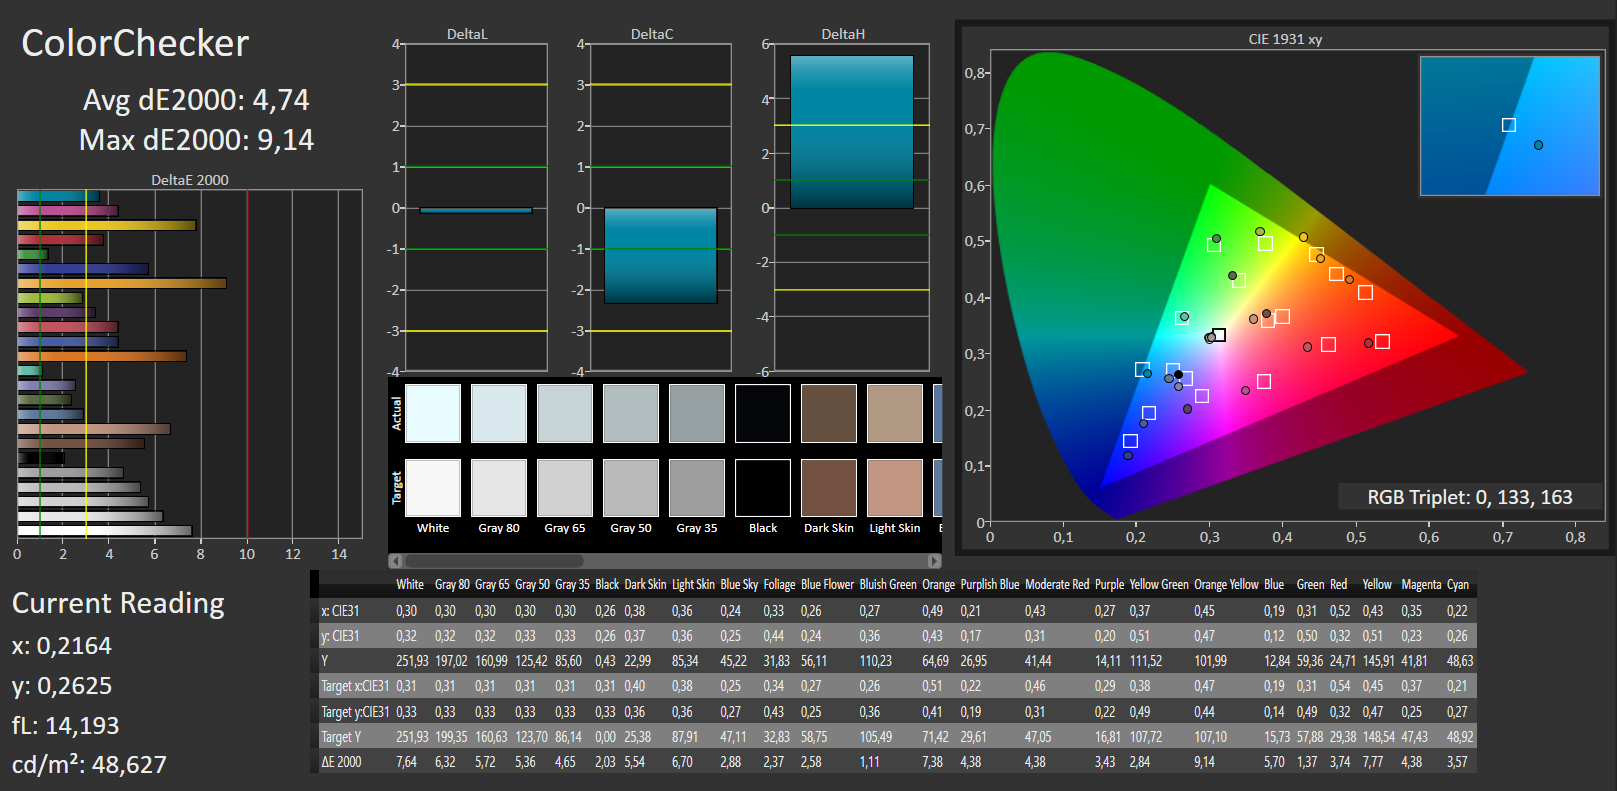
ΔE ColorChecker Calman: 4.74 | ∀{0.5-29.43 Ø4.71}
ΔE Greyscale Calman: 4.87 | ∀{0.09-98 Ø4.96}
88% sRGB (Argyll 1.6.3 3D)
57% AdobeRGB 1998 (Argyll 1.6.3 3D)
63% AdobeRGB 1998 (Argyll 3D)
88.3% sRGB (Argyll 3D)
61.9% Display P3 (Argyll 3D)
Gamma: 2.57
CCT: 7450 K
| Asus Zenbook UX310UQ-GL011T TN LED, 1920x1080, 13.3" | Lenovo Yoga 710-14ISK a-Si WLED TFT, IPS, 1920x1080, 14" | Xiaomi Mi Notebook Air 13.3 2016 IPS, 1920x1080, 13.3" | Lenovo ThinkPad T460p-20FXS05500 IPS-Panel, 2560x1440, 14" | HP Pavilion 14-al003ng LED IPS, 1920x1080, 14" | |
|---|---|---|---|---|---|
| Display | 8% | 9% | |||
| Display P3 Coverage (%) | 61.9 | 66 7% | 66.9 8% | ||
| sRGB Coverage (%) | 88.3 | 95.5 8% | 96.5 9% | ||
| AdobeRGB 1998 Coverage (%) | 63 | 67.8 8% | 68.8 9% | ||
| Response Times | -10% | -20% | -1% | 1% | |
| Response Time Grey 50% / Grey 80% * (ms) | 39 ? | 35 ? 10% | 49 ? -26% | 38.4 ? 2% | 36.4 ? 7% |
| Response Time Black / White * (ms) | 24 ? | 31 ? -29% | 27 ? -13% | 24.8 ? -3% | 25.2 ? -5% |
| PWM Frequency (Hz) | 50 ? | 50 ? | 50 ? | 220 | |
| Screen | 6% | 35% | 17% | -0% | |
| Brightness middle (cd/m²) | 247 | 325 32% | 347 40% | 290 17% | 220 -11% |
| Brightness (cd/m²) | 240 | 298 24% | 334 39% | 280 17% | 209 -13% |
| Brightness Distribution (%) | 90 | 88 -2% | 80 -11% | 93 3% | 88 -2% |
| Black Level * (cd/m²) | 0.43 | 0.35 19% | 0.27 37% | 0.31 28% | 0.28 35% |
| Contrast (:1) | 574 | 929 62% | 1285 124% | 935 63% | 786 37% |
| Colorchecker dE 2000 * | 4.74 | 6.2 -31% | 3.29 31% | 3.88 18% | 4.58 3% |
| Colorchecker dE 2000 max. * | 9.14 | 10.82 -18% | 4.69 49% | 8.19 10% | 11.47 -25% |
| Greyscale dE 2000 * | 4.87 | 6.32 -30% | 3.62 26% | 5.47 -12% | 2.34 52% |
| Gamma | 2.57 86% | 2.3 96% | 2.23 99% | 2.33 94% | 2.26 97% |
| CCT | 7450 87% | 6926 94% | 7307 89% | 6469 100% | 6661 98% |
| Color Space (Percent of AdobeRGB 1998) (%) | 57 | 58 2% | 62 9% | 63.3 11% | 34.6 -39% |
| Color Space (Percent of sRGB) (%) | 88 | 90 2% | 95 8% | 96.64 10% | 54.2 -38% |
| Media total (Programa/Opciones) | -2% /
3% | 8% /
22% | 8% /
13% | 1% /
0% |
* ... más pequeño es mejor
Tiempos de respuesta del display
| ↔ Tiempo de respuesta de Negro a Blanco | ||
|---|---|---|
| 24 ms ... subida ↗ y bajada ↘ combinada | ↗ 7 ms subida | 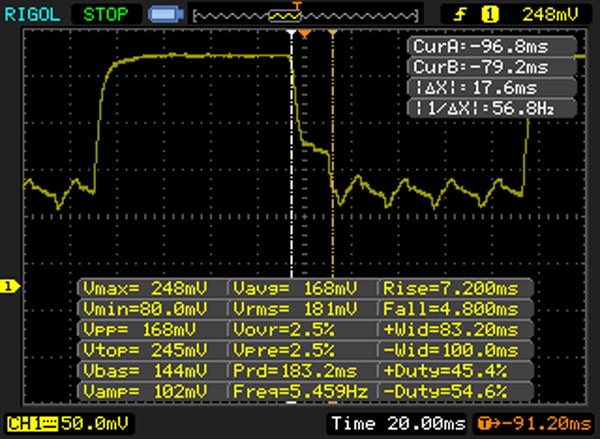 |
| ↘ 17 ms bajada | ||
| La pantalla mostró buenos tiempos de respuesta en nuestros tests pero podría ser demasiado lenta para los jugones competitivos. En comparación, todos los dispositivos de prueba van de ##min### (mínimo) a 240 (máximo) ms. » 54 % de todos los dispositivos son mejores. Eso quiere decir que el tiempo de respuesta es peor que la media (19.8 ms) de todos los dispositivos testados. | ||
| ↔ Tiempo de respuesta 50% Gris a 80% Gris | ||
| 39 ms ... subida ↗ y bajada ↘ combinada | ↗ 20 ms subida | 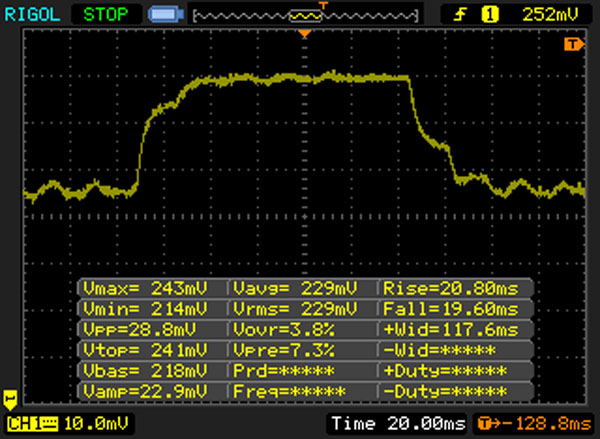 |
| ↘ 19 ms bajada | ||
| La pantalla mostró tiempos de respuesta lentos en nuestros tests y podría ser demasiado lenta para los jugones. En comparación, todos los dispositivos de prueba van de ##min### (mínimo) a 636 (máximo) ms. » 59 % de todos los dispositivos son mejores. Eso quiere decir que el tiempo de respuesta es peor que la media (31 ms) de todos los dispositivos testados. | ||
Parpadeo de Pantalla / PWM (Pulse-Width Modulation)
| Parpadeo de Pantalla / PWM detectado | 50 Hz | ≤ 30 % de brillo | 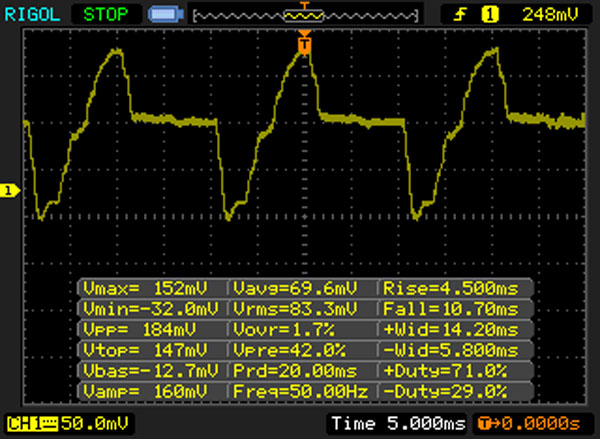 |
La retroiluminación del display parpadea a 50 Hz (seguramente usa PWM - Pulse-Width Modulation) a un brillo del 30 % e inferior. Sobre este nivel de brillo no debería darse parpadeo / PWM. La frecuencia de 50 Hz es bajísima, por lo que el parpadeo puede causar fatiga visual y cefaleas cuando se usa mucho tiempo. Comparación: 52 % de todos los dispositivos testados no usaron PWM para atenuar el display. Si se usó, medimos una media de 7757 (mínimo: 5 - máxmo: 343500) Hz. | |||
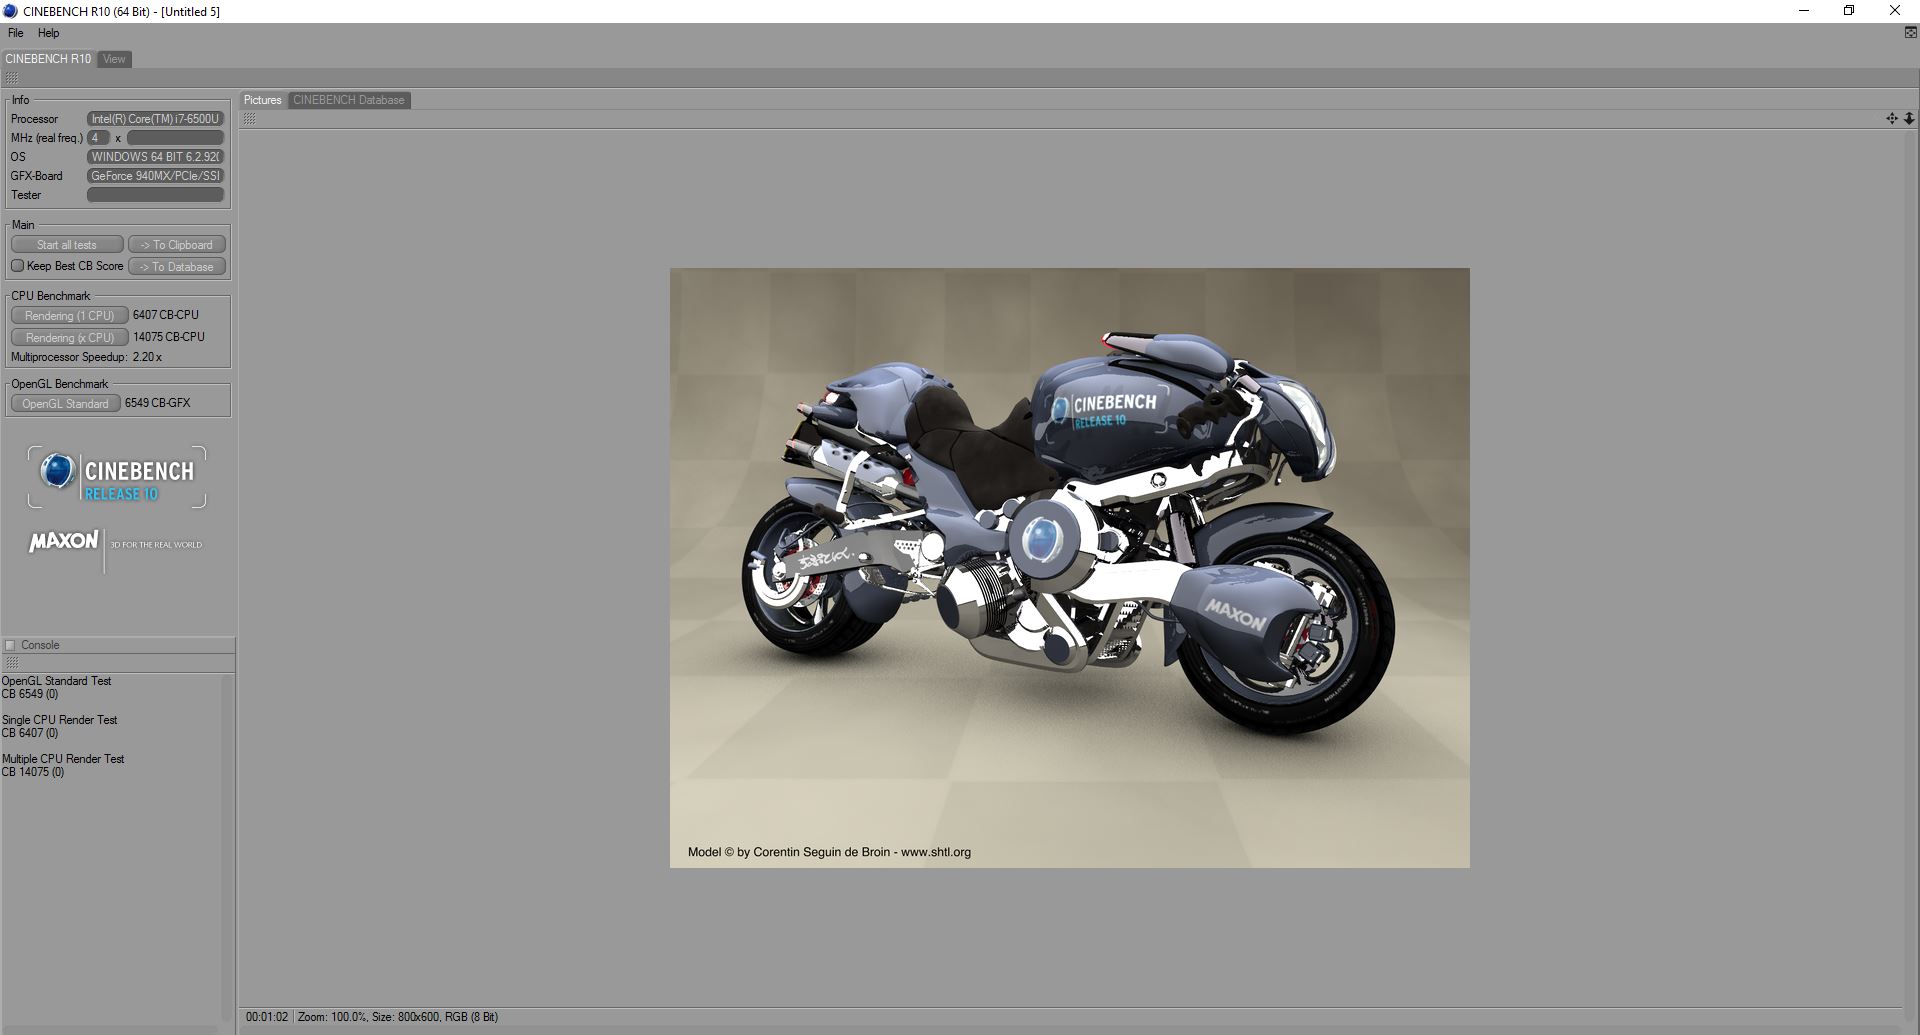
| Cinebench R10 | |
| Rendering Single CPUs 64Bit | |
| Asus Zenbook UX310UQ-GL011T | |
| Lenovo Yoga 710-14ISK | |
| Rendering Multiple CPUs 64Bit | |
| Asus Zenbook UX310UQ-GL011T | |
| Lenovo Yoga 710-14ISK | |
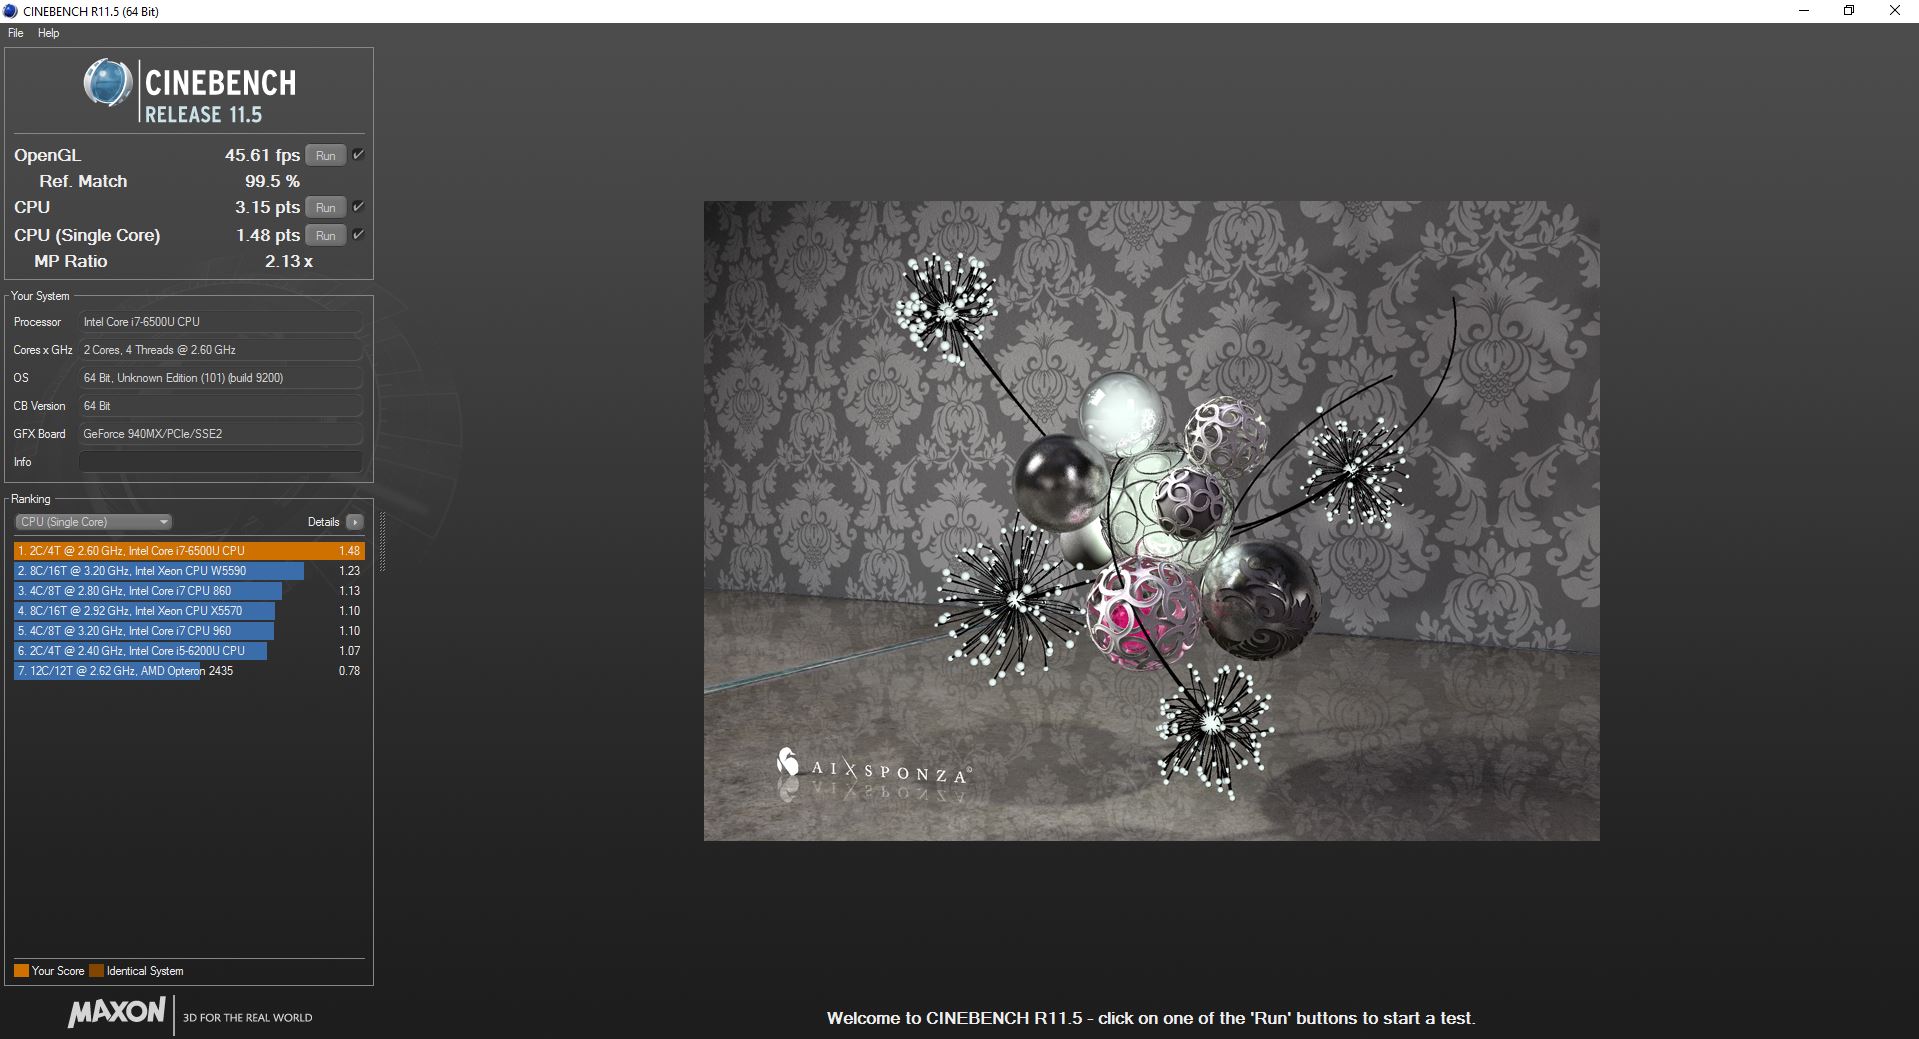
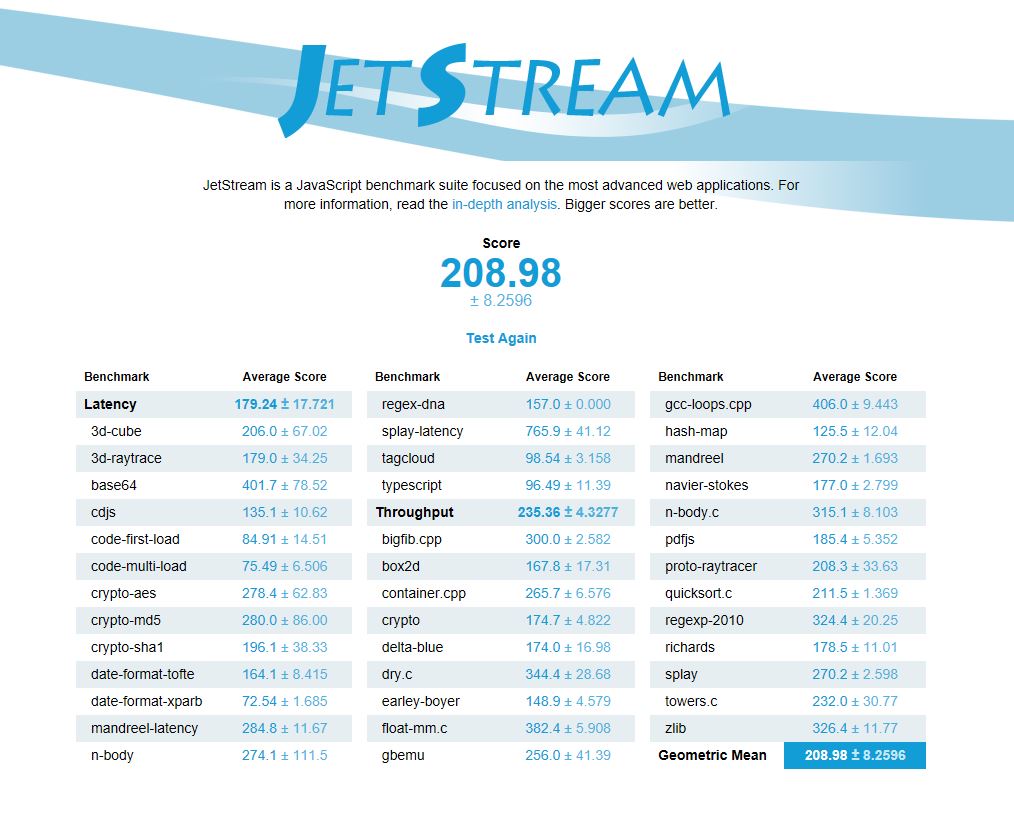
| JetStream 1.1 - 1.1 Total | |
| Lenovo ThinkPad T460p-20FXS05500 | |
| Asus Zenbook UX310UQ-GL011T | |
| HP Pavilion 14-al003ng | |
| Xiaomi Mi Notebook Air 13.3 2016 | |
| Lenovo Yoga 710-14ISK | |
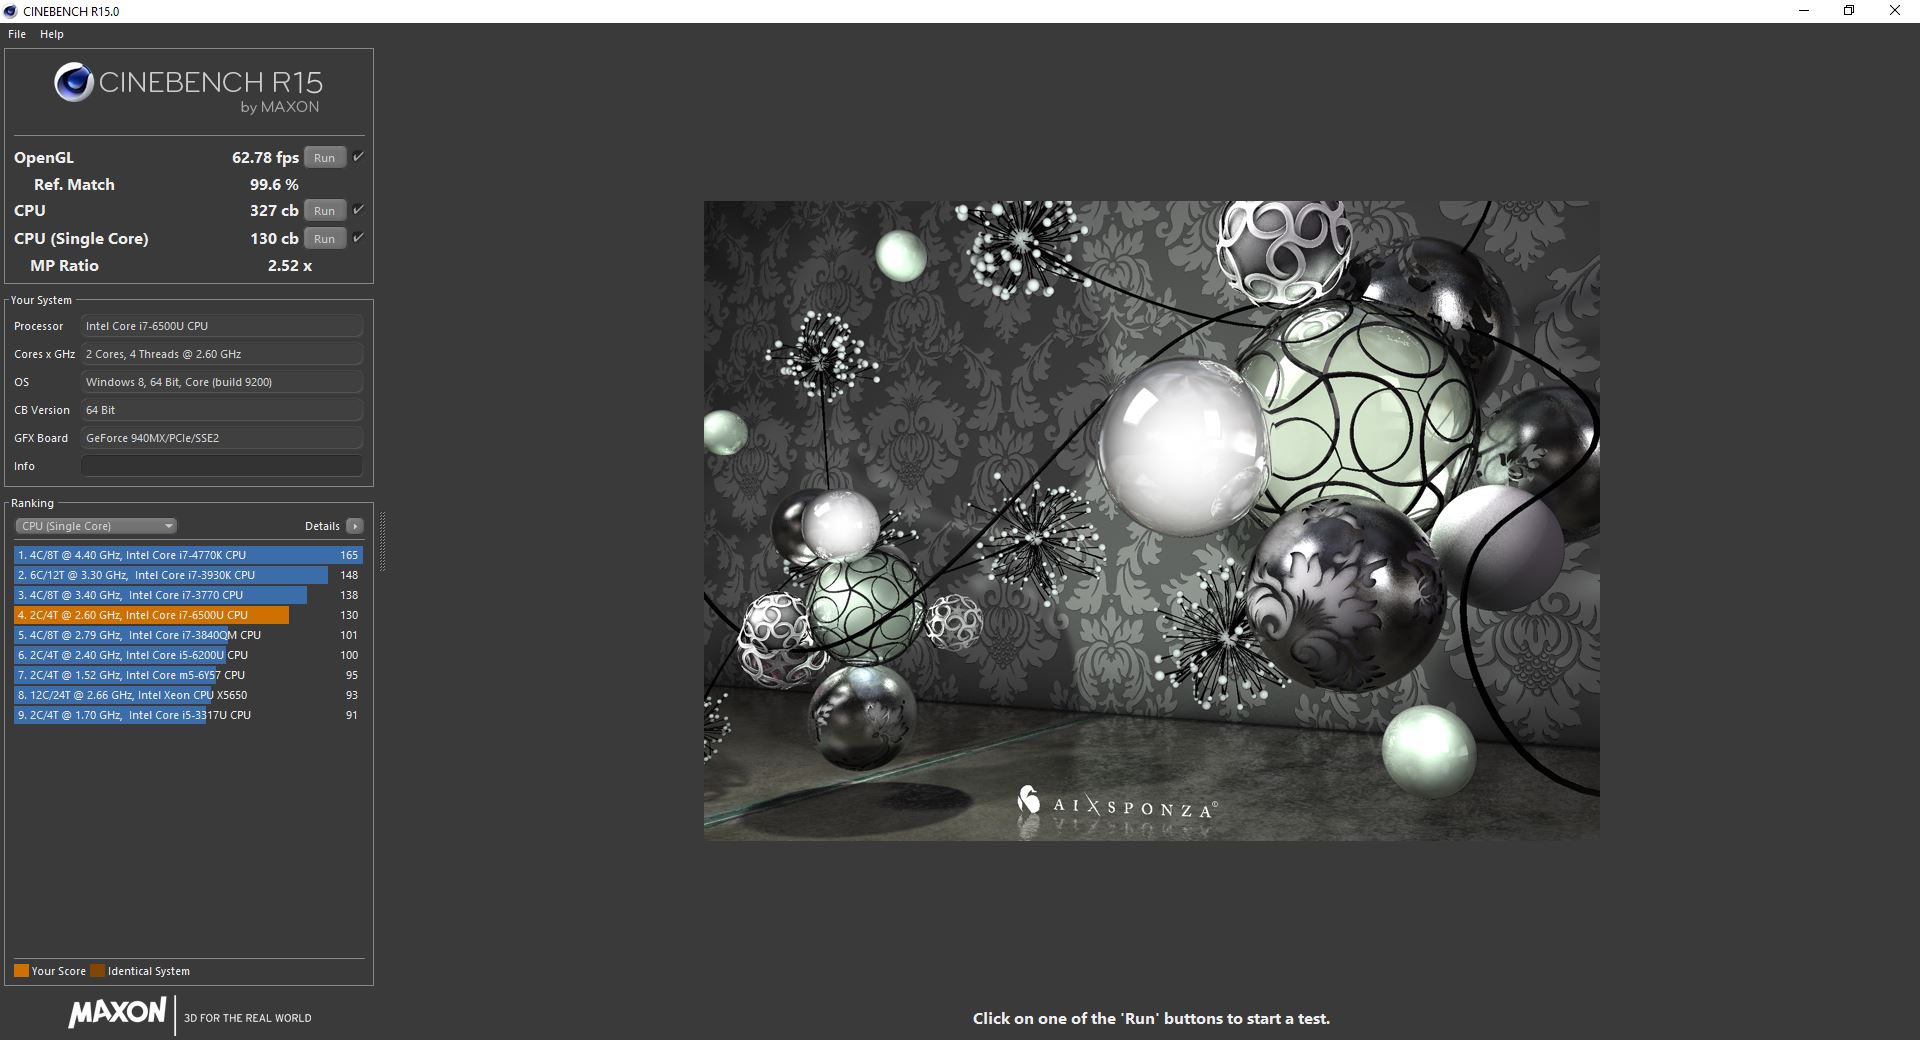
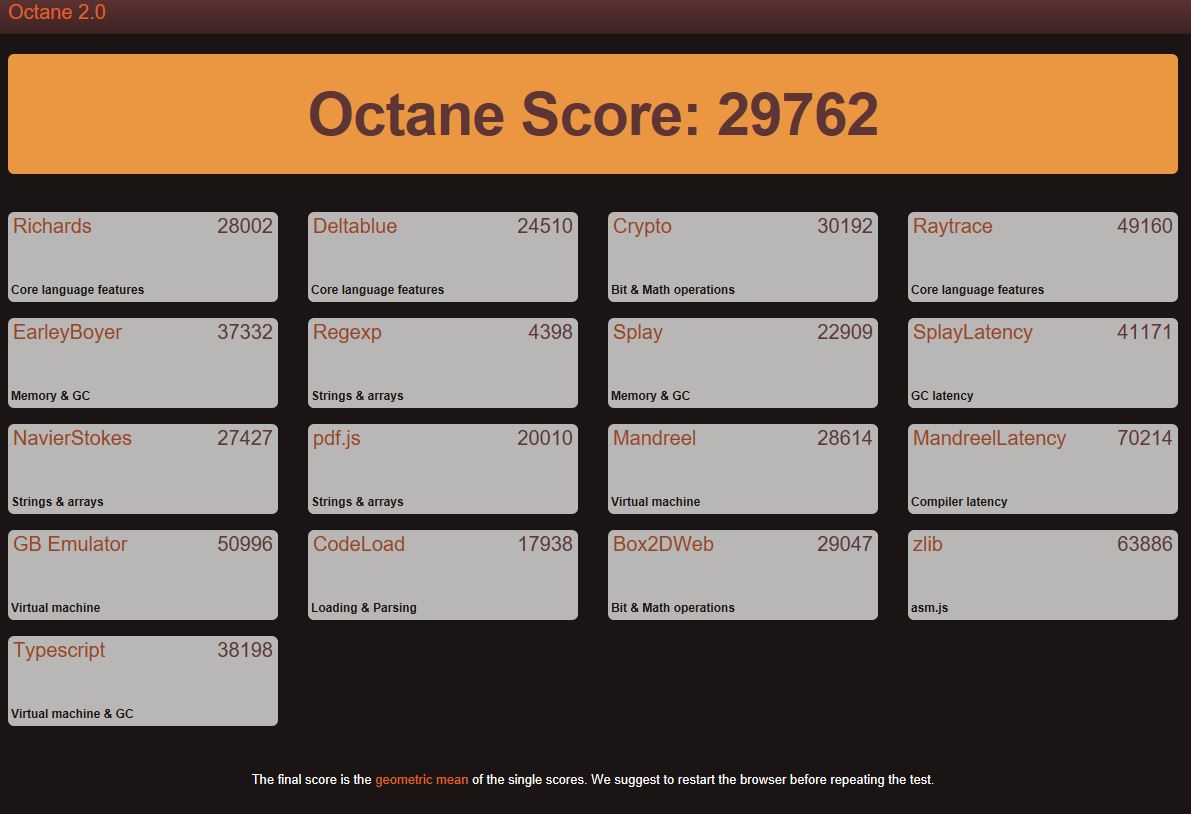
| Octane V2 - Total Score | |
| Lenovo ThinkPad T460p-20FXS05500 | |
| Asus Zenbook UX310UQ-GL011T | |
| Xiaomi Mi Notebook Air 13.3 2016 | |
| Lenovo Yoga 710-14ISK | |
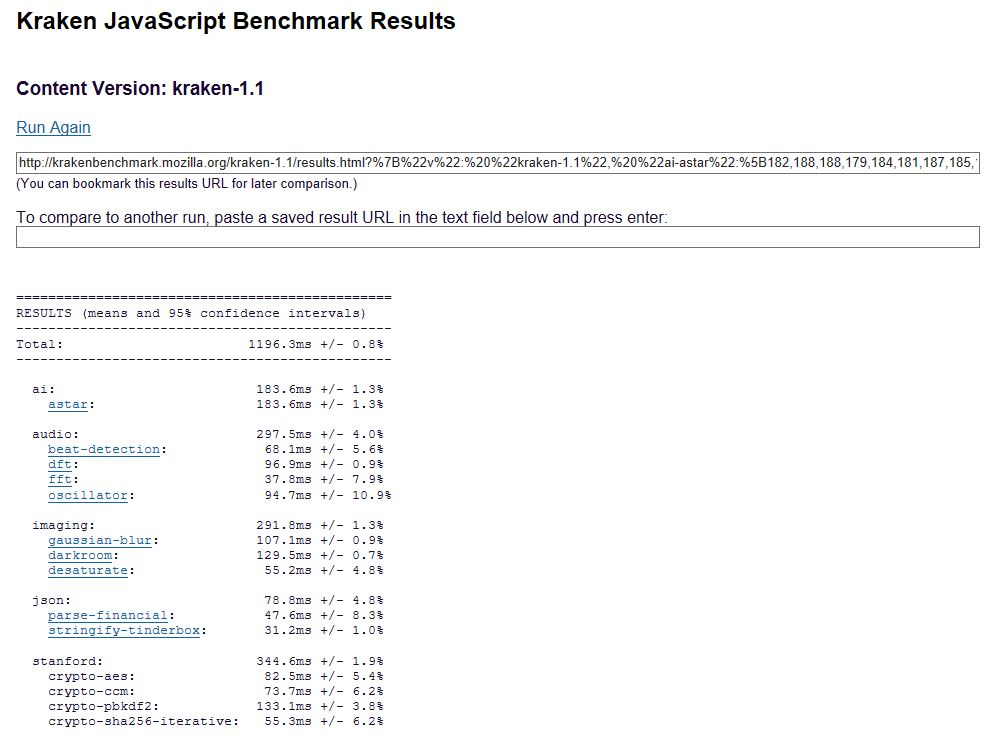
| Mozilla Kraken 1.1 - Total | |
| Xiaomi Mi Notebook Air 13.3 2016 | |
| Lenovo Yoga 710-14ISK | |
| Asus Zenbook UX310UQ-GL011T | |
| Lenovo ThinkPad T460p-20FXS05500 | |
* ... más pequeño es mejor
| PCMark 8 | |
| Home Score Accelerated v2 | |
| Asus Zenbook UX310UQ-GL011T | |
| Lenovo Yoga 710-14ISK | |
| Lenovo ThinkPad T460p-20FXS05500 | |
| HP Pavilion 14-al003ng | |
| Xiaomi Mi Notebook Air 13.3 2016 | |
| Work Score Accelerated v2 | |
| Asus Zenbook UX310UQ-GL011T | |
| Lenovo ThinkPad T460p-20FXS05500 | |
| Lenovo Yoga 710-14ISK | |
| Xiaomi Mi Notebook Air 13.3 2016 | |
| Creative Score Accelerated v2 | |
| Asus Zenbook UX310UQ-GL011T | |
| Lenovo ThinkPad T460p-20FXS05500 | |
| Lenovo Yoga 710-14ISK | |
| PCMark 7 | |
| Productivity | |
| Lenovo ThinkPad T460p-20FXS05500 | |
| Asus Zenbook UX310UQ-GL011T | |
| Lenovo Yoga 710-14ISK | |
| Score | |
| Lenovo ThinkPad T460p-20FXS05500 | |
| Asus Zenbook UX310UQ-GL011T | |
| Lenovo Yoga 710-14ISK | |
| PCMark Vantage Result | 13885 puntos | |
| PCMark 7 Score | 5305 puntos | |
| PCMark 8 Home Score Accelerated v2 | 3769 puntos | |
| PCMark 8 Creative Score Accelerated v2 | 4440 puntos | |
| PCMark 8 Work Score Accelerated v2 | 4603 puntos | |
ayuda | ||
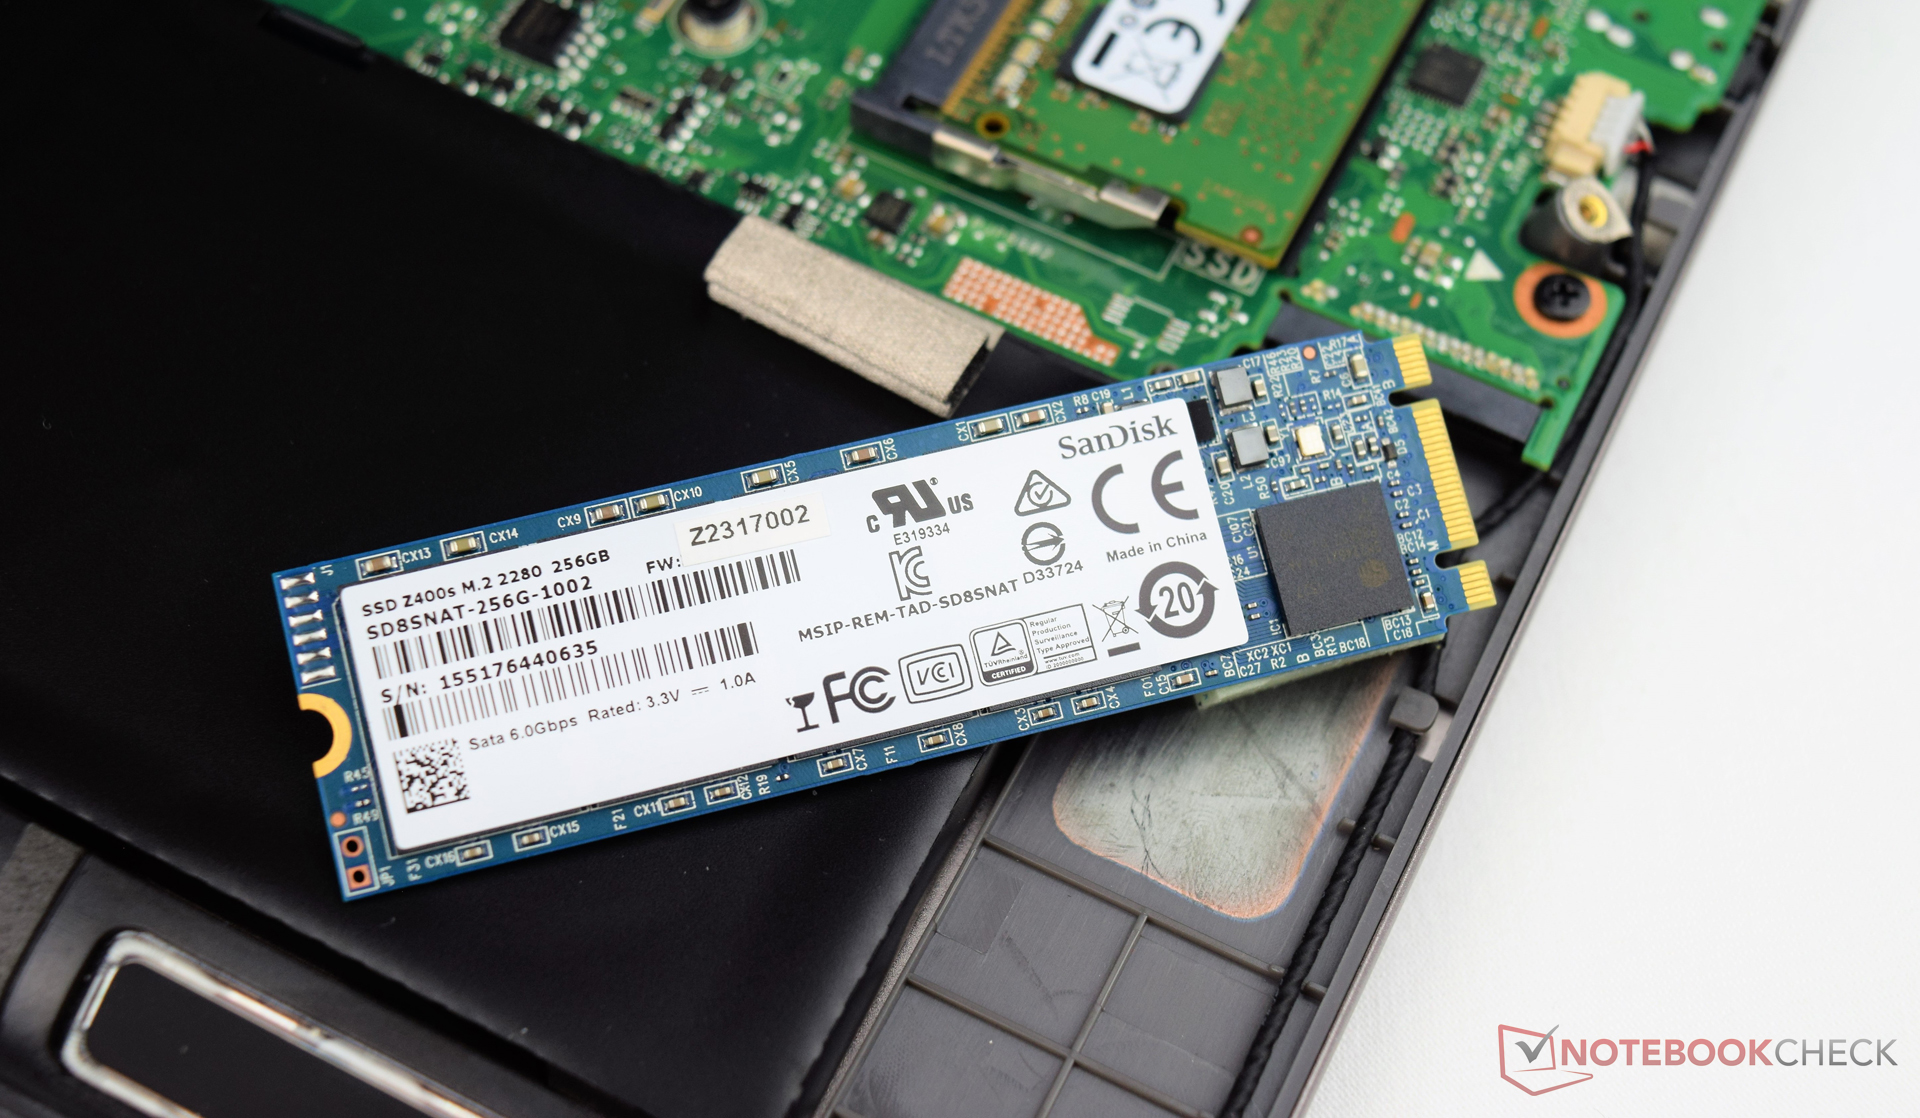
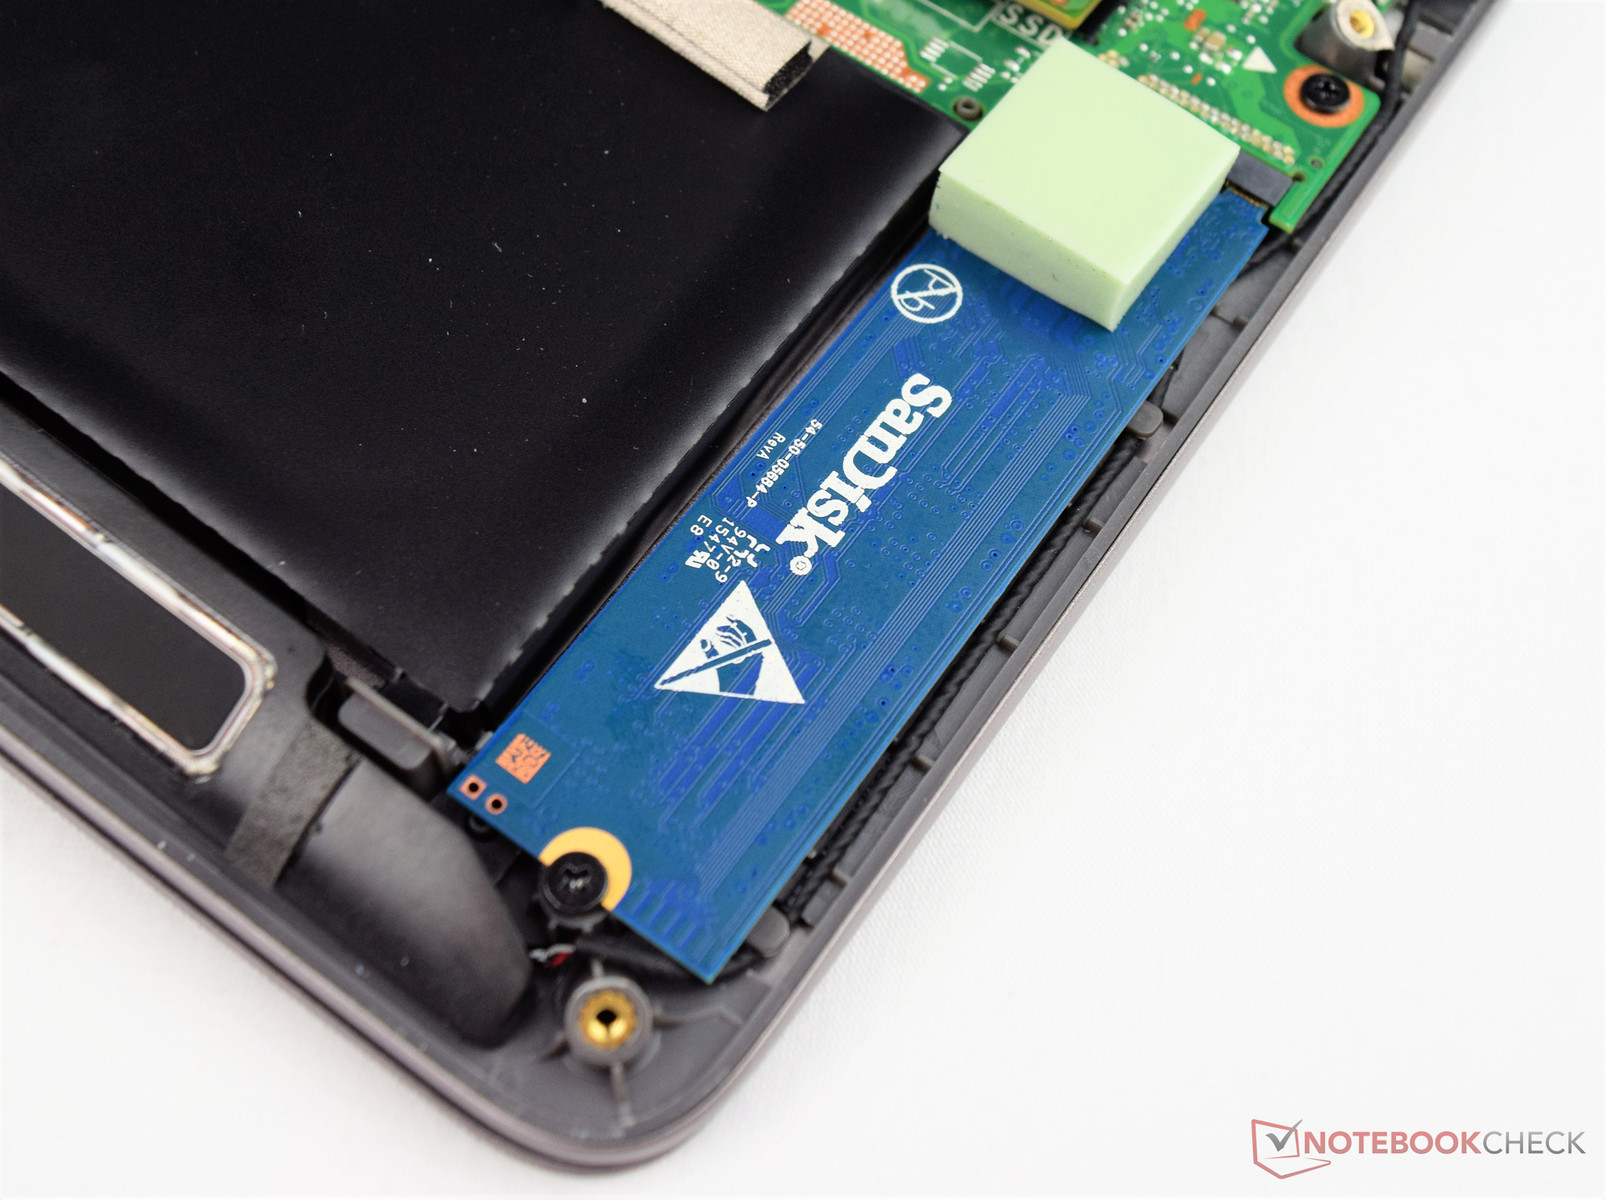
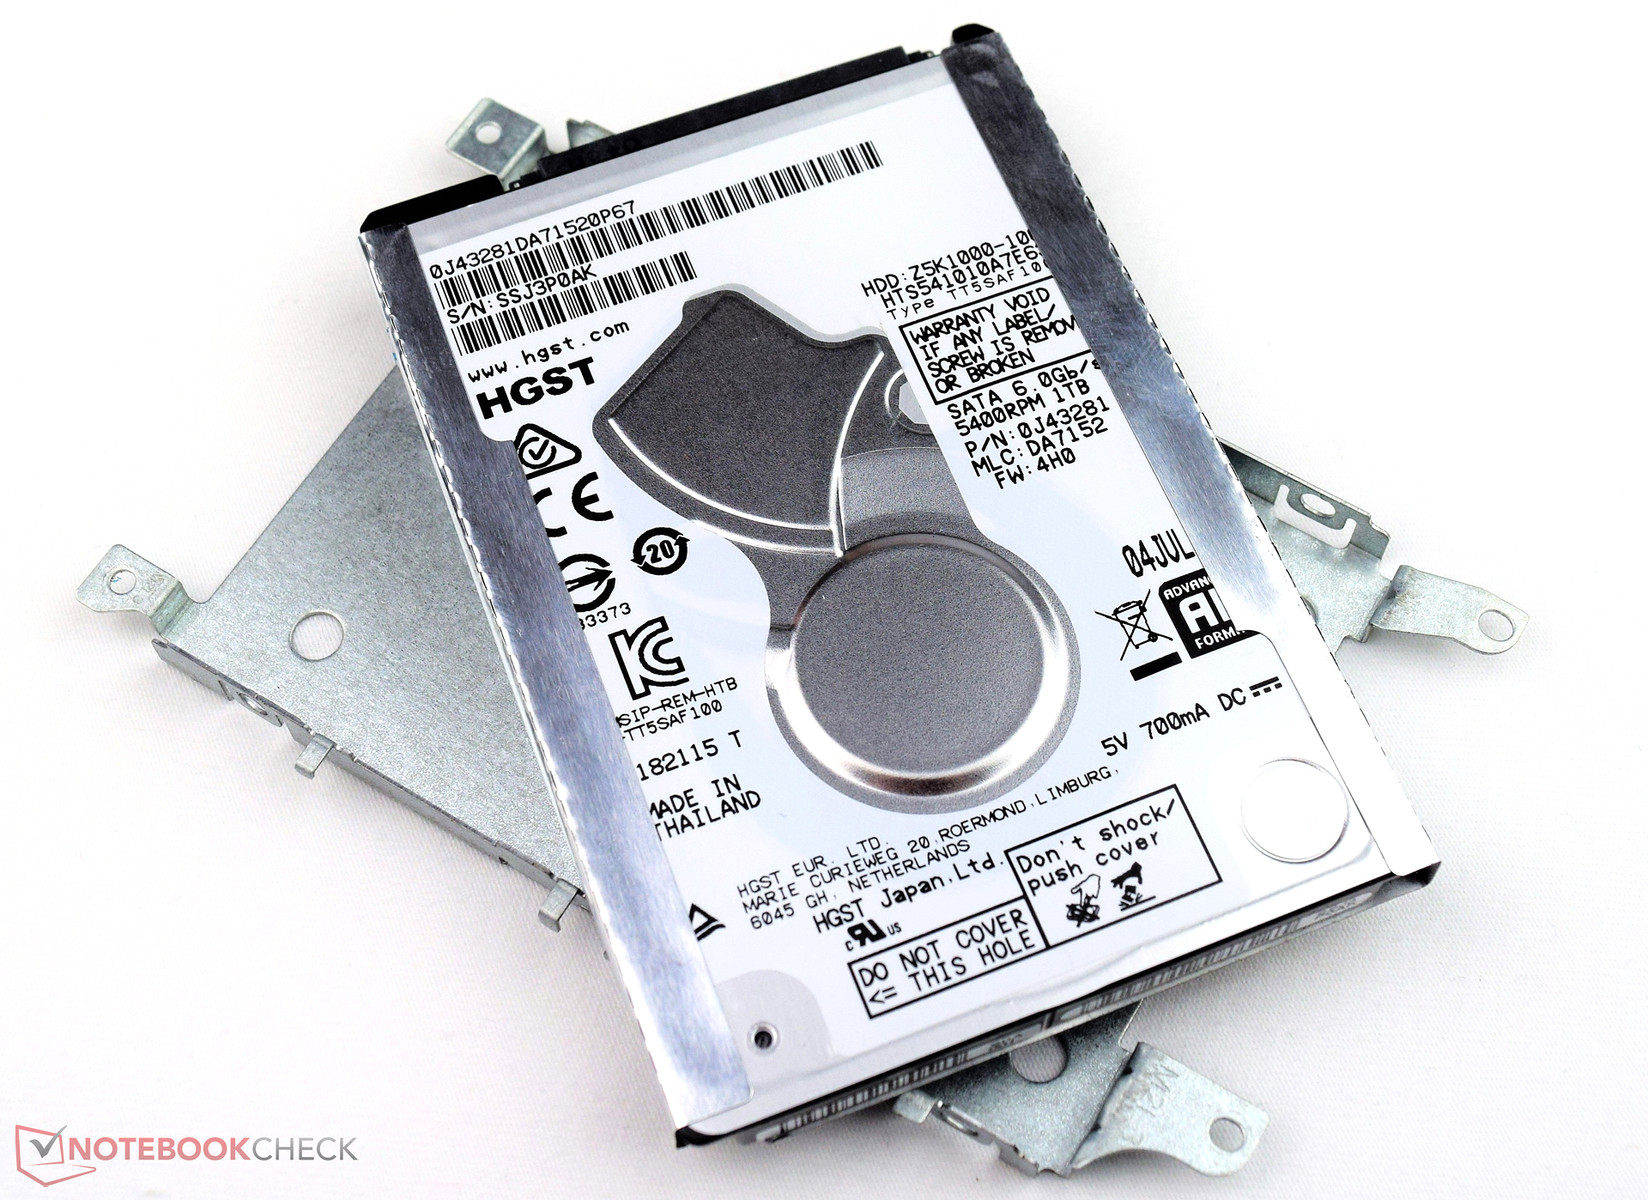
| Asus Zenbook UX310UQ-GL011T SanDisk SD8SNAT256G1002 | Lenovo Yoga 710-14ISK Samsung SSD PM871 MZNLN256HCHP | Xiaomi Mi Notebook Air 13.3 2016 Samsung PM951 NVMe MZVLV256 | Lenovo ThinkPad T460p-20FXS05500 Samsung SSD PM871 MZ7LN512HCHP | HP Pavilion 14-al003ng SanDisk Z400s 256 GB M.2 2280 | |
|---|---|---|---|---|---|
| CrystalDiskMark 3.0 | 42% | 109% | 48% | -6% | |
| Read Seq (MB/s) | 468.1 | 508 9% | 1209 158% | 502 7% | 469.3 0% |
| Write Seq (MB/s) | 319.2 | 302.7 -5% | 314 -2% | 442 38% | 309.1 -3% |
| Read 512 (MB/s) | 318.6 | 419.9 32% | 411.4 29% | ||
| Write 512 (MB/s) | 272.8 | 302.6 11% | 414.3 52% | ||
| Read 4k (MB/s) | 22.03 | 33.3 51% | 43.4 97% | 29.18 32% | 14 -36% |
| Write 4k (MB/s) | 72.1 | 85.8 19% | 153.4 113% | 86.5 20% | 73.9 2% |
| Read 4k QD32 (MB/s) | 147.4 | 395.8 169% | 487.6 231% | 358.1 143% | 149.5 1% |
| Write 4k QD32 (MB/s) | 200.2 | 294.3 47% | 312.2 56% | 319.8 60% | 204.6 2% |

| 3DMark | |
| 1280x720 Cloud Gate Standard Graphics | |
| Xiaomi Mi Notebook Air 13.3 2016 | |
| Lenovo ThinkPad T460p-20FXS05500 | |
| Lenovo Yoga 710-14ISK | |
| Asus Zenbook UX310UQ-GL011T | |
| 1920x1080 Fire Strike Graphics | |
| Xiaomi Mi Notebook Air 13.3 2016 | |
| Lenovo ThinkPad T460p-20FXS05500 | |
| Asus Zenbook UX310UQ-GL011T | |
| Lenovo Yoga 710-14ISK | |
| 1280x720 Ice Storm Standard Graphics | |
| Asus Zenbook UX310UQ-GL011T | |
| Lenovo Yoga 710-14ISK | |
| Lenovo ThinkPad T460p-20FXS05500 | |
| 3DMark 06 - 1280x1024 Standard Score AA:0x AF:0x | |
| Lenovo ThinkPad T460p-20FXS05500 | |
| Lenovo Yoga 710-14ISK | |
| Asus Zenbook UX310UQ-GL011T | |
| 3DMark 2001SE Standard | 28793 puntos | |
| 3DMark 03 Standard | 28408 puntos | |
| 3DMark 05 Standard | 20654 puntos | |
| 3DMark 06 Standard Score | 10351 puntos | |
| 3DMark 11 Performance | 2424 puntos | |
| 3DMark Ice Storm Standard Score | 44072 puntos | |
| 3DMark Cloud Gate Standard Score | 6264 puntos | |
| 3DMark Fire Strike Score | 1394 puntos | |
| 3DMark Fire Strike Extreme Score | 716 puntos | |
| 3DMark Time Spy Score | 514 puntos | |
ayuda | ||
| bajo | medio | alto | ultra | |
|---|---|---|---|---|
| BioShock Infinite (2013) | 85.9 | 48.7 | 39.4 | 13.3 |
| Battlefield 4 (2013) | 67.2 | 43.8 | 29.1 | 10.7 |
| The Witcher 3 (2015) | 24 | 16.3 | 8.7 | 5.3 |
Ruido
| Ocioso |
| 30.5 / 30.5 / 31.5 dB(A) |
| HDD |
| 30.9 dB(A) |
| Carga |
| 36.2 / 40 dB(A) |
 | ||
30 dB silencioso 40 dB(A) audible 50 dB(A) ruidosamente alto |
||
min: | ||
| Asus Zenbook UX310UQ-GL011T Intel Core i7-6500U, GeForce 940MX | Lenovo Yoga 710-14ISK Intel Core i5-6200U, GeForce 940MX | Xiaomi Mi Notebook Air 13.3 2016 Intel Core i5-6200U, GeForce 940MX | Lenovo ThinkPad T460p-20FXS05500 Intel Core i7-6700HQ, GeForce 940MX | HP Pavilion 14-al003ng Intel Core i5-6200U, GeForce 940MX | |
|---|---|---|---|---|---|
| Noise | -7% | -3% | 5% | -0% | |
| apagado / medio ambiente * (dB) | 30.5 | 32.2 -6% | 31.15 -2% | 29.2 4% | 28.9 5% |
| Idle Minimum * (dB) | 30.5 | 32.5 -7% | 31.15 -2% | 29.2 4% | 29.2 4% |
| Idle Average * (dB) | 30.5 | 34.6 -13% | 31.15 -2% | 29.2 4% | 29.2 4% |
| Idle Maximum * (dB) | 31.5 | 34.6 -10% | 31.15 1% | 29.2 7% | 30.8 2% |
| Load Average * (dB) | 36.2 | 38.7 -7% | 38.2 -6% | 33.5 7% | 38 -5% |
| Load Maximum * (dB) | 40 | 39.9 -0% | 41.7 -4% | 38.8 3% | 44.3 -11% |
* ... más pequeño es mejor
| Asus Zenbook UX310UQ-GL011T GeForce 940MX, 6500U, SanDisk SD8SNAT256G1002 | Lenovo Yoga 710-14ISK GeForce 940MX, 6200U, Samsung SSD PM871 MZNLN256HCHP | Xiaomi Mi Notebook Air 13.3 2016 GeForce 940MX, 6200U, Samsung PM951 NVMe MZVLV256 | Lenovo ThinkPad T460p-20FXS05500 GeForce 940MX, 6700HQ, Samsung SSD PM871 MZ7LN512HCHP | HP Pavilion 14-al003ng GeForce 940MX, 6200U, SanDisk Z400s 256 GB M.2 2280 | |
|---|---|---|---|---|---|
| Heat | -13% | -12% | -32% | -21% | |
| Maximum Upper Side * (°C) | 38.5 | 43.4 -13% | 51 -32% | 51.6 -34% | 44.1 -15% |
| Maximum Bottom * (°C) | 40.4 | 43.2 -7% | 47 -16% | 55.2 -37% | 44.9 -11% |
| Idle Upper Side * (°C) | 24.8 | 28 -13% | 24.4 2% | 30.7 -24% | 32.4 -31% |
| Idle Bottom * (°C) | 23.8 | 28.2 -18% | 24.6 -3% | 31.5 -32% | 30.2 -27% |
* ... más pequeño es mejor
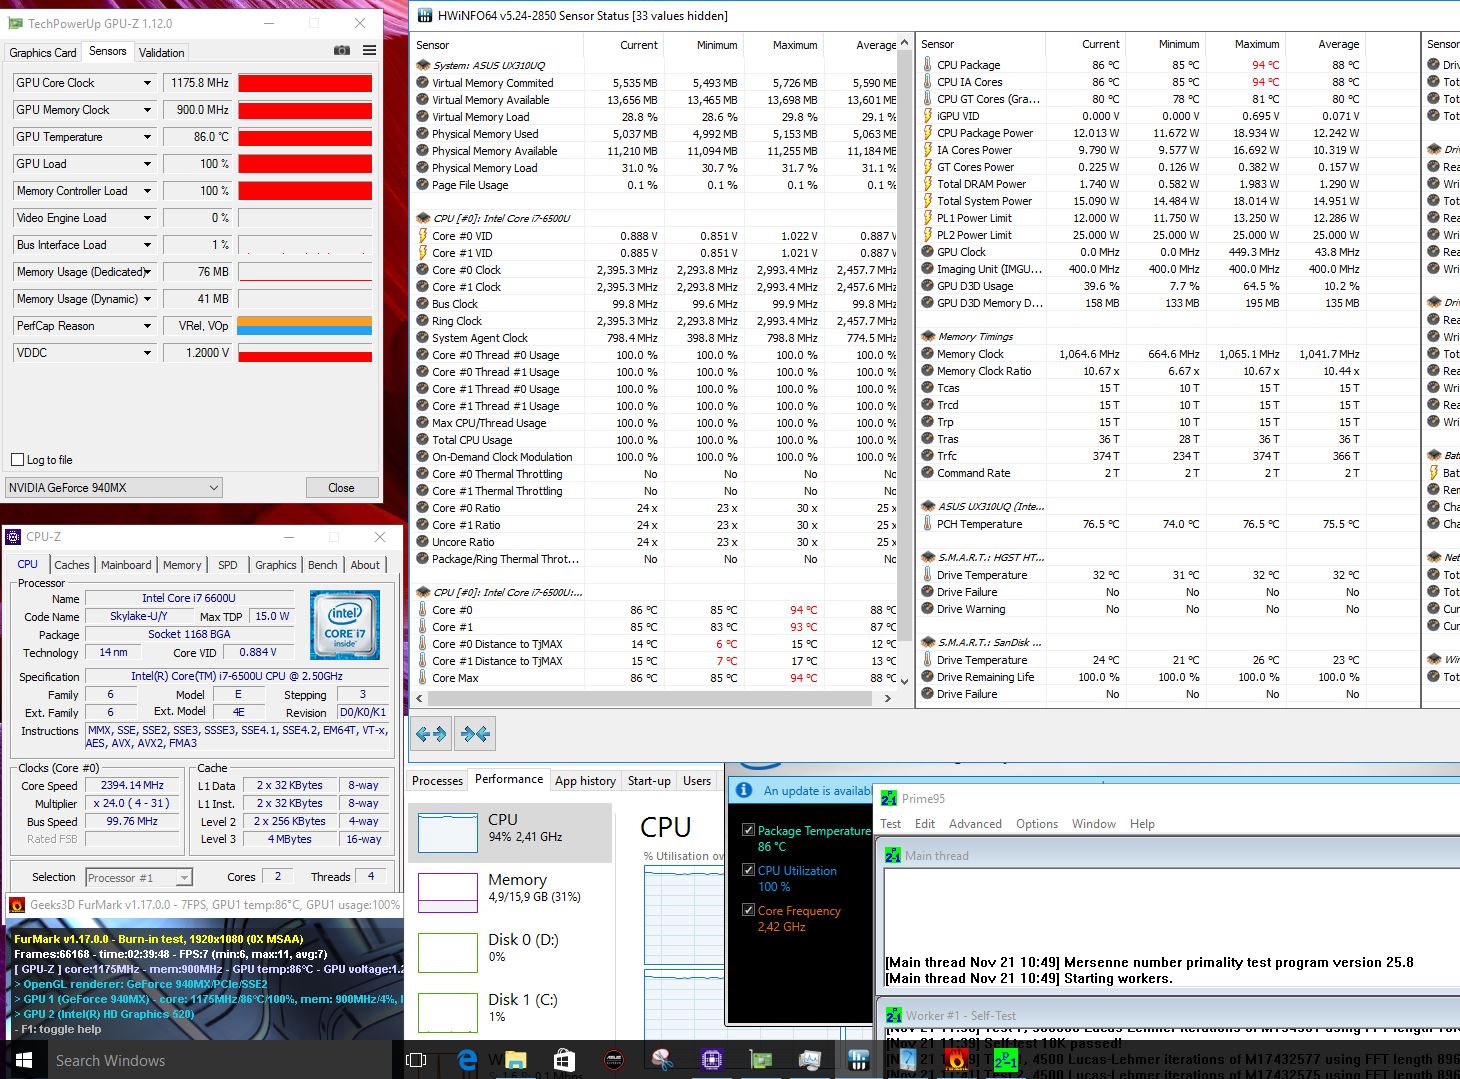
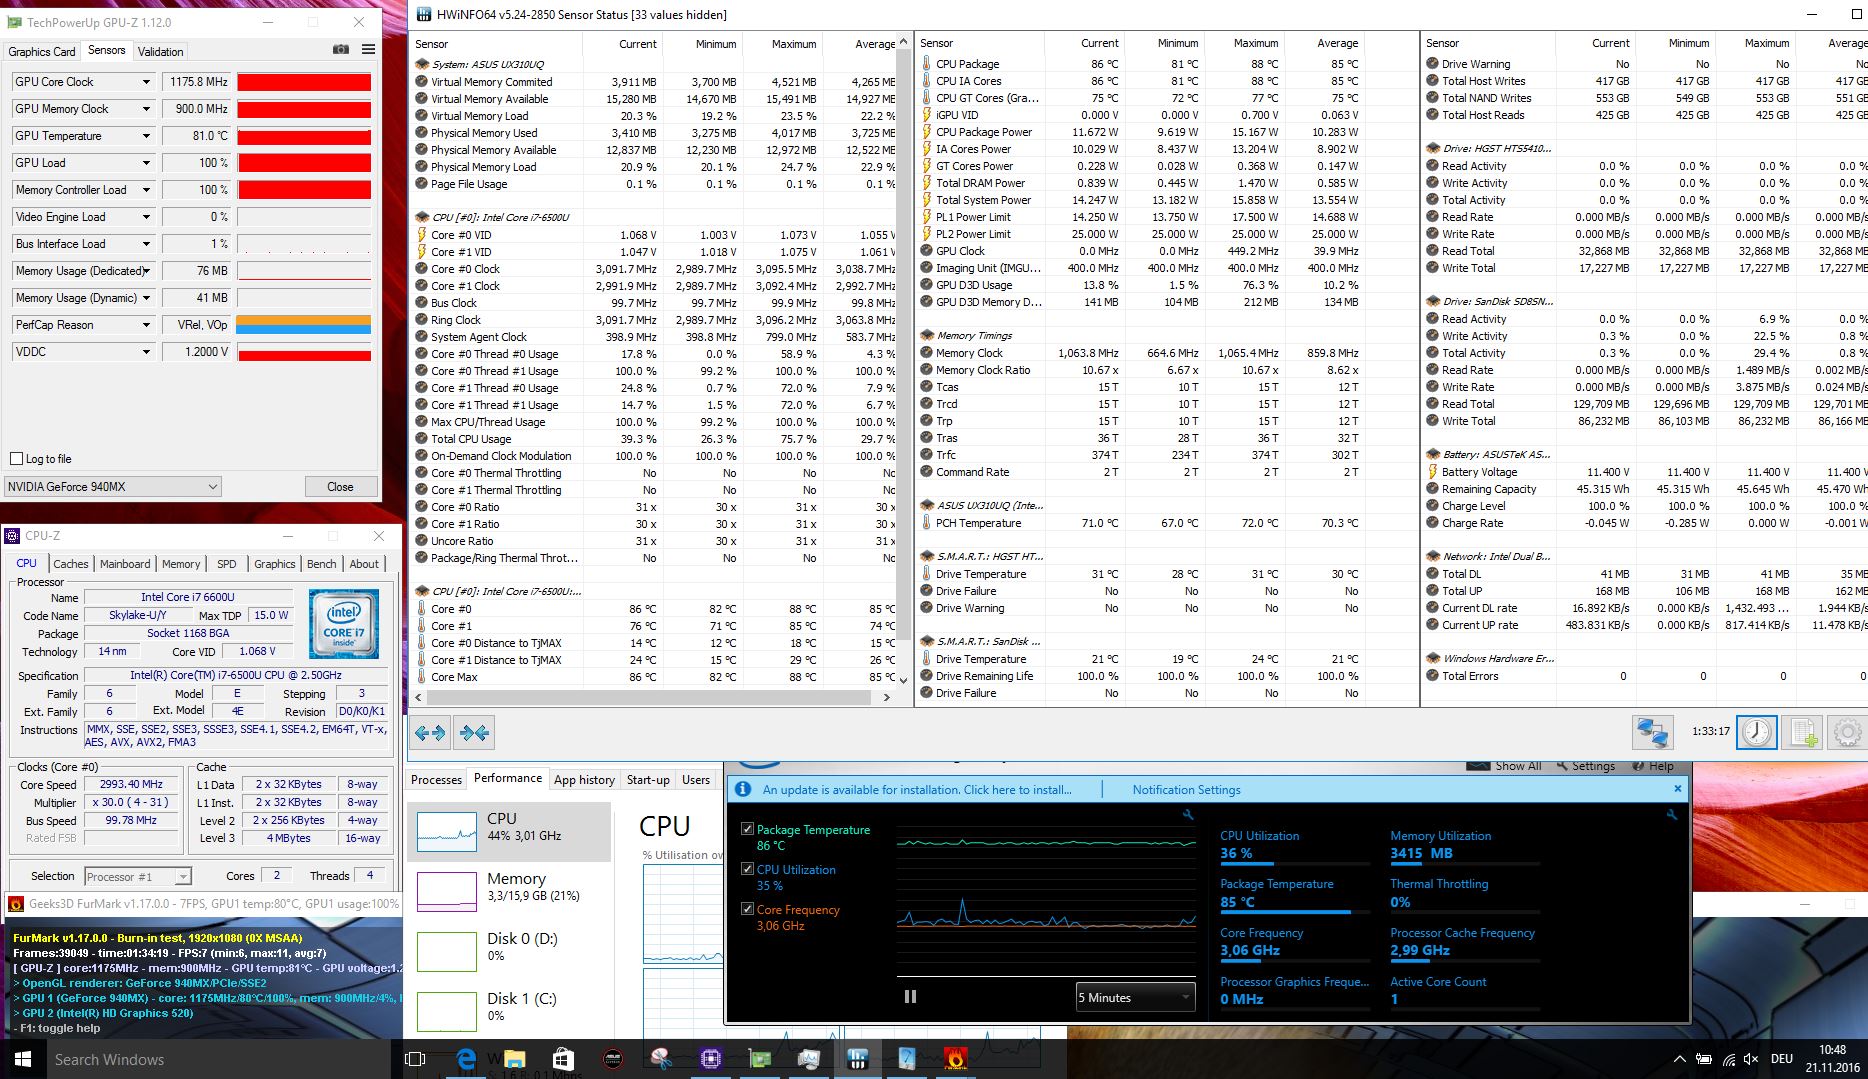
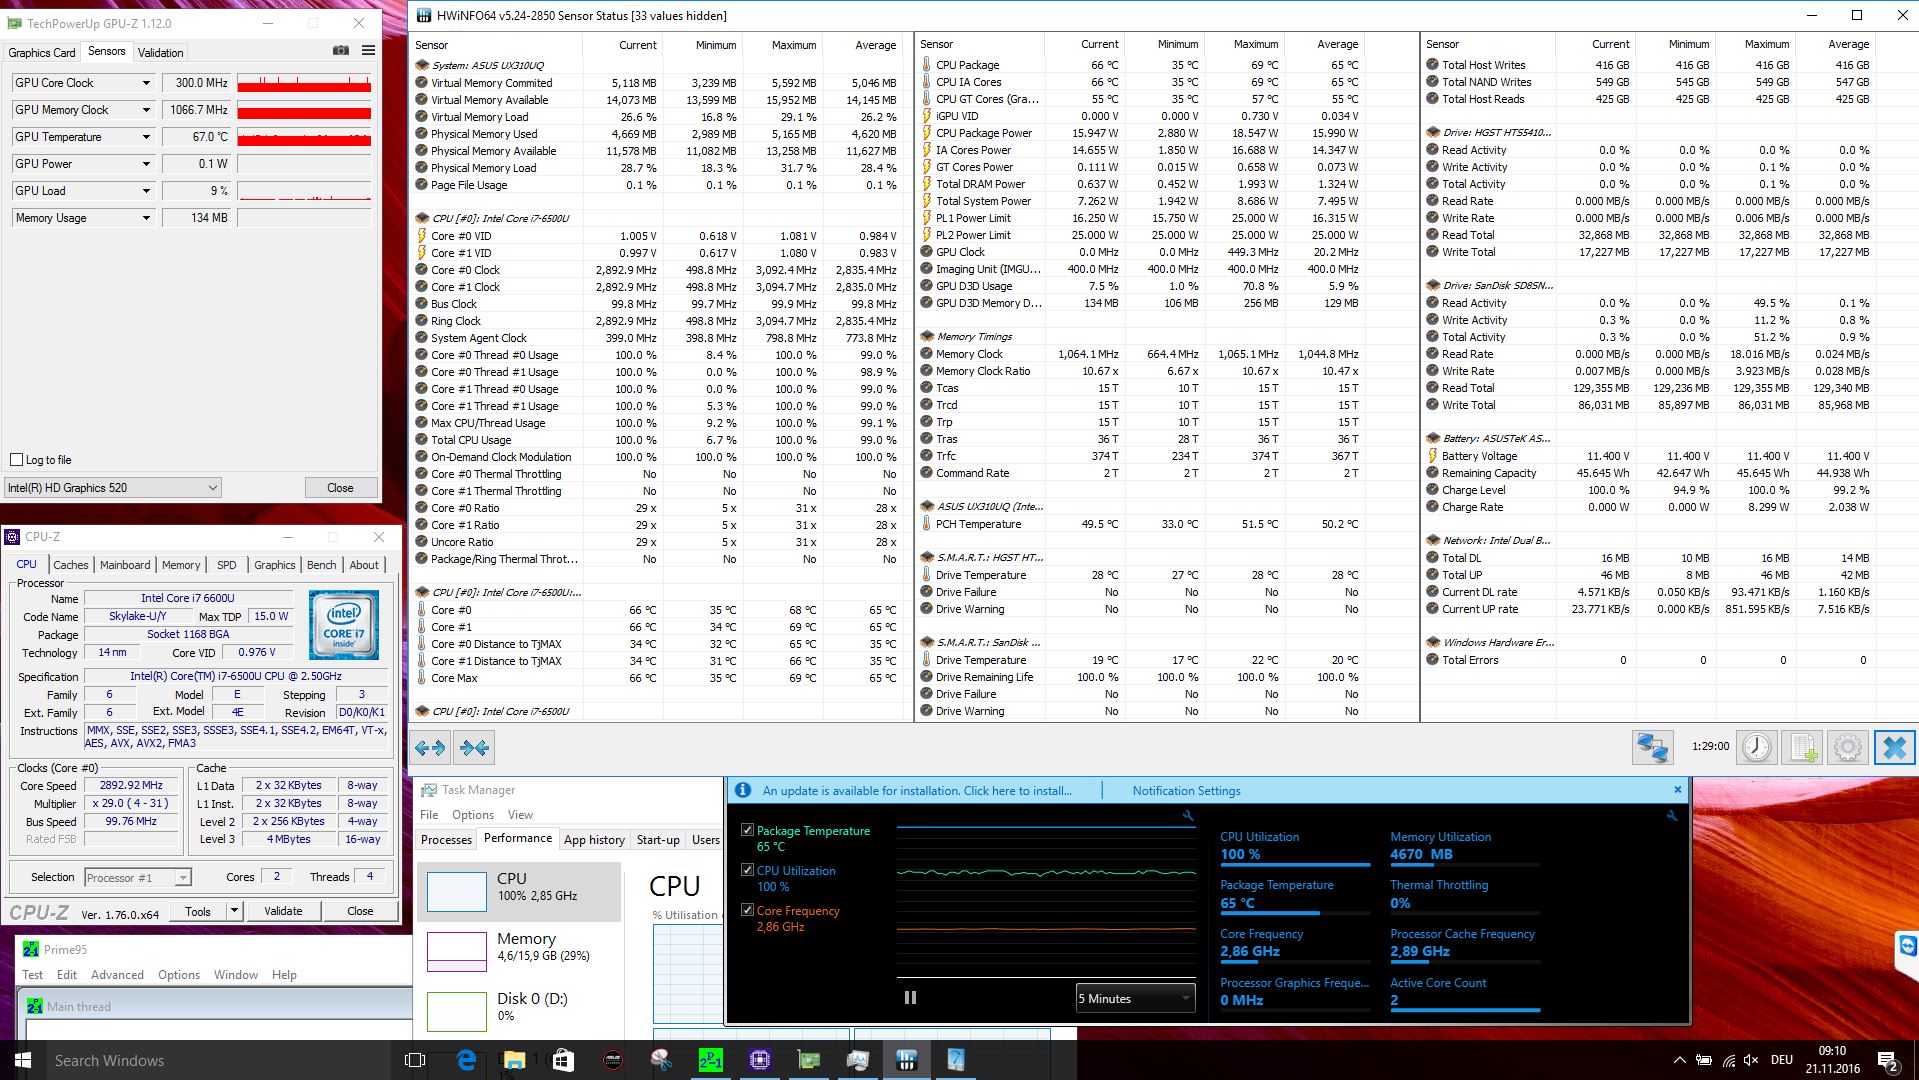
(+) La temperatura máxima en la parte superior es de 38.5 °C / 101 F, frente a la media de 35.9 °C / 97 F, que oscila entre 21.4 y 59 °C para la clase Subnotebook.
(±) El fondo se calienta hasta un máximo de 40.4 °C / 105 F, frente a la media de 39.2 °C / 103 F
(+) En reposo, la temperatura media de la parte superior es de 23.6 °C / 74# F, frente a la media del dispositivo de 30.8 °C / 87 F.
(+) El reposamanos y el panel táctil están a una temperatura inferior a la de la piel, con un máximo de 27.7 °C / 81.9 F y, por tanto, son fríos al tacto.
(±) La temperatura media de la zona del reposamanos de dispositivos similares fue de 28.2 °C / 82.8 F (+0.5 °C / 0.9 F).
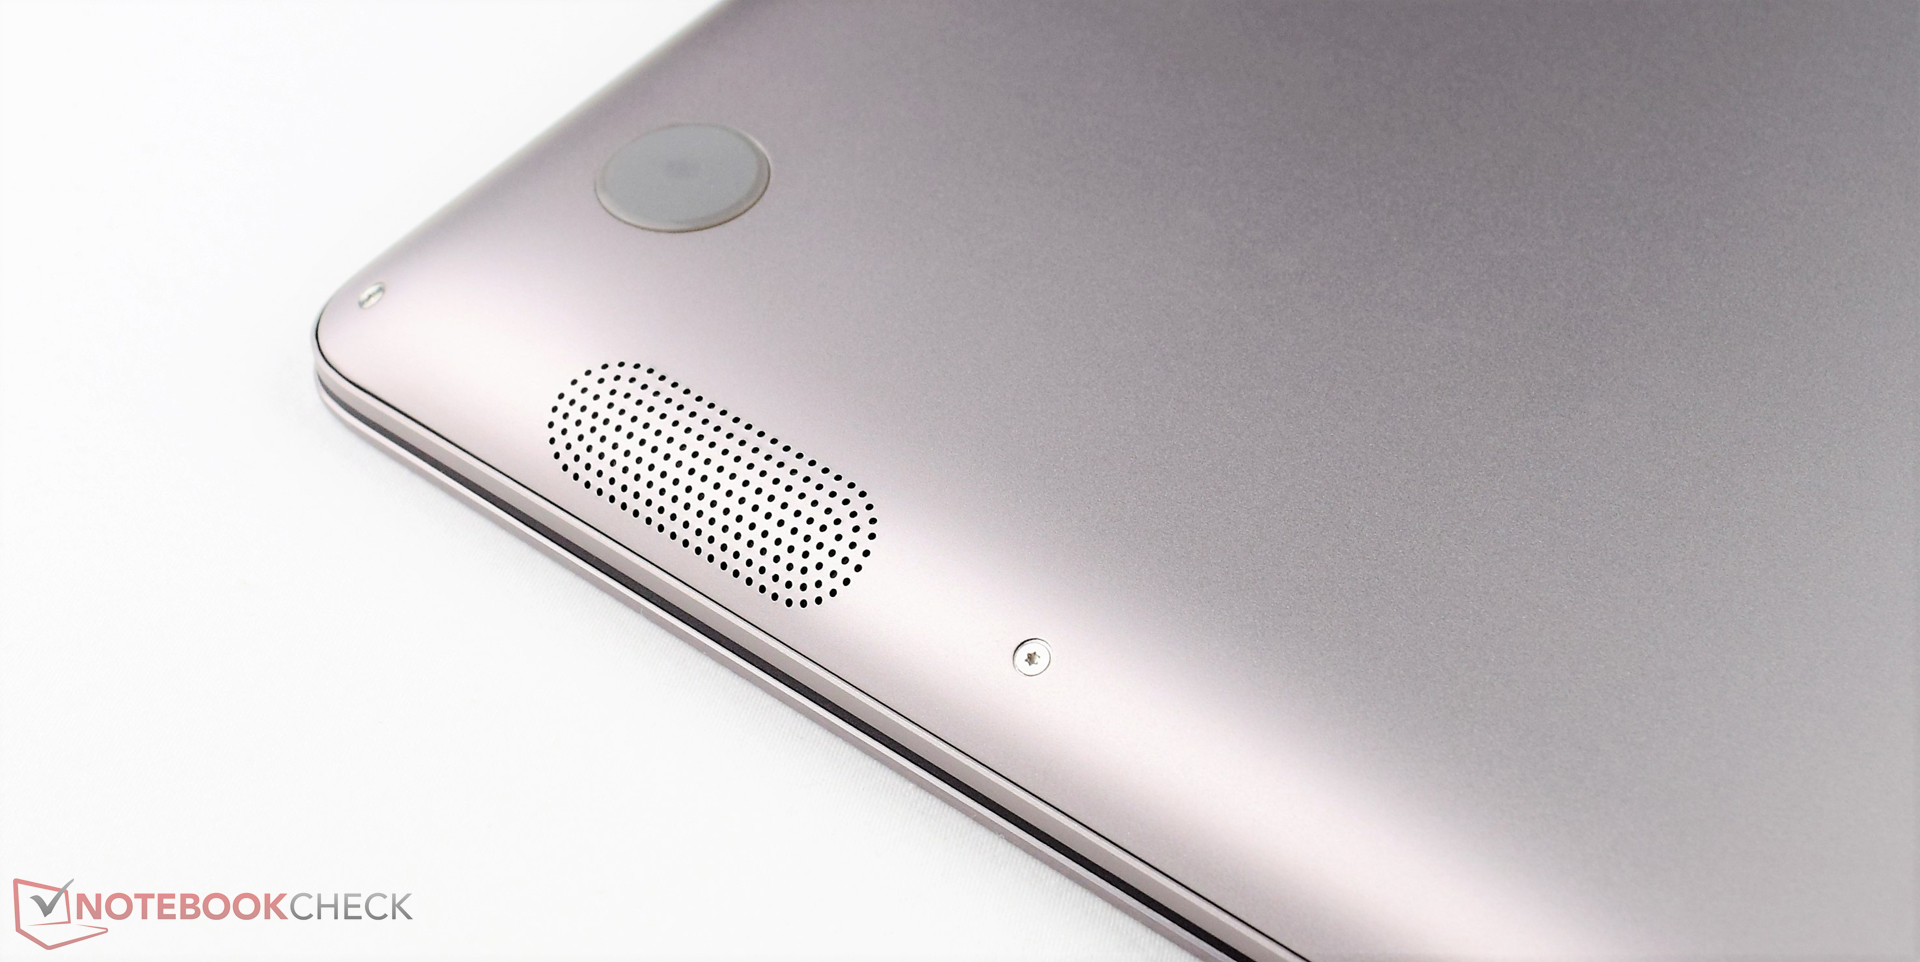
Asus Zenbook UX310UQ-GL011T análisis de audio
(±) | la sonoridad del altavoz es media pero buena (73 dB)
Graves 100 - 315 Hz
(-) | casi sin bajos - de media 20.4% inferior a la mediana
(±) | la linealidad de los graves es media (10.6% delta a frecuencia anterior)
Medios 400 - 2000 Hz
(+) | medios equilibrados - a sólo 2.5% de la mediana
(+) | los medios son lineales (3.1% delta a la frecuencia anterior)
Altos 2 - 16 kHz
(±) | máximos más altos - de media 6.3% más altos que la mediana
(+) | los máximos son lineales (2.3% delta a la frecuencia anterior)
Total 100 - 16.000 Hz
(±) | la linealidad del sonido global es media (19.3% de diferencia con la mediana)
En comparación con la misma clase
» 60% de todos los dispositivos probados de esta clase eran mejores, 7% similares, 34% peores
» El mejor tuvo un delta de 5%, la media fue 18%, el peor fue ###max##%
En comparación con todos los dispositivos probados
» 47% de todos los dispositivos probados eran mejores, 8% similares, 46% peores
» El mejor tuvo un delta de 4%, la media fue 23%, el peor fue ###max##%
Apple MacBook 12 (Early 2016) 1.1 GHz análisis de audio
(+) | los altavoces pueden reproducir a un volumen relativamente alto (#83.6 dB)
Graves 100 - 315 Hz
(±) | lubina reducida - en promedio 11.3% inferior a la mediana
(±) | la linealidad de los graves es media (14.2% delta a frecuencia anterior)
Medios 400 - 2000 Hz
(+) | medios equilibrados - a sólo 2.4% de la mediana
(+) | los medios son lineales (5.5% delta a la frecuencia anterior)
Altos 2 - 16 kHz
(+) | máximos equilibrados - a sólo 2% de la mediana
(+) | los máximos son lineales (4.5% delta a la frecuencia anterior)
Total 100 - 16.000 Hz
(+) | el sonido global es lineal (10.2% de diferencia con la mediana)
En comparación con la misma clase
» 7% de todos los dispositivos probados de esta clase eran mejores, 2% similares, 90% peores
» El mejor tuvo un delta de 5%, la media fue 18%, el peor fue ###max##%
En comparación con todos los dispositivos probados
» 5% de todos los dispositivos probados eran mejores, 1% similares, 94% peores
» El mejor tuvo un delta de 4%, la media fue 23%, el peor fue ###max##%
| Off / Standby | |
| Ocioso | |
| Carga |
|
Clave:
min: | |
| Asus Zenbook UX310UQ-GL011T 6500U, GeForce 940MX, SanDisk SD8SNAT256G1002, TN LED, 1920x1080, 13.3" | Lenovo Yoga 710-14ISK 6200U, GeForce 940MX, Samsung SSD PM871 MZNLN256HCHP, a-Si WLED TFT, IPS, 1920x1080, 14" | Xiaomi Mi Notebook Air 13.3 2016 6200U, GeForce 940MX, Samsung PM951 NVMe MZVLV256, IPS, 1920x1080, 13.3" | Lenovo ThinkPad T460p-20FXS05500 6700HQ, GeForce 940MX, Samsung SSD PM871 MZ7LN512HCHP, IPS-Panel, 2560x1440, 14" | HP Pavilion 14-al003ng 6200U, GeForce 940MX, SanDisk Z400s 256 GB M.2 2280, LED IPS, 1920x1080, 14" | |
|---|---|---|---|---|---|
| Power Consumption | -31% | -6% | -51% | -8% | |
| Idle Minimum * (Watt) | 3 | 4.9 -63% | 4 -33% | 5 -67% | 4 -33% |
| Idle Average * (Watt) | 5.6 | 9.4 -68% | 6.6 -18% | 9.9 -77% | 6.4 -14% |
| Idle Maximum * (Watt) | 6.8 | 10.7 -57% | 7.4 -9% | 10.8 -59% | 7 -3% |
| Load Average * (Watt) | 48.7 | 46 6% | 41.7 14% | 52.4 -8% | 45.5 7% |
| Load Maximum * (Watt) | 63 | 47.2 25% | 52.4 17% | 89.8 -43% | 62.2 1% |
* ... más pequeño es mejor
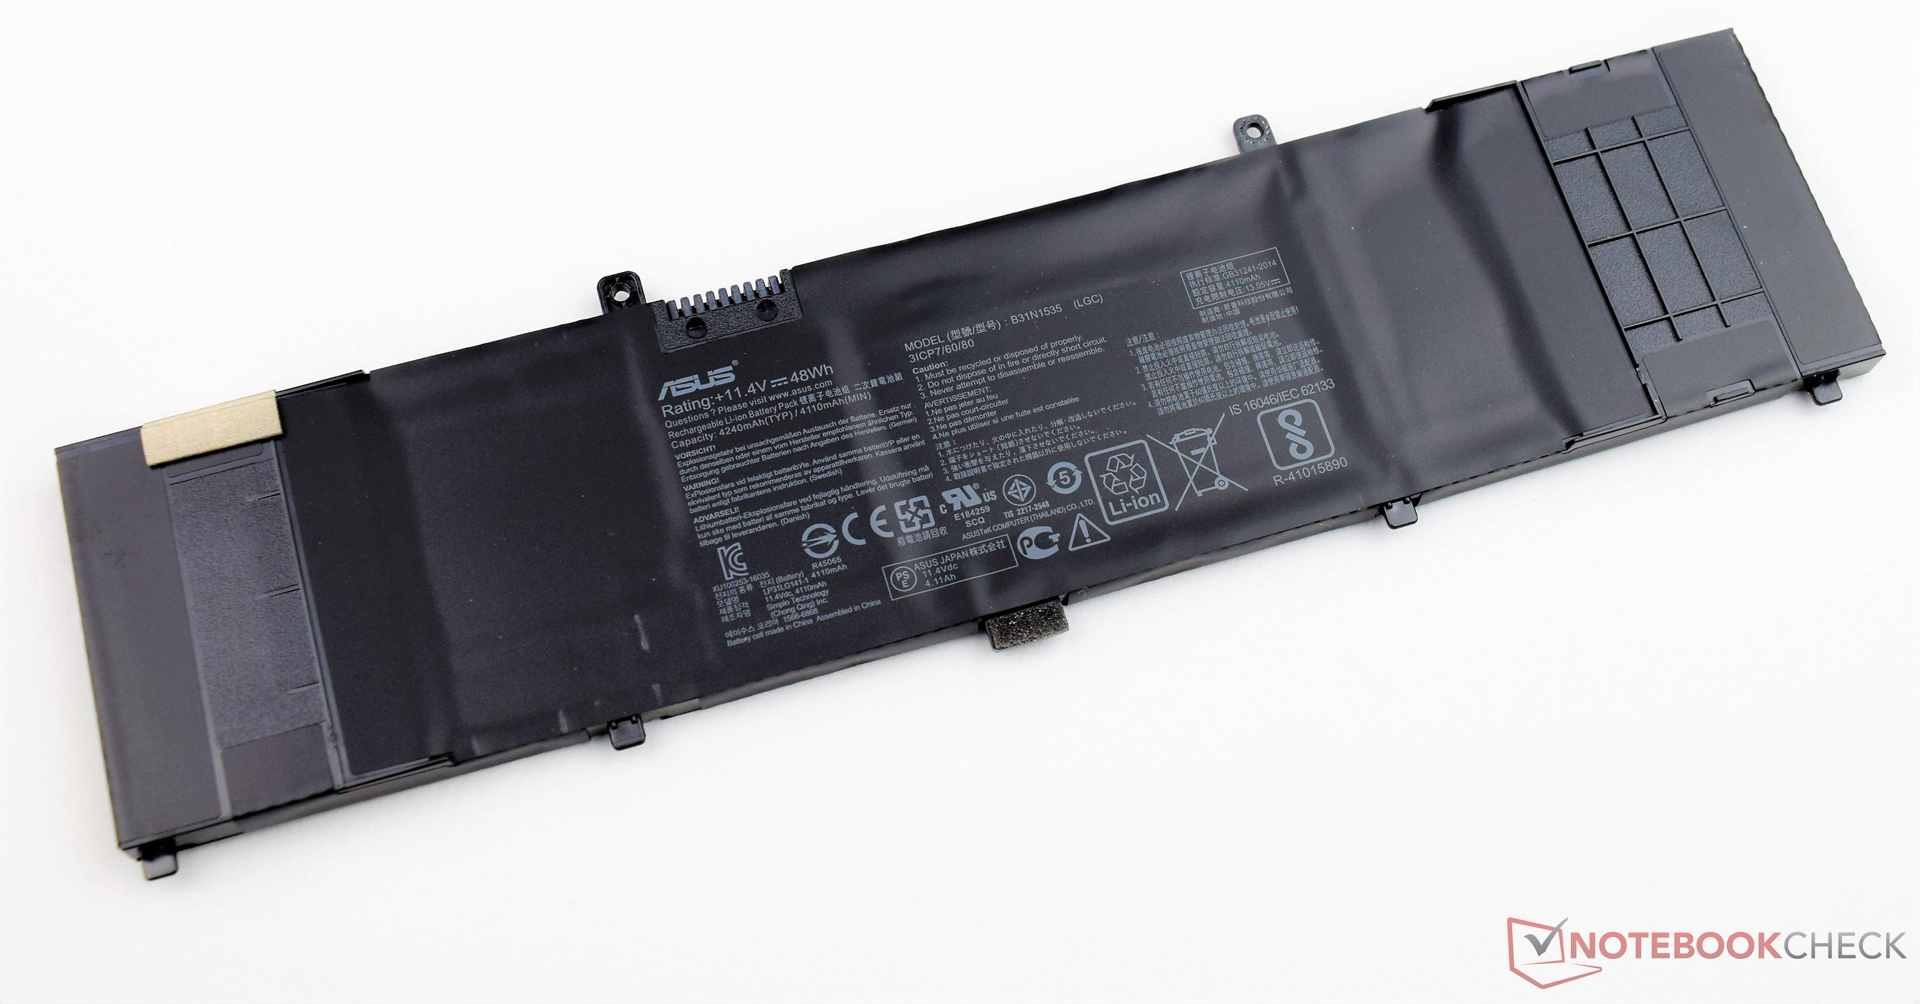
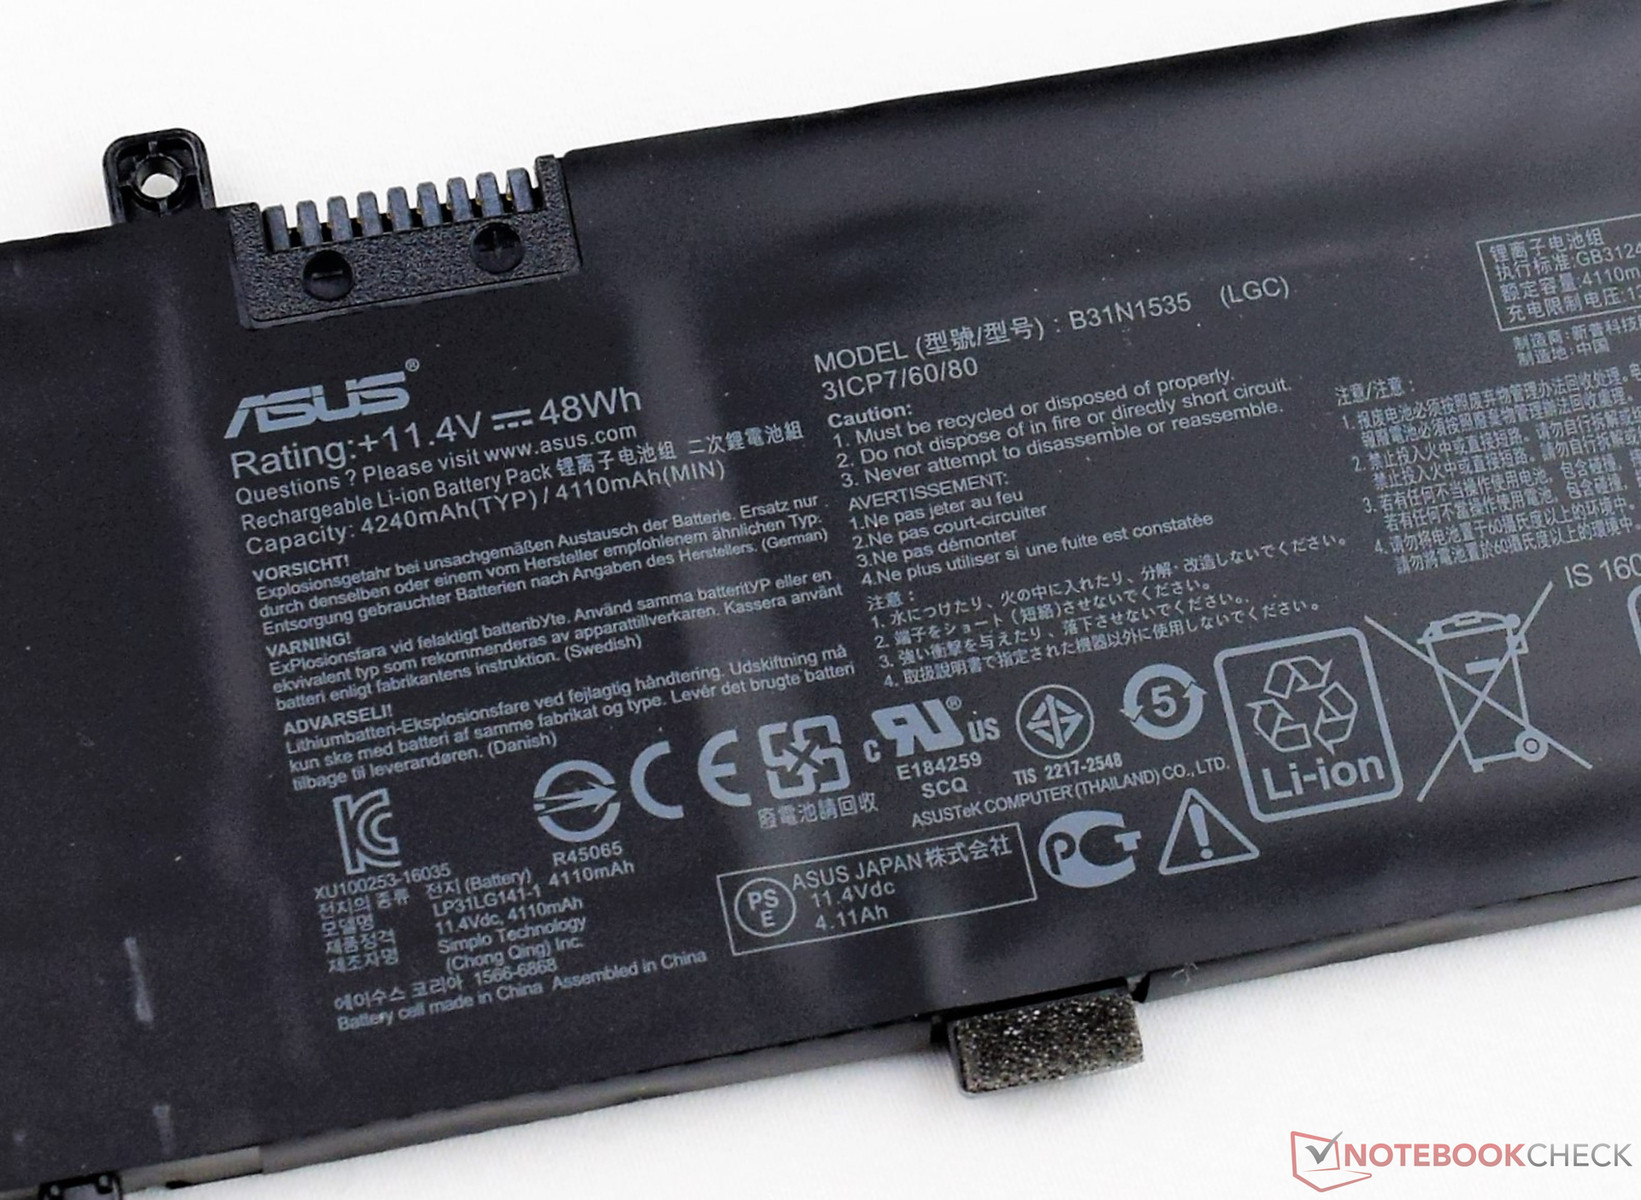
| Asus Zenbook UX310UQ-GL011T 6500U, GeForce 940MX, 48 Wh | Lenovo Yoga 710-14ISK 6200U, GeForce 940MX, 53 Wh | Xiaomi Mi Notebook Air 13.3 2016 6200U, GeForce 940MX, 40 Wh | Lenovo ThinkPad T460p-20FXS05500 6700HQ, GeForce 940MX, 48 Wh | HP Pavilion 14-al003ng 6200U, GeForce 940MX, 41 Wh | |
|---|---|---|---|---|---|
| Duración de Batería | 12% | -14% | -30% | -32% | |
| Reader / Idle (h) | 14.6 | 16 10% | 12 -18% | 11 -25% | |
| H.264 (h) | 7 | 7.1 1% | 7.1 1% | 6 -14% | |
| WiFi v1.3 (h) | 8.1 | 7.2 -11% | 6.5 -20% | 5 -38% | 5.5 -32% |
| Load (h) | 1.7 | 2.5 47% | 1.4 -18% | 1 -41% |
Pro
Contra
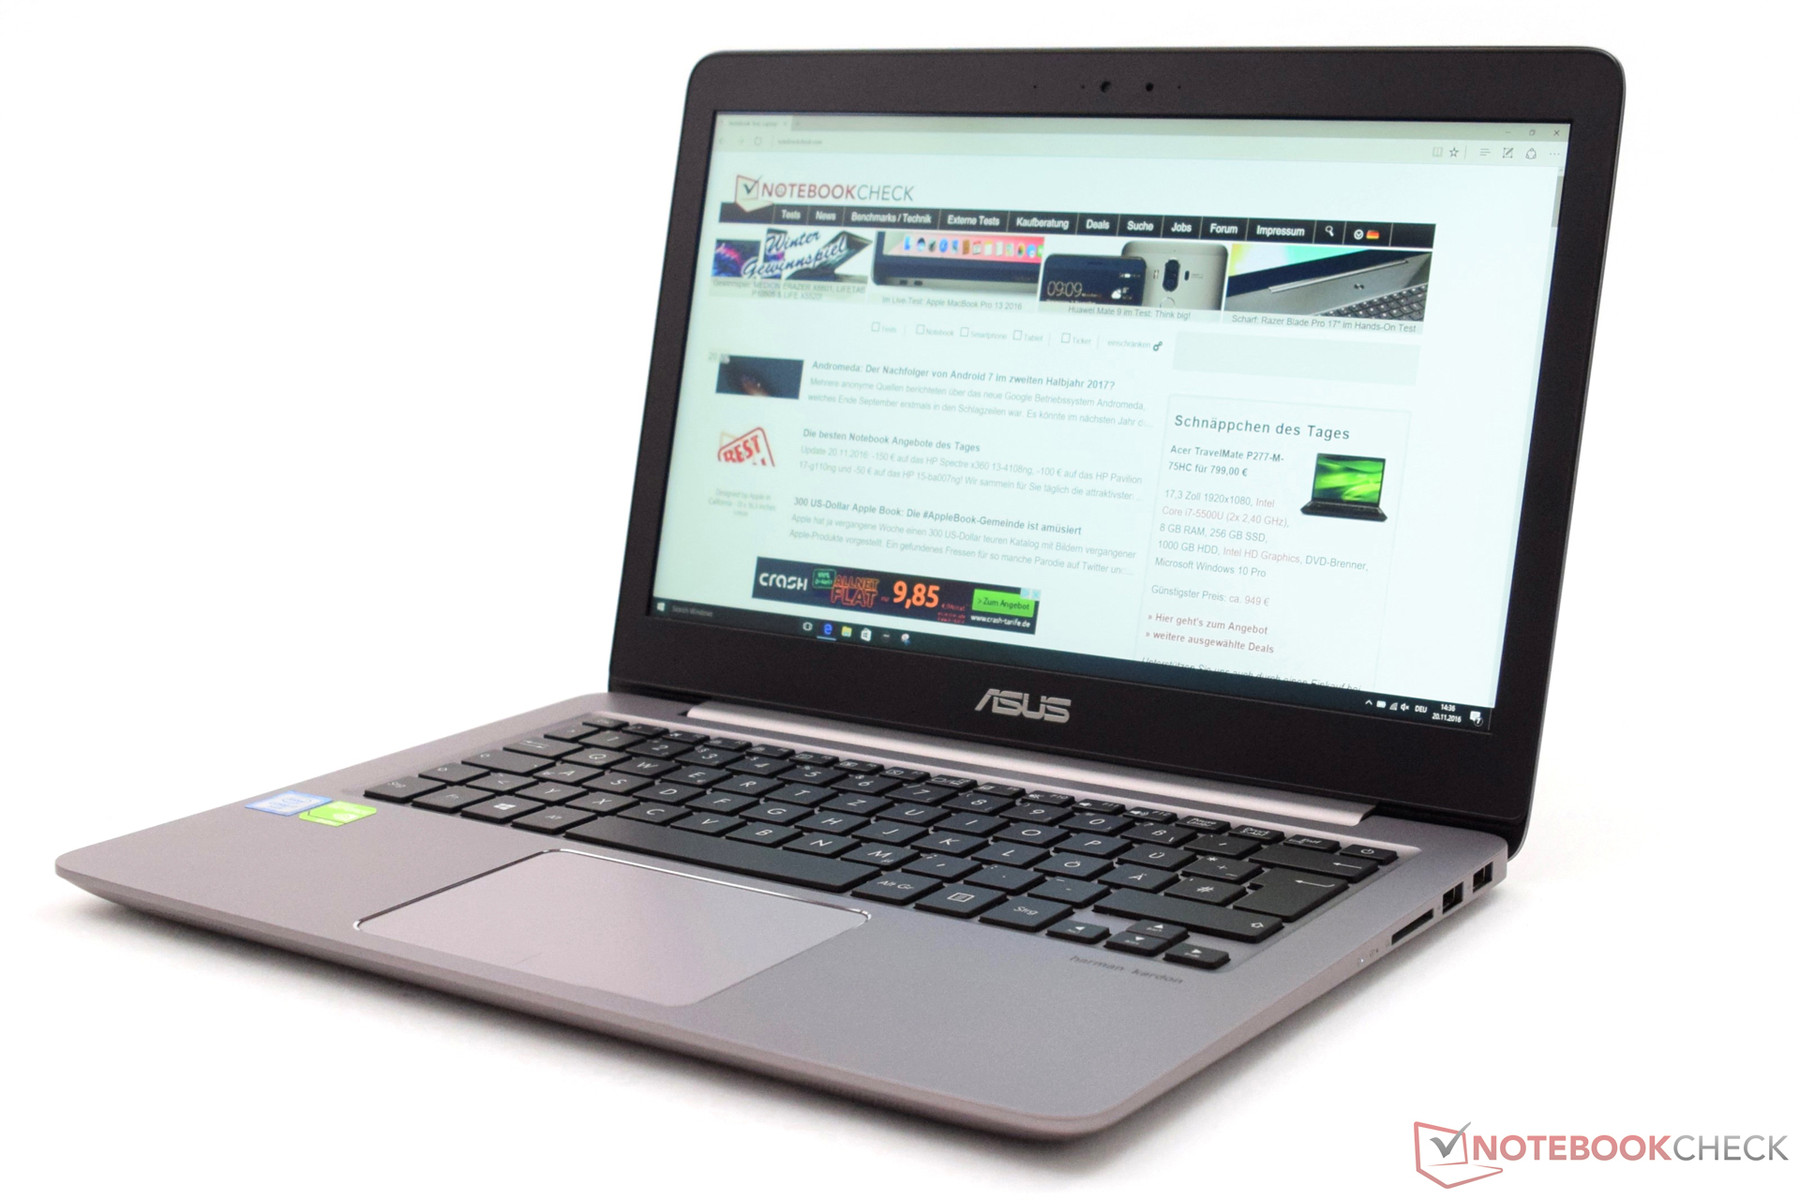
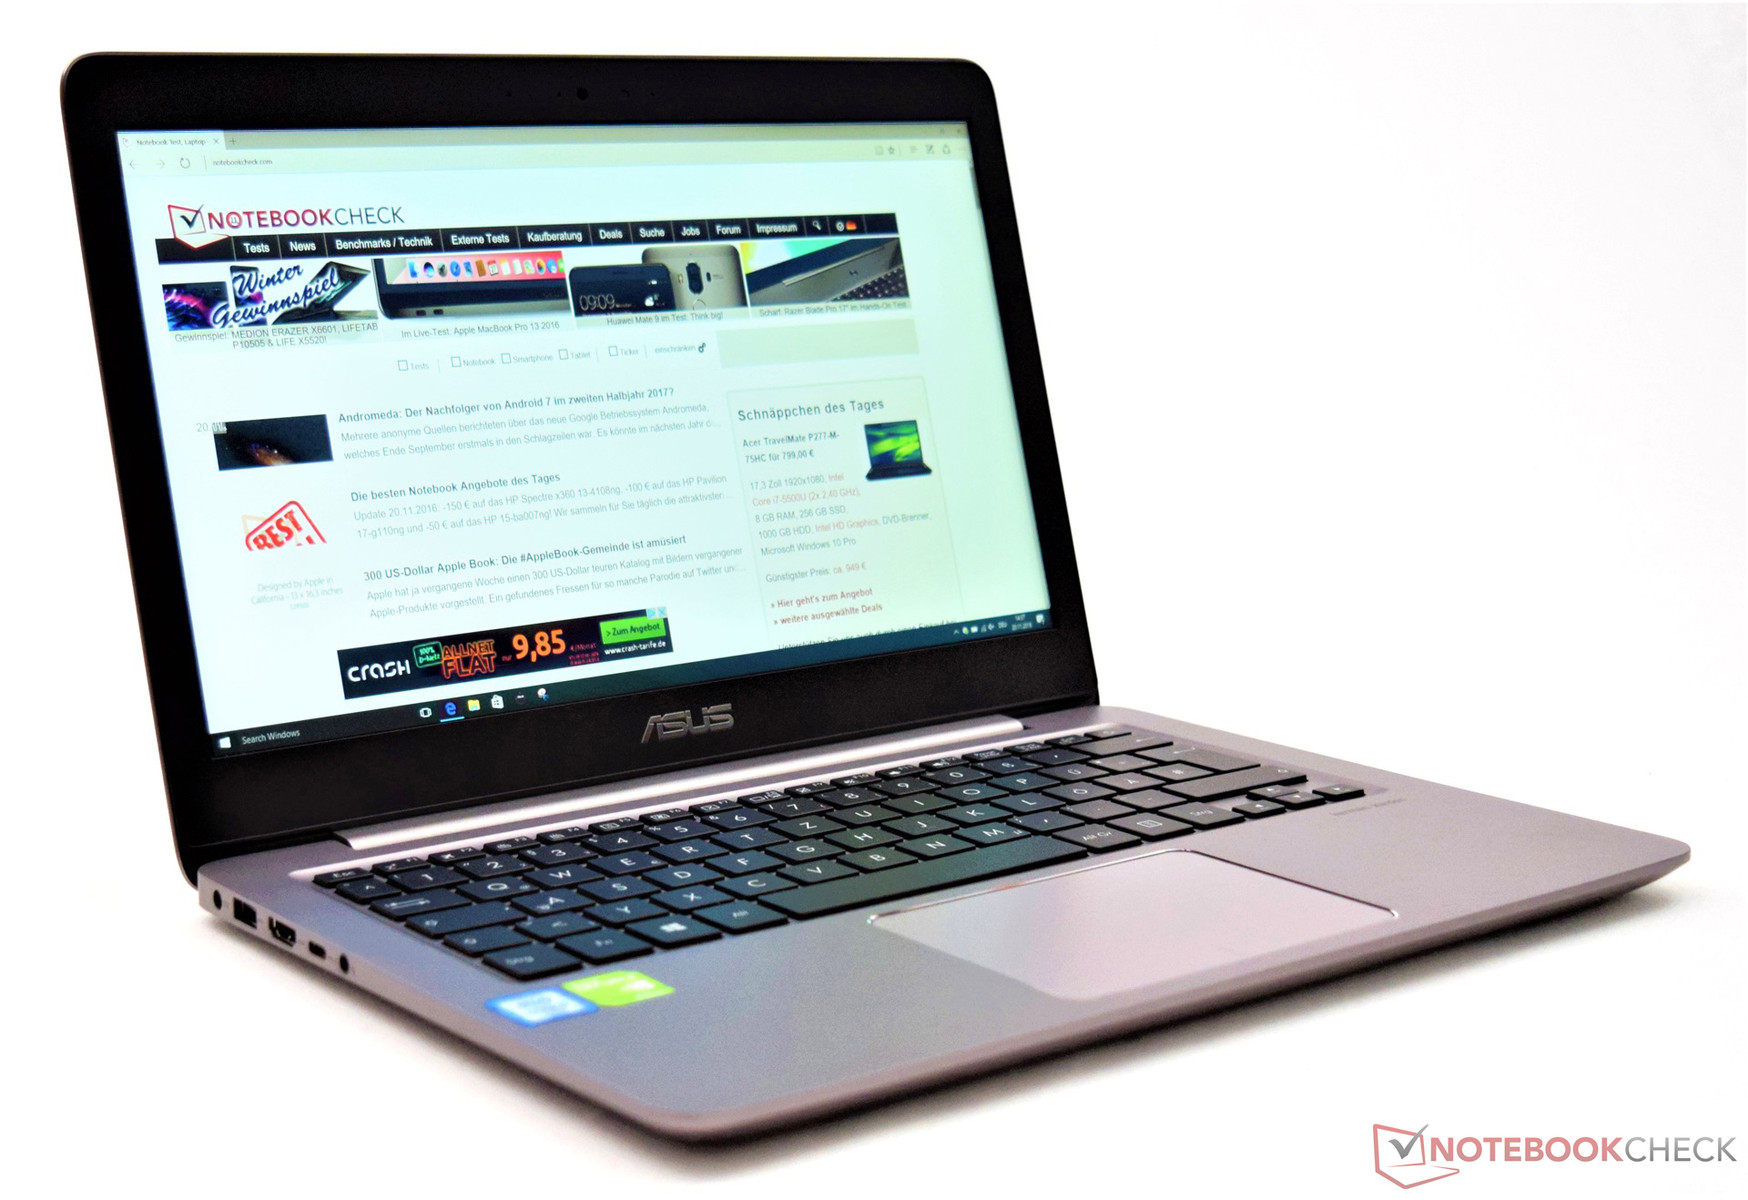
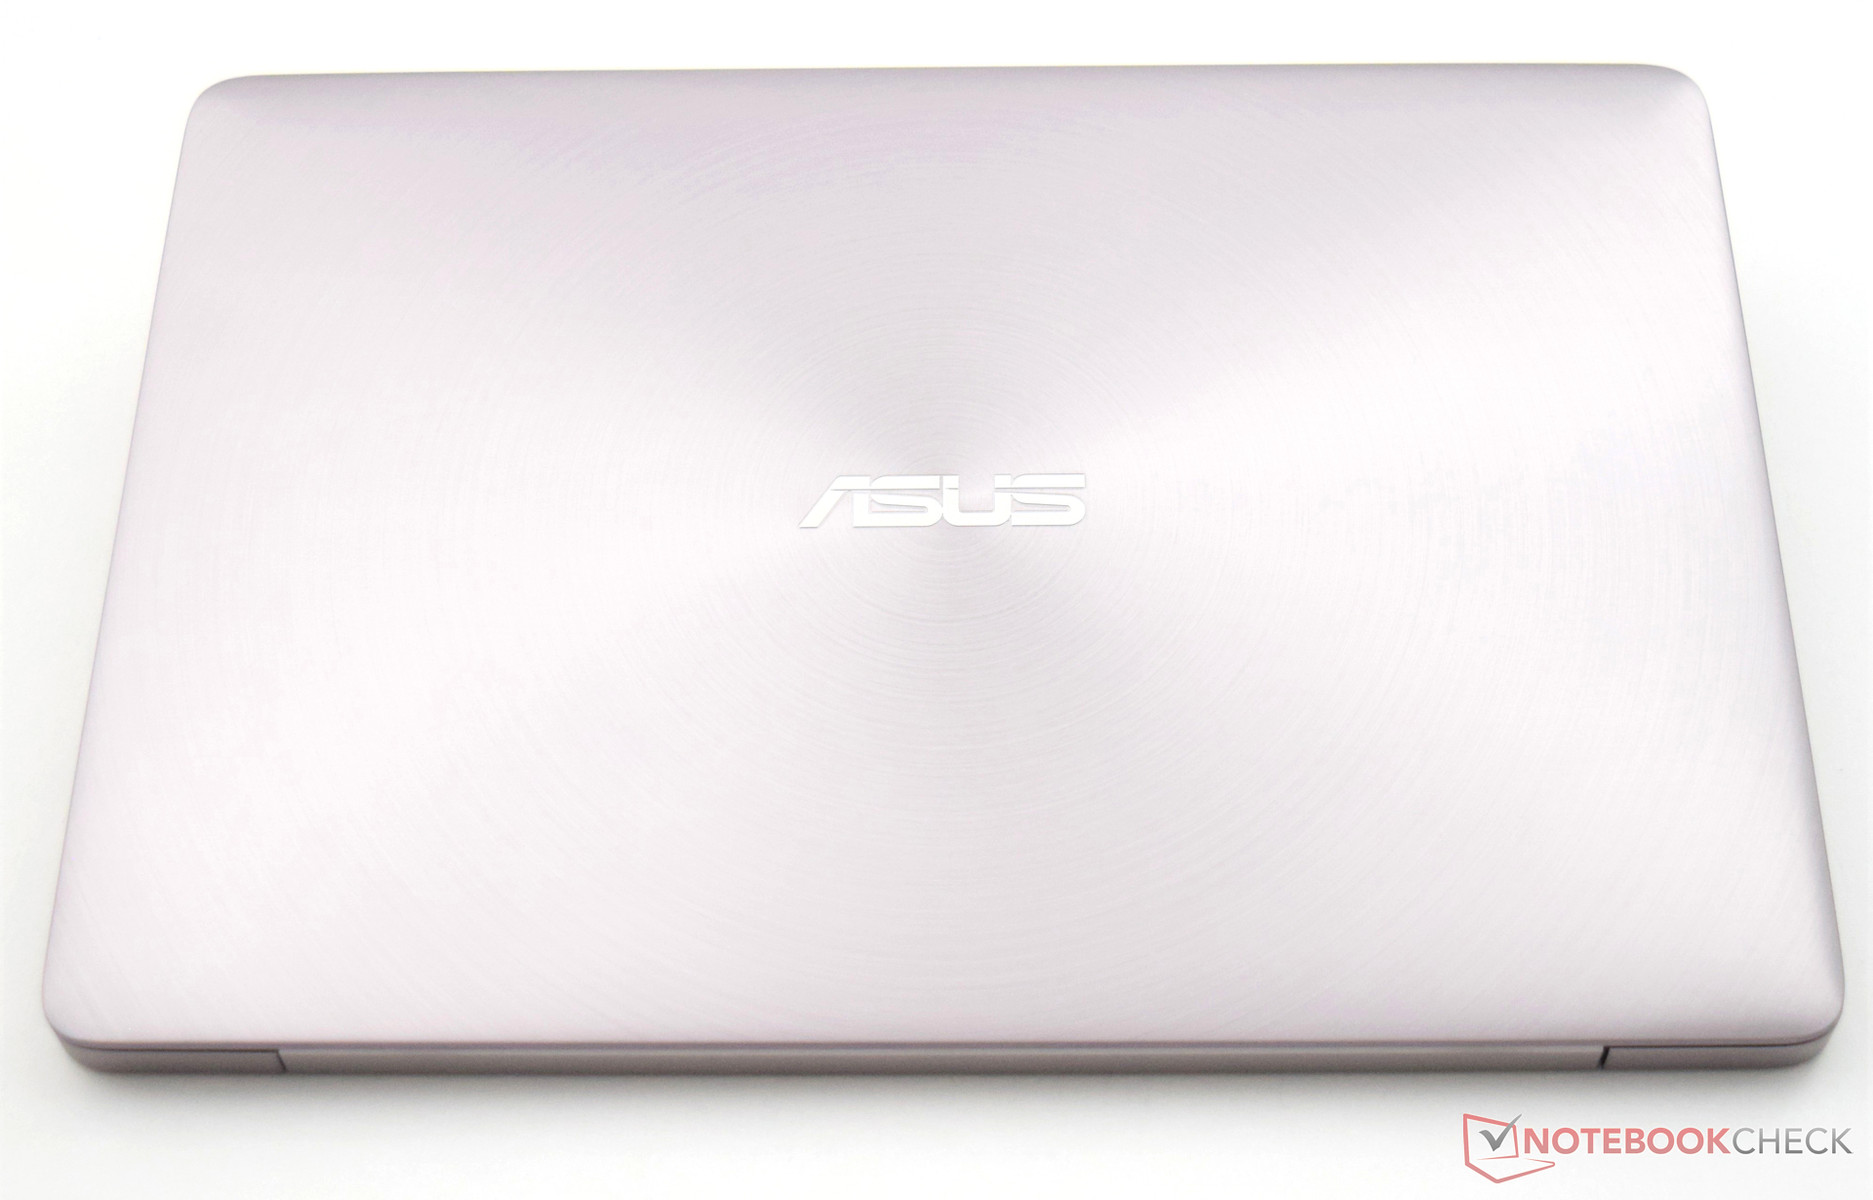
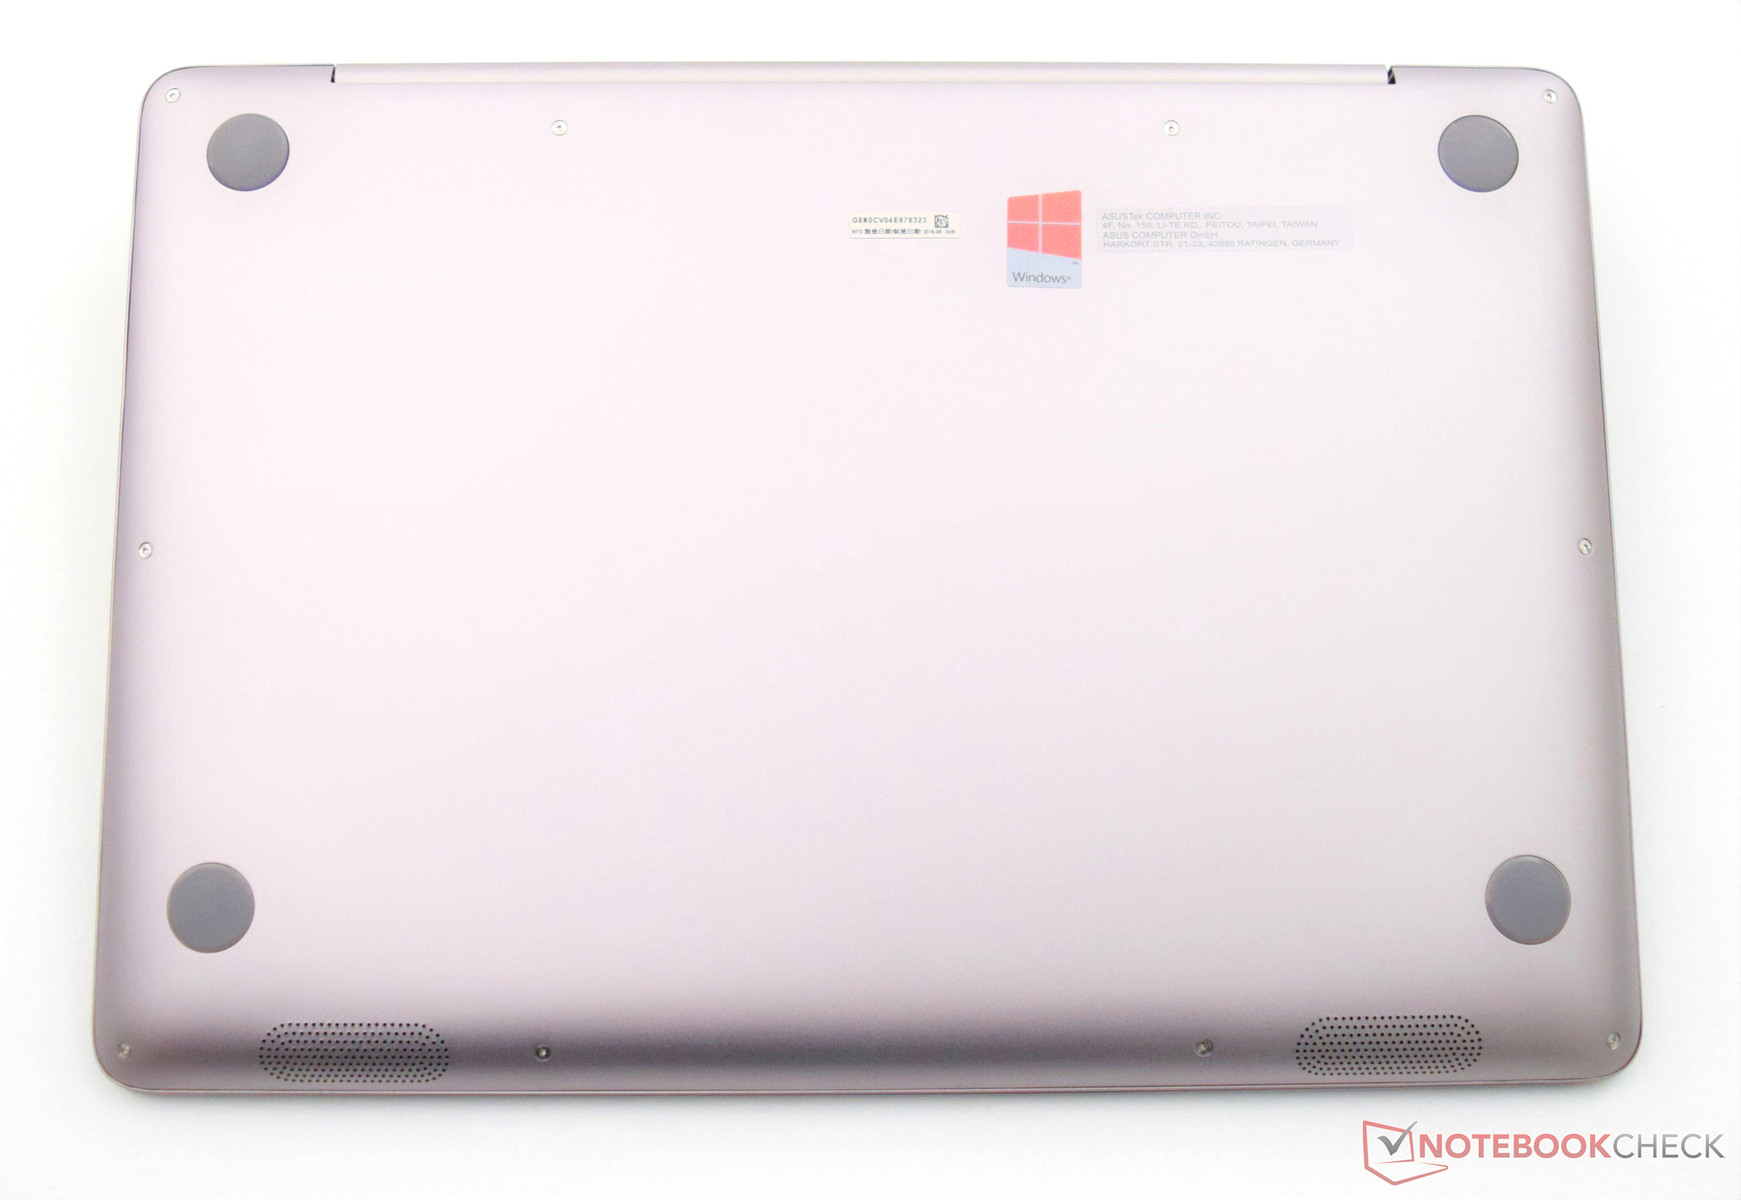
La gama Zenbook de Asus es conocida por sus dispositivos ligeros y transportables y podemos decir que el Asus Zenbook UX310UQ es ambas cosas. Con el Zenbook UX310UQ, ASUS ofrece un subportátil muy duradero, que convence gracias a sus materiales de gama alta y a una buena calidad de construcción. El modelo de prueba proporciona un buen rendimiento y una muy buena duración de batería por 1200 euros.
A primera vista el Asus Zenbook UX310UQ aparenta ser de gama muy alta. Su bajo peso y larga duración de batería hacen de este dispositivo un buen acompañante para las tareas cotidianas. Los clientes obtendrán un dispositivo muy elegante por 1200 euros.
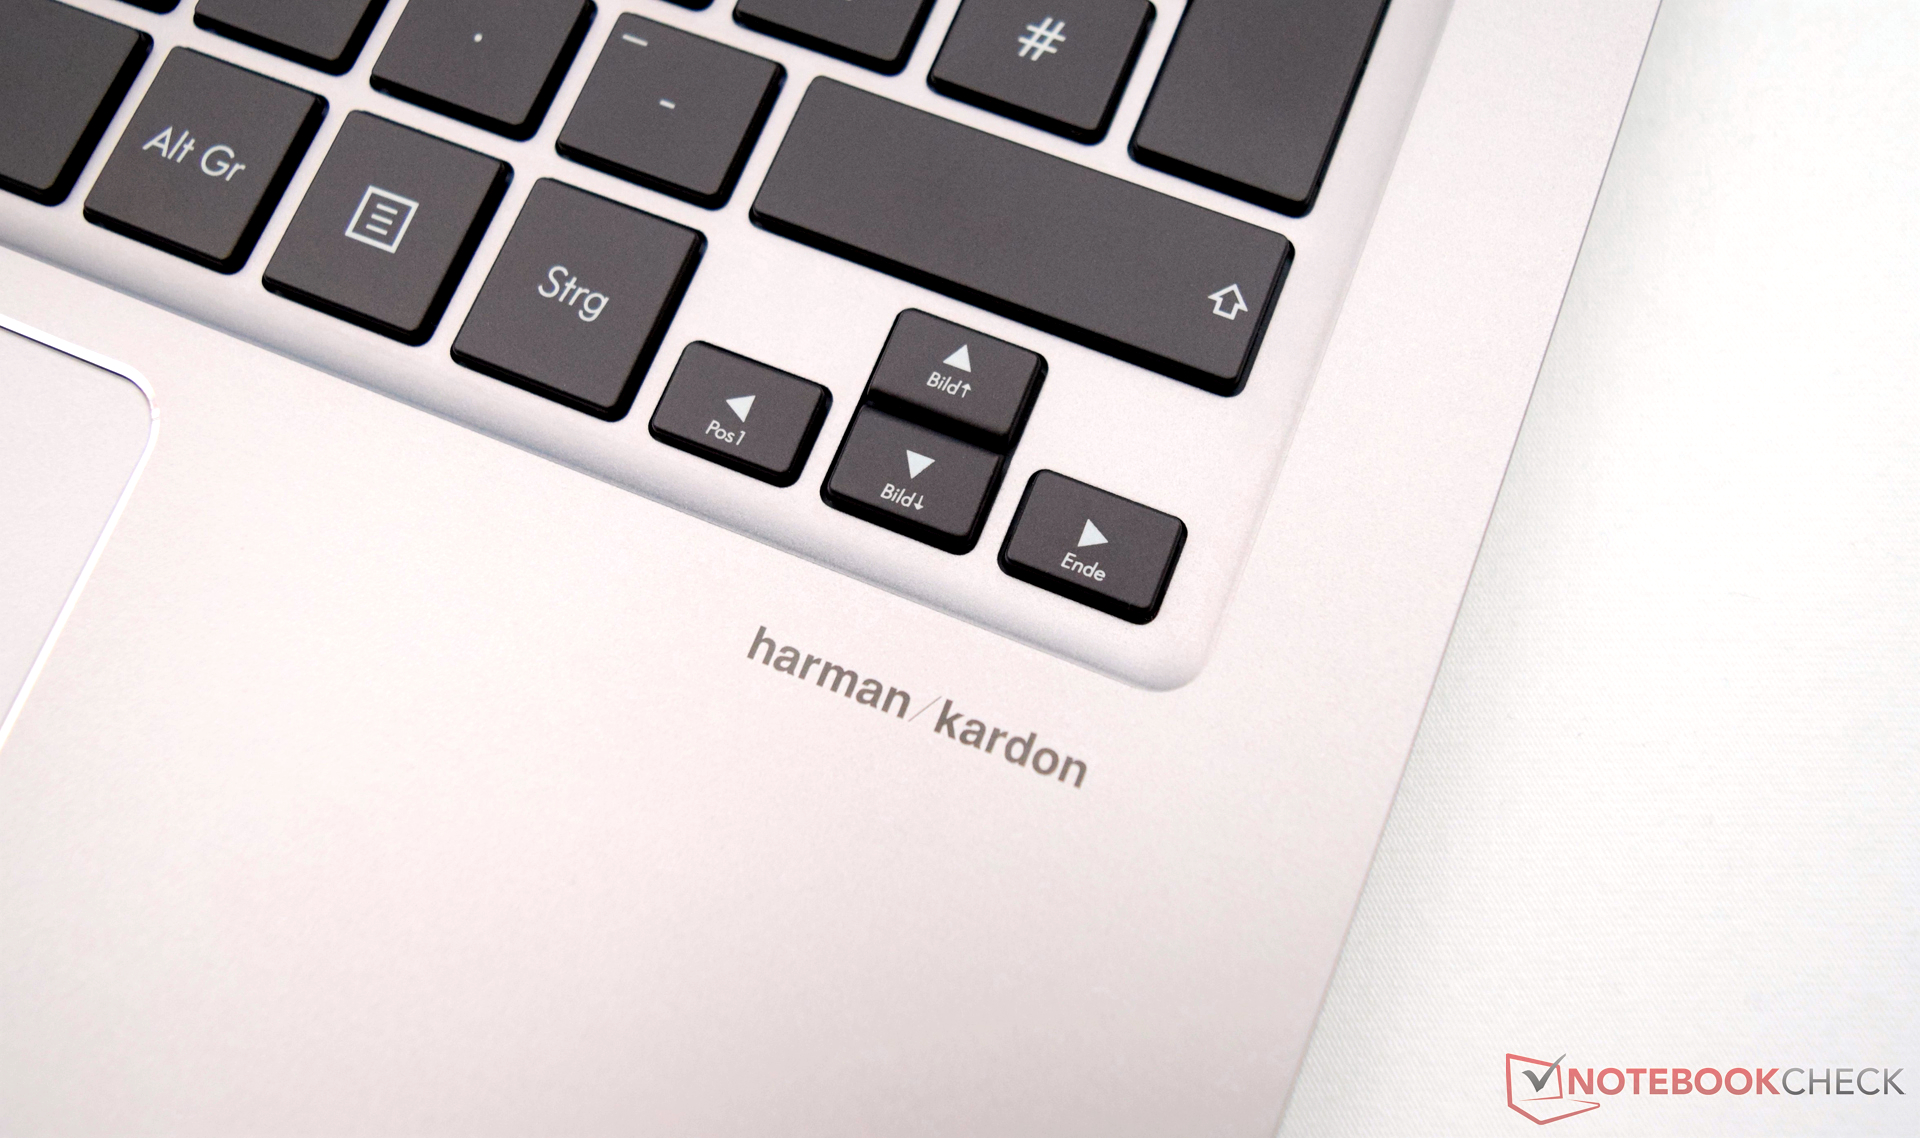
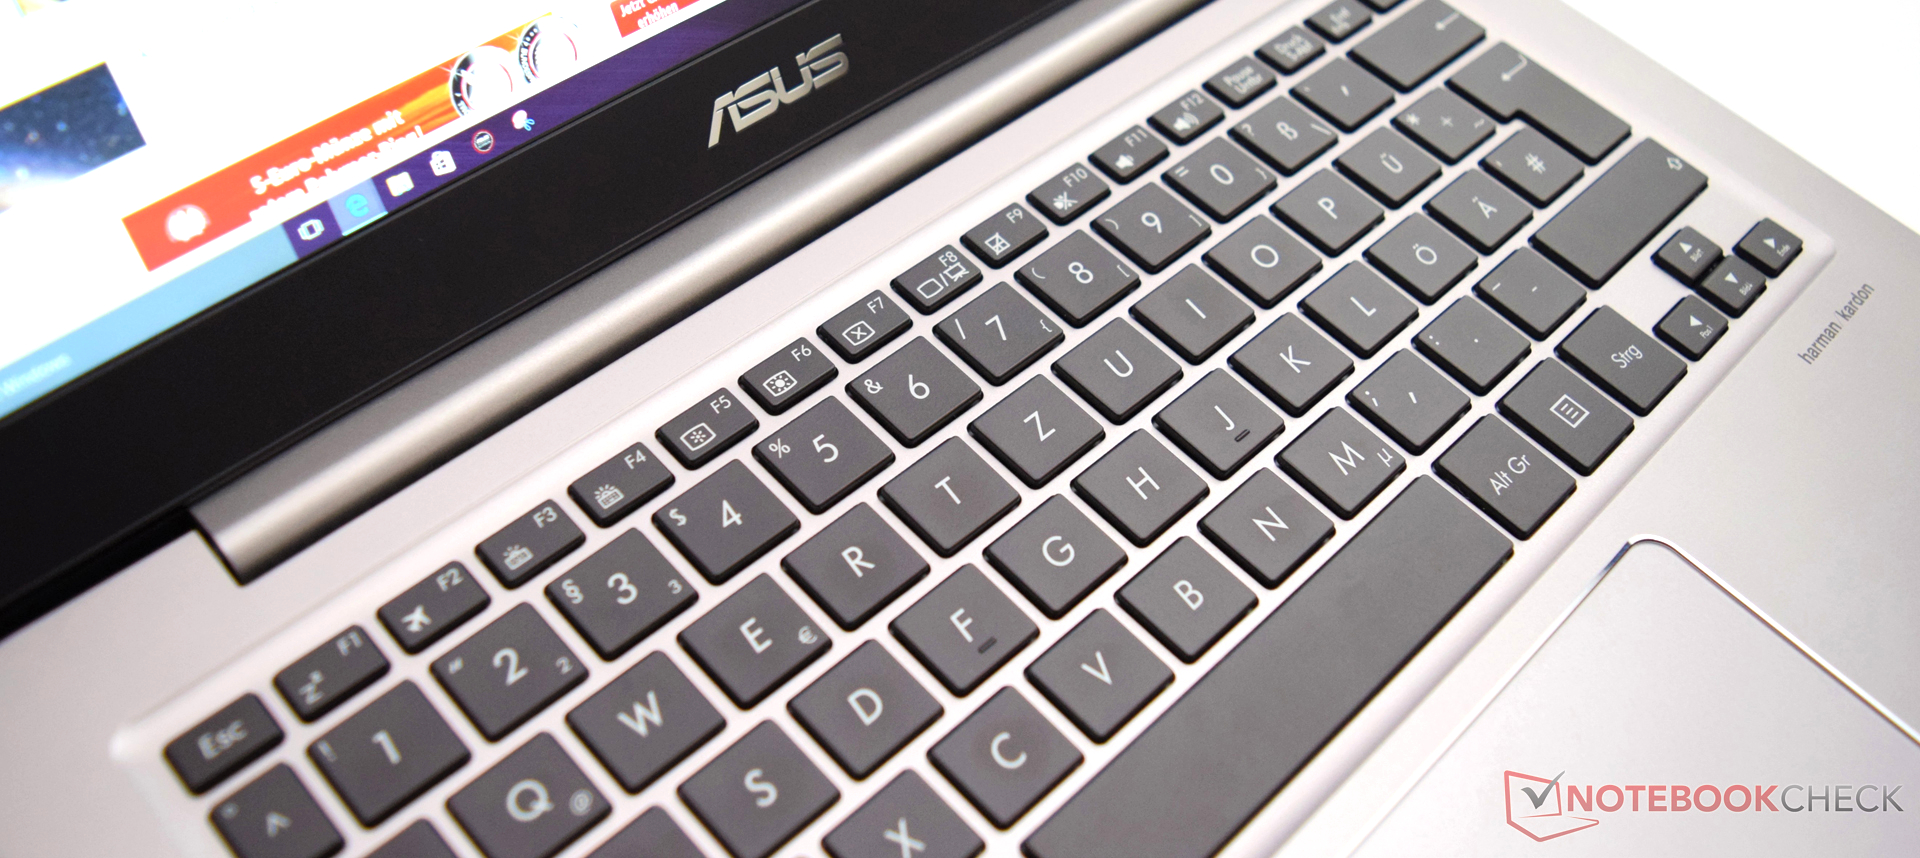
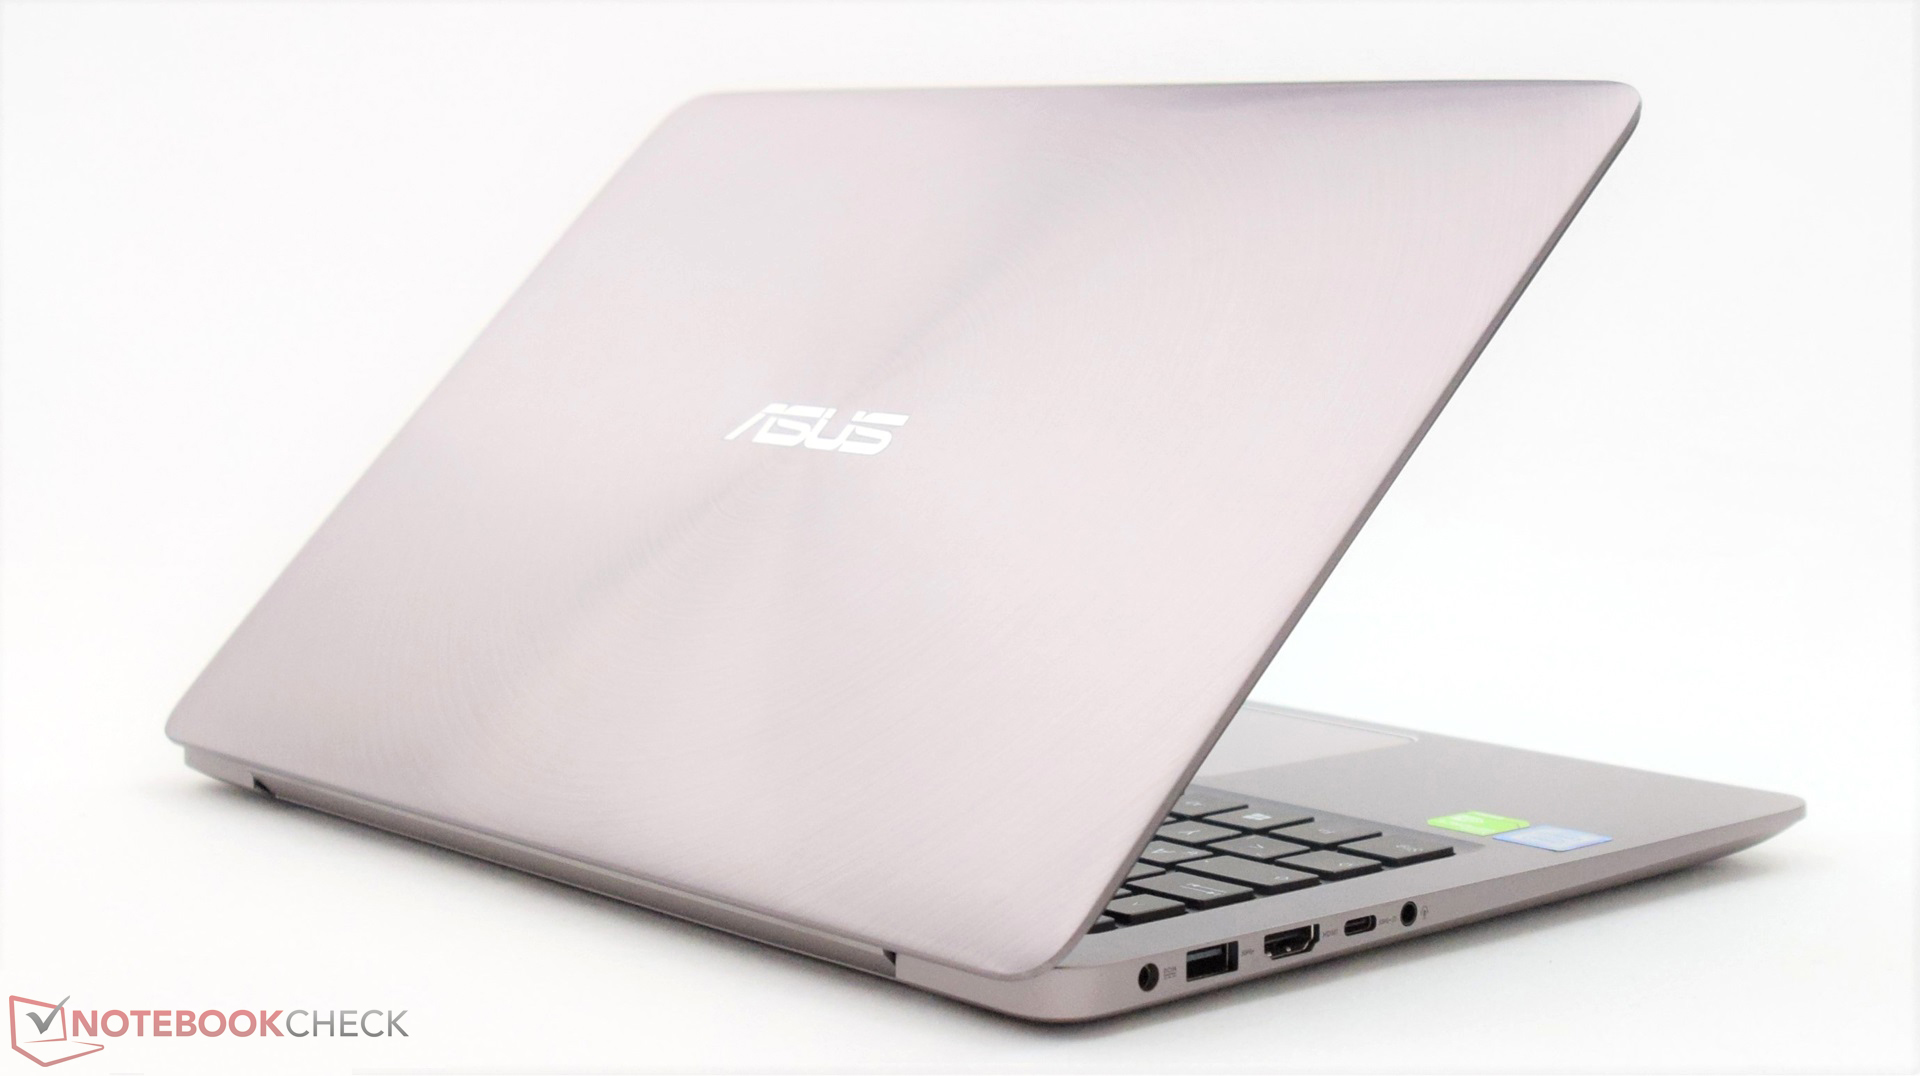
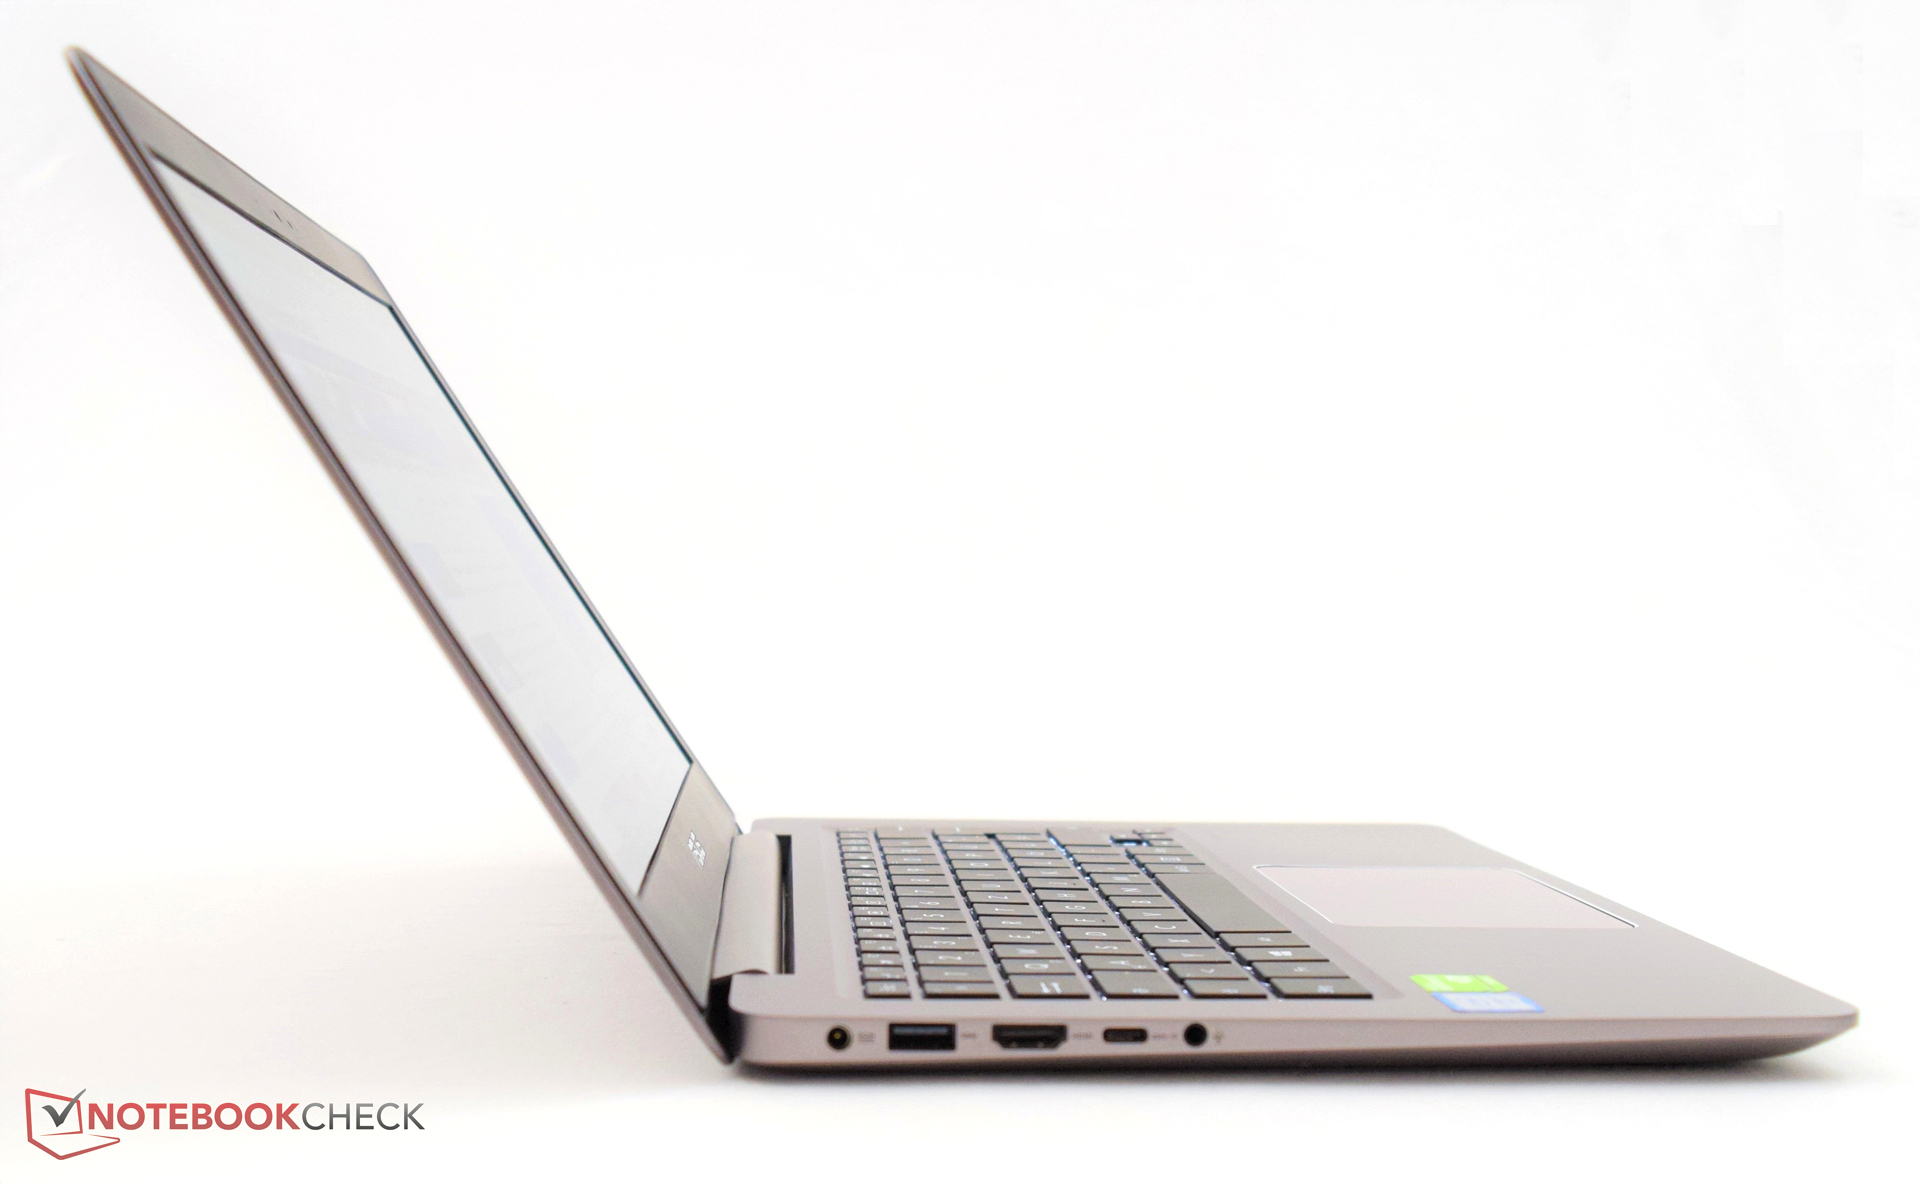
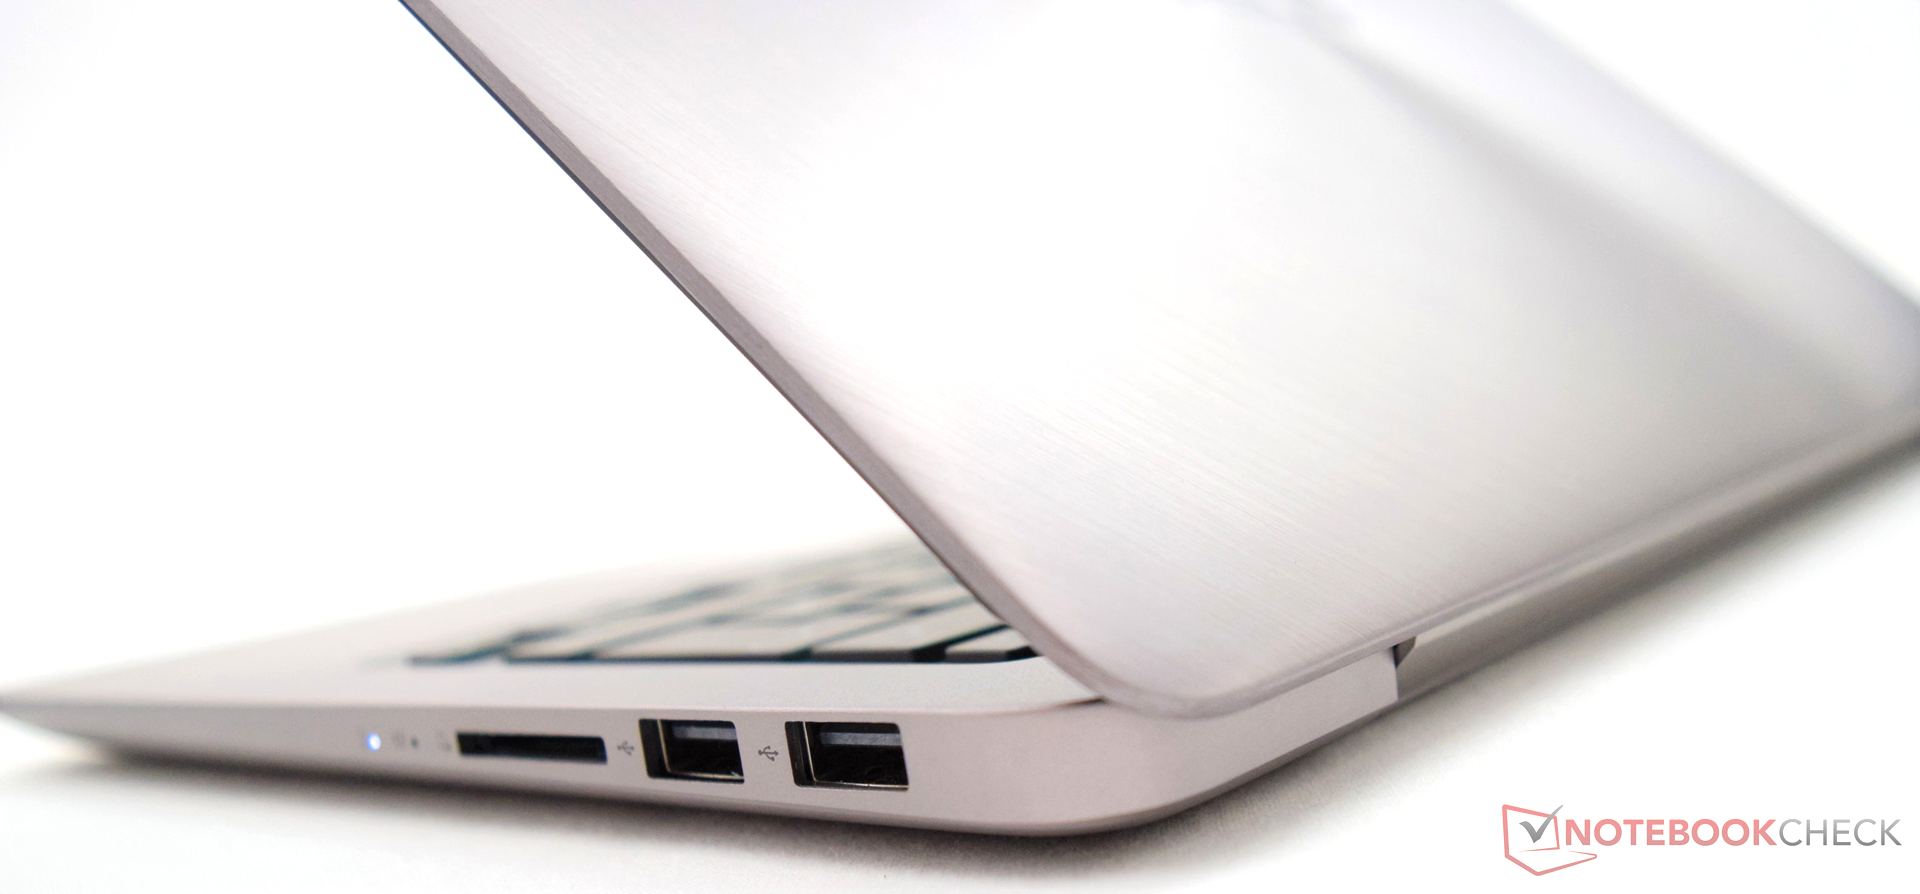
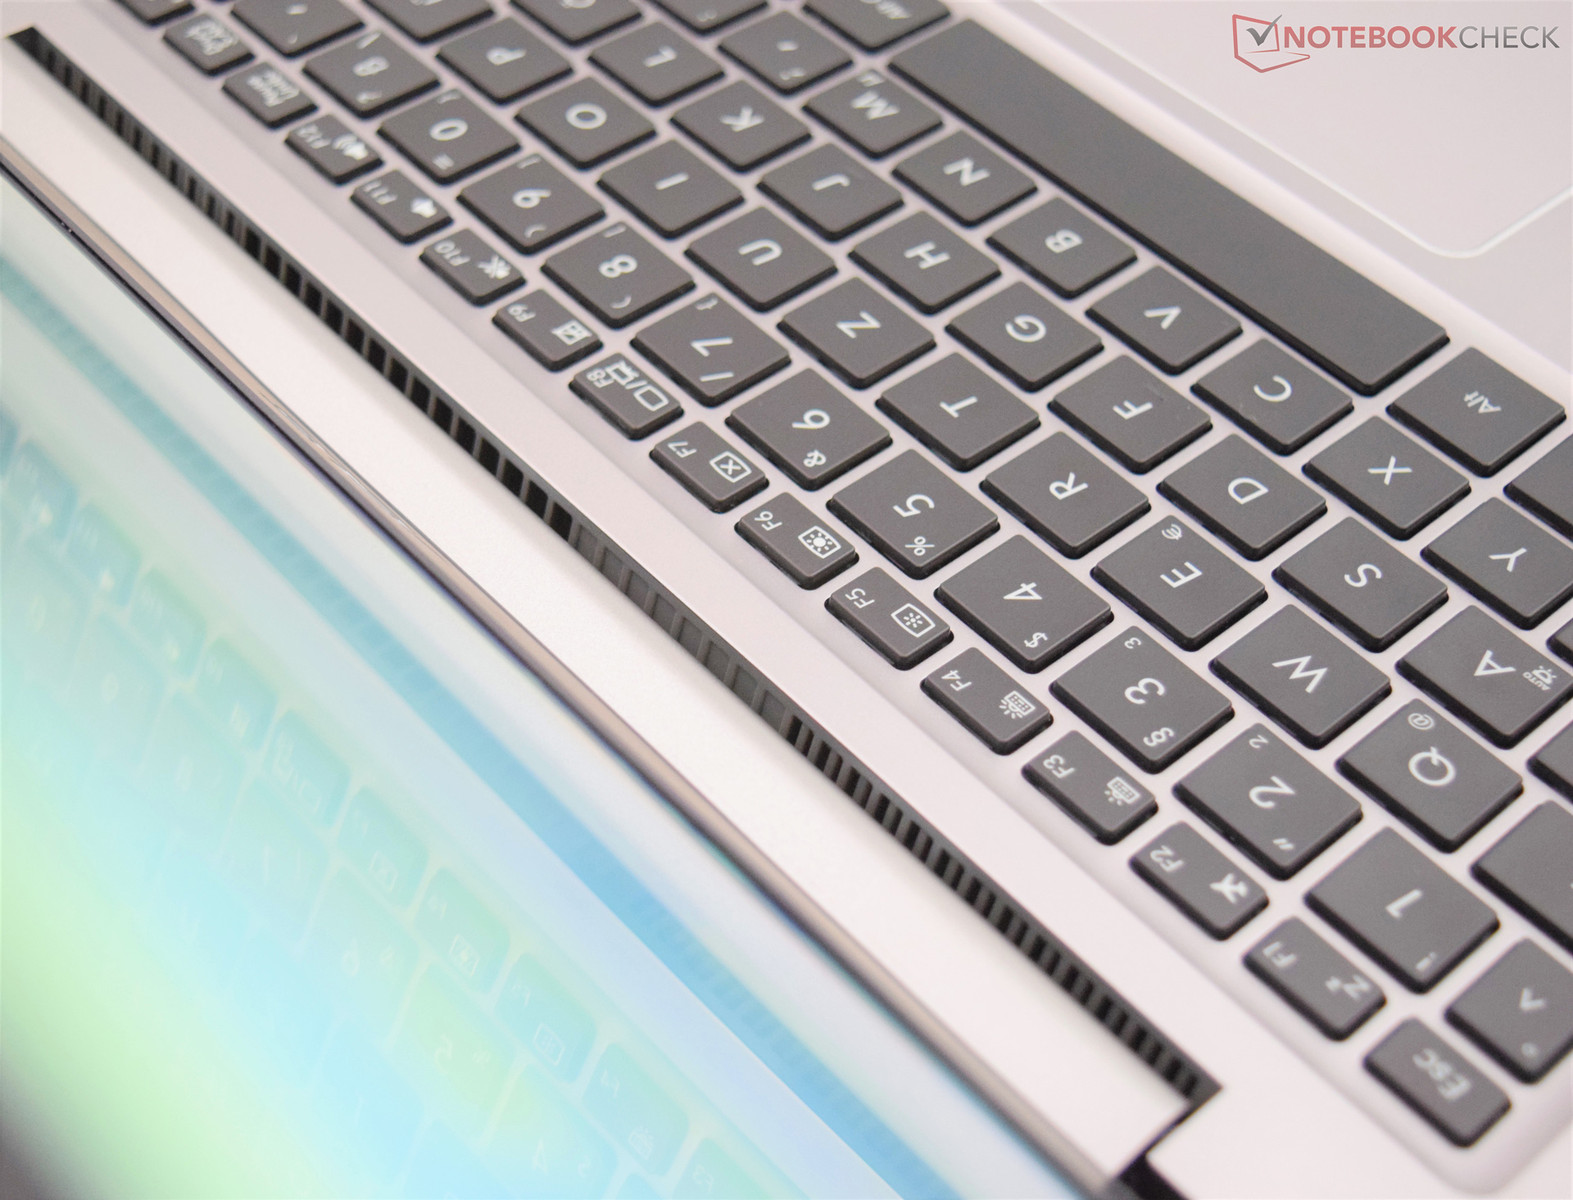
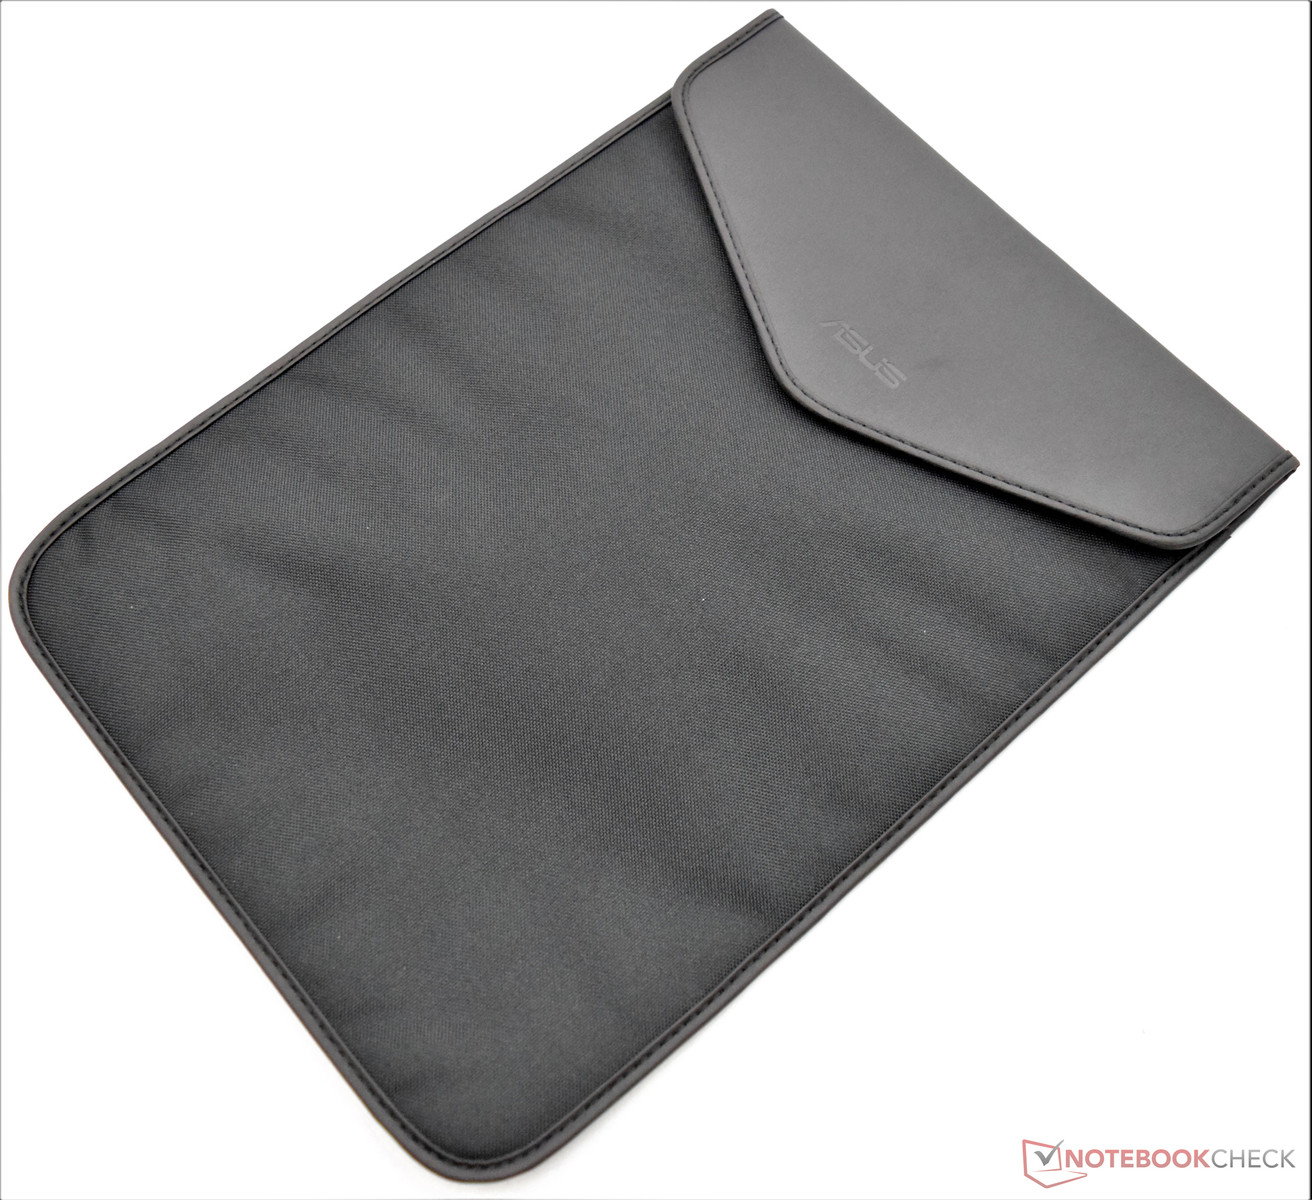
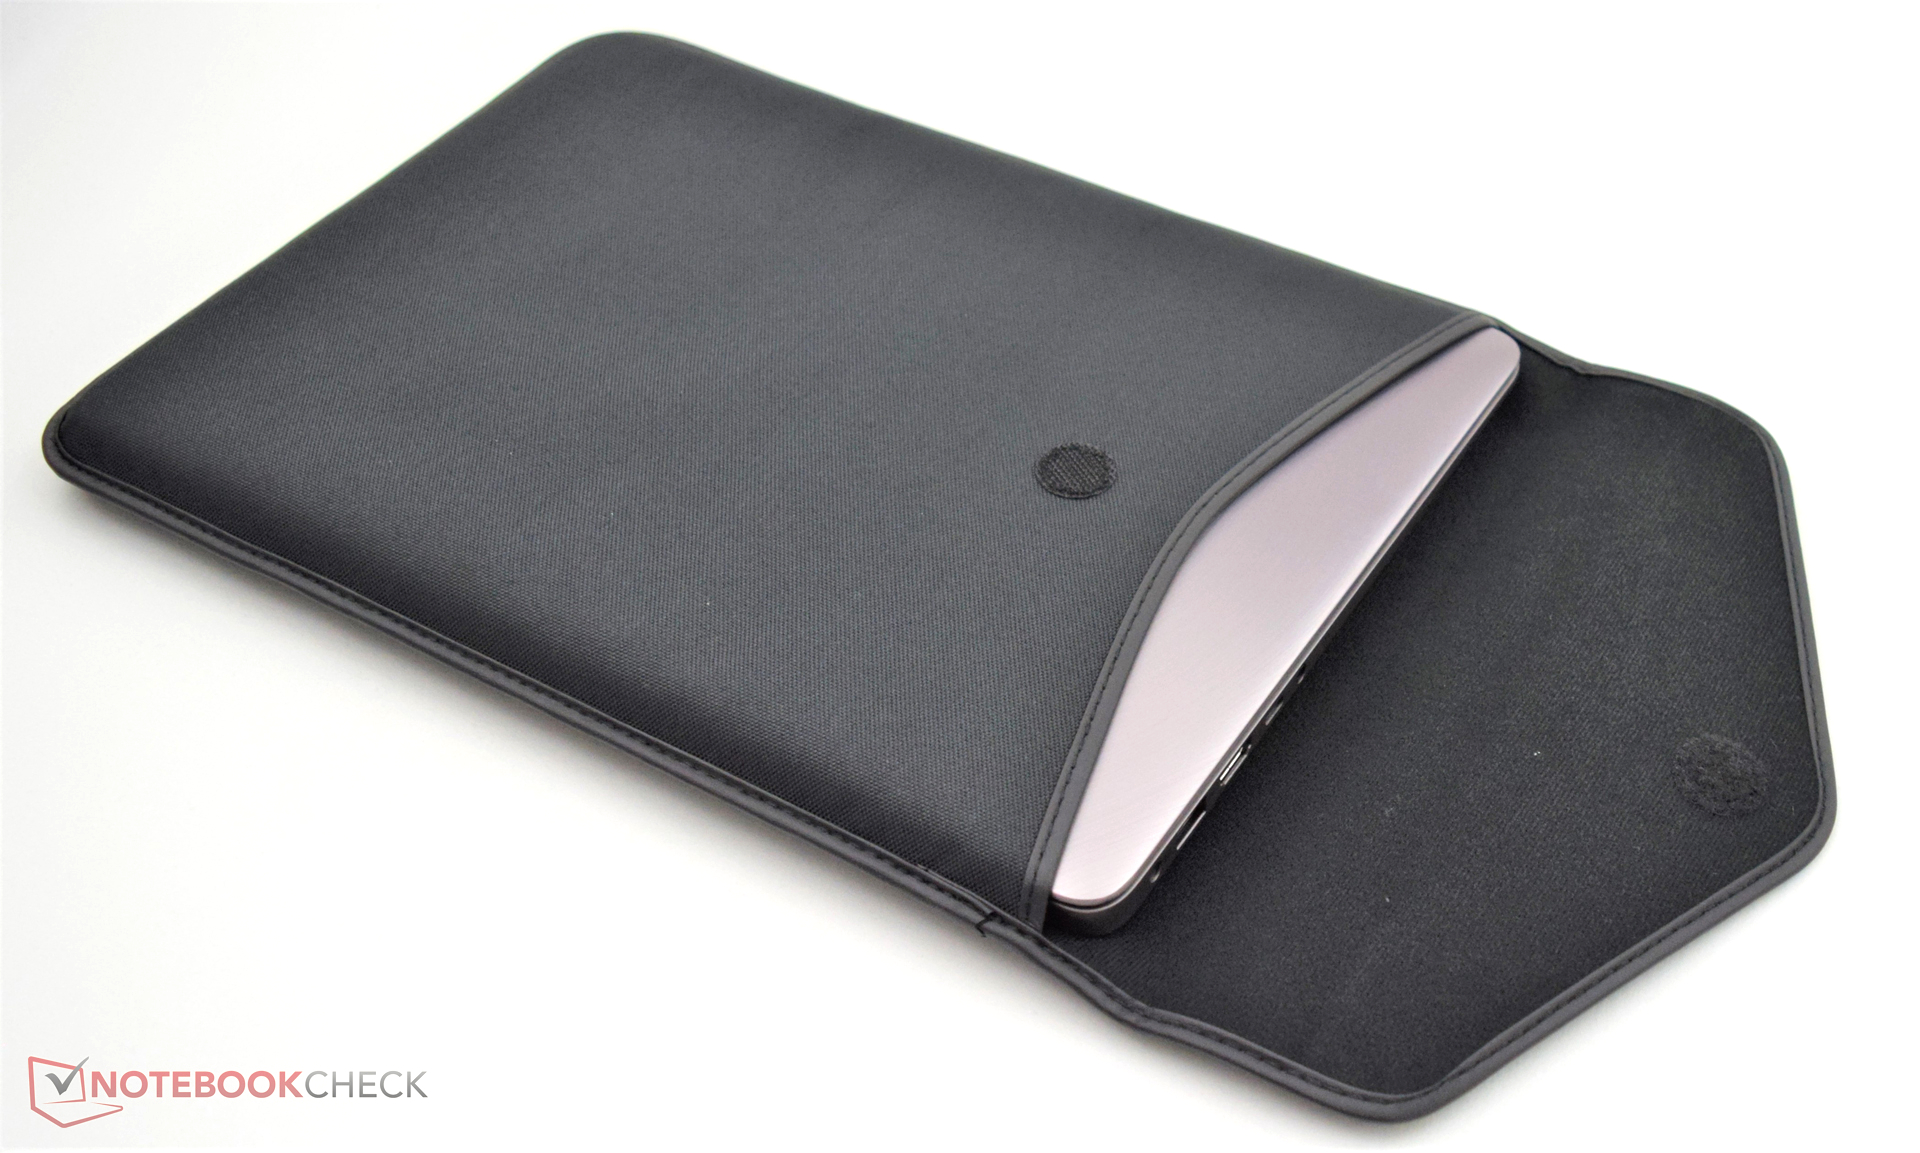
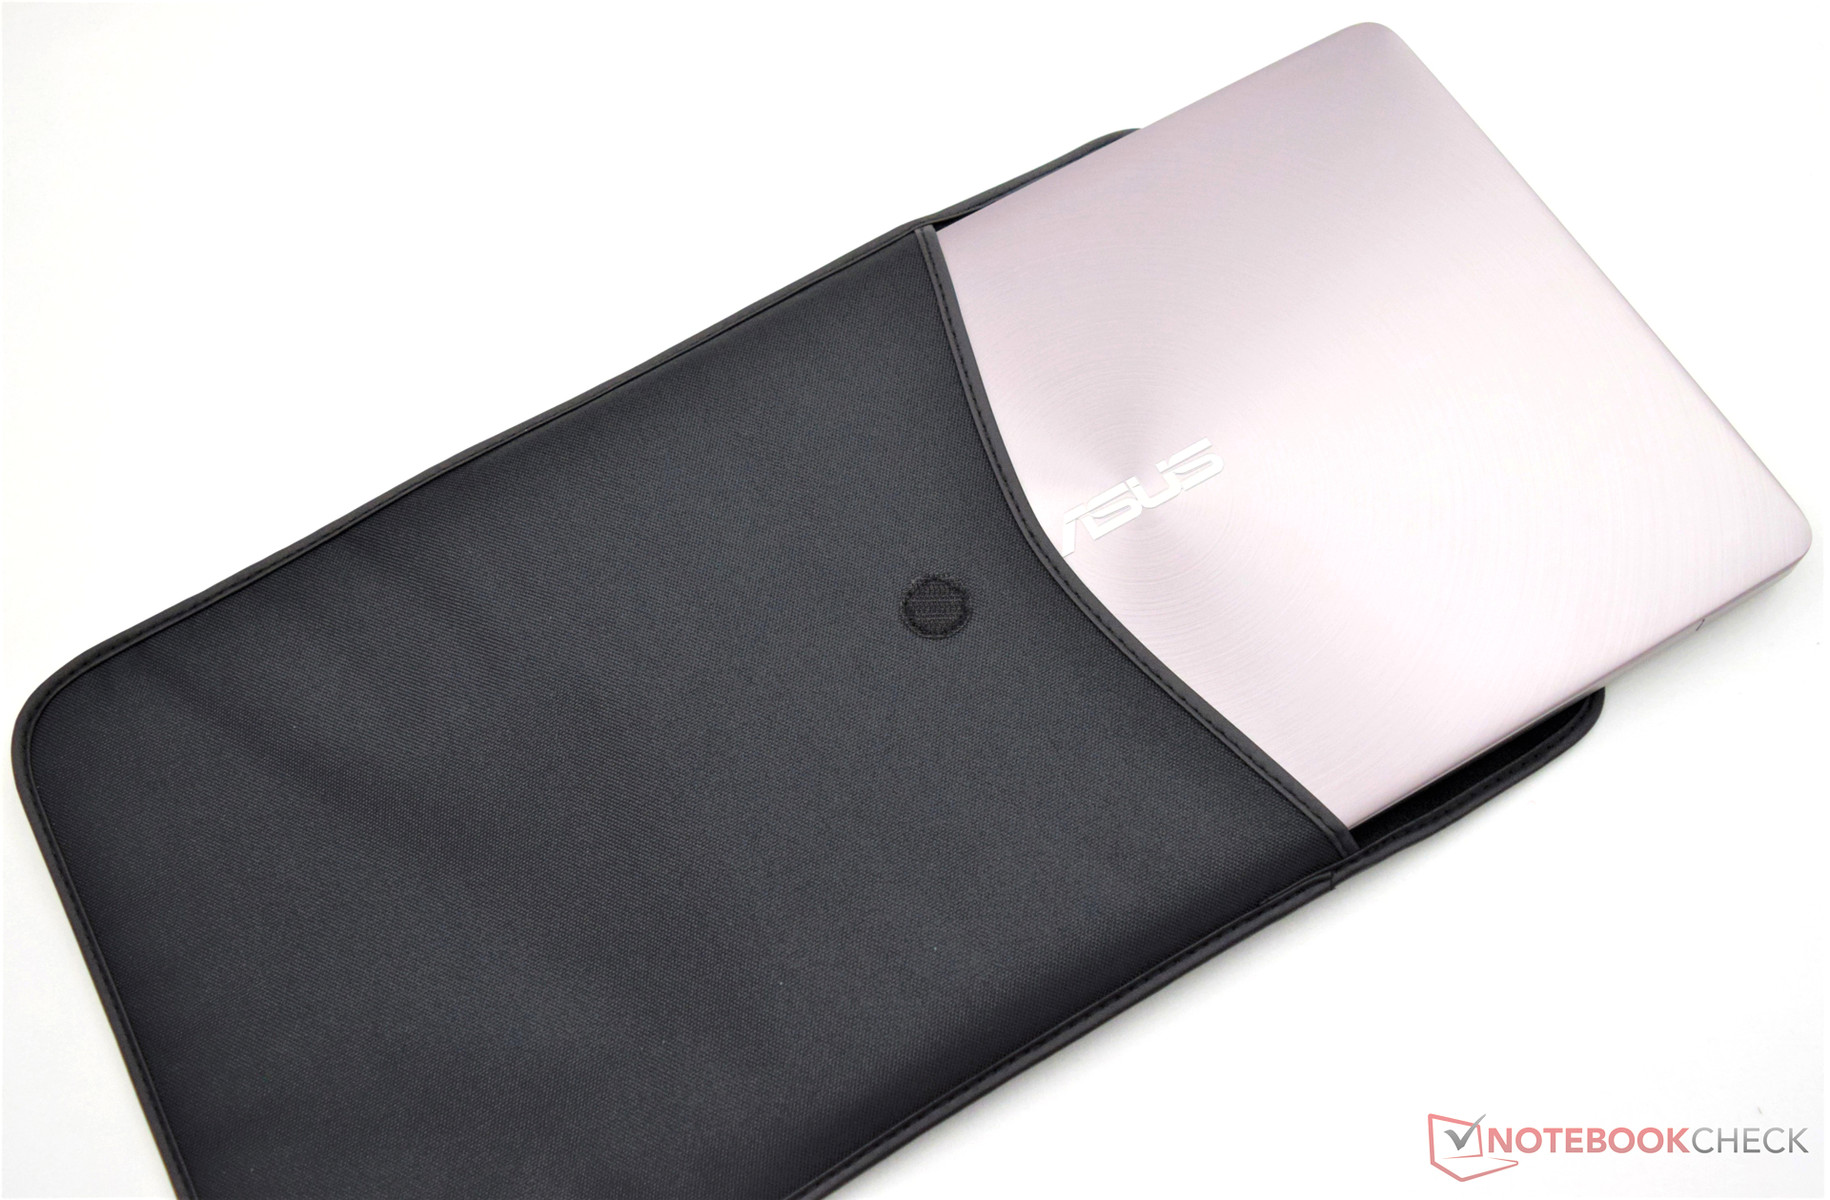
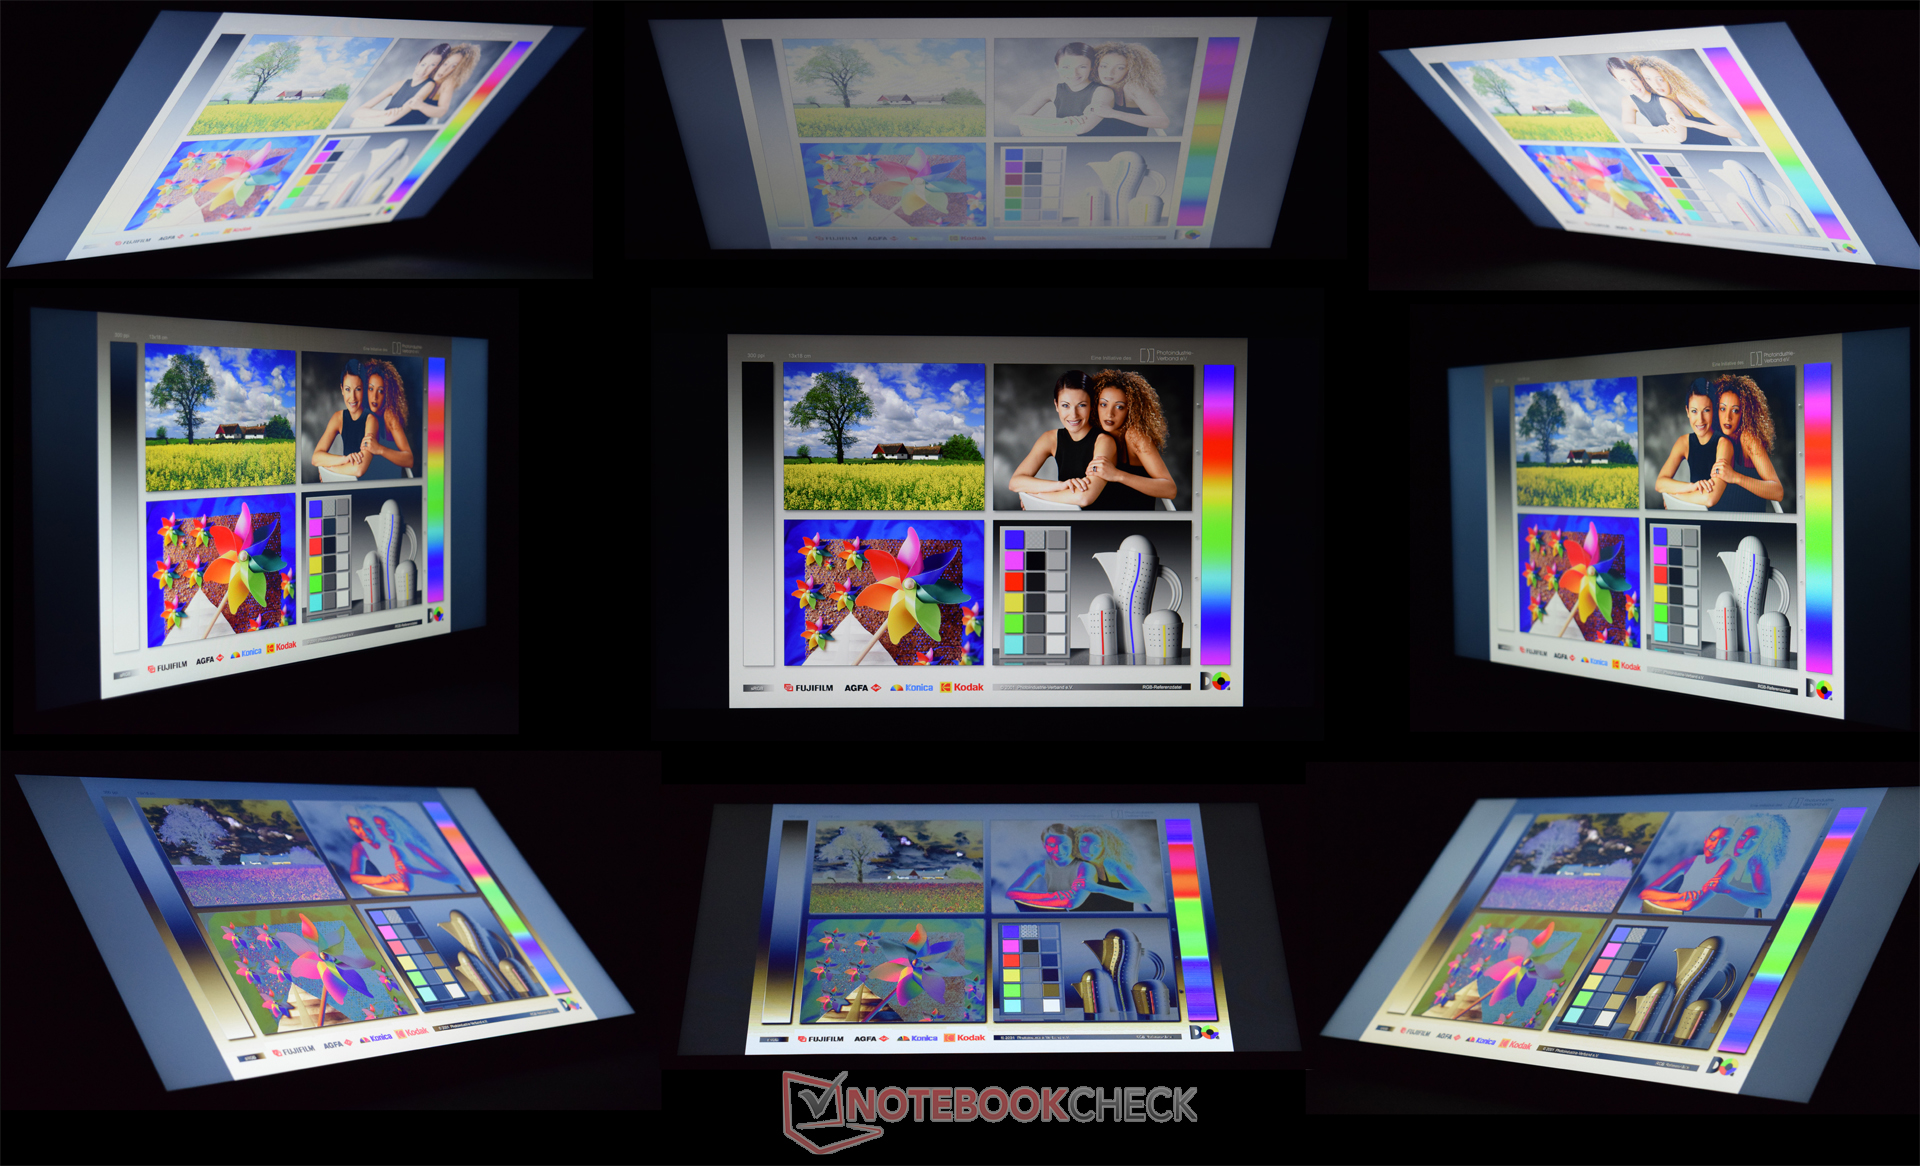
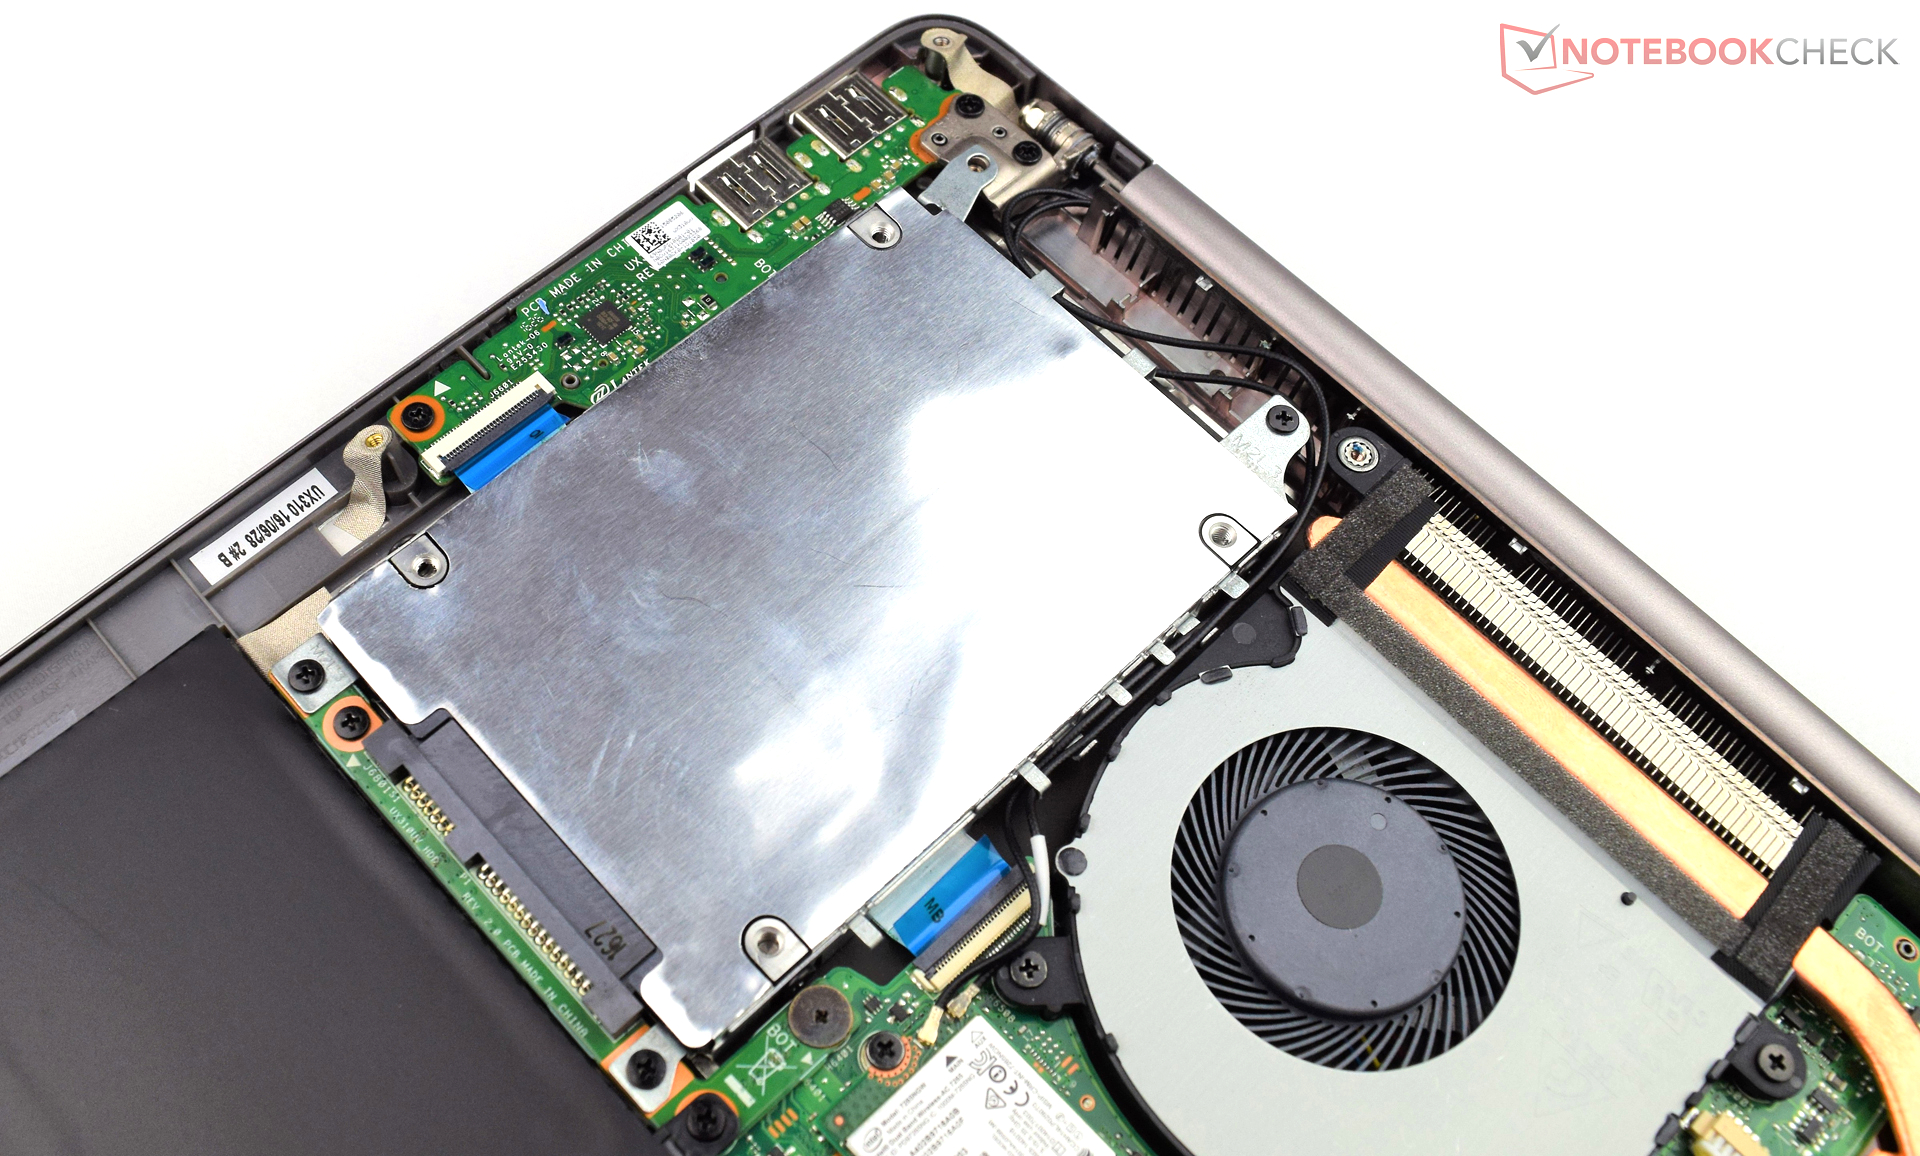
El panel TN incluido resulta bastante decepcionante. Un dispositivo de este precio debería incluir una batería de mucha mayor calidad. Los dispositivos de entrada tampoco son del todo convincentes. Por lo tanto la gente que haga uso intensivo del teclado no debería escoger el Zenbook UX310UQ. La funda incluida resulta util para transportar el portátil siempre supone una ventaja. Además, Asus ha hecho un buen trabajo en términos de conectividad. Para un dispositivo de 13 pulgadas, se han incluido interfaces suficientes para la conexión de muchos periféricos.
Ésta es una versión acortada del análisis original. Puedes leer el análisis completo en inglés aquí.
Asus Zenbook UX310UQ-GL011T
- 12/06/2016 v6 (old)
Sebastian Bade