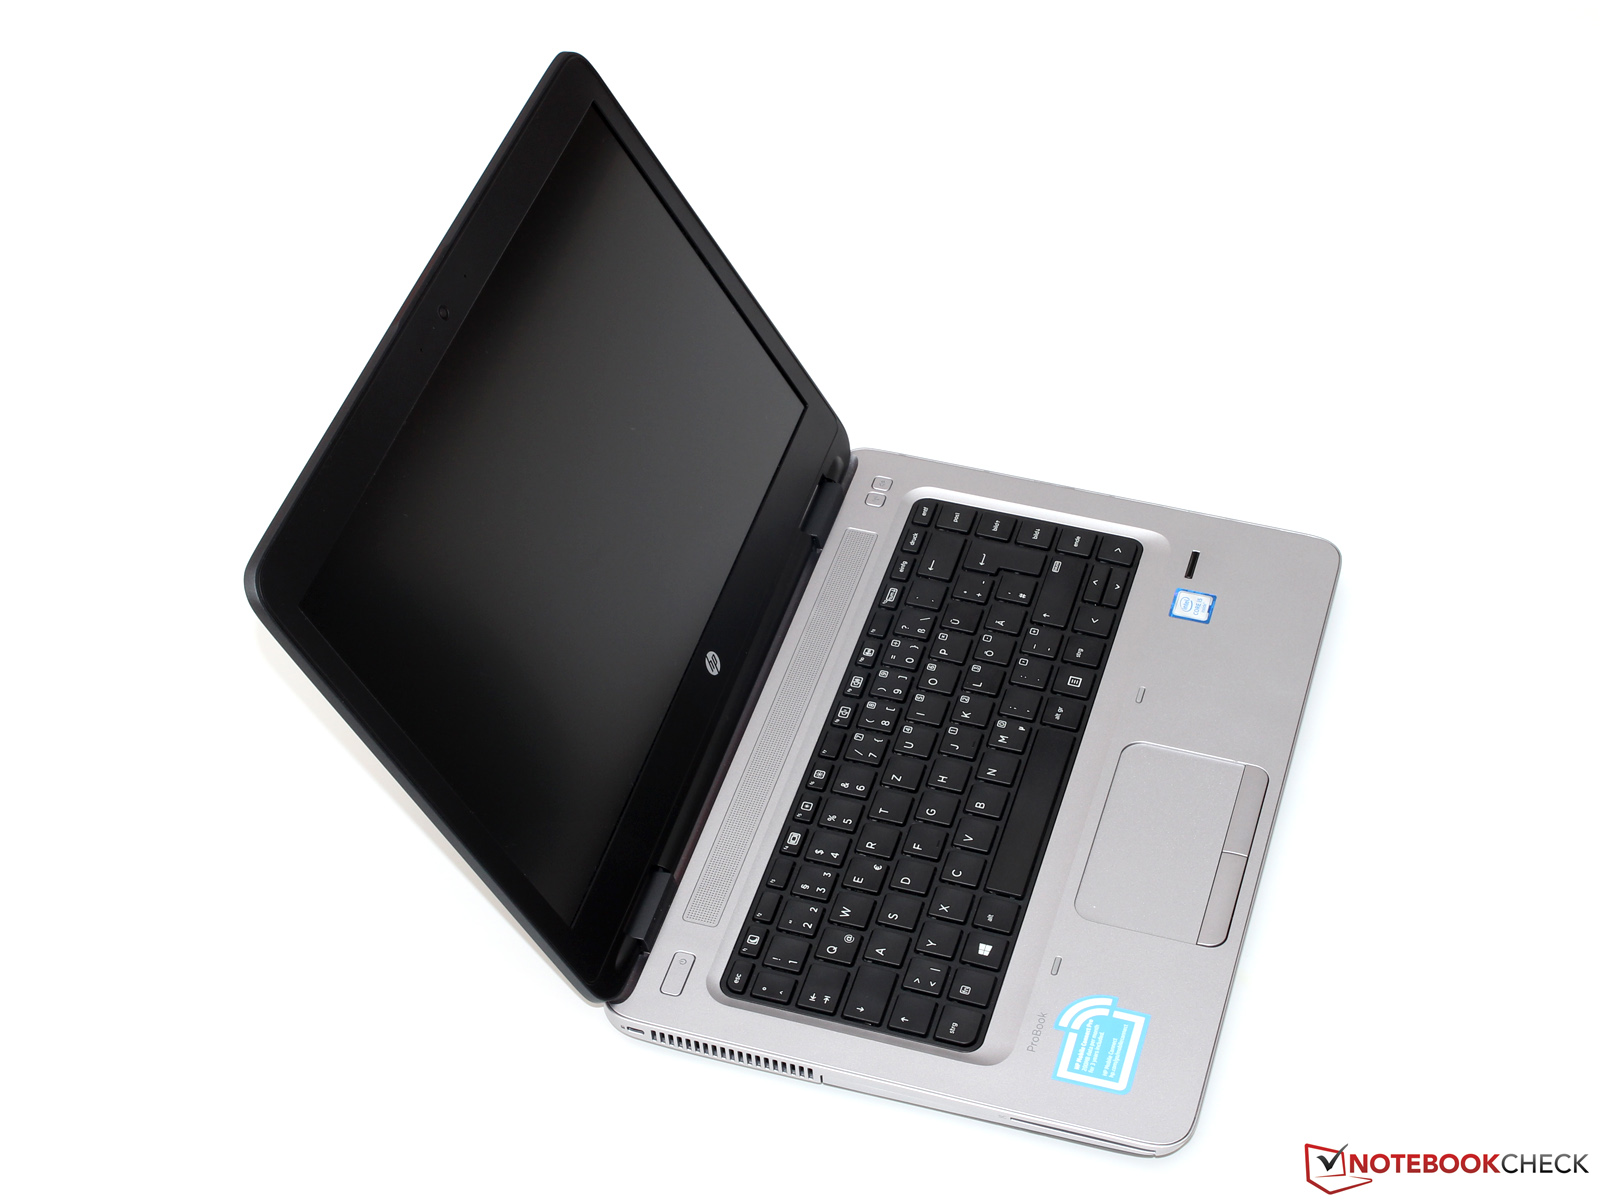
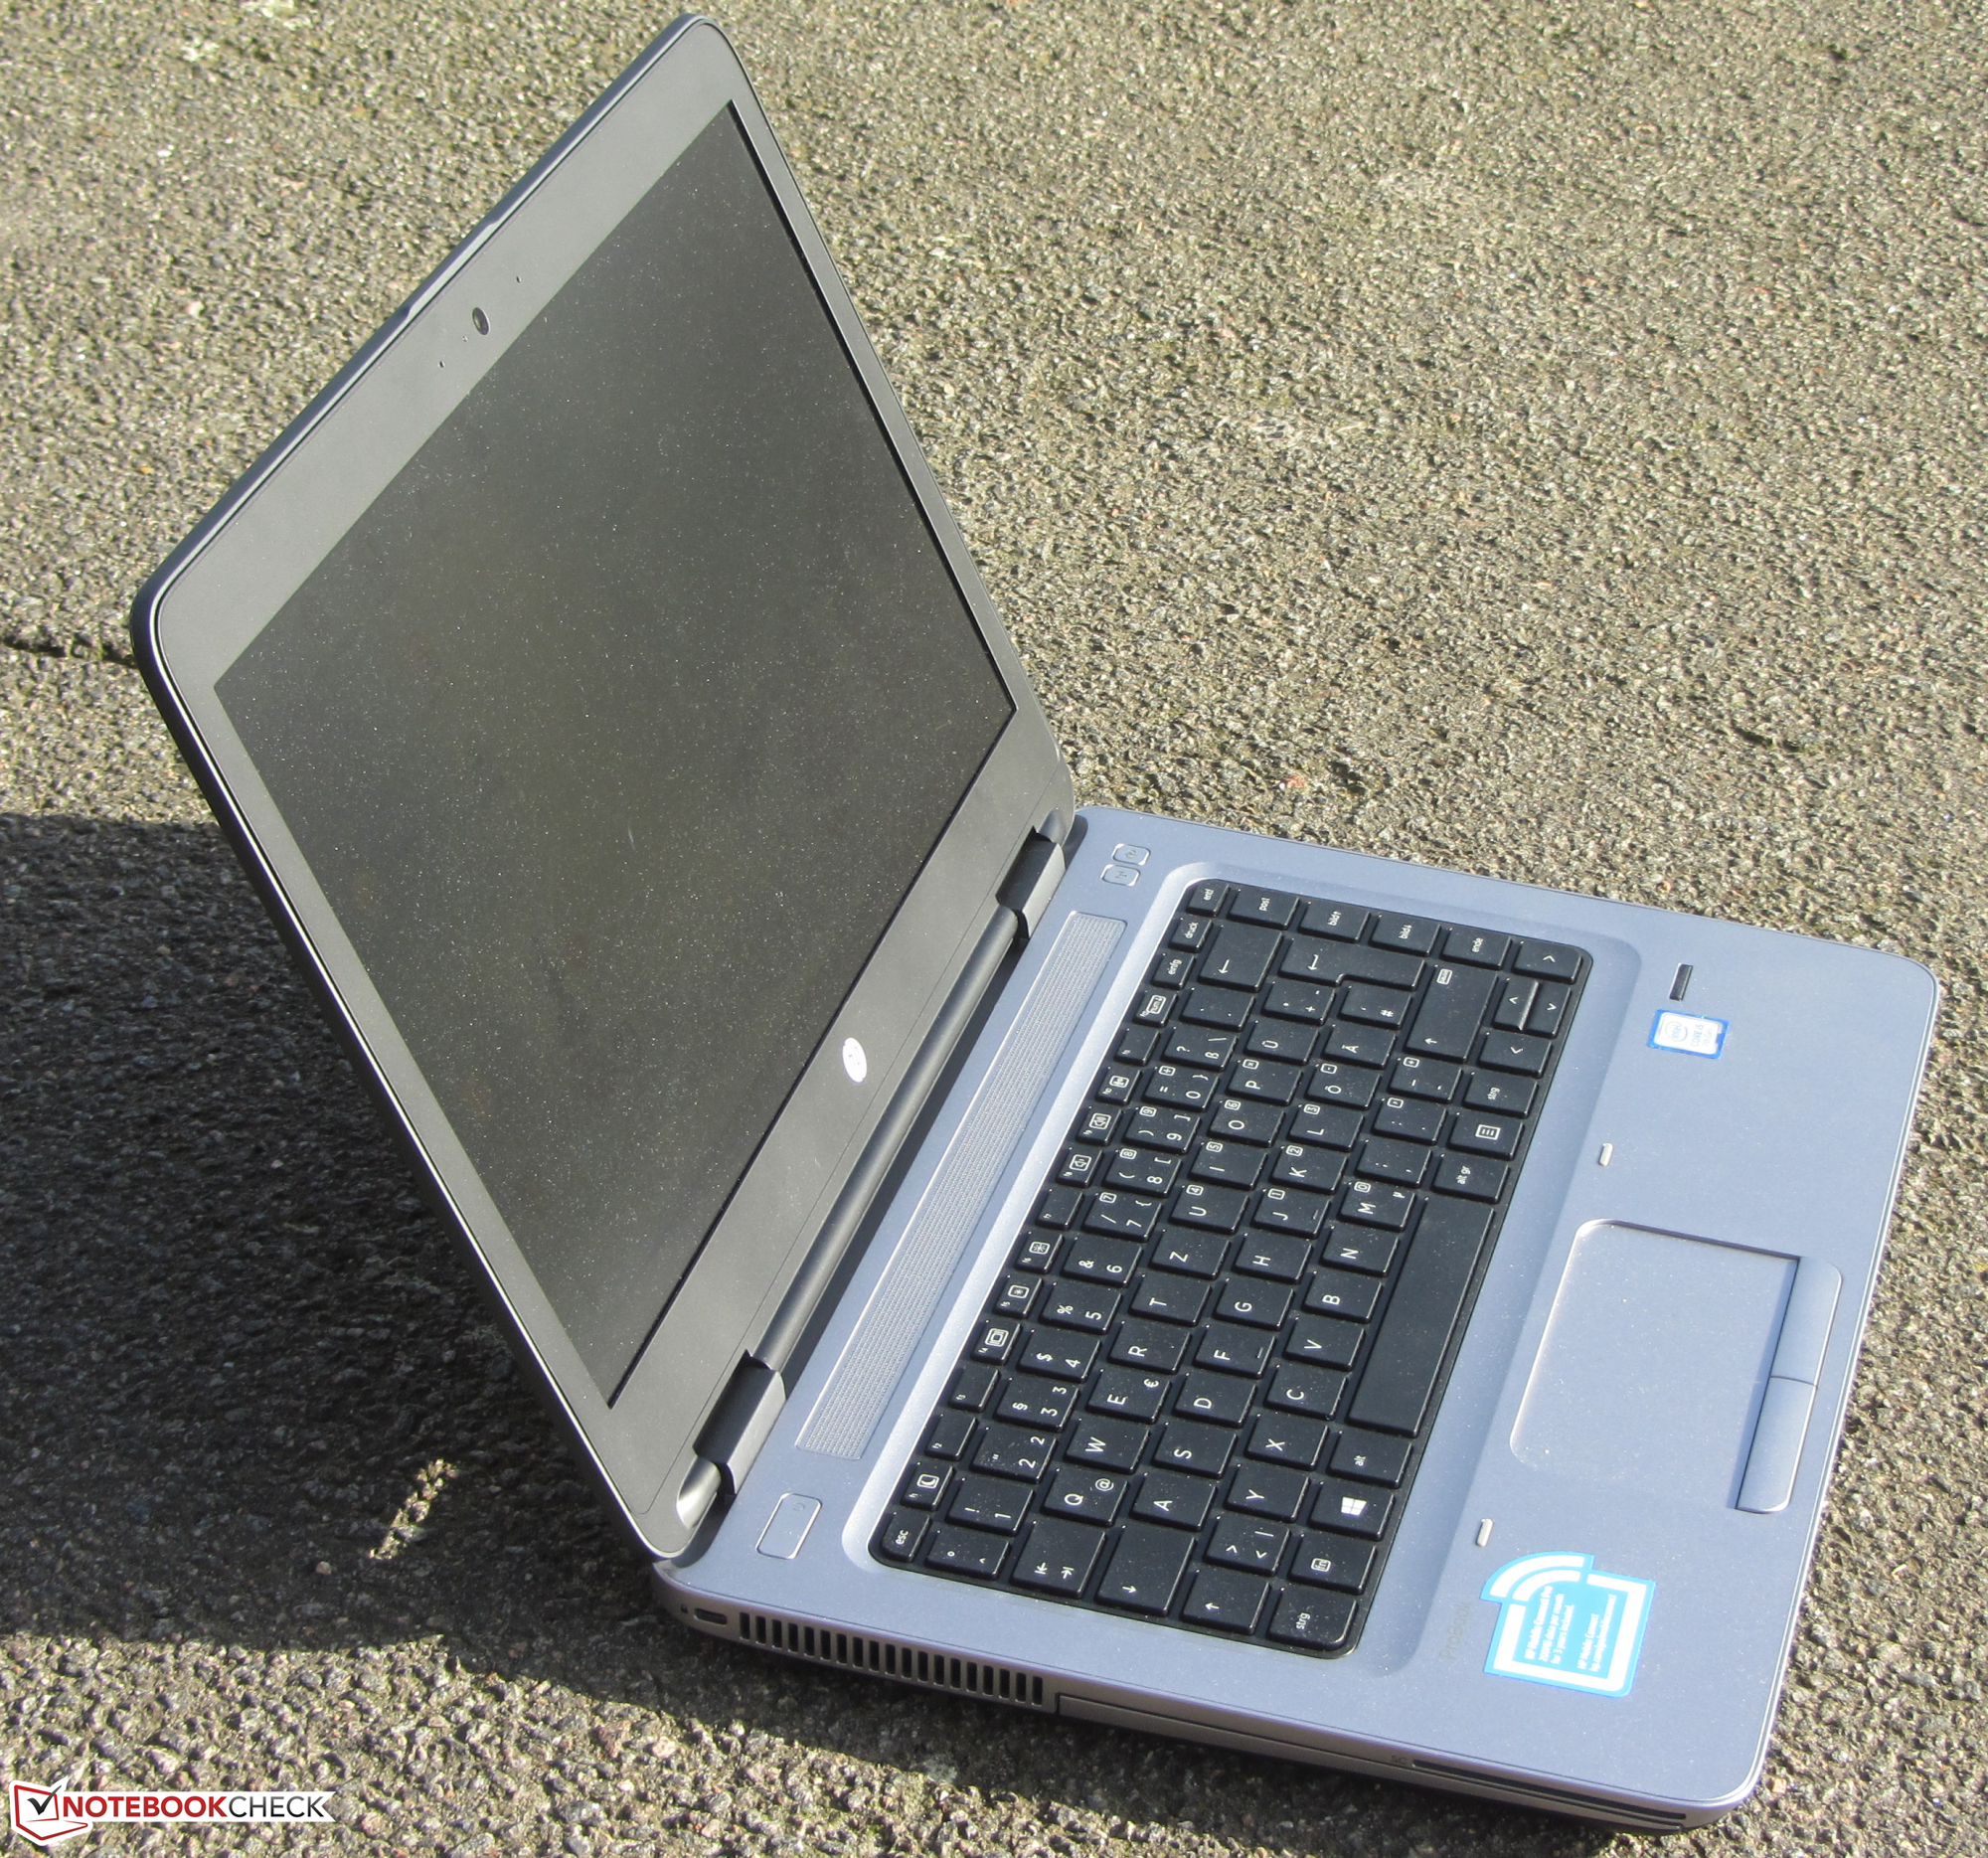
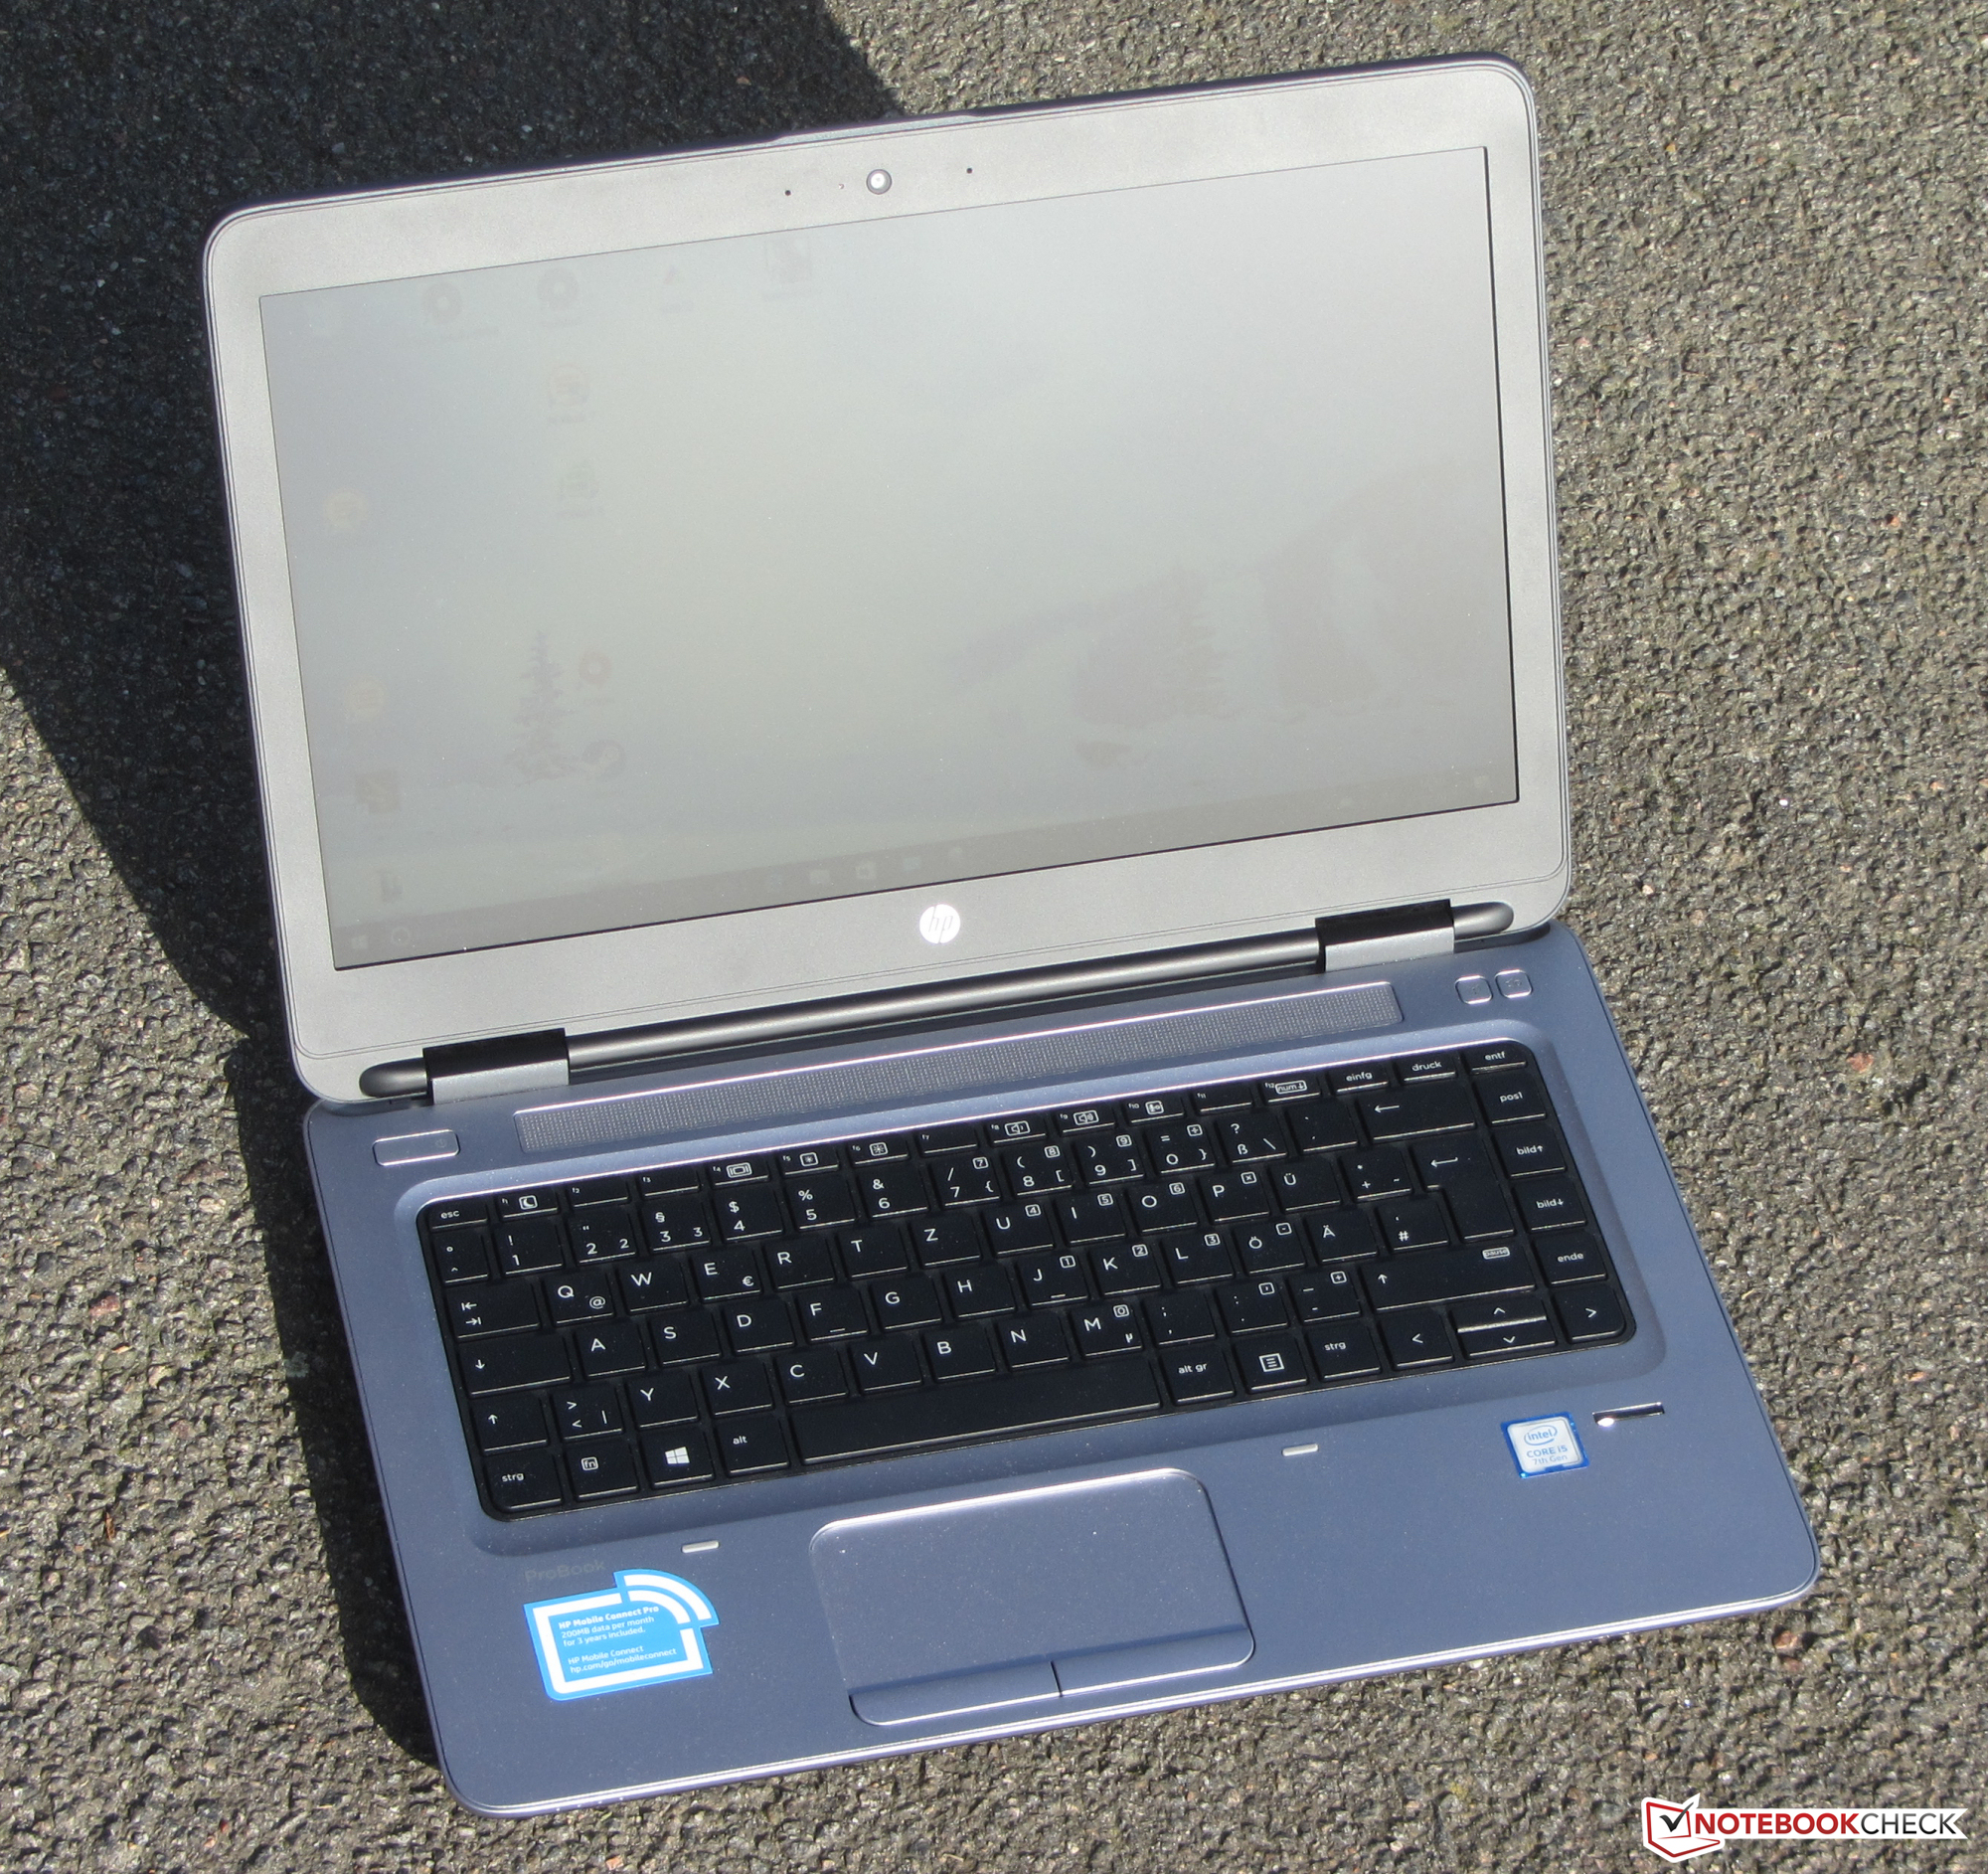
Breve análisis del HP ProBook 640 G3 (7200U, Full HD) Business
| SD Card Reader | |
| average JPG Copy Test (av. of 3 runs) | |
| Dell Latitude 14 E5470 | |
| Dell Latitude 14 E5470 | |
| HP ProBook 640 G2-T9X60ET | |
| Acer TravelMate P648-M-757N | |
| HP ProBook 640 G3 Z2W33ET | |
| Lenovo ThinkPad L460-20FVS01400 | |
| maximum AS SSD Seq Read Test (1GB) | |
| Dell Latitude 14 E5470 | |
| Dell Latitude 14 E5470 | |
| HP ProBook 640 G2-T9X60ET | |
| Lenovo ThinkPad L460-20FVS01400 | |
| HP ProBook 640 G3 Z2W33ET | |
| Networking | |
| iperf3 transmit AX12 | |
| HP ProBook 640 G3 Z2W33ET (jseb) | |
| Dell Latitude 14 E5470 (jseb) | |
| iperf3 receive AX12 | |
| Dell Latitude 14 E5470 (jseb) | |
| HP ProBook 640 G3 Z2W33ET (jseb) | |
| |||||||||||||||||||||||||
iluminación: 88 %
Brillo con batería: 360 cd/m²
Contraste: 497:1 (Negro: 0.69 cd/m²)
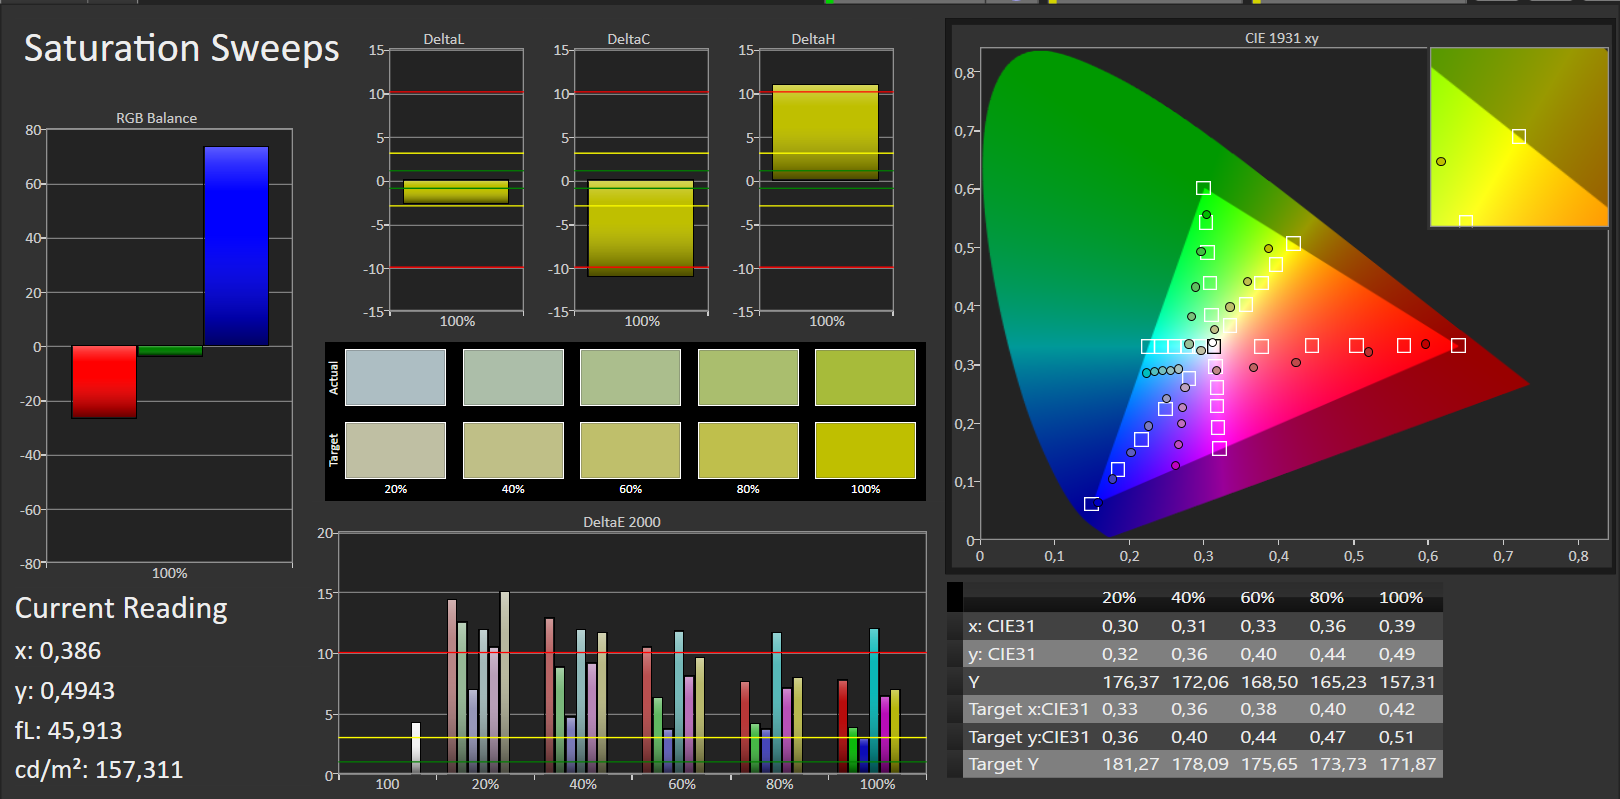
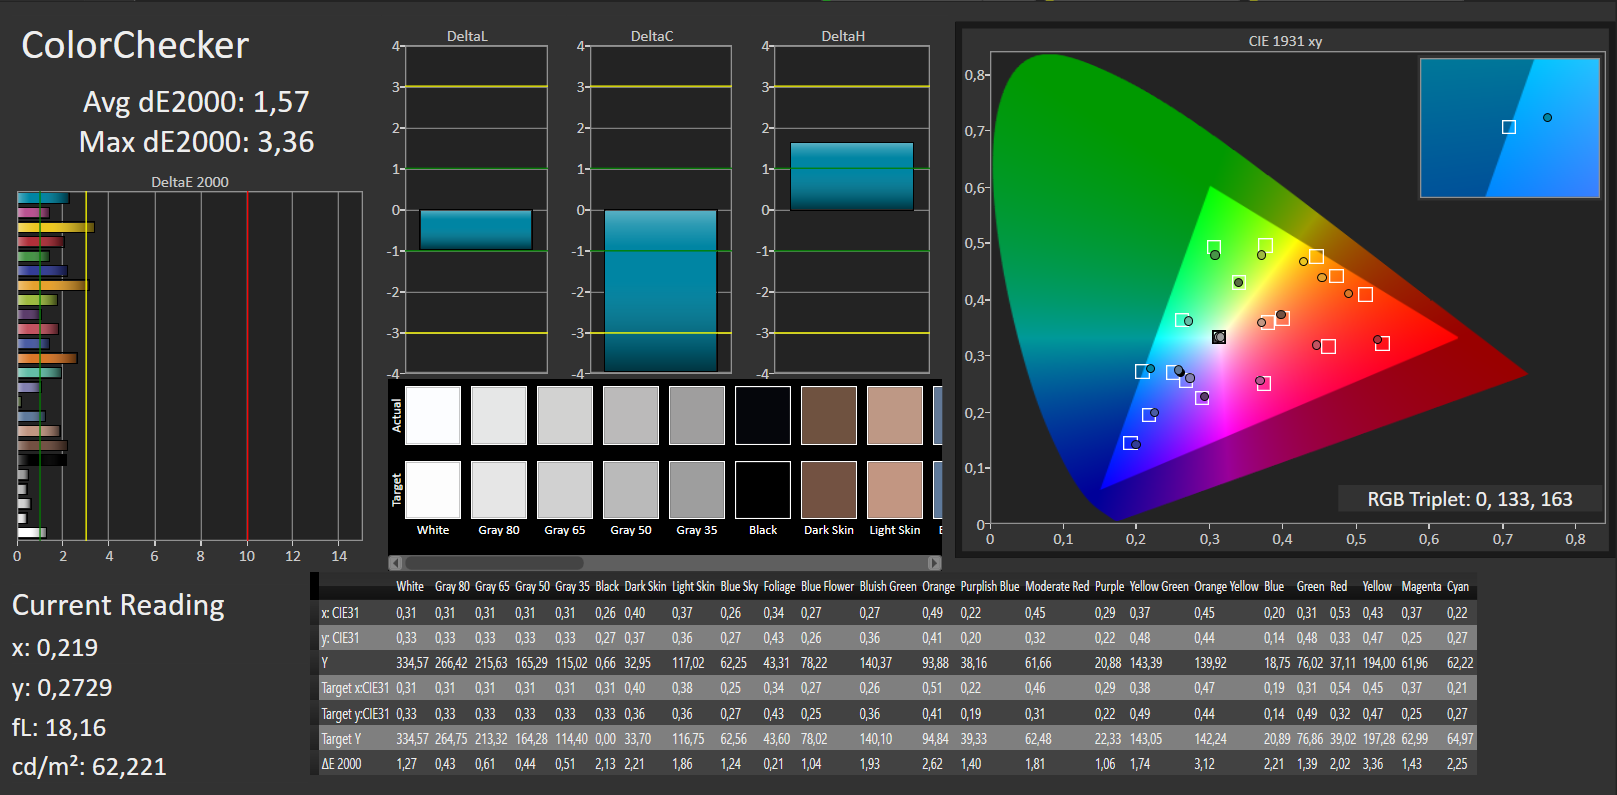
ΔE ColorChecker Calman: 9.06 | ∀{0.5-29.43 Ø4.72}
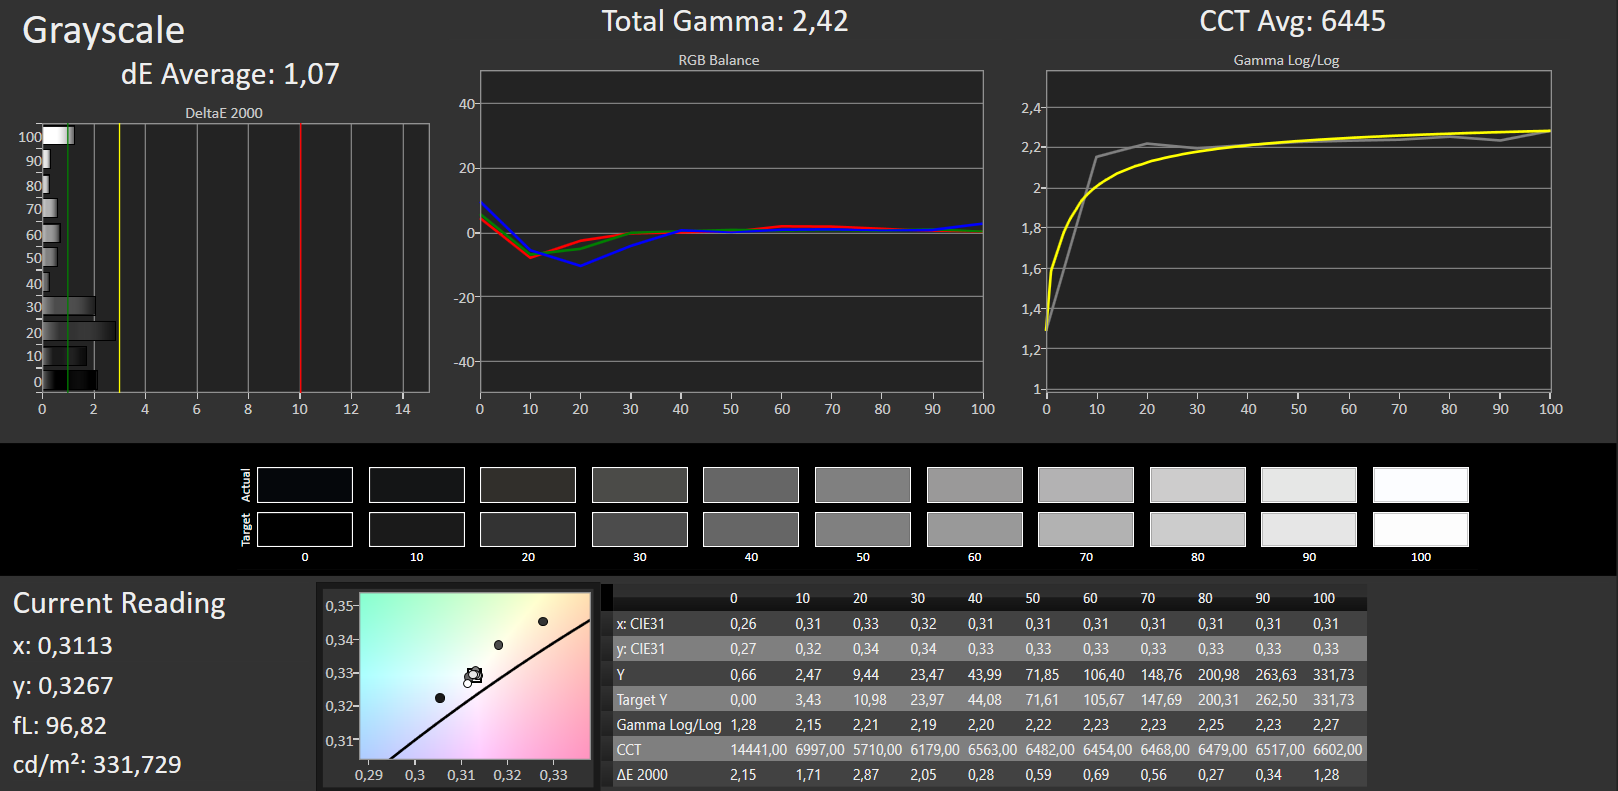
ΔE Greyscale Calman: 9.87 | ∀{0.09-98 Ø4.97}
75% sRGB (Argyll 1.6.3 3D)
47% AdobeRGB 1998 (Argyll 1.6.3 3D)
51.1% AdobeRGB 1998 (Argyll 3D)
74.5% sRGB (Argyll 3D)
49.46% Display P3 (Argyll 3D)
Gamma: 2.5
CCT: 11115 K
| HP ProBook 640 G3 Z2W33ET TN LED, 1920x1080, 14" | HP ProBook 640 G2-T9X60ET TN-Panel, 1920x1080, 14" | Dell Latitude 14 E5470 AH-IPS, WLED, 1920x1080, 14" | Dell Latitude 14 E5470 TN, 1366x768, 14" | Lenovo ThinkPad L460-20FVS01400 IPS, 1920x1080, 14" | Acer TravelMate P648-M-757N IPS, 1920x1080, 14" | |
|---|---|---|---|---|---|---|
| Display | 0% | 22% | -19% | -15% | -28% | |
| Display P3 Coverage (%) | 49.46 | 49.54 0% | 64.8 31% | 40.06 -19% | 42.2 -15% | 35.53 -28% |
| sRGB Coverage (%) | 74.5 | 74.6 0% | 84.8 14% | 60.3 -19% | 62.3 -16% | 53.3 -28% |
| AdobeRGB 1998 Coverage (%) | 51.1 | 51.2 0% | 62 21% | 41.42 -19% | 43.72 -14% | 36.72 -28% |
| Response Times | 8% | 9% | -18% | -4% | 5% | |
| Response Time Grey 50% / Grey 80% * (ms) | 41 ? | 43.2 ? -5% | 39 ? 5% | 56.8 ? -39% | 44.4 ? -8% | 44 ? -7% |
| Response Time Black / White * (ms) | 30 ? | 24 ? 20% | 26 ? 13% | 28.8 ? 4% | 29.6 ? 1% | 25 ? 17% |
| PWM Frequency (Hz) | 192 ? | 200 ? | ||||
| Screen | 1% | 21% | -19% | 11% | 28% | |
| Brightness middle (cd/m²) | 343 | 315 -8% | 323 -6% | 229 -33% | 245 -29% | 254 -26% |
| Brightness (cd/m²) | 332 | 304 -8% | 316 -5% | 207 -38% | 225 -32% | 243 -27% |
| Brightness Distribution (%) | 88 | 93 6% | 79 -10% | 80 -9% | 83 -6% | 90 2% |
| Black Level * (cd/m²) | 0.69 | 0.61 12% | 0.57 17% | 0.69 -0% | 0.24 65% | 0.19 72% |
| Contrast (:1) | 497 | 516 4% | 567 14% | 332 -33% | 1021 105% | 1337 169% |
| Colorchecker dE 2000 * | 9.06 | 8.8 3% | 3.68 59% | 10.16 -12% | 6.89 24% | 4.93 46% |
| Colorchecker dE 2000 max. * | 14.84 | 15.03 -1% | 8.33 44% | 17.18 -16% | 17.62 -19% | 10.14 32% |
| Greyscale dE 2000 * | 9.87 | 9.44 4% | 2.99 70% | 10.87 -10% | 6.45 35% | 2.71 73% |
| Gamma | 2.5 88% | 2.53 87% | 2.49 88% | 2.41 91% | 2.46 89% | 2.36 93% |
| CCT | 11115 58% | 11794 55% | 6572 99% | 12881 50% | 6857 95% | 6914 94% |
| Color Space (Percent of AdobeRGB 1998) (%) | 47 | 47.37 1% | 55 17% | 38.4 -18% | 40.1 -15% | 34 -28% |
| Color Space (Percent of sRGB) (%) | 75 | 74.78 0% | 85 13% | 60.4 -19% | 61.8 -18% | 53 -29% |
| Media total (Programa/Opciones) | 3% /
2% | 17% /
20% | -19% /
-19% | -3% /
4% | 2% /
14% |
* ... más pequeño es mejor
Parpadeo de Pantalla / PWM (Pulse-Width Modulation)
| Parpadeo de Pantalla / PWM detectado | 192 Hz | ≤ 90 % de brillo |  |
La retroiluminación del display parpadea a 192 Hz (seguramente usa PWM - Pulse-Width Modulation) a un brillo del 90 % e inferior. Sobre este nivel de brillo no debería darse parpadeo / PWM. La frecuencia de 192 Hz es relativamente baja, por lo que la gente sensible debería ver parpadeos y padecer fatiga visual por la pantalla (usado al brillo indicado a continuación). Comparación: 52 % de todos los dispositivos testados no usaron PWM para atenuar el display. Si se usó, medimos una media de 7769 (mínimo: 5 - máxmo: 343500) Hz. | |||
Tiempos de respuesta del display
| ↔ Tiempo de respuesta de Negro a Blanco | ||
|---|---|---|
| 30 ms ... subida ↗ y bajada ↘ combinada | ↗ 13 ms subida | 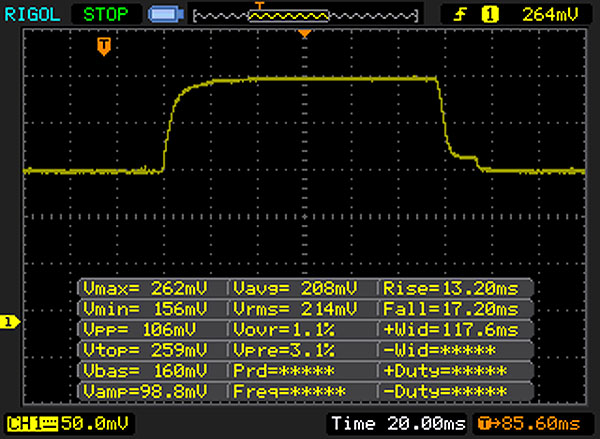 |
| ↘ 17 ms bajada | ||
| La pantalla mostró tiempos de respuesta lentos en nuestros tests y podría ser demasiado lenta para los jugones. En comparación, todos los dispositivos de prueba van de ##min### (mínimo) a 240 (máximo) ms. » 80 % de todos los dispositivos son mejores. Eso quiere decir que el tiempo de respuesta es peor que la media (19.8 ms) de todos los dispositivos testados. | ||
| ↔ Tiempo de respuesta 50% Gris a 80% Gris | ||
| 41 ms ... subida ↗ y bajada ↘ combinada | ↗ 19 ms subida | 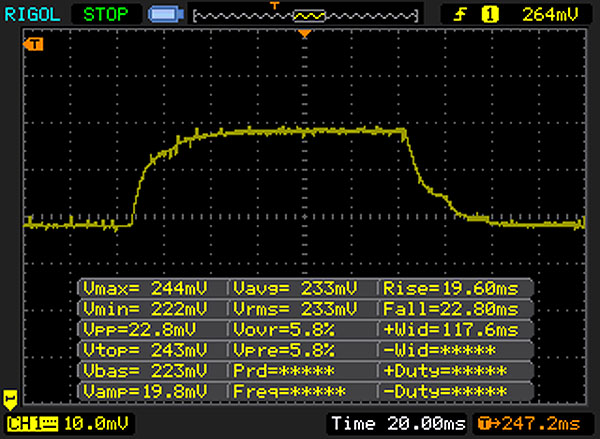 |
| ↘ 22 ms bajada | ||
| La pantalla mostró tiempos de respuesta lentos en nuestros tests y podría ser demasiado lenta para los jugones. En comparación, todos los dispositivos de prueba van de ##min### (mínimo) a 636 (máximo) ms. » 65 % de todos los dispositivos son mejores. Eso quiere decir que el tiempo de respuesta es peor que la media (31 ms) de todos los dispositivos testados. | ||
| Geekbench 3 | |
| 32 Bit Single-Core Score | |
| Acer TravelMate P648-M-757N | |
| HP ProBook 640 G3 Z2W33ET | |
| Lenovo ThinkPad L460-20FVS01400 | |
| 32 Bit Multi-Core Score | |
| Acer TravelMate P648-M-757N | |
| HP ProBook 640 G3 Z2W33ET | |
| Lenovo ThinkPad L460-20FVS01400 | |
| Geekbench 4.0 | |
| 64 Bit Single-Core Score | |
| HP ProBook 640 G3 Z2W33ET | |
| 64 Bit Multi-Core Score | |
| HP ProBook 640 G3 Z2W33ET | |
| JetStream 1.1 - 1.1 Total | |
| HP ProBook 640 G3 Z2W33ET | |
| Dell Latitude 14 E5470 | |
| Lenovo ThinkPad L460-20FVS01400 | |
| HP ProBook 640 G2-T9X60ET | |
| Acer TravelMate P648-M-757N | |
| PCMark 7 Score | 5067 puntos | |
| PCMark 8 Home Score Accelerated v2 | 3414 puntos | |
| PCMark 8 Creative Score Accelerated v2 | 4274 puntos | |
| PCMark 8 Work Score Accelerated v2 | 4545 puntos | |
ayuda | ||

| HP ProBook 640 G3 Z2W33ET Samsung PM951 NVMe MZVLV256 | HP ProBook 640 G2-T9X60ET Samsung SSD PM871 MZNLN256HCHP | Dell Latitude 14 E5470 Micron SSD 1100 (MTFDDAV256TBN) | Dell Latitude 14 E5470 Liteon L8H-256V2G | Lenovo ThinkPad L460-20FVS01400 Toshiba HG6 THNSFJ256GCSU | Acer TravelMate P648-M-757N Lite-On CV1-8B256 | |
|---|---|---|---|---|---|---|
| CrystalDiskMark 3.0 | -22% | -34% | -26% | -31% | -25% | |
| Read Seq (MB/s) | 1285 | 492.8 -62% | 465.4 -64% | 508 -60% | 480.9 -63% | 531 -59% |
| Write Seq (MB/s) | 283.6 | 303.2 7% | 363.1 28% | 360.6 27% | 426.4 50% | 358.8 27% |
| Read 512 (MB/s) | 679 | 417.4 -39% | 338.4 -50% | 374.1 -45% | 361.8 -47% | 384.8 -43% |
| Write 512 (MB/s) | 300.8 | 301.5 0% | 246.1 -18% | 300.2 0% | 220.9 -27% | 363 21% |
| Read 4k (MB/s) | 41.79 | 33.28 -20% | 25.83 -38% | 31.98 -23% | 21.51 -49% | 31.3 -25% |
| Write 4k (MB/s) | 138.6 | 84.6 -39% | 80.3 -42% | 93.1 -33% | 71.5 -48% | 80.3 -42% |
| Read 4k QD32 (MB/s) | 507 | 394.2 -22% | 246.1 -51% | 274.7 -46% | 277.6 -45% | 239.4 -53% |
| Write 4k QD32 (MB/s) | 293.3 | 295.5 1% | 197.7 -33% | 205.6 -30% | 230.4 -21% | 225.3 -23% |
| 3DMark 06 Standard Score | 7879 puntos | |
| 3DMark 11 Performance | 1541 puntos | |
| 3DMark Ice Storm Standard Score | 52206 puntos | |
| 3DMark Cloud Gate Standard Score | 5693 puntos | |
| 3DMark Fire Strike Score | 754 puntos | |
| 3DMark Fire Strike Extreme Score | 337 puntos | |
ayuda | ||
| 3DMark 11 - 1280x720 Performance GPU | |
| Lenovo ThinkPad L460-20FVS01400 | |
| HP ProBook 640 G3 Z2W33ET | |
| HP ProBook 640 G2-T9X60ET | |
| Dell Latitude 14 E5470 | |
| Dell Latitude 14 E5470 | |
| Acer TravelMate P648-M-757N | |
| bajo | medio | alto | ultra | |
|---|---|---|---|---|
| Tomb Raider (2013) | 65.6 | 33.4 | 19.2 | 9.7 |
| BioShock Infinite (2013) | 39.9 | 24.5 | 20.2 | 7.1 |
| Battlefield 4 (2013) | 30.7 | 24.5 | 15.9 | 5.3 |
Ruido
| Ocioso |
| 30.7 / 30.7 / 31.5 dB(A) |
| DVD |
| 35.7 / dB(A) |
| Carga |
| 31.4 / 31.1 dB(A) |
 | ||
30 dB silencioso 40 dB(A) audible 50 dB(A) ruidosamente alto |
||
min: | ||
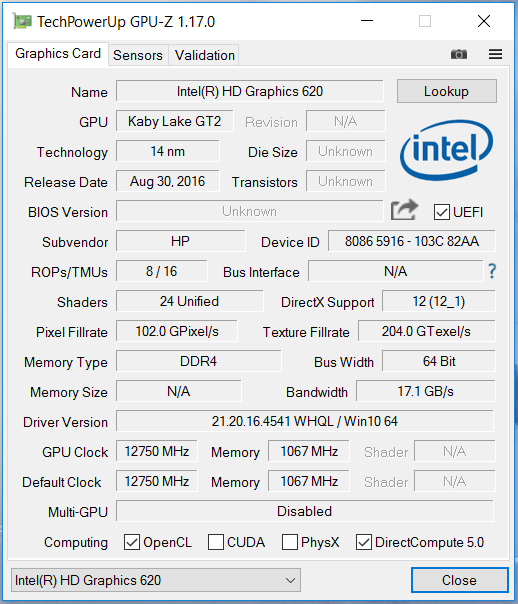
| HP ProBook 640 G3 Z2W33ET i5-7200U, HD Graphics 620 | HP ProBook 640 G2-T9X60ET 6200U, HD Graphics 520 | Dell Latitude 14 E5470 6440HQ, HD Graphics 530 | Dell Latitude 14 E5470 6300U, HD Graphics 520 | Lenovo ThinkPad L460-20FVS01400 6500U, Radeon R5 M330 | Acer TravelMate P648-M-757N 6500U, HD Graphics 520 | |
|---|---|---|---|---|---|---|
| Noise | 2% | -1% | 0% | -0% | -3% | |
| apagado / medio ambiente * (dB) | 30.7 | 29 6% | 30.3 1% | 29.2 5% | 29.2 5% | 31.2 -2% |
| Idle Minimum * (dB) | 30.7 | 29 6% | 30.3 1% | 29.2 5% | 29.2 5% | 31.2 -2% |
| Idle Average * (dB) | 30.7 | 29.8 3% | 30.3 1% | 29.2 5% | 29.2 5% | 31.2 -2% |
| Idle Maximum * (dB) | 31.5 | 30.2 4% | 30.3 4% | 29.2 7% | 29.2 7% | 31.6 -0% |
| Load Average * (dB) | 31.4 | 30.2 4% | 31.6 -1% | 32.1 -2% | 32.5 -4% | 33.3 -6% |
| Load Maximum * (dB) | 31.1 | 33.9 -9% | 35 -13% | 36.8 -18% | 37.2 -20% | 32.4 -4% |
* ... más pequeño es mejor
(+) La temperatura máxima en la parte superior es de 34 °C / 93 F, frente a la media de 34.3 °C / 94 F, que oscila entre 21.2 y 62.5 °C para la clase Office.
(+) El fondo se calienta hasta un máximo de 33.2 °C / 92 F, frente a la media de 36.8 °C / 98 F
(+) En reposo, la temperatura media de la parte superior es de 24.9 °C / 77# F, frente a la media del dispositivo de 29.5 °C / 85 F.
(+) El reposamanos y el panel táctil están a una temperatura inferior a la de la piel, con un máximo de 25.6 °C / 78.1 F y, por tanto, son fríos al tacto.
(±) La temperatura media de la zona del reposamanos de dispositivos similares fue de 27.5 °C / 81.5 F (+1.9 °C / 3.4 F).
| HP ProBook 640 G3 Z2W33ET i5-7200U, HD Graphics 620 | HP ProBook 640 G2-T9X60ET 6200U, HD Graphics 520 | Dell Latitude 14 E5470 6440HQ, HD Graphics 530 | Dell Latitude 14 E5470 6300U, HD Graphics 520 | Lenovo ThinkPad L460-20FVS01400 6500U, Radeon R5 M330 | Acer TravelMate P648-M-757N 6500U, HD Graphics 520 | |
|---|---|---|---|---|---|---|
| Heat | -21% | -25% | -17% | -20% | -15% | |
| Maximum Upper Side * (°C) | 34 | 40.7 -20% | 43 -26% | 41.5 -22% | 40.8 -20% | 38.5 -13% |
| Maximum Bottom * (°C) | 33.2 | 42.6 -28% | 43 -30% | 41.4 -25% | 51.9 -56% | 36.7 -11% |
| Idle Upper Side * (°C) | 25.6 | 29.9 -17% | 31.2 -22% | 26.9 -5% | 25.2 2% | 31.5 -23% |
| Idle Bottom * (°C) | 26 | 30.3 -17% | 31.3 -20% | 29.6 -14% | 27.6 -6% | 29.6 -14% |
* ... más pequeño es mejor
HP ProBook 640 G3 Z2W33ET análisis de audio
(-) | altavoces no muy altos (#70 dB)
Graves 100 - 315 Hz
(-) | casi sin bajos - de media 15% inferior a la mediana
(±) | la linealidad de los graves es media (7.5% delta a frecuencia anterior)
Medios 400 - 2000 Hz
(+) | medios equilibrados - a sólo 4.1% de la mediana
(+) | los medios son lineales (6.1% delta a la frecuencia anterior)
Altos 2 - 16 kHz
(±) | máximos más altos - de media 8.8% más altos que la mediana
(+) | los máximos son lineales (4.6% delta a la frecuencia anterior)
Total 100 - 16.000 Hz
(±) | la linealidad del sonido global es media (22.2% de diferencia con la mediana)
En comparación con la misma clase
» 58% de todos los dispositivos probados de esta clase eran mejores, 9% similares, 33% peores
» El mejor tuvo un delta de 7%, la media fue 21%, el peor fue ###max##%
En comparación con todos los dispositivos probados
» 64% de todos los dispositivos probados eran mejores, 6% similares, 29% peores
» El mejor tuvo un delta de 4%, la media fue 24%, el peor fue ###max##%
Apple MacBook 12 (Early 2016) 1.1 GHz análisis de audio
(+) | los altavoces pueden reproducir a un volumen relativamente alto (#83.6 dB)
Graves 100 - 315 Hz
(±) | lubina reducida - en promedio 11.3% inferior a la mediana
(±) | la linealidad de los graves es media (14.2% delta a frecuencia anterior)
Medios 400 - 2000 Hz
(+) | medios equilibrados - a sólo 2.4% de la mediana
(+) | los medios son lineales (5.5% delta a la frecuencia anterior)
Altos 2 - 16 kHz
(+) | máximos equilibrados - a sólo 2% de la mediana
(+) | los máximos son lineales (4.5% delta a la frecuencia anterior)
Total 100 - 16.000 Hz
(+) | el sonido global es lineal (10.2% de diferencia con la mediana)
En comparación con la misma clase
» 7% de todos los dispositivos probados de esta clase eran mejores, 2% similares, 91% peores
» El mejor tuvo un delta de 5%, la media fue 18%, el peor fue ###max##%
En comparación con todos los dispositivos probados
» 5% de todos los dispositivos probados eran mejores, 1% similares, 94% peores
» El mejor tuvo un delta de 4%, la media fue 24%, el peor fue ###max##%
| Off / Standby | |
| Ocioso | |
| Carga |
|
Clave:
min: | |
| HP ProBook 640 G3 Z2W33ET i5-7200U, HD Graphics 620 | HP ProBook 640 G2-T9X60ET 6200U, HD Graphics 520 | Dell Latitude 14 E5470 6440HQ, HD Graphics 530 | Dell Latitude 14 E5470 6300U, HD Graphics 520 | Lenovo ThinkPad L460-20FVS01400 6500U, Radeon R5 M330 | Acer TravelMate P648-M-757N 6500U, HD Graphics 520 | |
|---|---|---|---|---|---|---|
| Power Consumption | -22% | -66% | -17% | -41% | -68% | |
| Idle Minimum * (Watt) | 2.3 | 3.3 -43% | 4.1 -78% | 3.5 -52% | 3.1 -35% | 5.3 -130% |
| Idle Average * (Watt) | 5.2 | 6 -15% | 8.1 -56% | 5.3 -2% | 6.3 -21% | 9.3 -79% |
| Idle Maximum * (Watt) | 5.6 | 6.9 -23% | 11.4 -104% | 6 -7% | 7.9 -41% | 11.5 -105% |
| Load Average * (Watt) | 27.2 | 27.7 -2% | 33.5 -23% | 26.3 3% | 29.5 -8% | 30.8 -13% |
| Load Maximum * (Watt) | 28.7 | 36.6 -28% | 49 -71% | 36.6 -28% | 57.3 -100% | 32 -11% |
* ... más pequeño es mejor
| HP ProBook 640 G3 Z2W33ET i5-7200U, HD Graphics 620, 46 Wh | HP ProBook 640 G2-T9X60ET 6200U, HD Graphics 520, 46 Wh | Dell Latitude 14 E5470 6440HQ, HD Graphics 530, 62 Wh | Dell Latitude 14 E5470 6300U, HD Graphics 520, 62 Wh | Lenovo ThinkPad L460-20FVS01400 6500U, Radeon R5 M330, 48 Wh | Acer TravelMate P648-M-757N 6500U, HD Graphics 520, 54 Wh | |
|---|---|---|---|---|---|---|
| Duración de Batería | -9% | -32% | 9% | -26% | -14% | |
| Reader / Idle (h) | 24.6 | 16.6 -33% | 15.2 -38% | 21.7 -12% | 19.2 -22% | 18.1 -26% |
| H.264 (h) | 8.7 | 6.9 -21% | 10.8 24% | 7.2 -17% | 9.1 5% | |
| WiFi v1.3 (h) | 8.7 | 9.6 10% | 7.2 -17% | 11.1 28% | 7.1 -18% | 9.1 5% |
| Load (h) | 3 | 2.9 -3% | 1.4 -53% | 2.9 -3% | 1.6 -47% | 1.8 -40% |
Pro
Contra
Gracias al procesador Kaby Lake, el ProBook ofrece mucho rendimiento de aplicación. Sin embargo, la ventaja respecto a su predecesor Skylake es escasa. El portátil funciona en silencio, o al menos de forma queda durante todo el rango de carga y desarrolla poco calor -cualidades muy positivas para un dispositivo de trabajo. El SSD NVMe integrado asegura un sistema veloz y breves tiempos de carga. Se podría cambiar el SSD sacando la placa inferior del portátil, algo que se hace rápido.
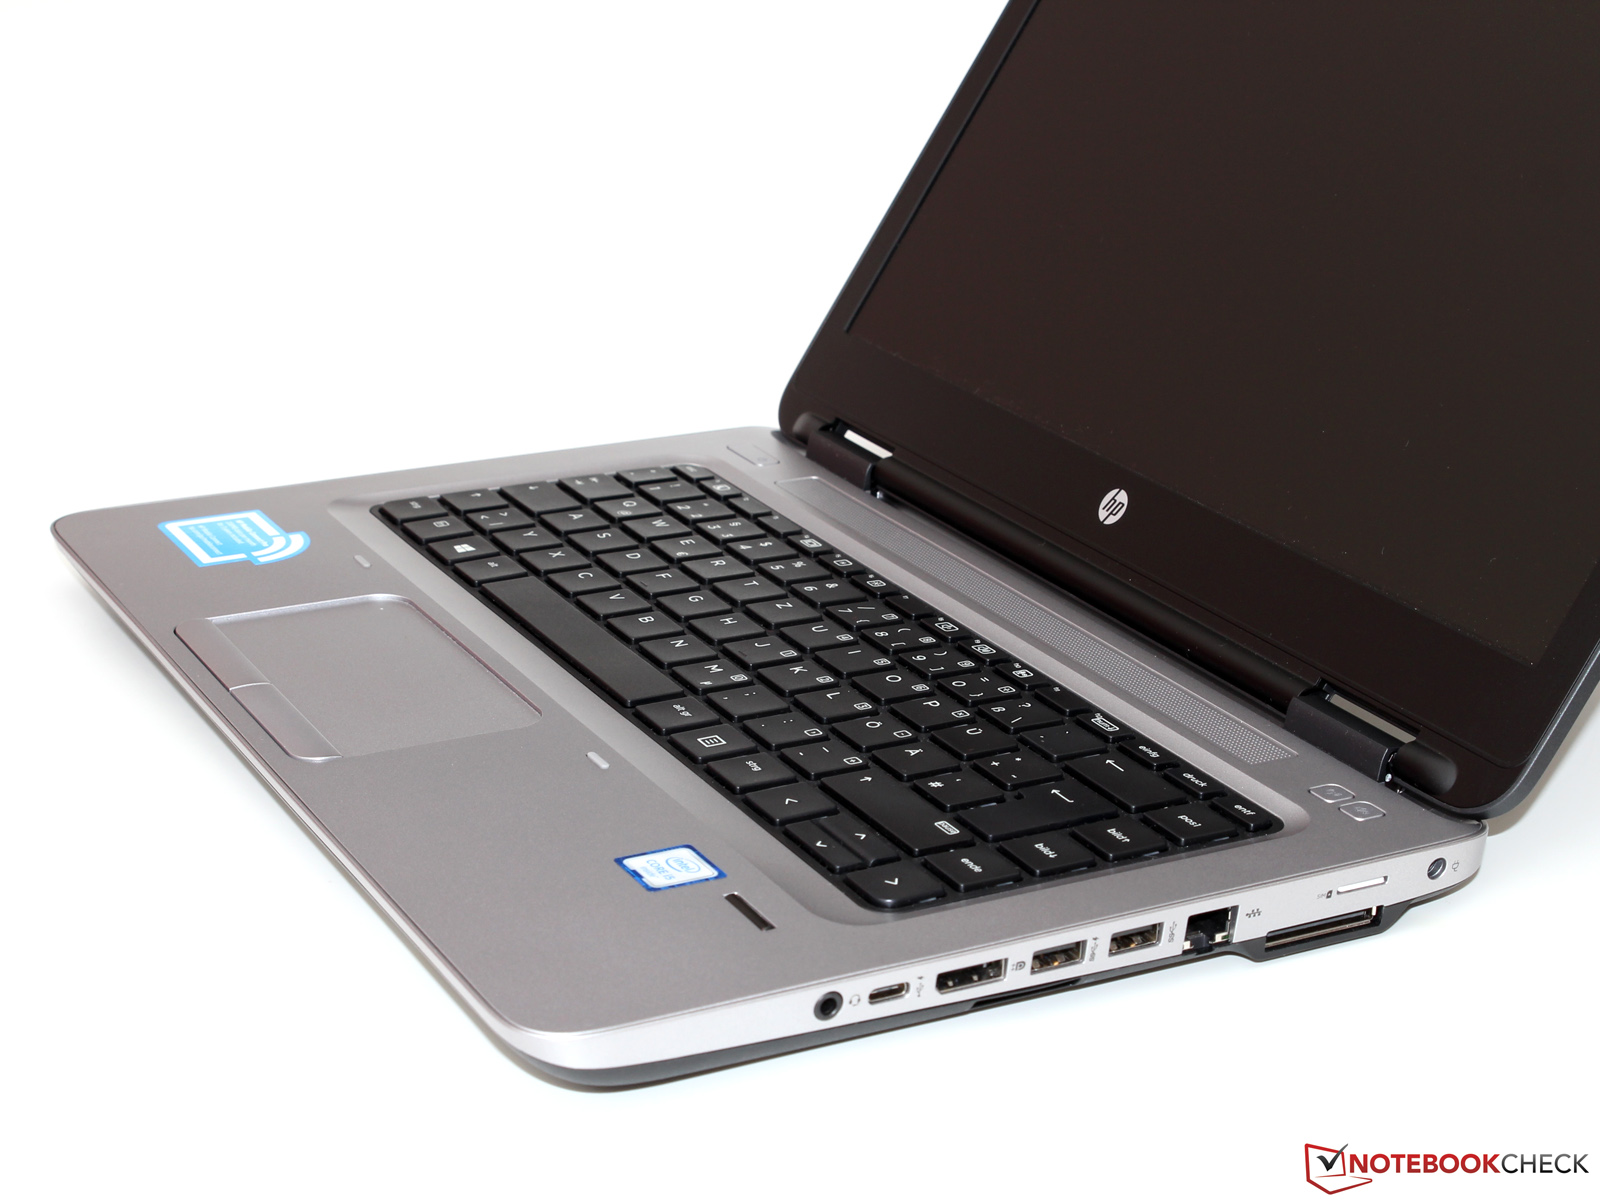
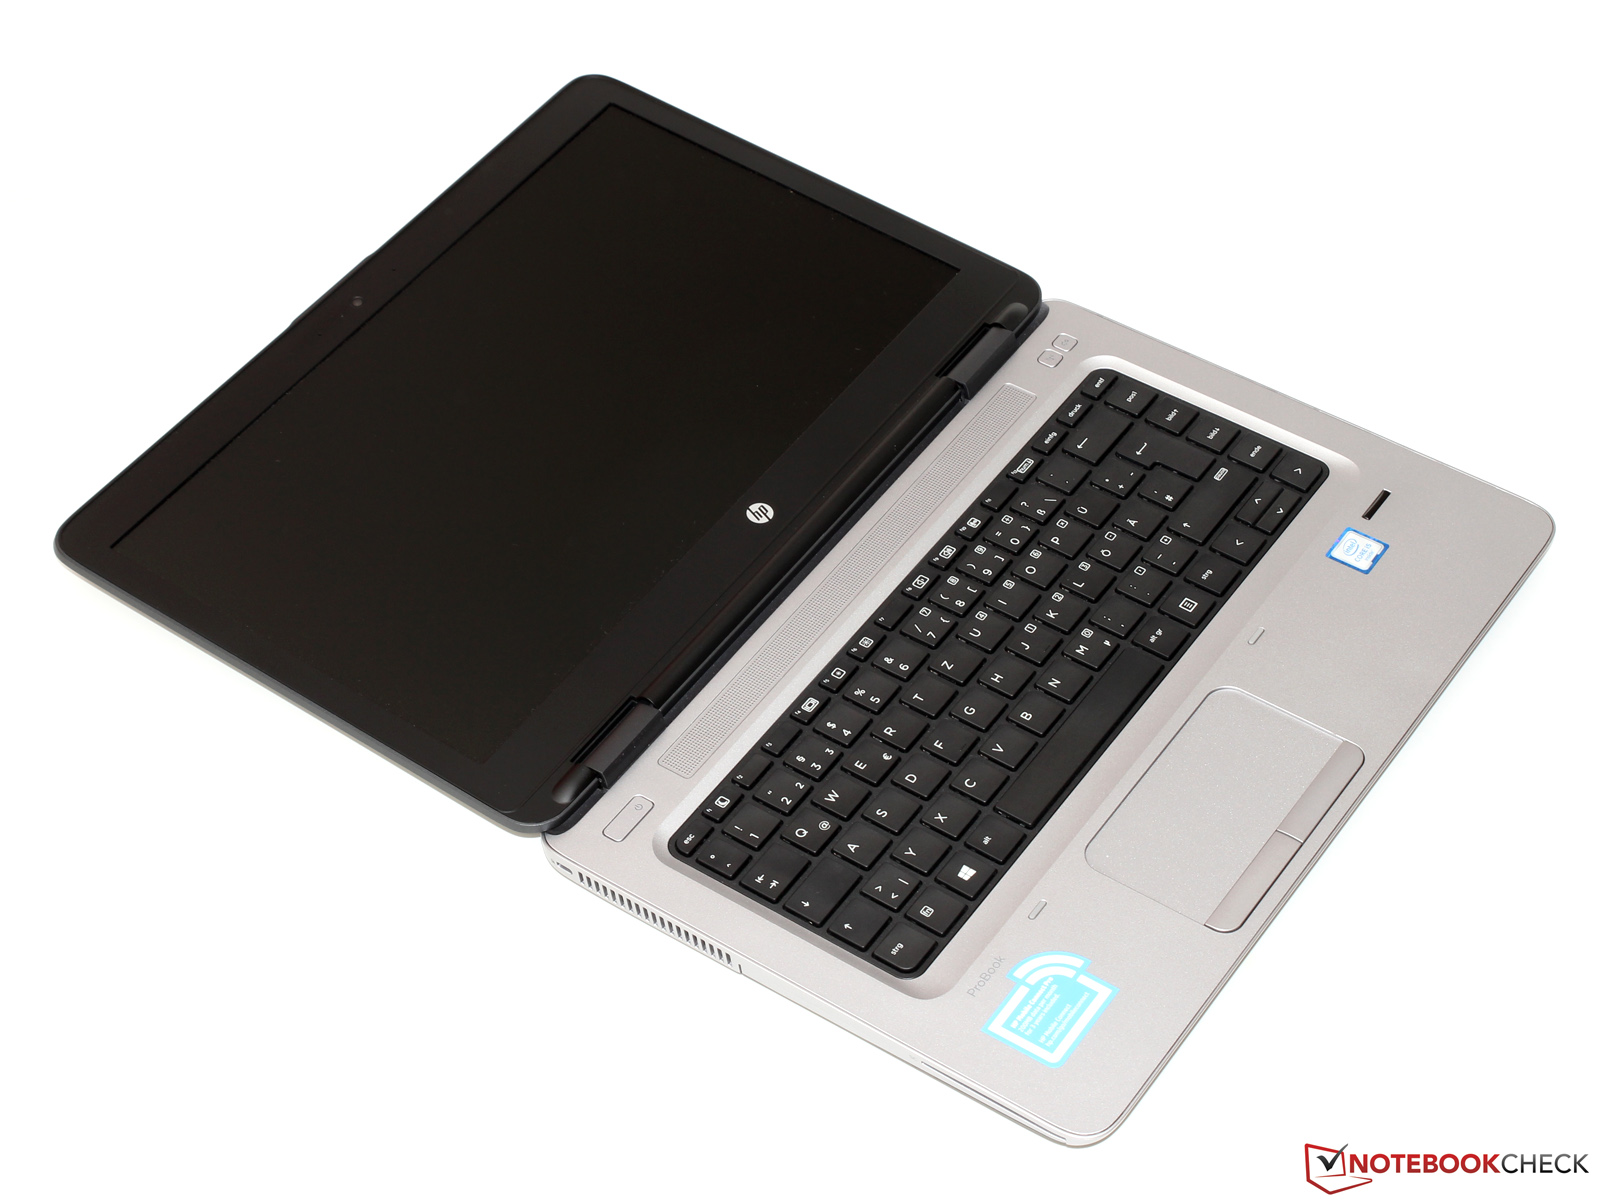
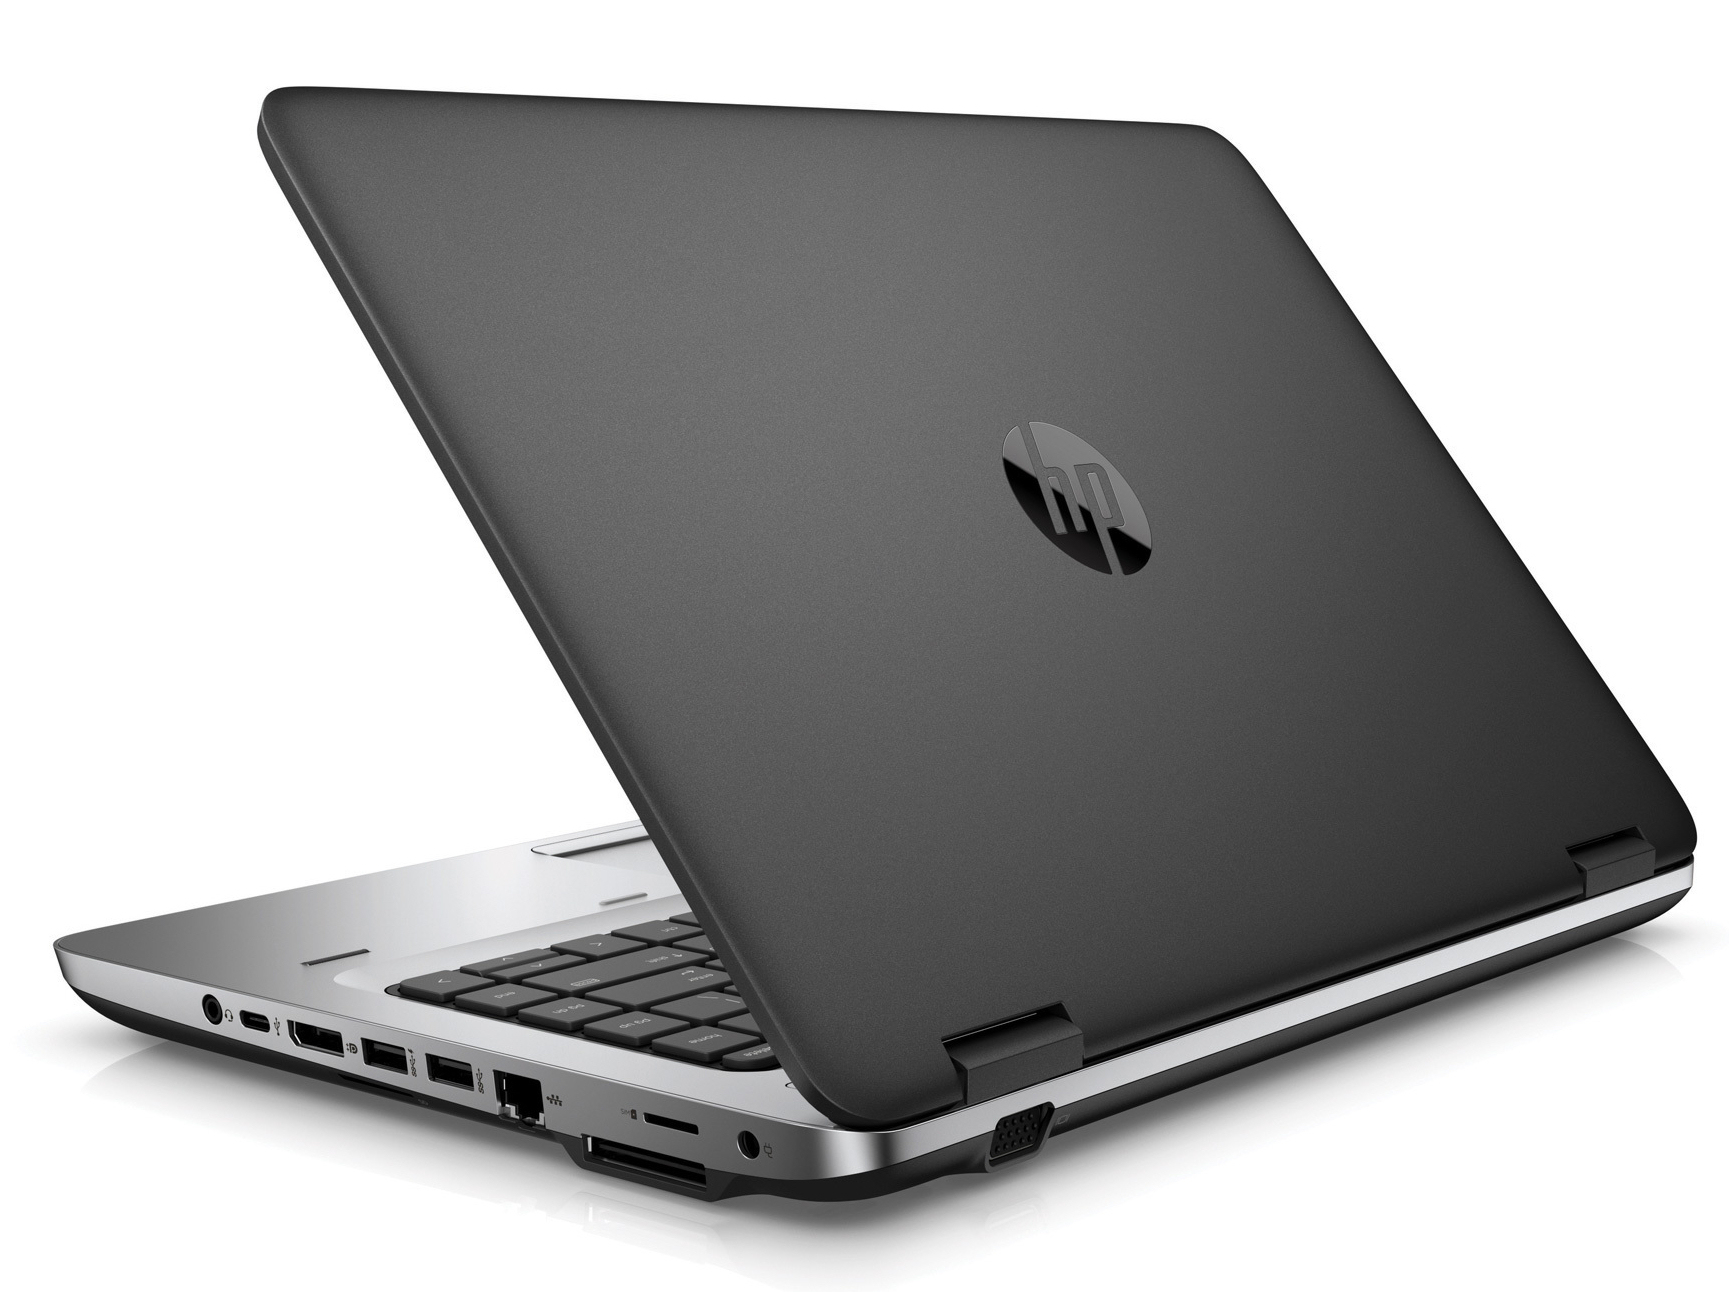
La carcasa y los dispositivos de entrada no muestran modificaciones; HP vuelve a usar los del predecesor. Nada en su contra, ya que ambos componentes causaron una buena impreisón. El aguante de la batería es buenísima, como en el predecesor, por lo que debería bastar para una jornada laboral. Un módem LTE/HSPA+ te permite acceder a internet o a la red de la compañía por comunicaciones móviles.
HP hace bien muchas cosas con este portátil, pero no queda libre de crítica.
Nuestra crítica vuelve a referirse al display: Tiene poco ángulo de visión y bajo contraste. No es aceptable. El precio de más de 1,000 Euros exige un display excelente. Otro punto de críticas es el teclado que esperábamos iluminado en este nivel de precios. Y por último, pero no por ello menos importante: HP sólo da un año de garantía.
Ésta es una versión acortada del análisis original. Puedes leer el análisis completo en inglés aquí.
HP ProBook 640 G3 Z2W33ET
- 02/27/2017 v6 (old)
Sascha Mölck