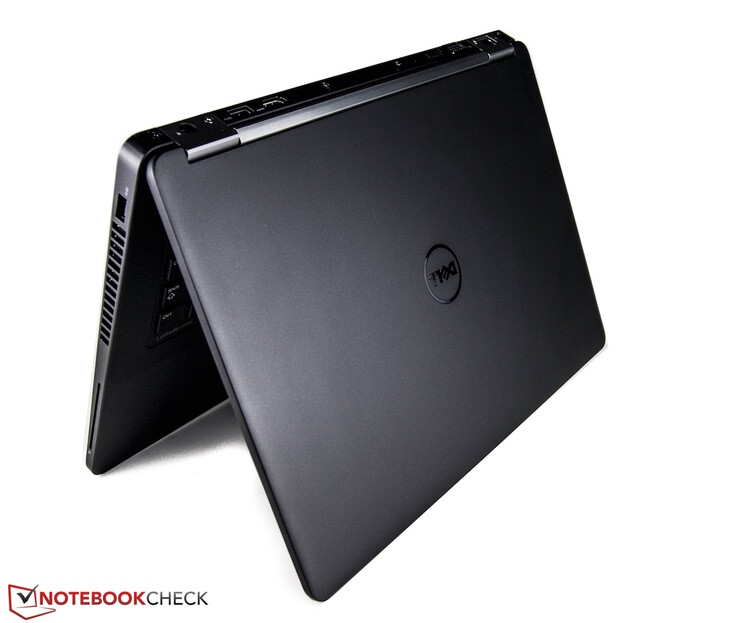
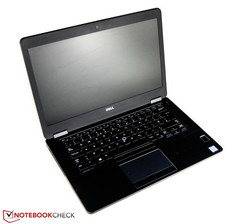
Breve análisis del Dell Latitude 14 E5470
Top 10 Análisis
» Top 10 Portátiles Multimedia
» Top 10 Portátiles de Juego
» Top 10 Portátiles de Juego ligeros
» Top 10 Portátiles Asequibles de Oficina/Empresa
» Top 10 Portátiles de Juego Ligeros
» Top 10 Portátiles de Oficina/Empresa Premium
» Top 10 Estaciones de Trabajo
» Top 10 Subportátiles
» Top 10 Ultrabooks
» Top 10 Convertibles
» Top 10 Tablets
» Top 10 Tablets Windows
» Top 10 Tablets de menos de 250 Euros
» Top 10 Phablets (>5.5")
» Top 10 Smartphones
» Top 10 Smartphones (≤5")
» Top 10 Smartphones de menos de 300 Euros
» Top 10 Smartphones de menos de 120 Euros
» Top 10 Portátiles de menos de 1000 Euros
» Top 10 Portátiles de menos de 500 Euros
» Top 10 Portátiles de menos de 300 Euros
» Los Mejores Displays de Portátiles Analizados por Notebookcheck
| |||||||||||||||||||||||||
iluminación: 80 %
Brillo con batería: 226 cd/m²
Contraste: 332:1 (Negro: 0.69 cd/m²)
ΔE ColorChecker Calman: 10.16 | ∀{0.5-29.43 Ø4.77}
ΔE Greyscale Calman: 10.87 | ∀{0.09-98 Ø5}
60.4% sRGB (Argyll 1.6.3 3D)
38.4% AdobeRGB 1998 (Argyll 1.6.3 3D)
41.42% AdobeRGB 1998 (Argyll 3D)
60.3% sRGB (Argyll 3D)
40.06% Display P3 (Argyll 3D)
Gamma: 2.41
CCT: 12881 K
| Dell Latitude 14 E5470 TN-Panel 1366x768 | Dell Latitude 14 E5450 IPS-Panel 1920x1080 | Lenovo ThinkPad T460s-20FA003GGE IPS-Panel 2560x1440 | Lenovo ThinkPad T460s-20F9003SGE IPS-Panel 1920x1080 | HP EliteBook 840 G2 TN-Panel 1600x900 | HP EliteBook 840 G3 T9X59ET#ABD HD Graphics 520, 6500U, Samsung SSD PM851 256 GB MZNTE256HMHP | |
|---|---|---|---|---|---|---|
| Display | 62% | 68% | 3% | -3% | 22% | |
| Display P3 Coverage (%) | 40.06 | 66.8 67% | 68.7 71% | 41.65 4% | 38.82 -3% | 48.93 22% |
| sRGB Coverage (%) | 60.3 | 93.2 55% | 98.1 63% | 61.6 2% | 58.4 -3% | 73.7 22% |
| AdobeRGB 1998 Coverage (%) | 41.42 | 68.2 65% | 70.4 70% | 43.14 4% | 40.11 -3% | 50.5 22% |
| Response Times | 18% | 13% | 19% | |||
| Response Time Grey 50% / Grey 80% * (ms) | 56.8 ? | 35.6 ? 37% | 42 ? 26% | 43 ? 24% | ||
| Response Time Black / White * (ms) | 28.8 ? | 29.2 ? -1% | 29.2 ? -1% | 25 ? 13% | ||
| PWM Frequency (Hz) | 220 ? | 204 ? | ||||
| Screen | 64% | 58% | 38% | -4% | 27% | |
| Brightness middle (cd/m²) | 229 | 293 28% | 257 12% | 226 -1% | 267 17% | 366 60% |
| Brightness (cd/m²) | 207 | 271 31% | 248 20% | 211 2% | 240 16% | 336 62% |
| Brightness Distribution (%) | 80 | 85 6% | 94 18% | 89 11% | 84 5% | 87 9% |
| Black Level * (cd/m²) | 0.69 | 0.291 58% | 0.26 62% | 0.22 68% | 0.8 -16% | 0.65 6% |
| Contrast (:1) | 332 | 1007 203% | 988 198% | 1027 209% | 334 1% | 563 70% |
| Colorchecker dE 2000 * | 10.16 | 3.81 62% | 4.59 55% | 6.44 37% | 12.71 -25% | 10.26 -1% |
| Colorchecker dE 2000 max. * | 17.18 | 9.72 43% | 17.18 -0% | |||
| Greyscale dE 2000 * | 10.87 | 3.97 63% | 6.38 41% | 5.87 46% | 13.91 -28% | 11.51 -6% |
| Gamma | 2.41 91% | 2.51 88% | 2.51 88% | 2.37 93% | 2.35 94% | 2.4 92% |
| CCT | 12881 50% | 7368 88% | 6238 104% | 6856 95% | 20099 32% | 12725 51% |
| Color Space (Percent of AdobeRGB 1998) (%) | 38.4 | 60.4 57% | 65 69% | 39.58 3% | 37.2 -3% | 47 22% |
| Color Space (Percent of sRGB) (%) | 60.4 | 98 62% | 61.15 1% | 74 23% | ||
| Media total (Programa/Opciones) | 63% /
63% | 48% /
55% | 18% /
27% | -4% /
-4% | 23% /
25% |
* ... más pequeño es mejor
Tiempos de respuesta del display
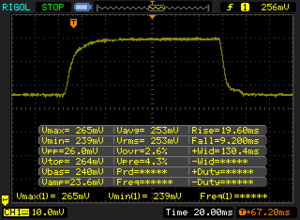
| ↔ Tiempo de respuesta de Negro a Blanco | ||
|---|---|---|
| 28.8 ms ... subida ↗ y bajada ↘ combinada | ↗ 19.6 ms subida | |
| ↘ 9.2 ms bajada | ||
| La pantalla mostró tiempos de respuesta relativamente lentos en nuestros tests pero podría ser demasiado lenta para los jugones. En comparación, todos los dispositivos de prueba van de ##min### (mínimo) a 240 (máximo) ms. » 75 % de todos los dispositivos son mejores. Eso quiere decir que el tiempo de respuesta es peor que la media (20.2 ms) de todos los dispositivos testados. | ||
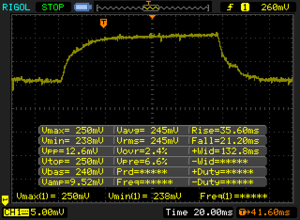
| ↔ Tiempo de respuesta 50% Gris a 80% Gris | ||
| 56.8 ms ... subida ↗ y bajada ↘ combinada | ↗ 35.6 ms subida | |
| ↘ 21.2 ms bajada | ||
| La pantalla mostró tiempos de respuesta lentos en nuestros tests y podría ser demasiado lenta para los jugones. En comparación, todos los dispositivos de prueba van de ##min### (mínimo) a 636 (máximo) ms. » 93 % de todos los dispositivos son mejores. Eso quiere decir que el tiempo de respuesta es peor que la media (31.6 ms) de todos los dispositivos testados. | ||
Parpadeo de Pantalla / PWM (Pulse-Width Modulation)
| Parpadeo de Pantalla / PWM no detectado | ||
Comparación: 53 % de todos los dispositivos testados no usaron PWM para atenuar el display. Si se usó, medimos una media de 8088 (mínimo: 5 - máxmo: 343500) Hz. | ||
| Cinebench R15 | |
| CPU Single 64Bit | |
| HP EliteBook 840 G3 T8X41EA | |
| Lenovo ThinkPad T460s-20FA003GGE | |
| Dell Latitude 14 E5470 | |
| HP EliteBook 840 G3 T9X59ET#ABD | |
| HP EliteBook 840 G2 | |
| Dell Latitude 3450-9723 | |
| Dell Latitude 14 E5450 | |
| CPU Multi 64Bit | |
| Lenovo ThinkPad T460s-20FA003GGE | |
| HP EliteBook 840 G3 T8X41EA | |
| HP EliteBook 840 G3 T9X59ET#ABD | |
| Dell Latitude 14 E5470 | |
| Dell Latitude 14 E5450 | |
| Dell Latitude 3450-9723 | |
| HP EliteBook 840 G2 | |
| Dell Latitude 14 E5470 HD Graphics 520, 6300U, Liteon L8H-256V2G | Dell Latitude 14 E5450 HD Graphics 4400, 4310U, Lite-On LCS-128L9S | HP EliteBook 840 G2 HD Graphics 5500, 5200U, Samsung SSD PM851 256 GB MZ7TE256HMHP | Lenovo ThinkPad T460s-20FA003GGE HD Graphics 520, 6600U, Samsung SSD SM951a 512GB M.2 PCIe 3.0 x4 NVMe (MZVKV512) | Lenovo ThinkPad T460s-20F9003SGE HD Graphics 520, 6200U, Samsung CM871 MZ7LF192HCGS | |
|---|---|---|---|---|---|
| PCMark 7 | |||||
| Score (Points) | 5125 | 3469 -32% | 4139 -19% | 5190 1% | |
| PCMark 8 | -27% | -16% | 3% | -10% | |
| Home Score Accelerated v2 (Points) | 3438 | 2824 -18% | 2936 -15% | 3542 3% | 3024 -12% |
| Creative Score Accelerated v2 (Points) | 3946 | 3340 -15% | 3139 -20% | 4338 10% | 3644 -8% |
| Work Score Accelerated v2 (Points) | 4599 | 2338 -49% | 4044 -12% | 4442 -3% | 4121 -10% |
| Media total (Programa/Opciones) | -30% /
-29% | -18% /
-17% | 2% /
3% | -10% /
-10% |
| PCMark 7 Score | 5125 puntos | |
| PCMark 8 Home Score Accelerated v2 | 3438 puntos | |
| PCMark 8 Creative Score Accelerated v2 | 3946 puntos | |
| PCMark 8 Work Score Accelerated v2 | 4599 puntos | |
ayuda | ||
| Dell Latitude 14 E5470 Liteon L8H-256V2G | Dell Latitude 14 E5450 Lite-On LCS-128L9S | HP EliteBook 840 G2 Samsung SSD PM851 256 GB MZ7TE256HMHP | HP EliteBook 840 G3 T8X41EA Samsung SSD 850 EVO 500GB | Lenovo ThinkPad T460s-20FA003GGE Samsung SSD SM951a 512GB M.2 PCIe 3.0 x4 NVMe (MZVKV512) | Lenovo ThinkPad T460s-20F9003SGE Samsung CM871 MZ7LF192HCGS | |
|---|---|---|---|---|---|---|
| CrystalDiskMark 3.0 | 7% | 9% | 40% | 137% | -59% | |
| Read Seq (MB/s) | 508 | 483.4 -5% | 528 4% | 532 5% | 1778 250% | 446.5 -12% |
| Write Seq (MB/s) | 360.6 | 336.9 -7% | 267.9 -26% | 511 42% | 1530 324% | 171.1 -53% |
| Read 4k (MB/s) | 31.98 | 25.22 -21% | 29.19 -9% | 47.87 50% | 51.3 60% | 5.78 -82% |
| Write 4k (MB/s) | 93.1 | 74.4 -20% | 125.7 35% | 123.8 33% | 139.3 50% | 35.47 -62% |
| Read 4k QD32 (MB/s) | 274.7 | 389.4 42% | 351.1 28% | 393.3 43% | 561 104% | 94.9 -65% |
| Write 4k QD32 (MB/s) | 205.6 | 317.3 54% | 248.1 21% | 346.3 68% | 277 35% | 36.43 -82% |
| 3DMark 11 - 1280x720 Performance | |
| Lenovo ThinkPad T460s-20FA003GGE | |
| Acer Aspire R14 R5-471T-79GQ | |
| Asus Zenbook UX303UA-R4051T | |
| Dell Latitude 14 E5470 | |
| HP EliteBook 840 G3 T8X41EA | |
| Asus Zenbook UX303UA-FN121T | |
| HP EliteBook 820 G3 T8X20EA | |
| Lenovo ThinkPad T460s-20F9003SGE | |
| Dell Latitude 14 E5450 | |
| 3DMark 11 Performance | 1418 puntos | |
| 3DMark Ice Storm Standard Score | 50690 puntos | |
| 3DMark Cloud Gate Standard Score | 5176 puntos | |
| 3DMark Fire Strike Score | 741 puntos | |
ayuda | ||
| BioShock Infinite | |
| 1280x720 Very Low Preset | |
| Lenovo ThinkPad T460s 20FA003FPB | |
| Lenovo ThinkPad T460s-20FA003GGE | |
| HP EliteBook 840 G3 T8X41EA | |
| Dell Latitude 14 E5470 | |
| HP EliteBook 840 G2 | |
| Dell Latitude 14 E5450 | |
| Lenovo ThinkPad T460s-20F9003SGE | |
| 1366x768 Medium Preset | |
| Lenovo ThinkPad T460s 20FA003FPB | |
| Lenovo ThinkPad T460s-20FA003GGE | |
| HP EliteBook 840 G3 T8X41EA | |
| Dell Latitude 14 E5470 | |
| Lenovo ThinkPad T460s-20F9003SGE | |
| HP EliteBook 840 G2 | |
| Dell Latitude 14 E5450 | |
| bajo | medio | alto | ultra | |
|---|---|---|---|---|
| BioShock Infinite (2013) | 36.4 | 21.4 | 17.8 | 5.4 |
| Battlefield 4 (2013) | 34.7 | 24.6 | 14.4 | 4.2 |
| Rise of the Tomb Raider (2016) | 13 | 9.2 |
Ruido
| Ocioso |
| 29.2 / 29.2 / 29.2 dB(A) |
| Carga |
| 32.1 / 36.8 dB(A) |
 | ||
30 dB silencioso 40 dB(A) audible 50 dB(A) ruidosamente alto |
||
min: | ||
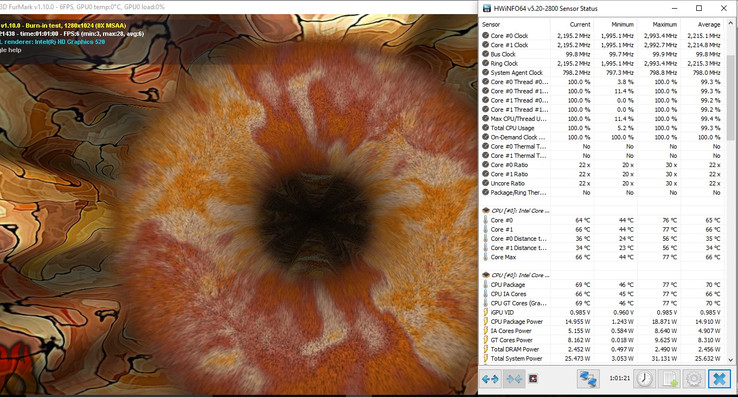
(±) La temperatura máxima en la parte superior es de 41.5 °C / 107 F, frente a la media de 34.3 °C / 94 F, que oscila entre 21.2 y 62.5 °C para la clase Office.
(±) El fondo se calienta hasta un máximo de 41.4 °C / 107 F, frente a la media de 36.8 °C / 98 F
(+) En reposo, la temperatura media de la parte superior es de 25.1 °C / 77# F, frente a la media del dispositivo de 29.5 °C / 85 F.
(+) El reposamanos y el panel táctil están a una temperatura inferior a la de la piel, con un máximo de 26 °C / 78.8 F y, por tanto, son fríos al tacto.
(±) La temperatura media de la zona del reposamanos de dispositivos similares fue de 27.6 °C / 81.7 F (+1.6 °C / 2.9 F).
| Off / Standby | |
| Ocioso | |
| Carga |
|
Clave:
min: | |
| Battery Runtime - WiFi Websurfing | |
| Dell Latitude 14 E5470 | |
| HP EliteBook 840 G2 | |
| Lenovo ThinkPad T460s-20F9003SGE | |
| Lenovo ThinkPad T460s-20FA003GGE | |
Pro
Contra
La nueva serie Dell Latitude E5000 causa una impresión muy sólida en todas las secciones de nuestro análisis. Esto empieza con el chasis, al ser muy robusto y noble.
Apenas hay problemas de calidad de construcción, pero nos gustaría ver en futuras iteraciones escotillas de mantenimiento o, al menos, una batería extraíble.
Probablemente los aspectos más importantes sean los dispositivos de entrada. El teclado ofrece una buena experiencia de mecanografiado, pero el desplazamiento podría ser mayor. El único auténtico problema de nuestro modelo de pruebas es el panel TN con sus limitados ángulos de visión. Al menos hay un display Full HD opcional con más iluminación. Un mejor panel aumentaría un poco la valoración. El rendimiento del Latitude es muy equilibrado y podemos medir una clara ventaja respecto al predecesor. Nuestro modelo de pruebas también convence con una característica de ruido genial. También nos encantó el aguante de la batería; el portátil aguantará fácilmente más que una jornada de trabajo en batería.
El Dell Latitude E5470 es un portátil convencional exitoso. Si estás buscando, por ejemplo, una máquina de escribir de oficina, deberías conectarle dispositivos de entrada externos.
Si quieres un display de mayor resolución y un veloz SSD PCIe-3.0-, deberías tener en cuenta el Lenovo ThinkPad T460s. El nuevo HP EliteBook 840 G3 con la generación Skylake también debería resultar interesante. Con todo, no olvidemos que el precio del nuevo Latitude E5470 es muy inferior que el de estos rivales.
Ésta es una versión acortada del análisis original. Puedes leer el análisis completo en inglés aquí.
Dell Latitude 14 E5470
- 03/20/2016 v5 (old)
Nino Ricchizzi


