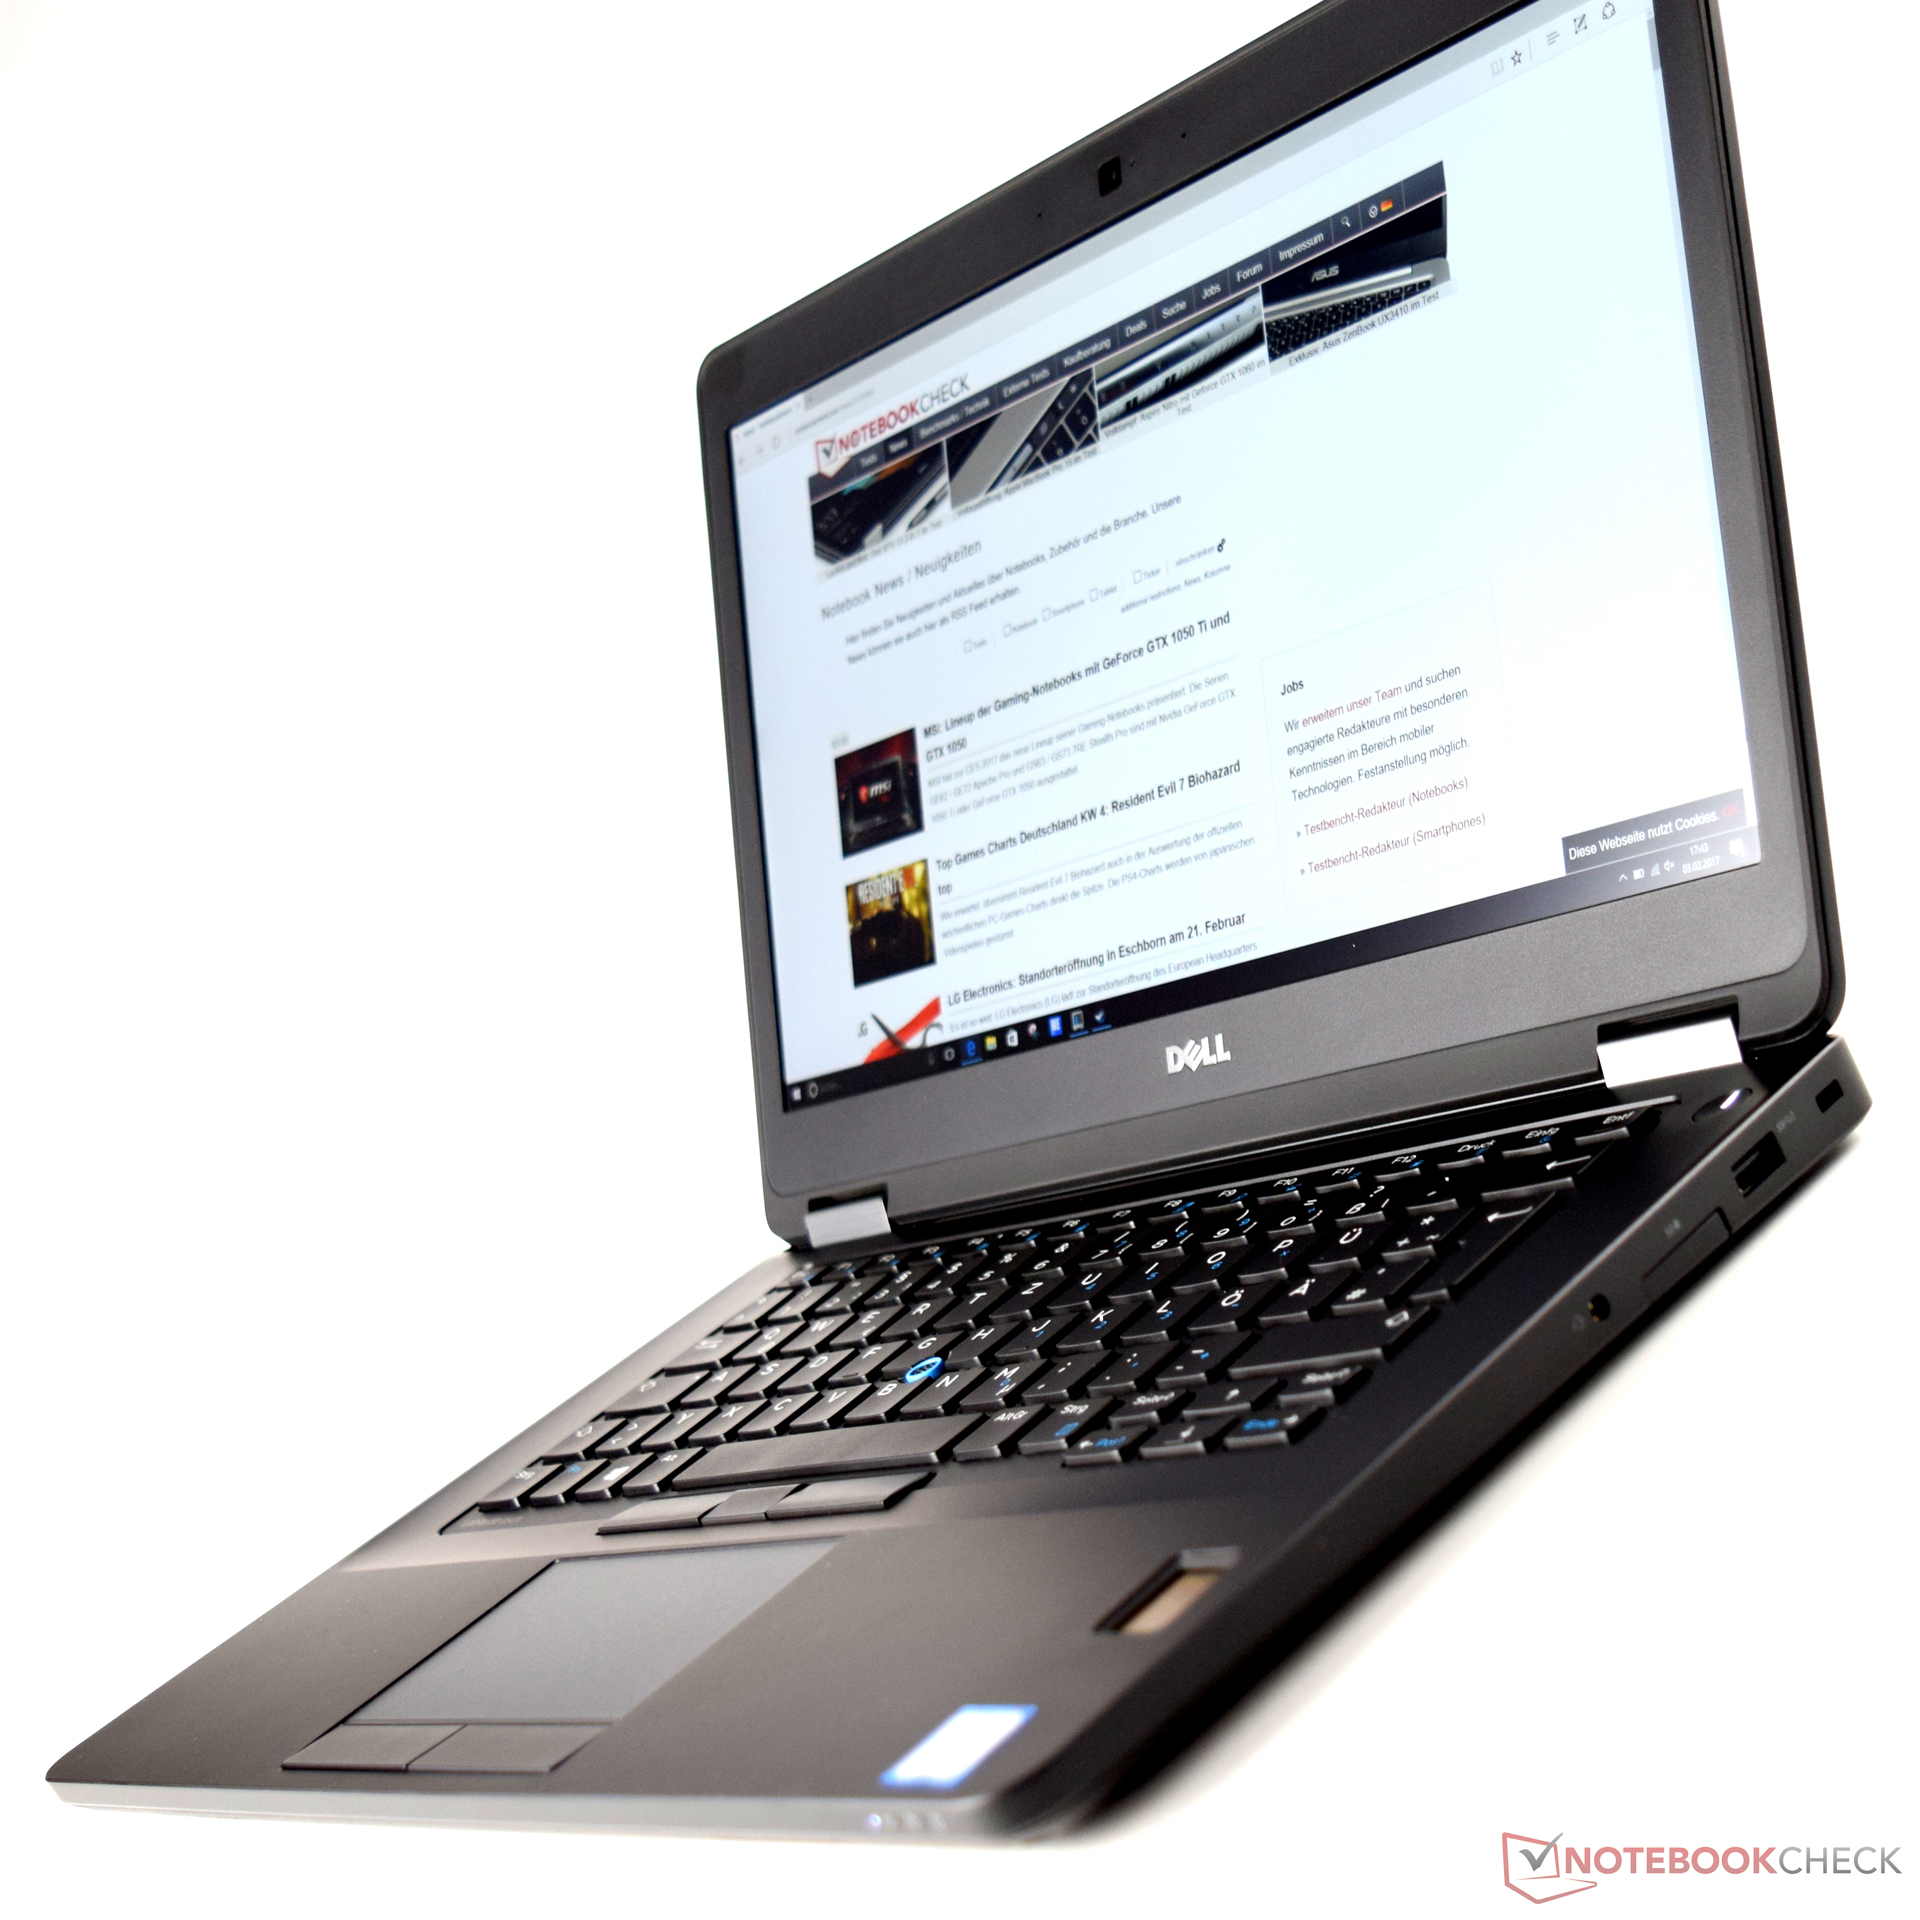
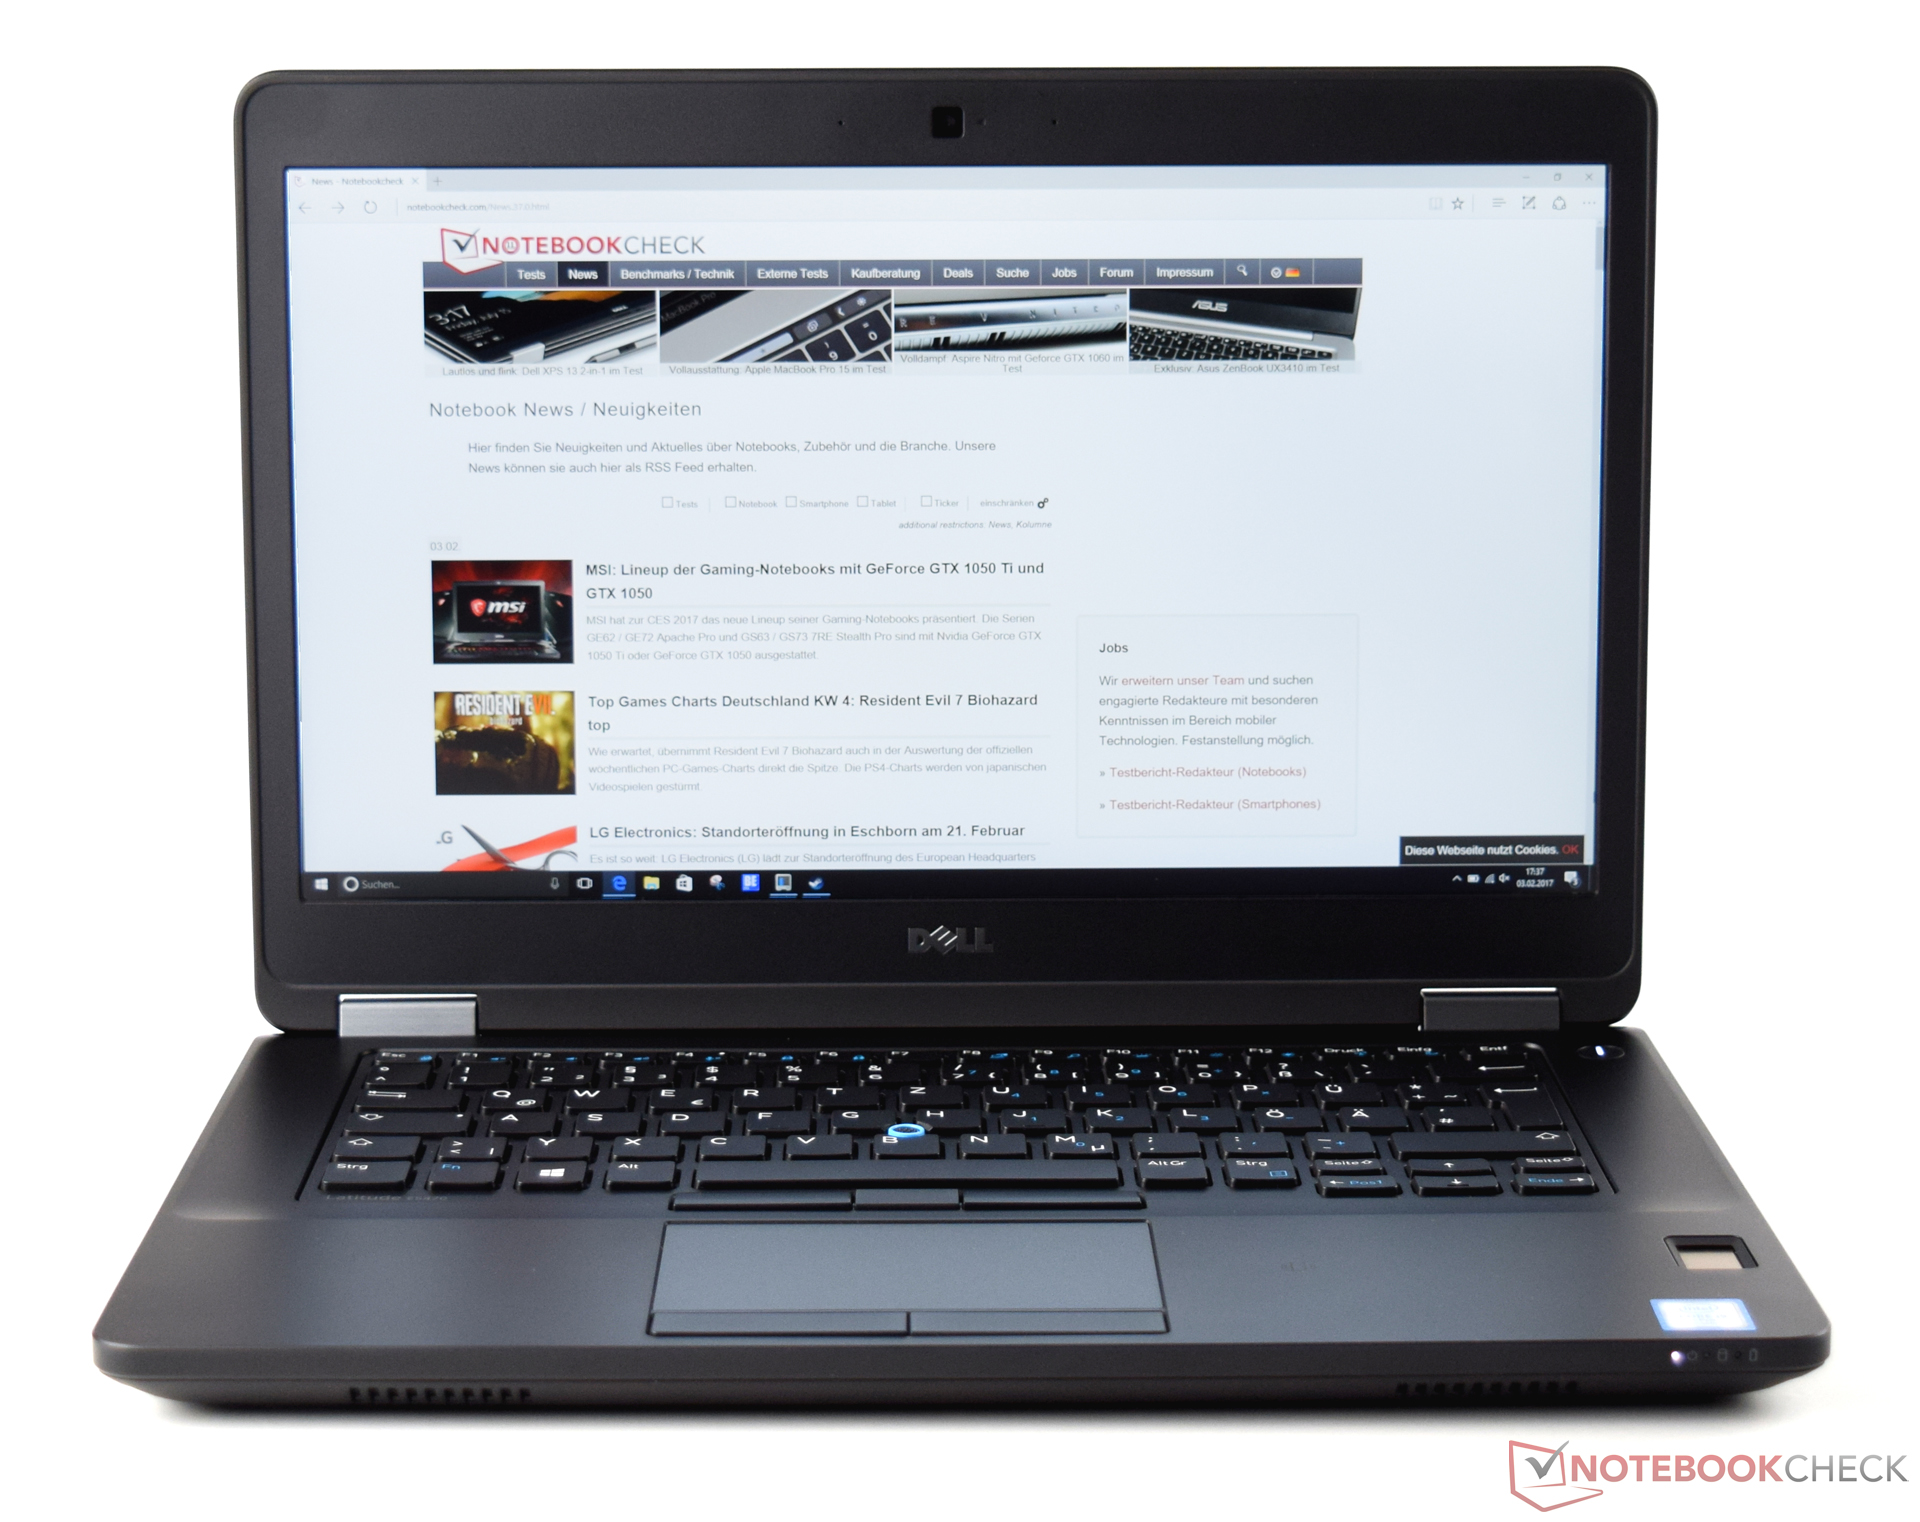
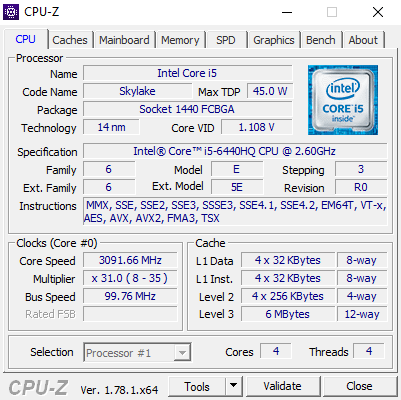
Breve análisis del Dell Latitude 14 E5470 6440HQ

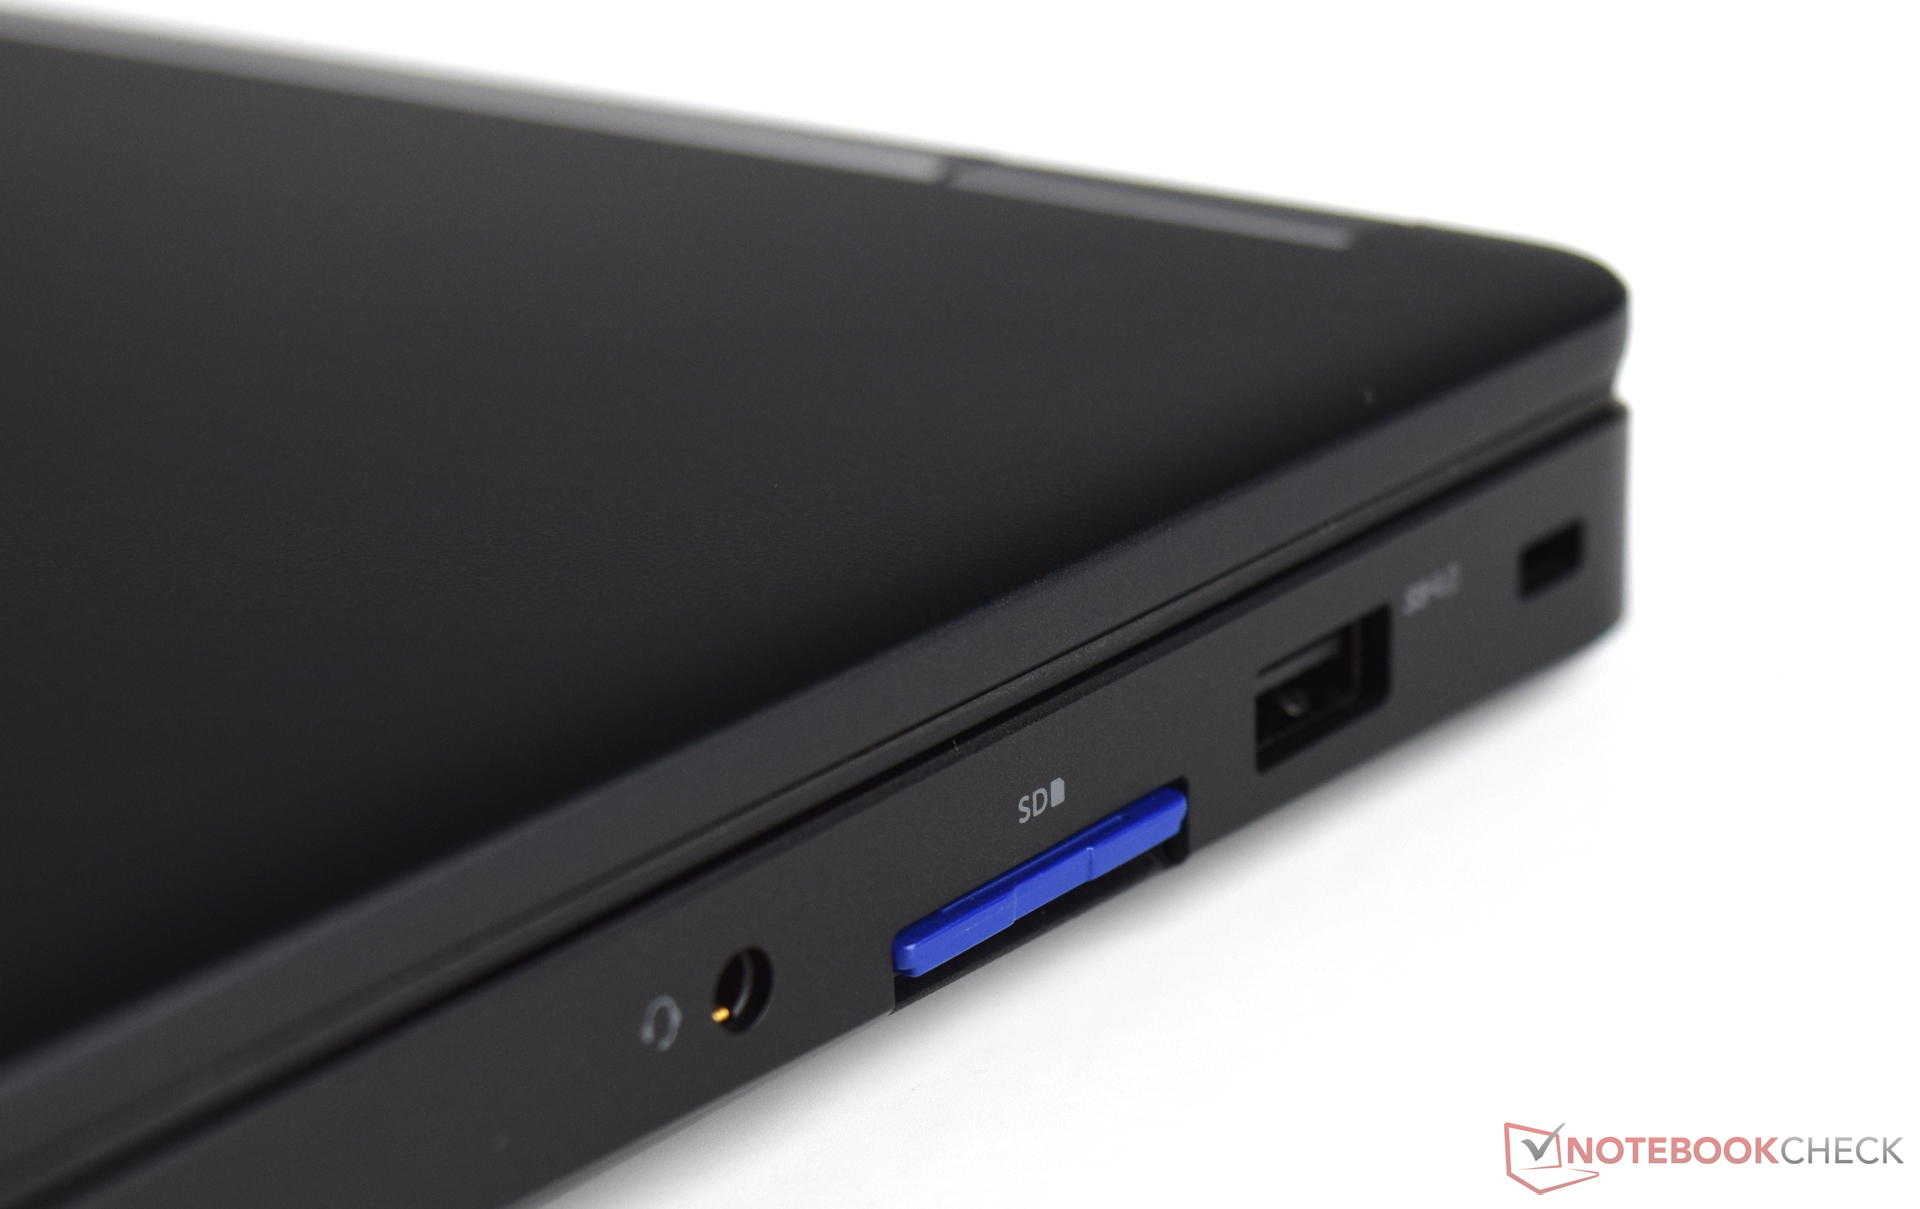
| SD Card Reader | |
| average JPG Copy Test (av. of 3 runs) | |
| Dell Latitude 14 E5470 | |
| Dell Latitude 14 E5470 | |
| HP ProBook 440 G4-Y8B51EA | |
| Acer TravelMate P648-M-757N | |
| Lenovo ThinkPad T460-20FN003LGE | |
| maximum AS SSD Seq Read Test (1GB) | |
| Dell Latitude 14 E5470 | |
| Dell Latitude 14 E5470 | |
| Lenovo ThinkPad T460-20FN003LGE | |
| HP ProBook 440 G4-Y8B51EA | |
| Networking | |
| iperf3 transmit AX12 | |
| Lenovo IdeaPad 710S Plus-13IKB | |
| Dell Vostro 15-5568 | |
| Dell Latitude 14 E5470 (jseb) | |
| HP Pavilion 14-al103ng | |
| iperf3 receive AX12 | |
| Dell Latitude 14 E5470 (jseb) | |
| Lenovo IdeaPad 710S Plus-13IKB | |
| Dell Vostro 15-5568 | |
| HP Pavilion 14-al103ng | |
| |||||||||||||||||||||||||
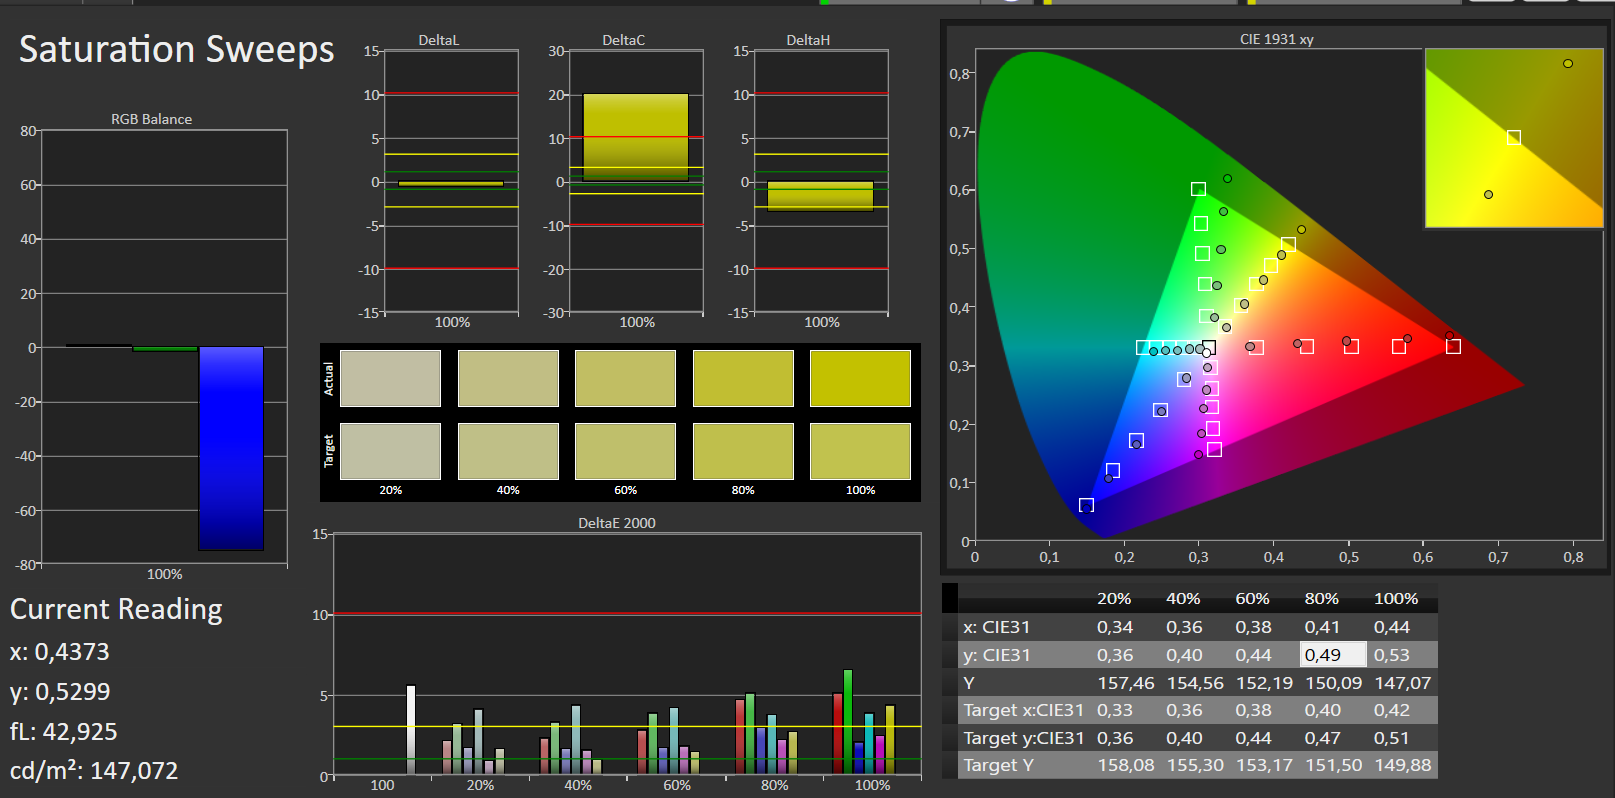
iluminación: 79 %
Brillo con batería: 323 cd/m²
Contraste: 567:1 (Negro: 0.57 cd/m²)
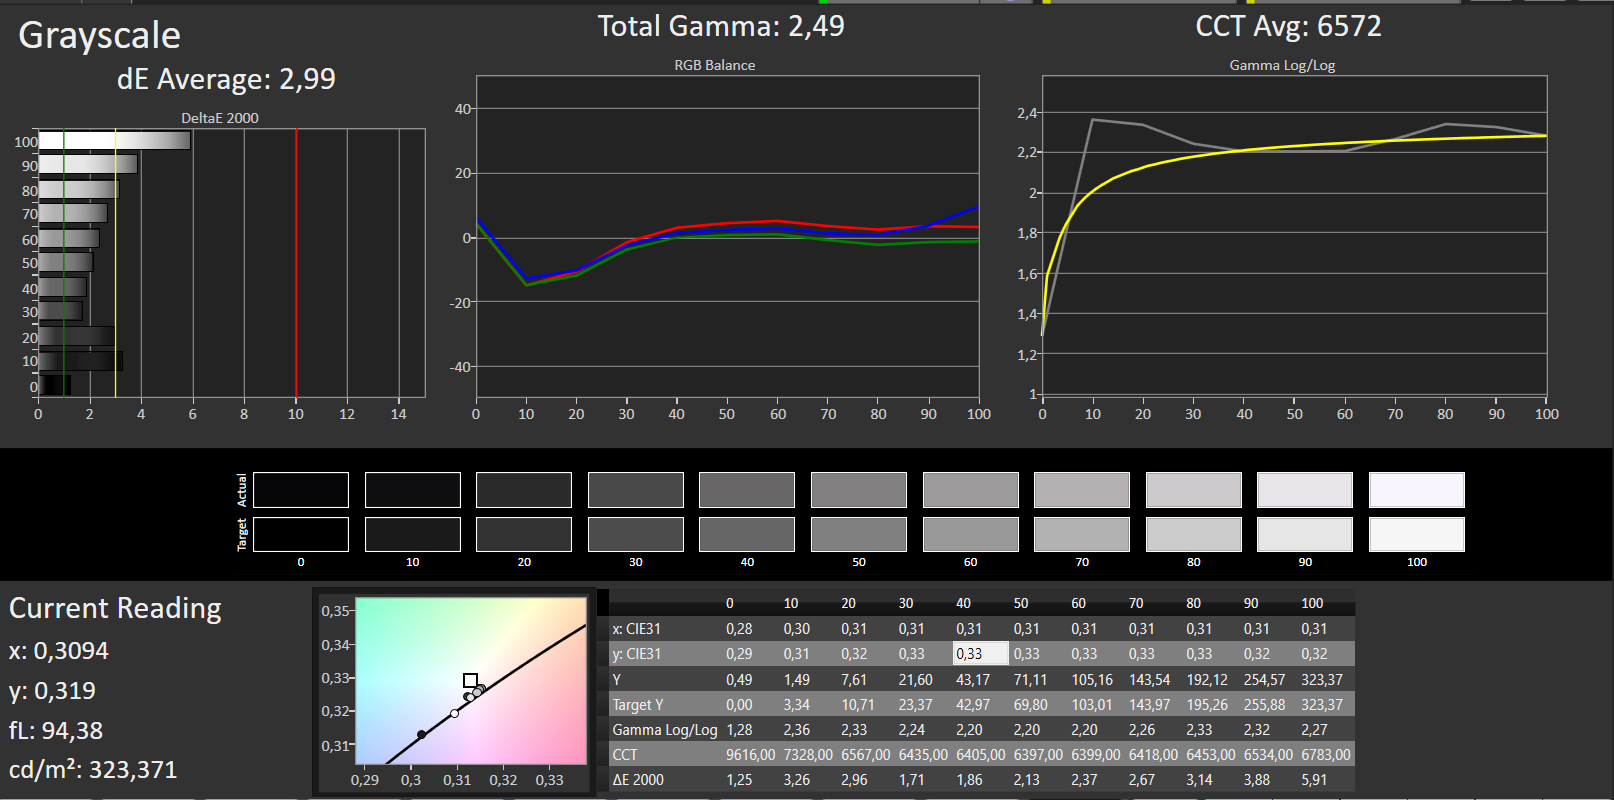
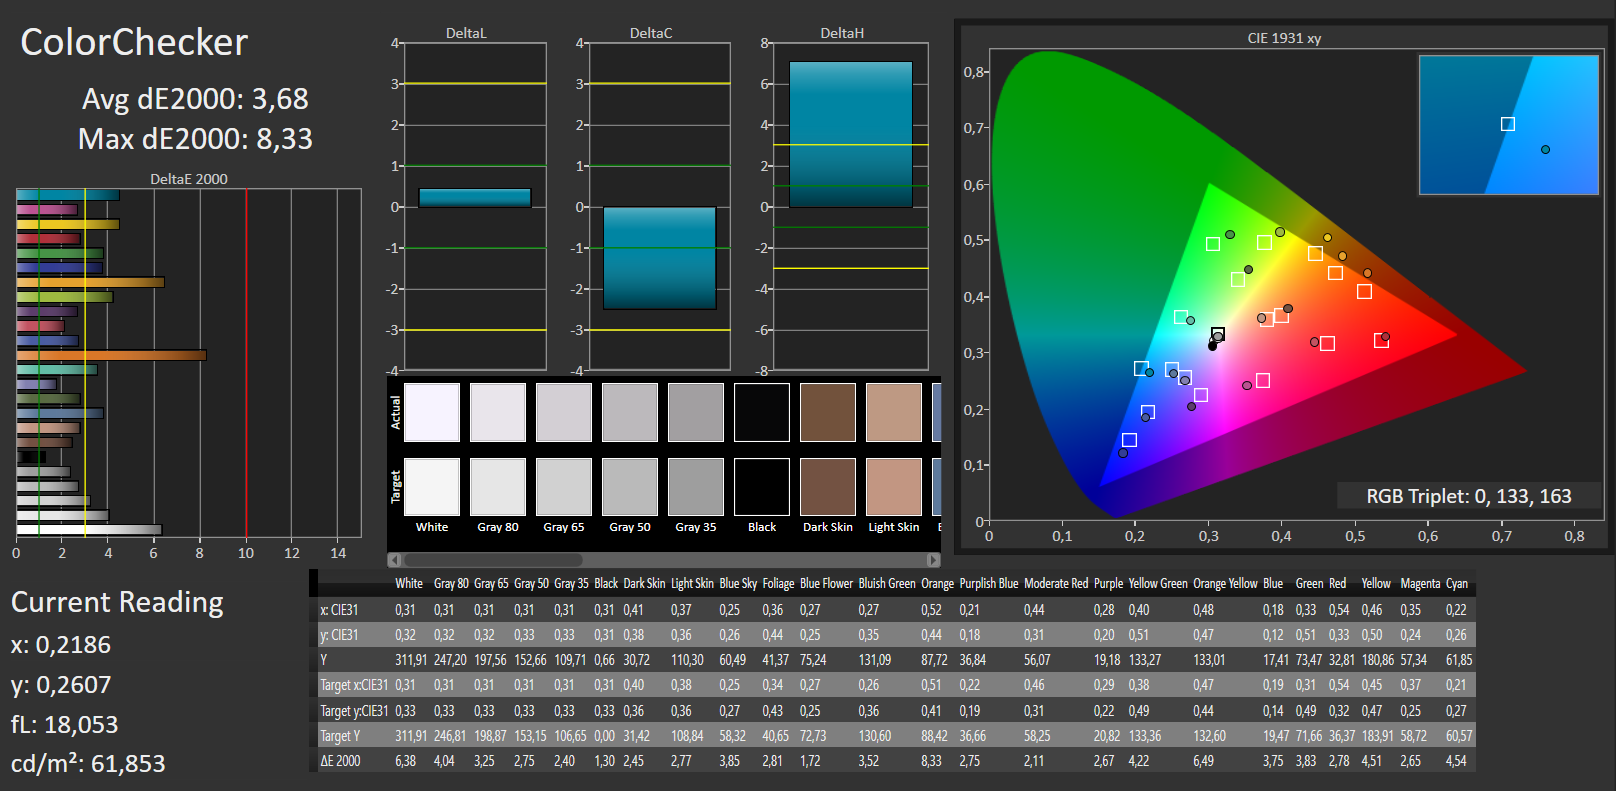
ΔE ColorChecker Calman: 3.68 | ∀{0.5-29.43 Ø4.71}
ΔE Greyscale Calman: 2.99 | ∀{0.09-98 Ø4.96}
85% sRGB (Argyll 1.6.3 3D)
55% AdobeRGB 1998 (Argyll 1.6.3 3D)
62% AdobeRGB 1998 (Argyll 3D)
84.8% sRGB (Argyll 3D)
64.8% Display P3 (Argyll 3D)
Gamma: 2.49
CCT: 6572 K
| Dell Latitude 14 E5470 LP140WF3, 1920x1080, 14" | Dell Latitude 14 E5470 LG Philips LGD04B1 140WHU, 1366x768, 14" | HP ProBook 440 G4-Y8B51EA AUO1E3D, 1920x1080, 14" | Lenovo ThinkPad T460-20FN003LGE Lenovo LEN40A9 / N140HCE-EAA, 1920x1080, 14" | Acer TravelMate P648-M-757N AU Optronics B140HAN02.1, 1920x1080, 14" | |
|---|---|---|---|---|---|
| Display | -33% | -37% | -31% | -41% | |
| Display P3 Coverage (%) | 64.8 | 40.06 -38% | 37.6 -42% | 42.09 -35% | 35.53 -45% |
| sRGB Coverage (%) | 84.8 | 60.3 -29% | 56.6 -33% | 62 -27% | 53.3 -37% |
| AdobeRGB 1998 Coverage (%) | 62 | 41.42 -33% | 38.85 -37% | 43.6 -30% | 36.72 -41% |
| Response Times | -29% | -3% | -2% | -5% | |
| Response Time Grey 50% / Grey 80% * (ms) | 39 ? | 56.8 ? -46% | 43.2 ? -11% | 42.4 ? -9% | 44 ? -13% |
| Response Time Black / White * (ms) | 26 ? | 28.8 ? -11% | 24.4 ? 6% | 24.8 ? 5% | 25 ? 4% |
| PWM Frequency (Hz) | |||||
| Screen | -73% | -57% | -35% | 5% | |
| Brightness middle (cd/m²) | 323 | 229 -29% | 216 -33% | 230 -29% | 254 -21% |
| Brightness (cd/m²) | 316 | 207 -34% | 203 -36% | 216 -32% | 243 -23% |
| Brightness Distribution (%) | 79 | 80 1% | 83 5% | 85 8% | 90 14% |
| Black Level * (cd/m²) | 0.57 | 0.69 -21% | 0.47 18% | 0.26 54% | 0.19 67% |
| Contrast (:1) | 567 | 332 -41% | 460 -19% | 885 56% | 1337 136% |
| Colorchecker dE 2000 * | 3.68 | 10.16 -176% | 8.98 -144% | 7.32 -99% | 4.93 -34% |
| Colorchecker dE 2000 max. * | 8.33 | 17.18 -106% | 14.07 -69% | 18.14 -118% | 10.14 -22% |
| Greyscale dE 2000 * | 2.99 | 10.87 -264% | 9.61 -221% | 6.98 -133% | 2.71 9% |
| Gamma | 2.49 88% | 2.41 91% | 2.63 84% | 2.5 88% | 2.36 93% |
| CCT | 6572 99% | 12881 50% | 11265 58% | 6683 97% | 6914 94% |
| Color Space (Percent of AdobeRGB 1998) (%) | 55 | 38.4 -30% | 35.9 -35% | 39.97 -27% | 34 -38% |
| Color Space (Percent of sRGB) (%) | 85 | 60.4 -29% | 56.7 -33% | 61.55 -28% | 53 -38% |
| Media total (Programa/Opciones) | -45% /
-59% | -32% /
-46% | -23% /
-30% | -14% /
-5% |
* ... más pequeño es mejor
Tiempos de respuesta del display
| ↔ Tiempo de respuesta de Negro a Blanco | ||
|---|---|---|
| 26 ms ... subida ↗ y bajada ↘ combinada | ↗ 5 ms subida | 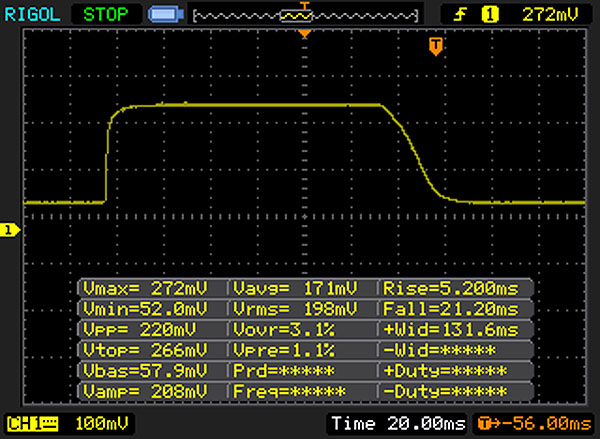 |
| ↘ 21 ms bajada | ||
| La pantalla mostró tiempos de respuesta relativamente lentos en nuestros tests pero podría ser demasiado lenta para los jugones. En comparación, todos los dispositivos de prueba van de ##min### (mínimo) a 240 (máximo) ms. » 63 % de todos los dispositivos son mejores. Eso quiere decir que el tiempo de respuesta es peor que la media (19.8 ms) de todos los dispositivos testados. | ||
| ↔ Tiempo de respuesta 50% Gris a 80% Gris | ||
| 39 ms ... subida ↗ y bajada ↘ combinada | ↗ 15 ms subida | 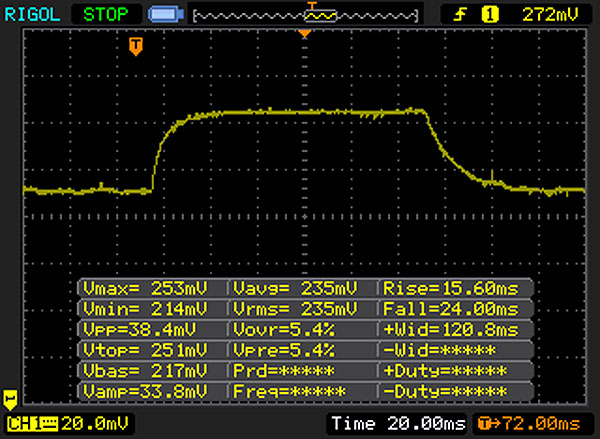 |
| ↘ 24 ms bajada | ||
| La pantalla mostró tiempos de respuesta lentos en nuestros tests y podría ser demasiado lenta para los jugones. En comparación, todos los dispositivos de prueba van de ##min### (mínimo) a 636 (máximo) ms. » 59 % de todos los dispositivos son mejores. Eso quiere decir que el tiempo de respuesta es peor que la media (30.9 ms) de todos los dispositivos testados. | ||
Parpadeo de Pantalla / PWM (Pulse-Width Modulation)
| Parpadeo de Pantalla / PWM no detectado | ||
Comparación: 52 % de todos los dispositivos testados no usaron PWM para atenuar el display. Si se usó, medimos una media de 7744 (mínimo: 5 - máxmo: 343500) Hz. | ||
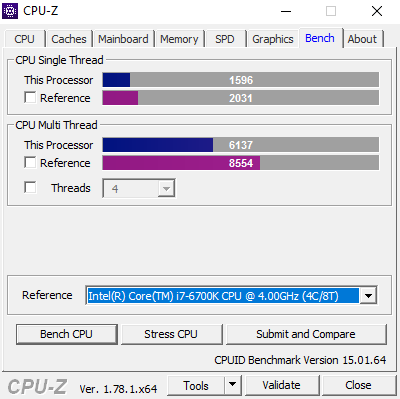
| Cinebench R11.5 | |
| CPU Multi 64Bit | |
| Dell Latitude 14 E5470 | |
| HP ProBook 440 G4-Y8B51EA | |
| Dell Latitude 14 E5470 | |
| Acer TravelMate P648-M-757N | |
| CPU Single 64Bit | |
| HP ProBook 440 G4-Y8B51EA | |
| Dell Latitude 14 E5470 | |
| Dell Latitude 14 E5470 | |
| Acer TravelMate P648-M-757N | |
| Cinebench R10 | |
| Rendering Multiple CPUs 64Bit | |
| Dell Latitude 14 E5470 | |
| Dell Latitude 14 E5470 | |
| Rendering Single CPUs 64Bit | |
| Dell Latitude 14 E5470 | |
| Dell Latitude 14 E5470 | |
| JetStream 1.1 - 1.1 Total | |
| Dell Latitude 14 E5470 | |
| HP ProBook 440 G4-Y8B51EA | |
| Lenovo ThinkPad T460-20FN003LGE | |
| Acer TravelMate P648-M-757N | |
| Octane V2 - Total Score | |
| Dell Latitude 14 E5470 | |
| HP ProBook 440 G4-Y8B51EA | |
| Dell Latitude 14 E5470 | |
| Lenovo ThinkPad T460-20FN003LGE | |
| Acer TravelMate P648-M-757N | |
| Mozilla Kraken 1.1 - Total | |
| Acer TravelMate P648-M-757N | |
| Lenovo ThinkPad T460-20FN003LGE | |
| Dell Latitude 14 E5470 | |
| Dell Latitude 14 E5470 | |
| HP ProBook 440 G4-Y8B51EA | |
* ... más pequeño es mejor
| PCMark 8 | |
| Home Score Accelerated v2 | |
| HP ProBook 440 G4-Y8B51EA | |
| Acer TravelMate P648-M-757N | |
| Dell Latitude 14 E5470 | |
| Dell Latitude 14 E5470 | |
| Lenovo ThinkPad T460-20FN003LGE | |
| Work Score Accelerated v2 | |
| HP ProBook 440 G4-Y8B51EA | |
| Dell Latitude 14 E5470 | |
| Dell Latitude 14 E5470 | |
| Acer TravelMate P648-M-757N | |
| Lenovo ThinkPad T460-20FN003LGE | |
| Creative Score Accelerated v2 | |
| HP ProBook 440 G4-Y8B51EA | |
| Dell Latitude 14 E5470 | |
| Dell Latitude 14 E5470 | |
| Acer TravelMate P648-M-757N | |
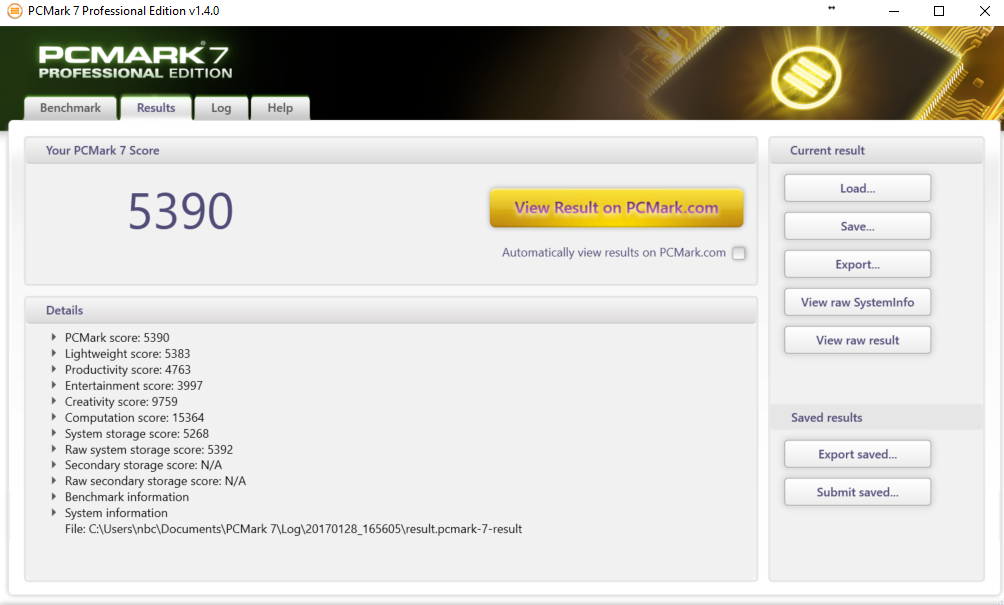
| PCMark 7 Score | 5390 puntos | |
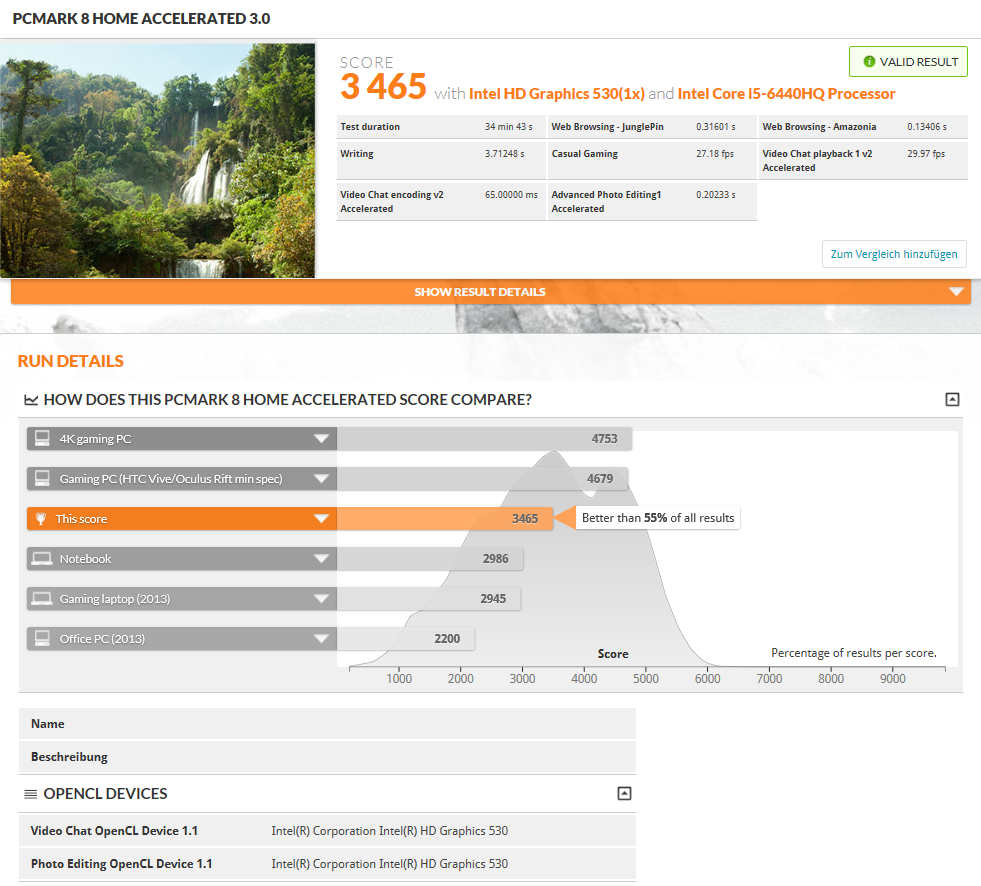
| PCMark 8 Home Score Accelerated v2 | 3465 puntos | |
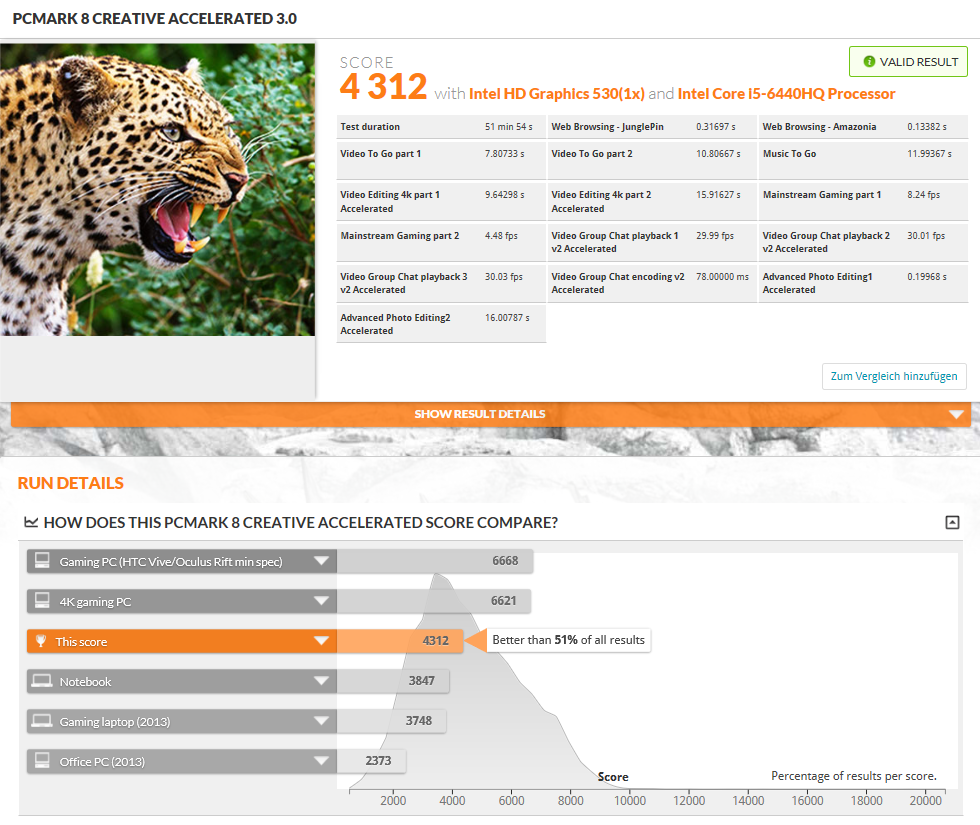
| PCMark 8 Creative Score Accelerated v2 | 4312 puntos | |
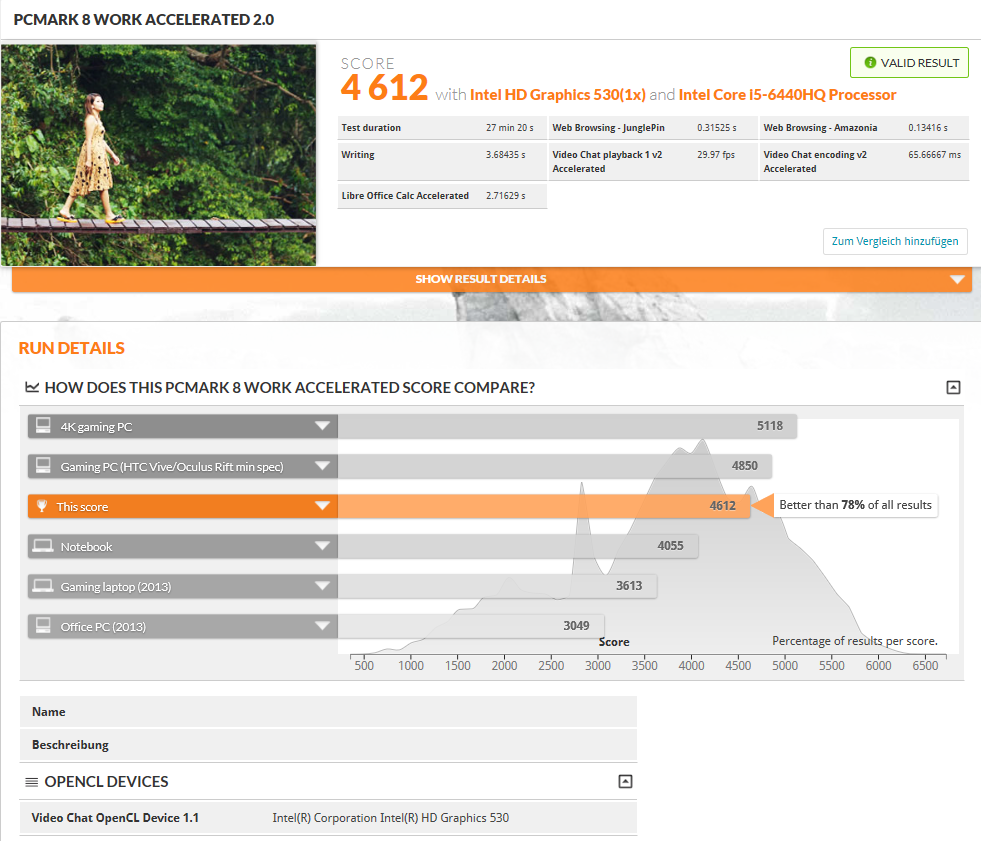
| PCMark 8 Work Score Accelerated v2 | 4612 puntos | |
ayuda | ||
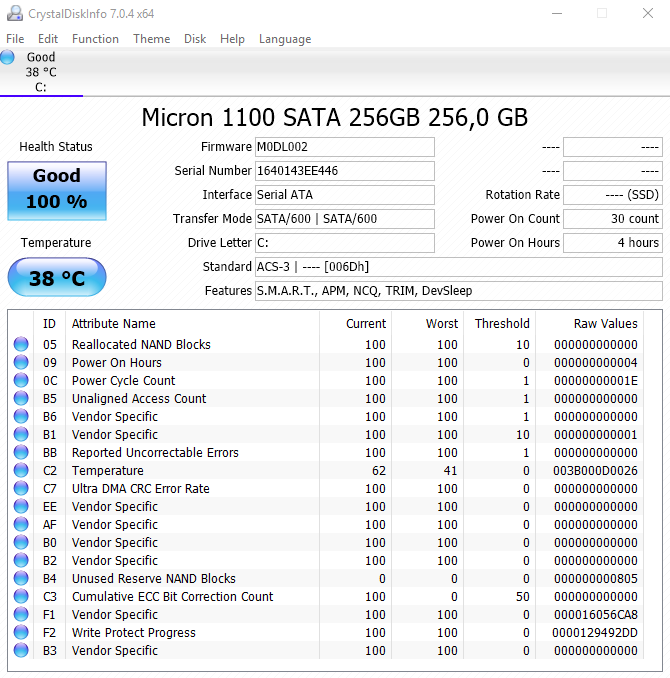
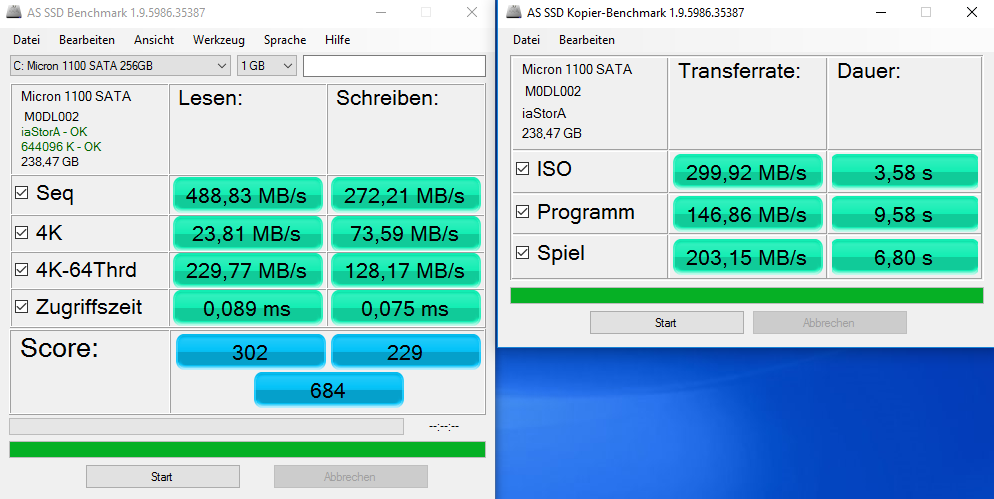
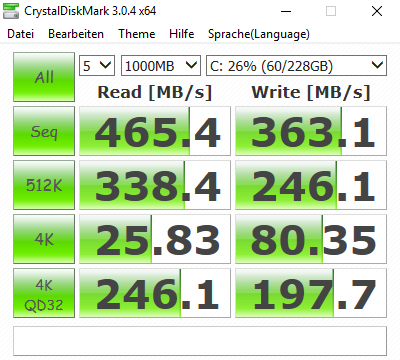
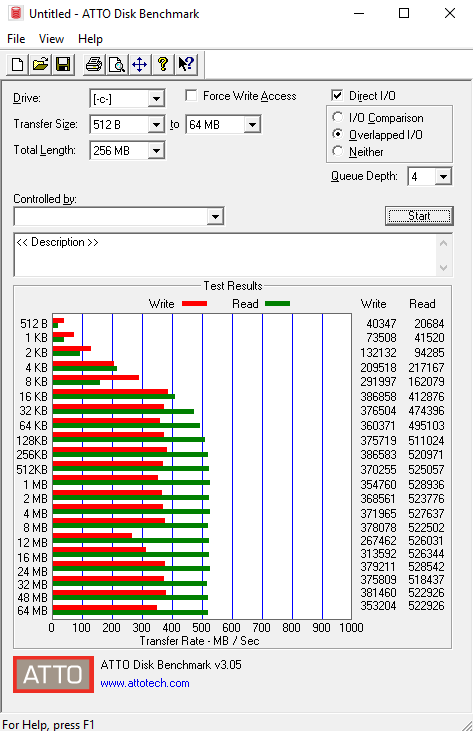
| Dell Latitude 14 E5470 Micron SSD 1100 (MTFDDAV256TBN) | Dell Latitude 14 E5470 Liteon L8H-256V2G | HP ProBook 440 G4-Y8B51EA SanDisk SD8SNAT256G1002 | Lenovo ThinkPad T460-20FN003LGE Toshiba HG6 THNSFJ256GCSU | Acer TravelMate P648-M-757N Lite-On CV1-8B256 | |
|---|---|---|---|---|---|
| CrystalDiskMark 3.0 | 12% | -6% | 6% | 13% | |
| Read Seq (MB/s) | 465.4 | 508 9% | 491.2 6% | 458.9 -1% | 531 14% |
| Write Seq (MB/s) | 363.1 | 360.6 -1% | 322.2 -11% | 394.4 9% | 358.8 -1% |
| Read 512 (MB/s) | 338.4 | 374.1 11% | 310.1 -8% | 371.3 10% | 384.8 14% |
| Write 512 (MB/s) | 246.1 | 300.2 22% | 276 12% | 232.7 -5% | 363 48% |
| Read 4k (MB/s) | 25.83 | 31.98 24% | 19.57 -24% | 21.7 -16% | 31.3 21% |
| Write 4k (MB/s) | 80.3 | 93.1 16% | 77.8 -3% | 72.9 -9% | 80.3 0% |
| Read 4k QD32 (MB/s) | 246.1 | 274.7 12% | 146.3 -41% | 369.9 50% | 239.4 -3% |
| Write 4k QD32 (MB/s) | 197.7 | 205.6 4% | 241.4 22% | 216 9% | 225.3 14% |

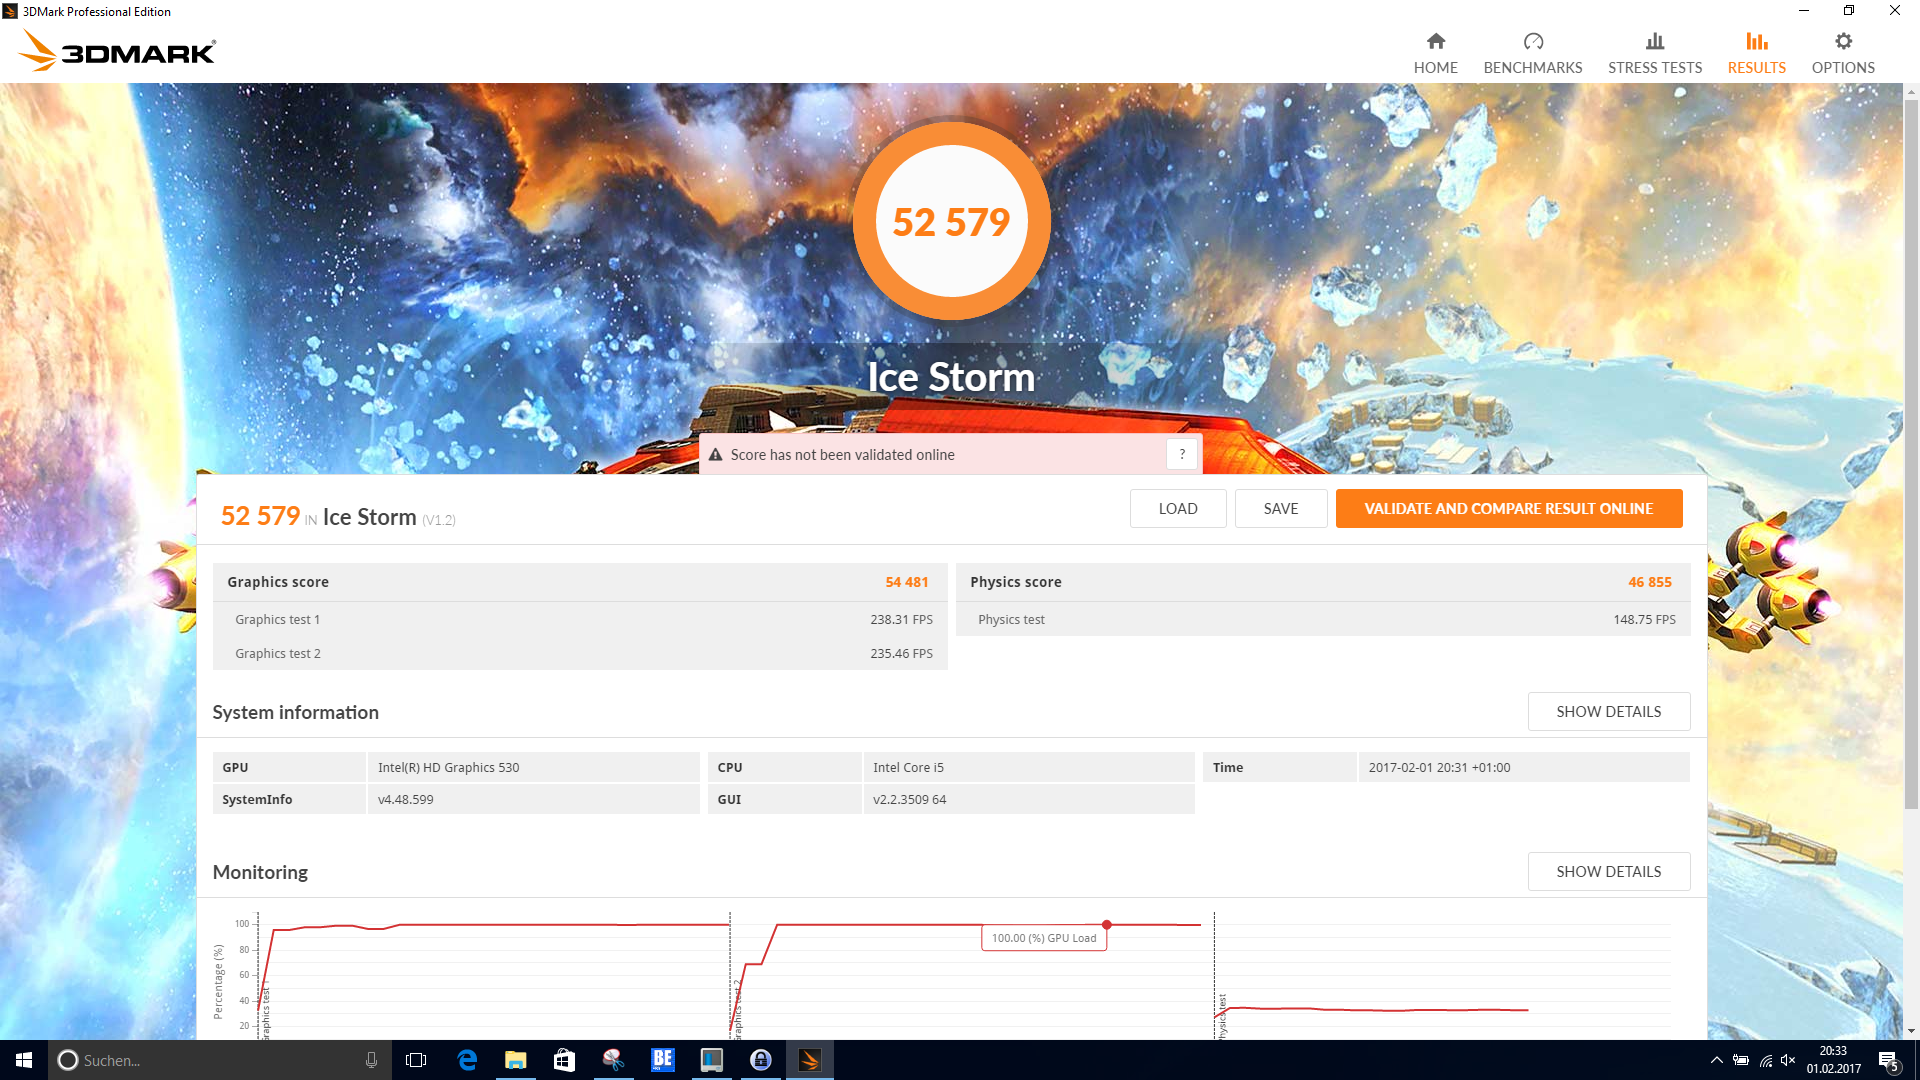
| 3DMark | |
| 1280x720 Cloud Gate Standard Graphics | |
| HP ProBook 440 G4-Y8B51EA | |
| Acer TravelMate P648-M-757N | |
| Dell Latitude 14 E5470 | |
| Dell Latitude 14 E5470 | |
| Lenovo ThinkPad T460-20FN003LGE | |
| 1920x1080 Fire Strike Graphics | |
| HP ProBook 440 G4-Y8B51EA | |
| Acer TravelMate P648-M-757N | |
| Dell Latitude 14 E5470 | |
| Dell Latitude 14 E5470 | |
| 3DMark 11 - 1280x720 Performance GPU | |
| HP ProBook 440 G4-Y8B51EA | |
| Dell Latitude 14 E5470 | |
| Dell Latitude 14 E5470 | |
| Acer TravelMate P648-M-757N | |
| Lenovo ThinkPad T460-20FN003LGE | |
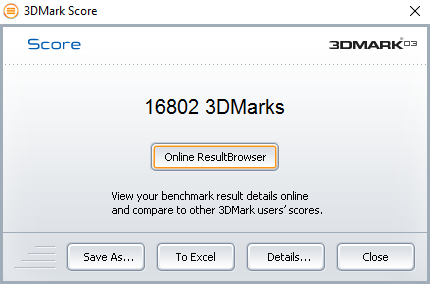
| 3DMark 03 Standard | 16802 puntos | |
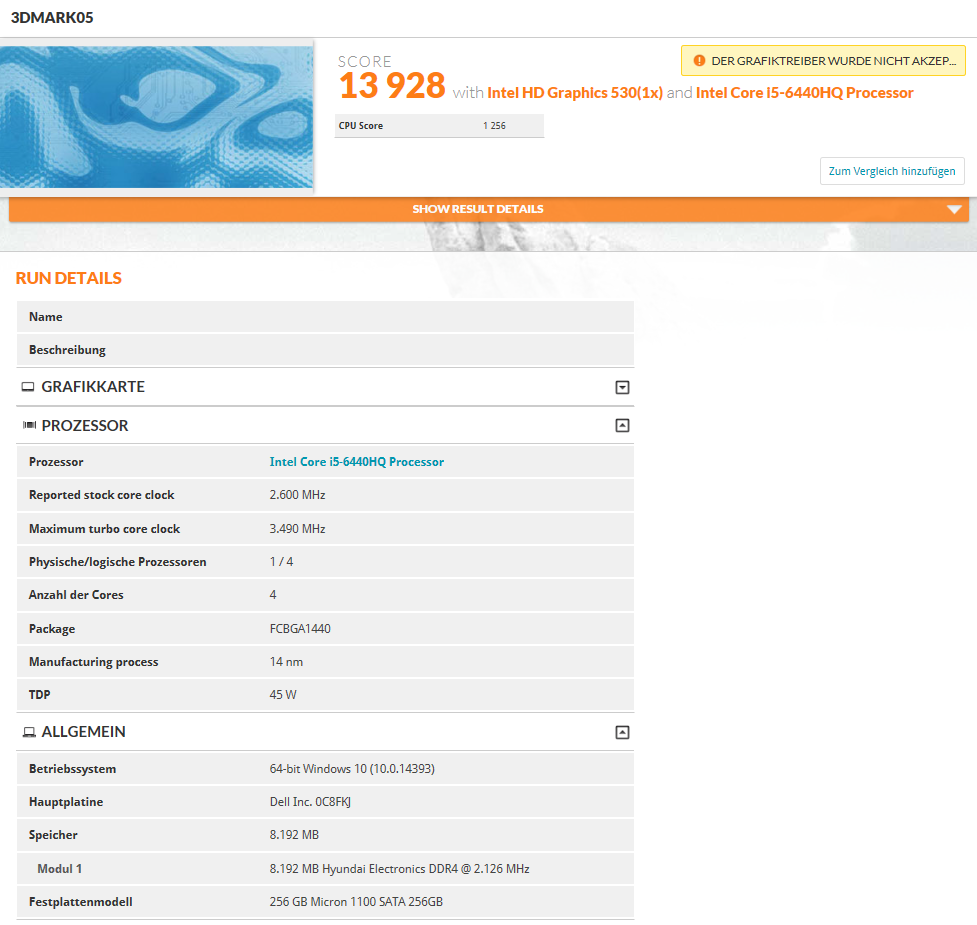
| 3DMark 05 Standard | 13920 puntos | |
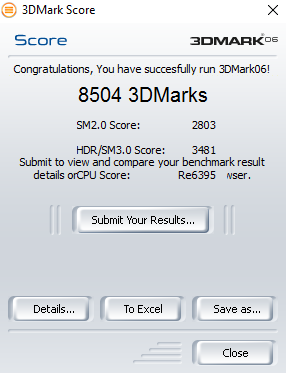
| 3DMark 06 Standard Score | 8504 puntos | |
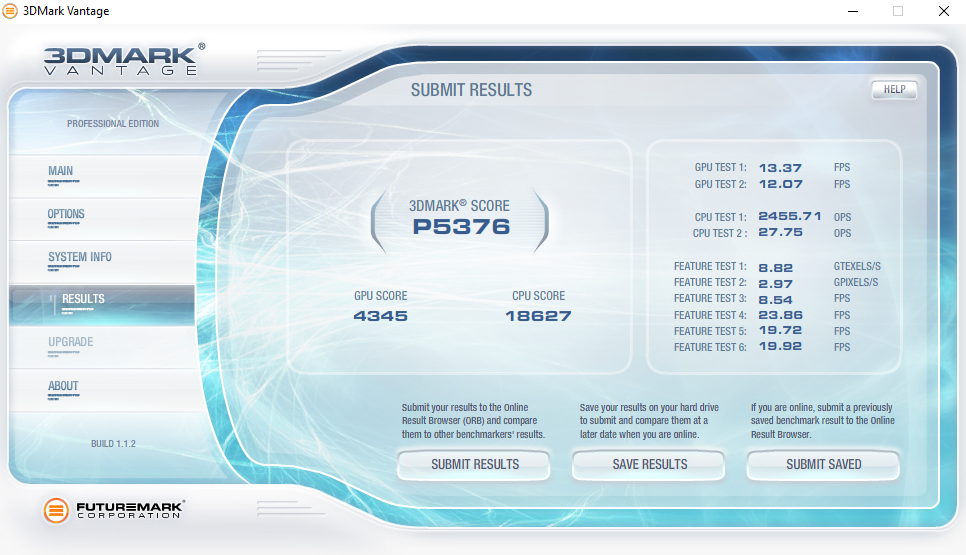
| 3DMark Vantage P Result | 5376 puntos | |
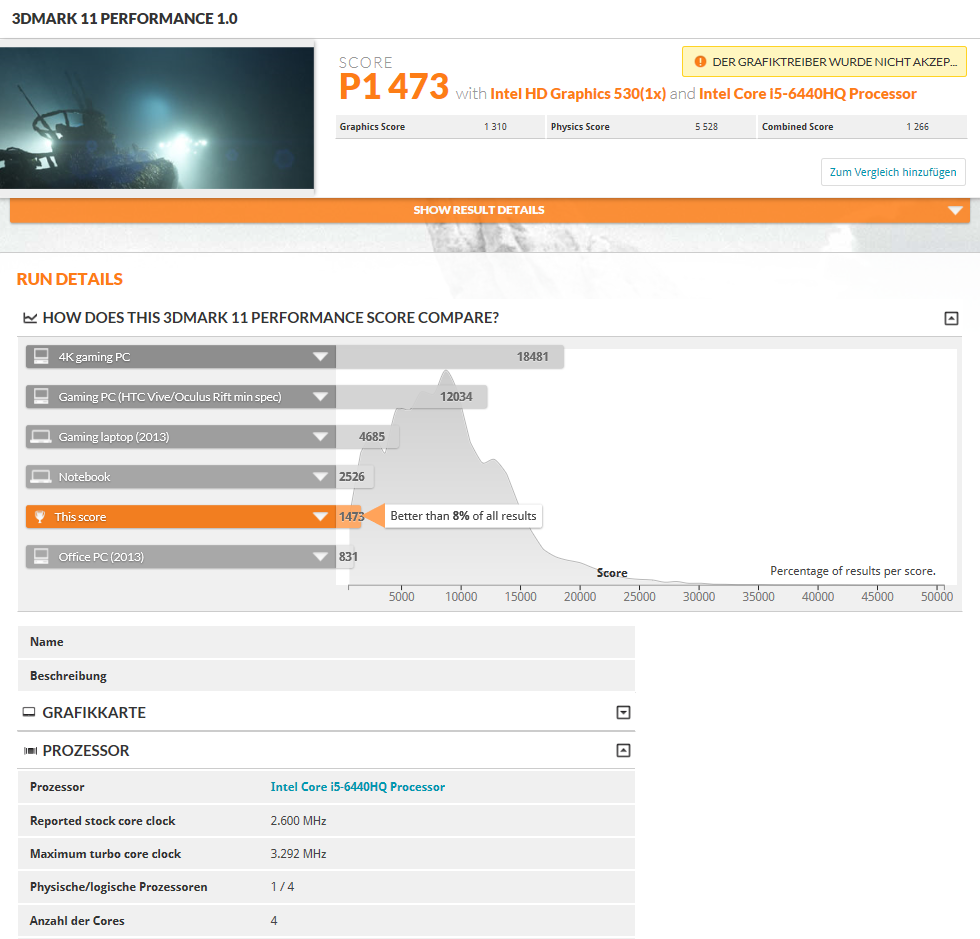
| 3DMark 11 Performance | 1473 puntos | |
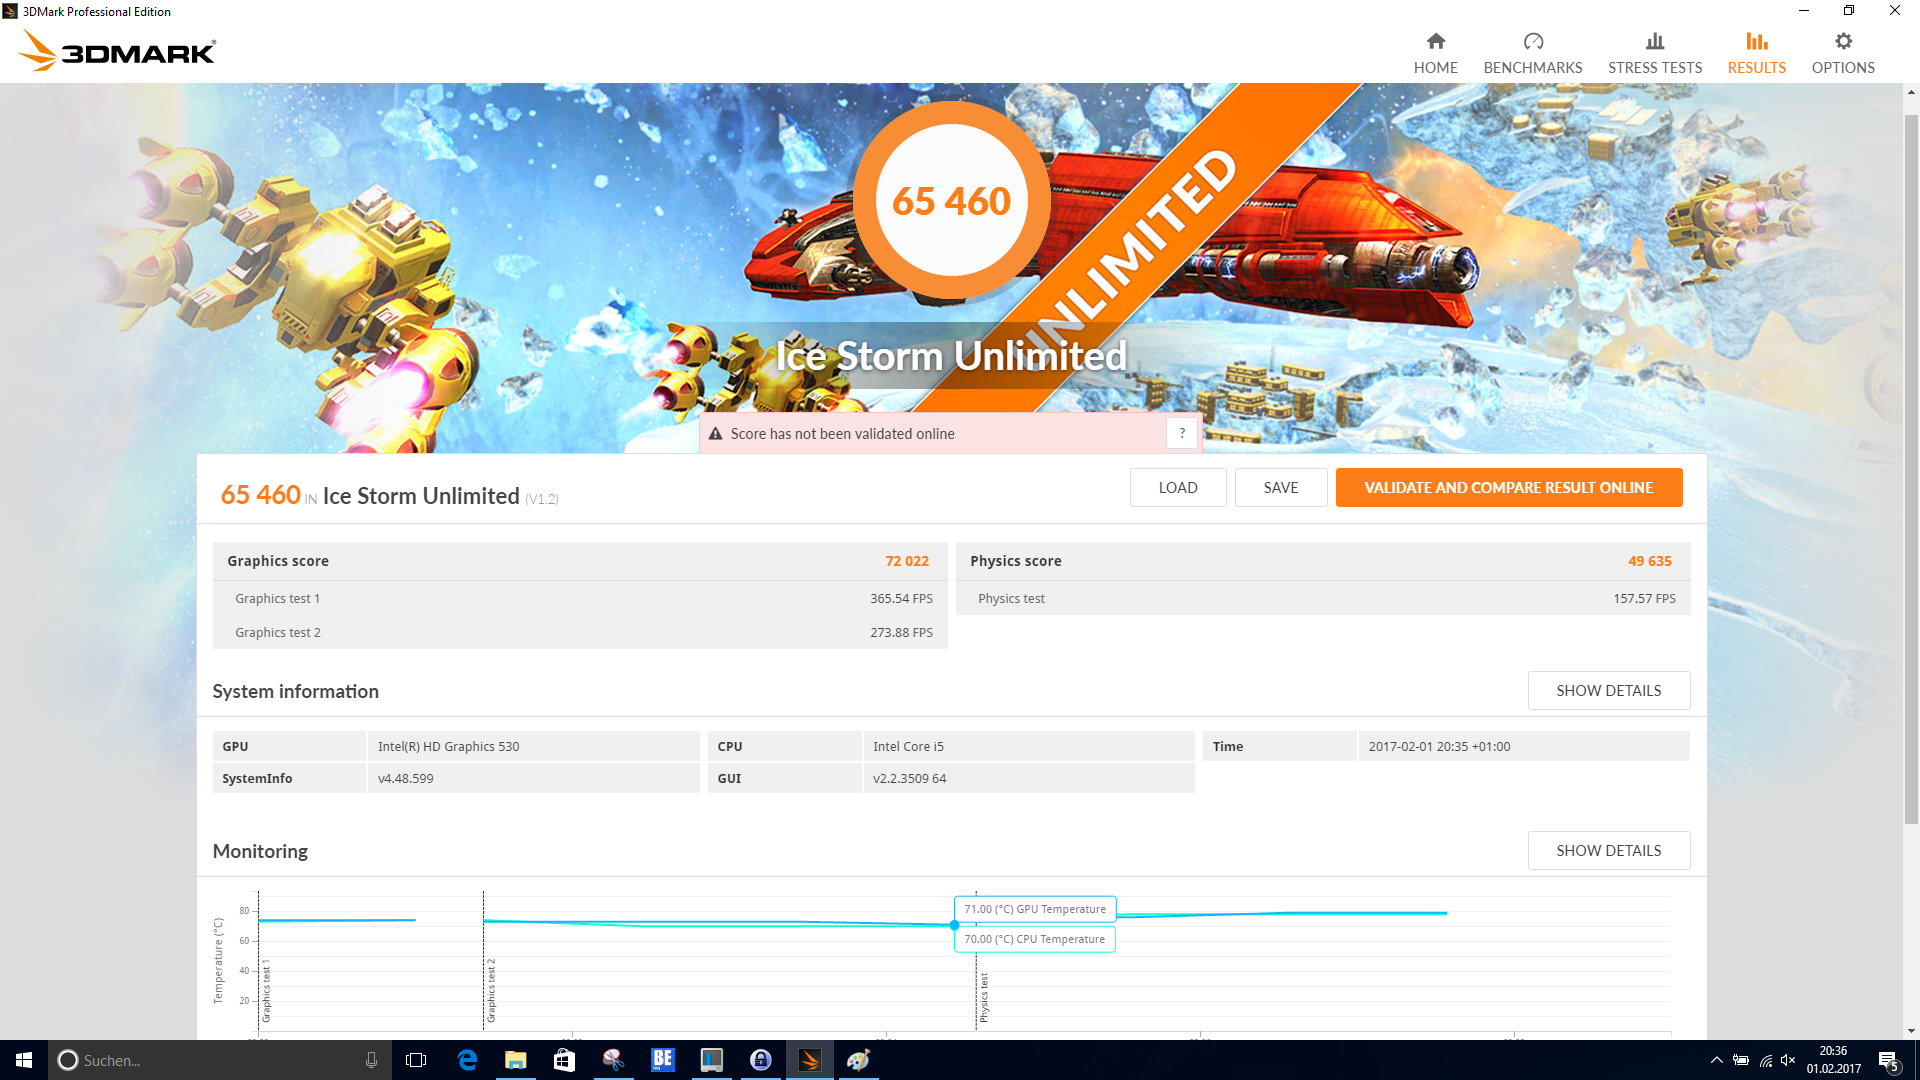
| 3DMark Ice Storm Standard Score | 52579 puntos | |
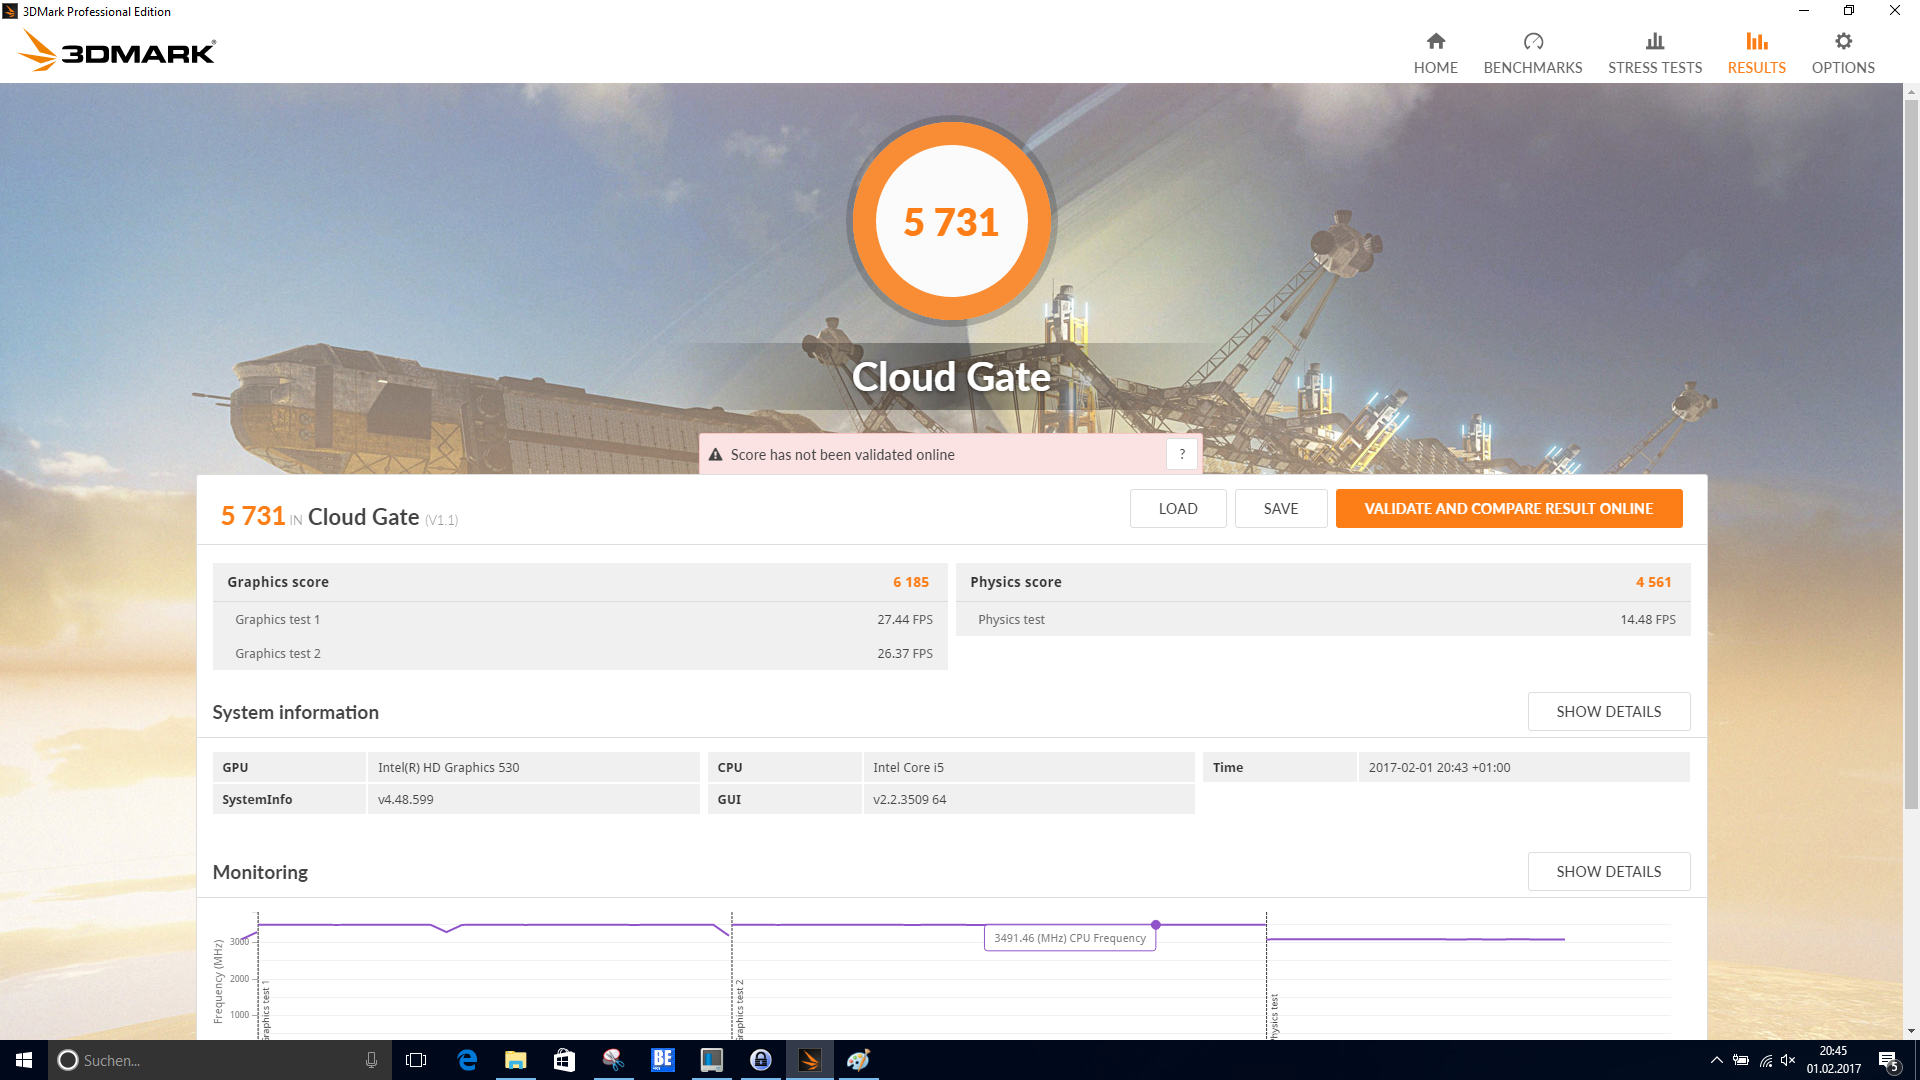
| 3DMark Cloud Gate Standard Score | 5731 puntos | |
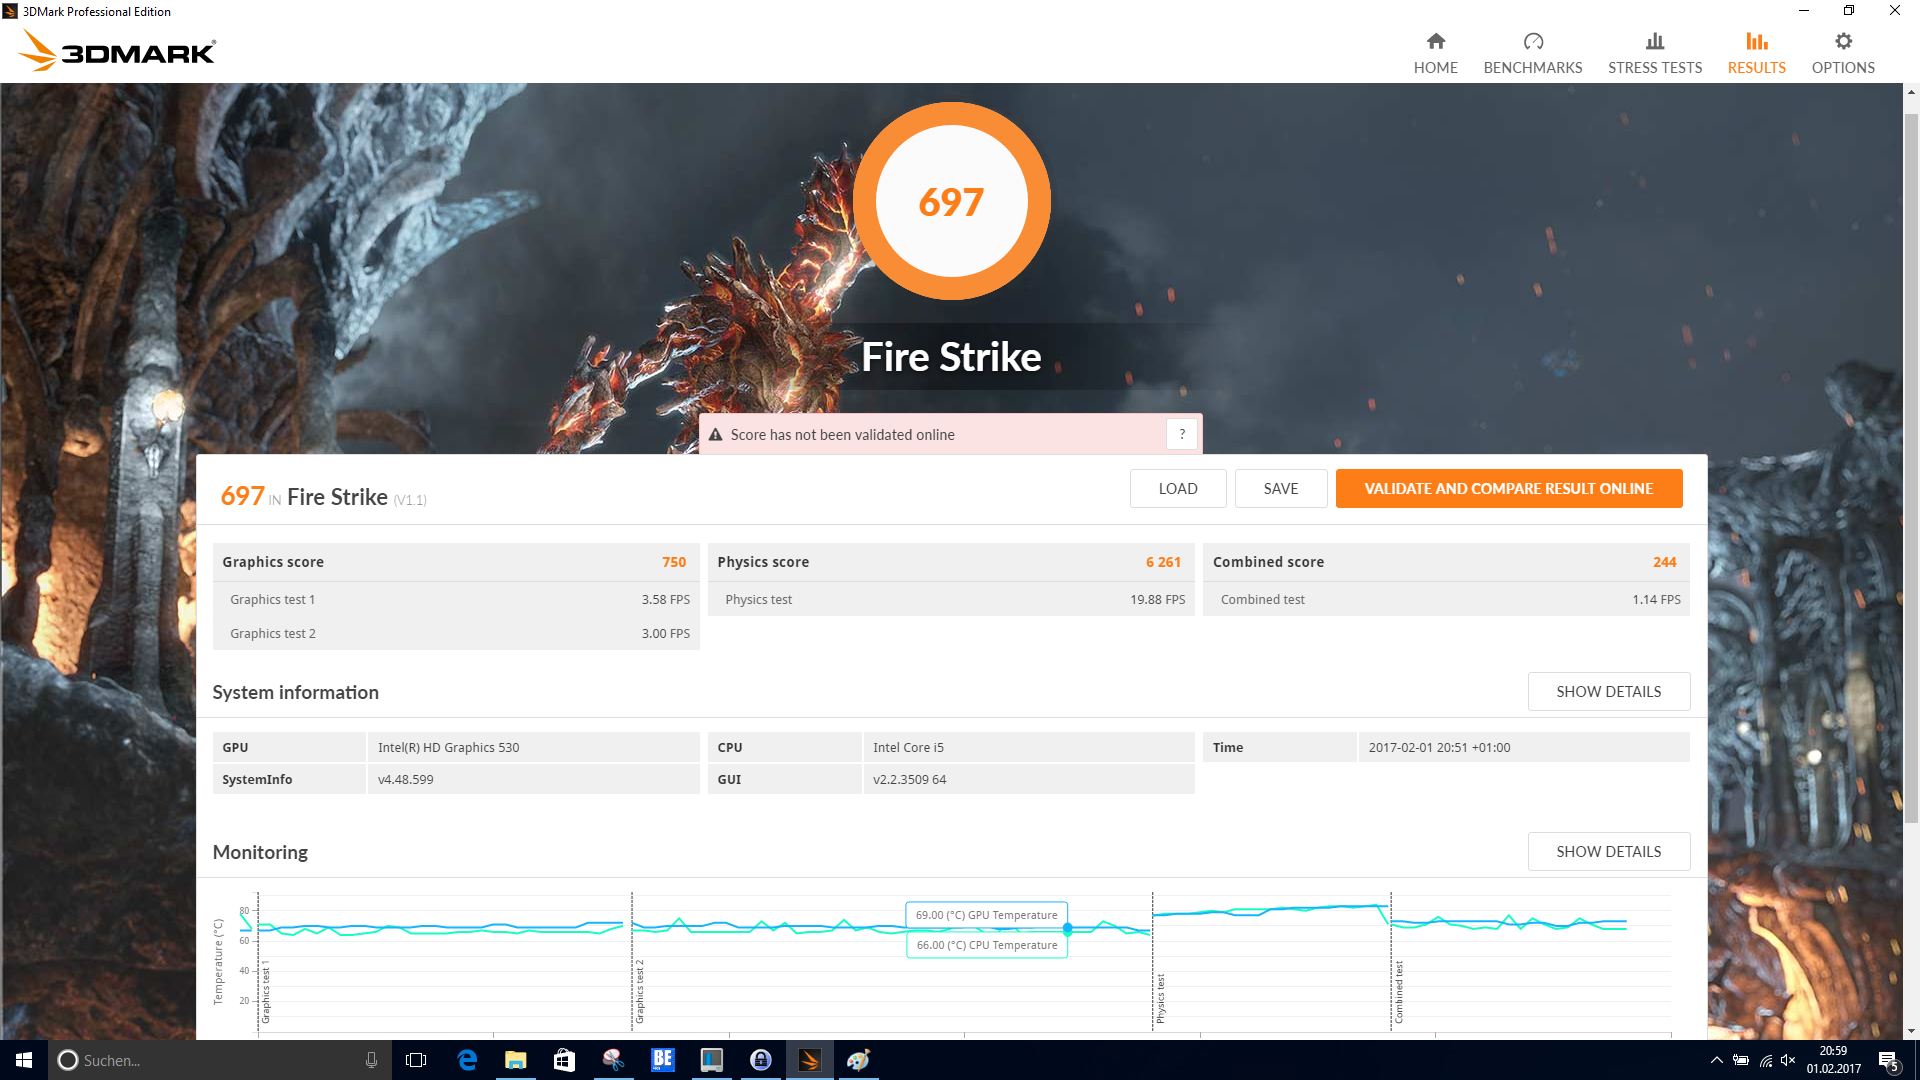
| 3DMark Fire Strike Score | 697 puntos | |
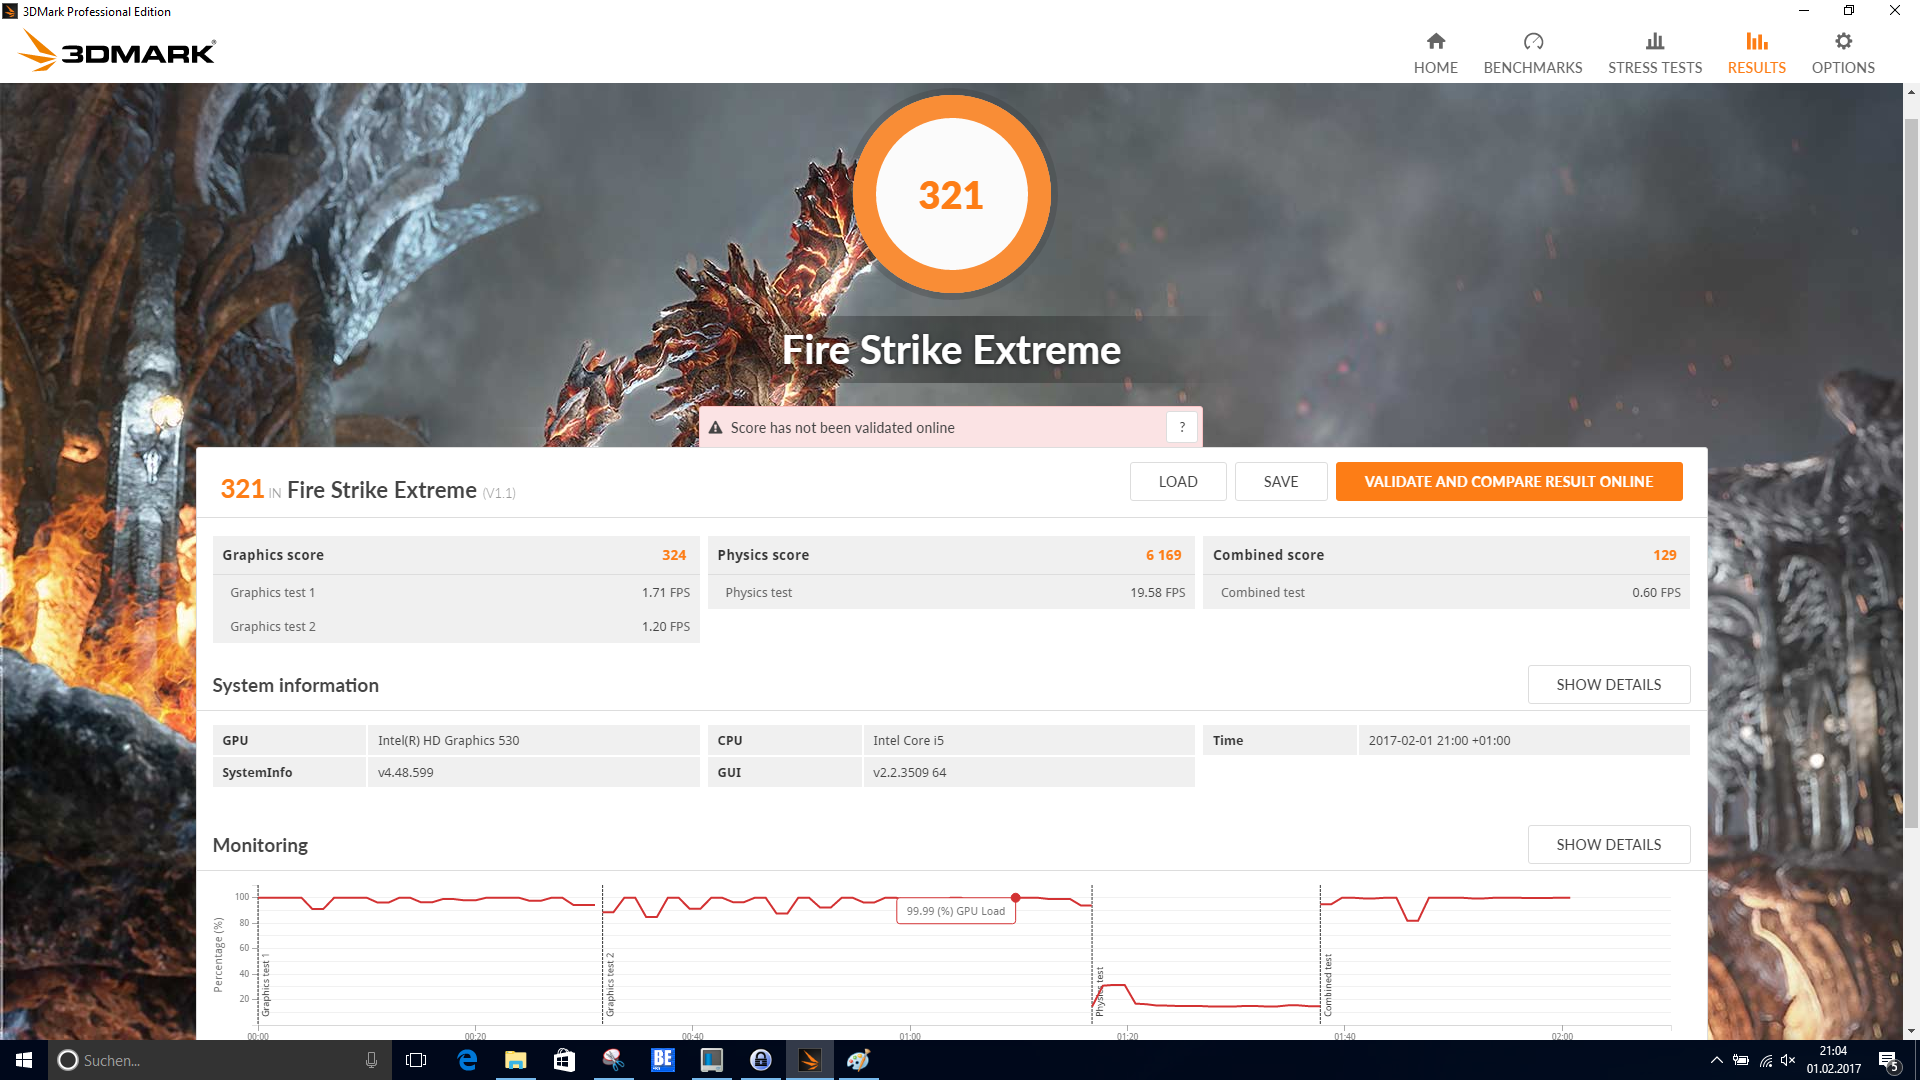
| 3DMark Fire Strike Extreme Score | 321 puntos | |
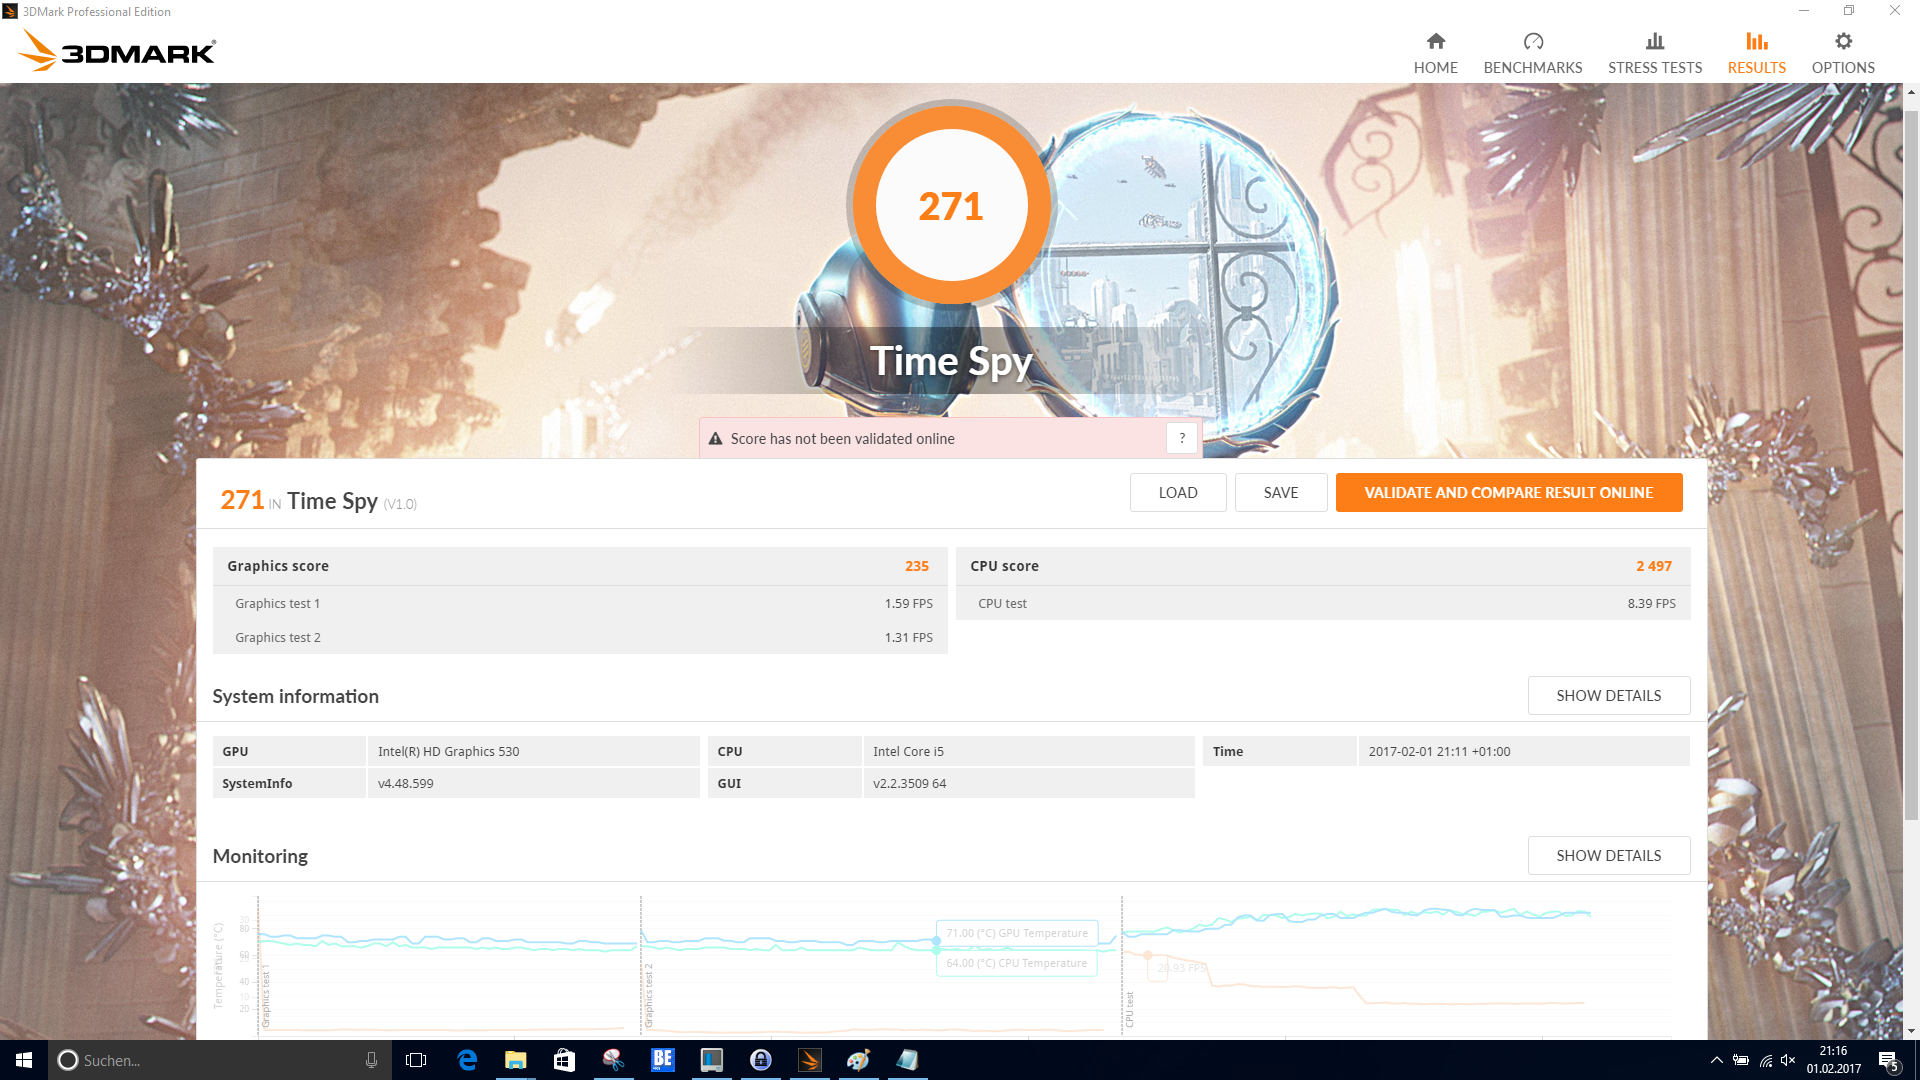
| 3DMark Time Spy Score | 271 puntos | |
ayuda | ||
| BioShock Infinite - 1366x768 Medium Preset | |
| HP ProBook 440 G4-Y8B51EA | |
| Acer TravelMate P648-M-757N | |
| Dell Latitude 14 E5470 | |
| Dell Latitude 14 E5470 | |
| Lenovo ThinkPad T460-20FN003LGE | |
| Battlefield 4 - 1366x768 Medium Preset | |
| HP ProBook 440 G4-Y8B51EA | |
| Dell Latitude 14 E5470 | |
| Acer TravelMate P648-M-757N | |
| Dell Latitude 14 E5470 | |
| Lenovo ThinkPad T460-20FN003LGE | |
| bajo | medio | alto | ultra | |
|---|---|---|---|---|
| BioShock Infinite (2013) | 45.6 | 23.7 | 19.5 | 5.5 |
| Battlefield 4 (2013) | 41.2 | 27.8 | 18.3 | 4.9 |
| Rise of the Tomb Raider (2016) | 15 |
Ruido
| Ocioso |
| 30.3 / 30.3 / 30.3 dB(A) |
| Carga |
| 31.6 / 35 dB(A) |
 | ||
30 dB silencioso 40 dB(A) audible 50 dB(A) ruidosamente alto |
||
min: | ||
| Dell Latitude 14 E5470 6440HQ, HD Graphics 530 | Dell Latitude 14 E5470 6300U, HD Graphics 520 | HP ProBook 440 G4-Y8B51EA i7-7500U, GeForce 930MX | Lenovo ThinkPad T460-20FN003LGE 6200U, HD Graphics 520 | Acer TravelMate P648-M-757N 6500U, HD Graphics 520 | |
|---|---|---|---|---|---|
| Noise | 2% | -2% | 0% | -2% | |
| apagado / medio ambiente * (dB) | 30.3 | 29.2 4% | 29 4% | 29 4% | 31.2 -3% |
| Idle Minimum * (dB) | 30.3 | 29.2 4% | 29 4% | 29 4% | 31.2 -3% |
| Idle Average * (dB) | 30.3 | 29.2 4% | 29 4% | 29 4% | 31.2 -3% |
| Idle Maximum * (dB) | 30.3 | 29.2 4% | 29 4% | 29 4% | 31.6 -4% |
| Load Average * (dB) | 31.6 | 32.1 -2% | 37.4 -18% | 34.2 -8% | 33.3 -5% |
| Load Maximum * (dB) | 35 | 36.8 -5% | 39 -11% | 37.8 -8% | 32.4 7% |
* ... más pequeño es mejor
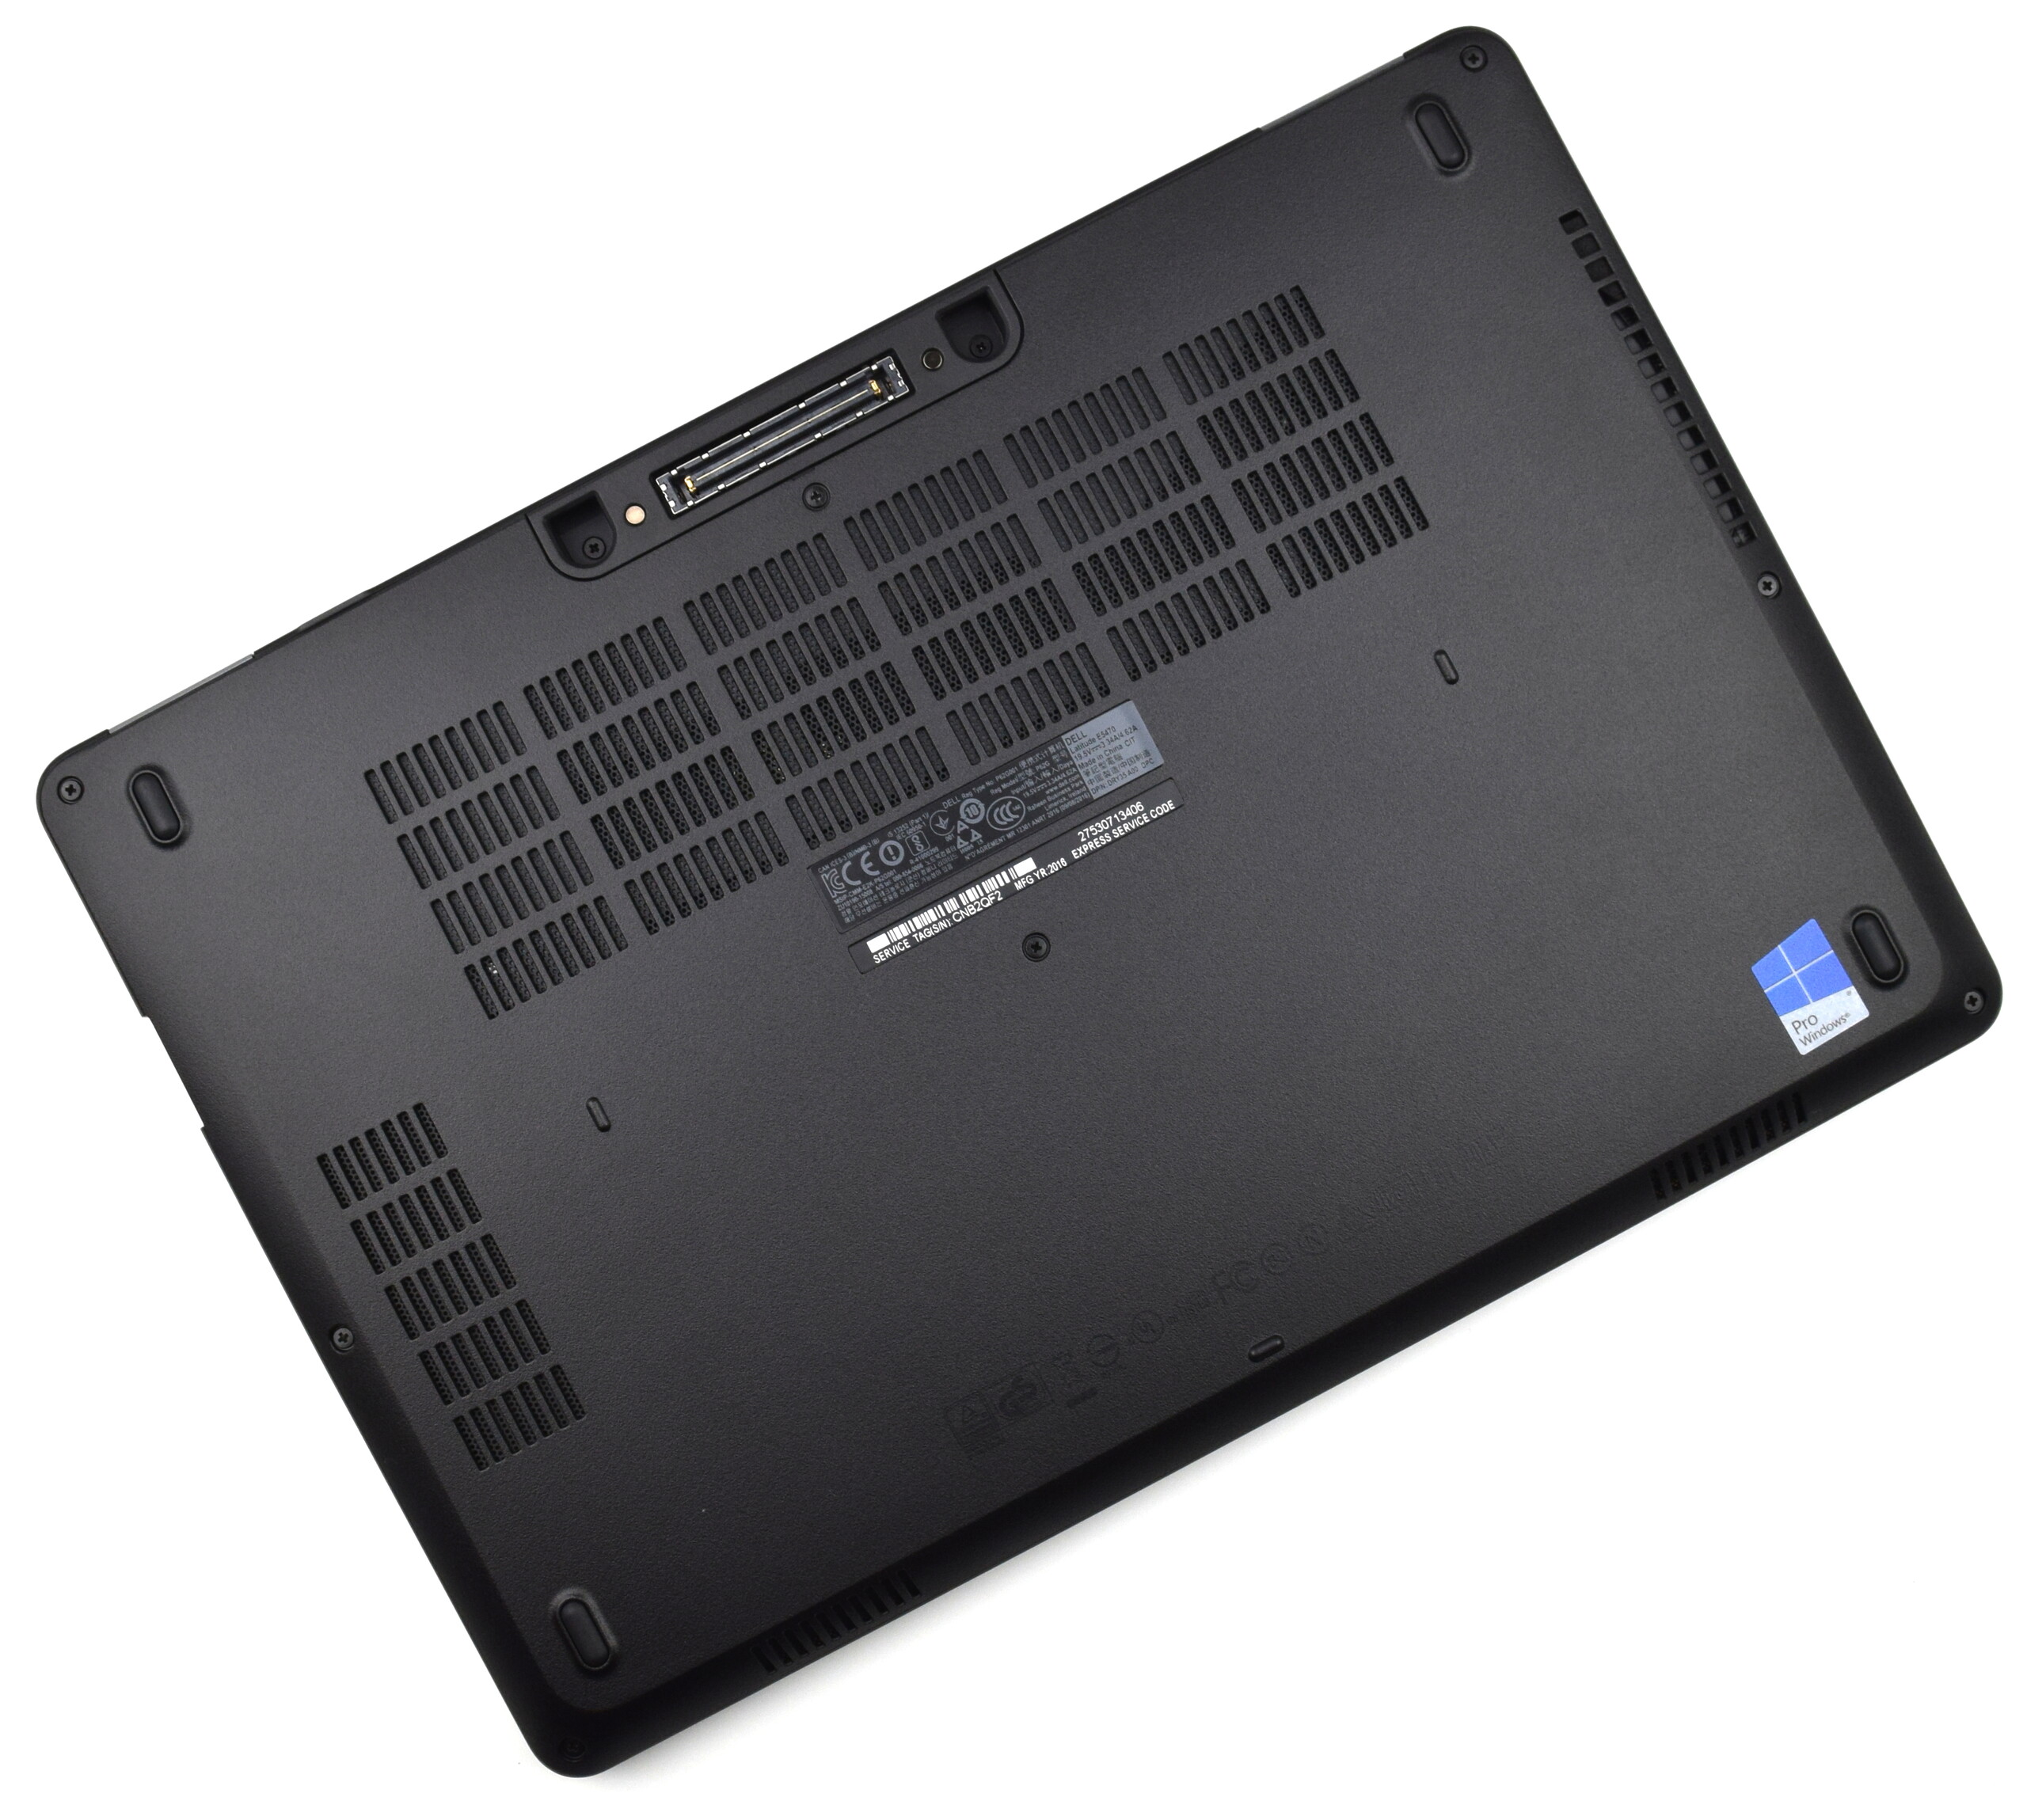
(±) La temperatura máxima en la parte superior es de 43 °C / 109 F, frente a la media de 34.3 °C / 94 F, que oscila entre 21.2 y 62.5 °C para la clase Office.
(±) El fondo se calienta hasta un máximo de 43 °C / 109 F, frente a la media de 36.8 °C / 98 F
(+) En reposo, la temperatura media de la parte superior es de 27.8 °C / 82# F, frente a la media del dispositivo de 29.5 °C / 85 F.
(+) El reposamanos y el panel táctil están a una temperatura inferior a la de la piel, con un máximo de 26.2 °C / 79.2 F y, por tanto, son fríos al tacto.
(±) La temperatura media de la zona del reposamanos de dispositivos similares fue de 27.6 °C / 81.7 F (+1.4 °C / 2.5 F).
| Dell Latitude 14 E5470 6440HQ, HD Graphics 530 | Dell Latitude 14 E5470 6300U, HD Graphics 520 | HP ProBook 440 G4-Y8B51EA i7-7500U, GeForce 930MX | Lenovo ThinkPad T460-20FN003LGE 6200U, HD Graphics 520 | Acer TravelMate P648-M-757N 6500U, HD Graphics 520 | |
|---|---|---|---|---|---|
| Heat | 7% | 8% | 5% | 7% | |
| Maximum Upper Side * (°C) | 43 | 41.5 3% | 41.5 3% | 37.3 13% | 38.5 10% |
| Maximum Bottom * (°C) | 43 | 41.4 4% | 38.1 11% | 44.3 -3% | 36.7 15% |
| Idle Upper Side * (°C) | 31.2 | 26.9 14% | 28.4 9% | 29 7% | 31.5 -1% |
| Idle Bottom * (°C) | 31.3 | 29.6 5% | 28.3 10% | 30.1 4% | 29.6 5% |
* ... más pequeño es mejor
Dell Latitude 14 E5470 análisis de audio
(±) | la sonoridad del altavoz es media pero buena (73 dB)
Graves 100 - 315 Hz
(-) | casi sin bajos - de media 16.2% inferior a la mediana
(+) | el bajo es lineal (4.3% delta a la frecuencia anterior)
Medios 400 - 2000 Hz
(±) | medias más altas - de media 5.3% más altas que la mediana
(+) | los medios son lineales (5.2% delta a la frecuencia anterior)
Altos 2 - 16 kHz
(±) | máximos más altos - de media 6.8% más altos que la mediana
(+) | los máximos son lineales (2.9% delta a la frecuencia anterior)
Total 100 - 16.000 Hz
(±) | la linealidad del sonido global es media (19.7% de diferencia con la mediana)
En comparación con la misma clase
» 41% de todos los dispositivos probados de esta clase eran mejores, 7% similares, 51% peores
» El mejor tuvo un delta de 7%, la media fue 21%, el peor fue ###max##%
En comparación con todos los dispositivos probados
» 50% de todos los dispositivos probados eran mejores, 7% similares, 43% peores
» El mejor tuvo un delta de 4%, la media fue 23%, el peor fue ###max##%
Apple MacBook 12 (Early 2016) 1.1 GHz análisis de audio
(+) | los altavoces pueden reproducir a un volumen relativamente alto (#83.6 dB)
Graves 100 - 315 Hz
(±) | lubina reducida - en promedio 11.3% inferior a la mediana
(±) | la linealidad de los graves es media (14.2% delta a frecuencia anterior)
Medios 400 - 2000 Hz
(+) | medios equilibrados - a sólo 2.4% de la mediana
(+) | los medios son lineales (5.5% delta a la frecuencia anterior)
Altos 2 - 16 kHz
(+) | máximos equilibrados - a sólo 2% de la mediana
(+) | los máximos son lineales (4.5% delta a la frecuencia anterior)
Total 100 - 16.000 Hz
(+) | el sonido global es lineal (10.2% de diferencia con la mediana)
En comparación con la misma clase
» 7% de todos los dispositivos probados de esta clase eran mejores, 2% similares, 90% peores
» El mejor tuvo un delta de 5%, la media fue 18%, el peor fue ###max##%
En comparación con todos los dispositivos probados
» 5% de todos los dispositivos probados eran mejores, 1% similares, 94% peores
» El mejor tuvo un delta de 4%, la media fue 23%, el peor fue ###max##%
| Off / Standby | |
| Ocioso | |
| Carga |
|
Clave:
min: | |
| Dell Latitude 14 E5470 6440HQ, HD Graphics 530, Micron SSD 1100 (MTFDDAV256TBN) | Dell Latitude 14 E5470 6300U, HD Graphics 520, Liteon L8H-256V2G | HP ProBook 440 G4-Y8B51EA i7-7500U, GeForce 930MX, SanDisk SD8SNAT256G1002 | Lenovo ThinkPad T460-20FN003LGE 6200U, HD Graphics 520, Toshiba HG6 THNSFJ256GCSU | Acer TravelMate P648-M-757N 6500U, HD Graphics 520, Lite-On CV1-8B256 | |
|---|---|---|---|---|---|
| Power Consumption | 29% | 14% | 23% | -0% | |
| Idle Minimum * (Watt) | 4.1 | 3.5 15% | 3 27% | 3.5 15% | 5.3 -29% |
| Idle Average * (Watt) | 8.1 | 5.3 35% | 5.4 33% | 6.7 17% | 9.3 -15% |
| Idle Maximum * (Watt) | 11.4 | 6 47% | 6.3 45% | 7.3 36% | 11.5 -1% |
| Load Average * (Watt) | 33.5 | 26.3 21% | 37.5 -12% | 28.2 16% | 30.8 8% |
| Load Maximum * (Watt) | 49 | 36.6 25% | 61.1 -25% | 34.6 29% | 32 35% |
* ... más pequeño es mejor

| Dell Latitude 14 E5470 6440HQ, HD Graphics 530, 62 Wh | Dell Latitude 14 E5470 6300U, HD Graphics 520, 62 Wh | HP ProBook 440 G4-Y8B51EA i7-7500U, GeForce 930MX, 48 Wh | Lenovo ThinkPad T460-20FN003LGE 6200U, HD Graphics 520, 46 Wh | Acer TravelMate P648-M-757N 6500U, HD Graphics 520, 54 Wh | |
|---|---|---|---|---|---|
| Duración de Batería | 65% | 33% | 5% | 27% | |
| Reader / Idle (h) | 15.2 | 21.7 43% | 18.1 19% | 15.9 5% | 18.1 19% |
| H.264 (h) | 6.9 | 10.8 57% | 9.5 38% | 8.5 23% | 9.1 32% |
| WiFi v1.3 (h) | 7.2 | 11.1 54% | 6.9 -4% | 5.6 -22% | 9.1 26% |
| Load (h) | 1.4 | 2.9 107% | 2.5 79% | 1.6 14% | 1.8 29% |
Pro
Contra
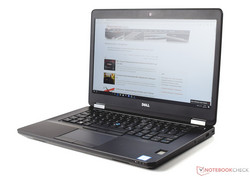
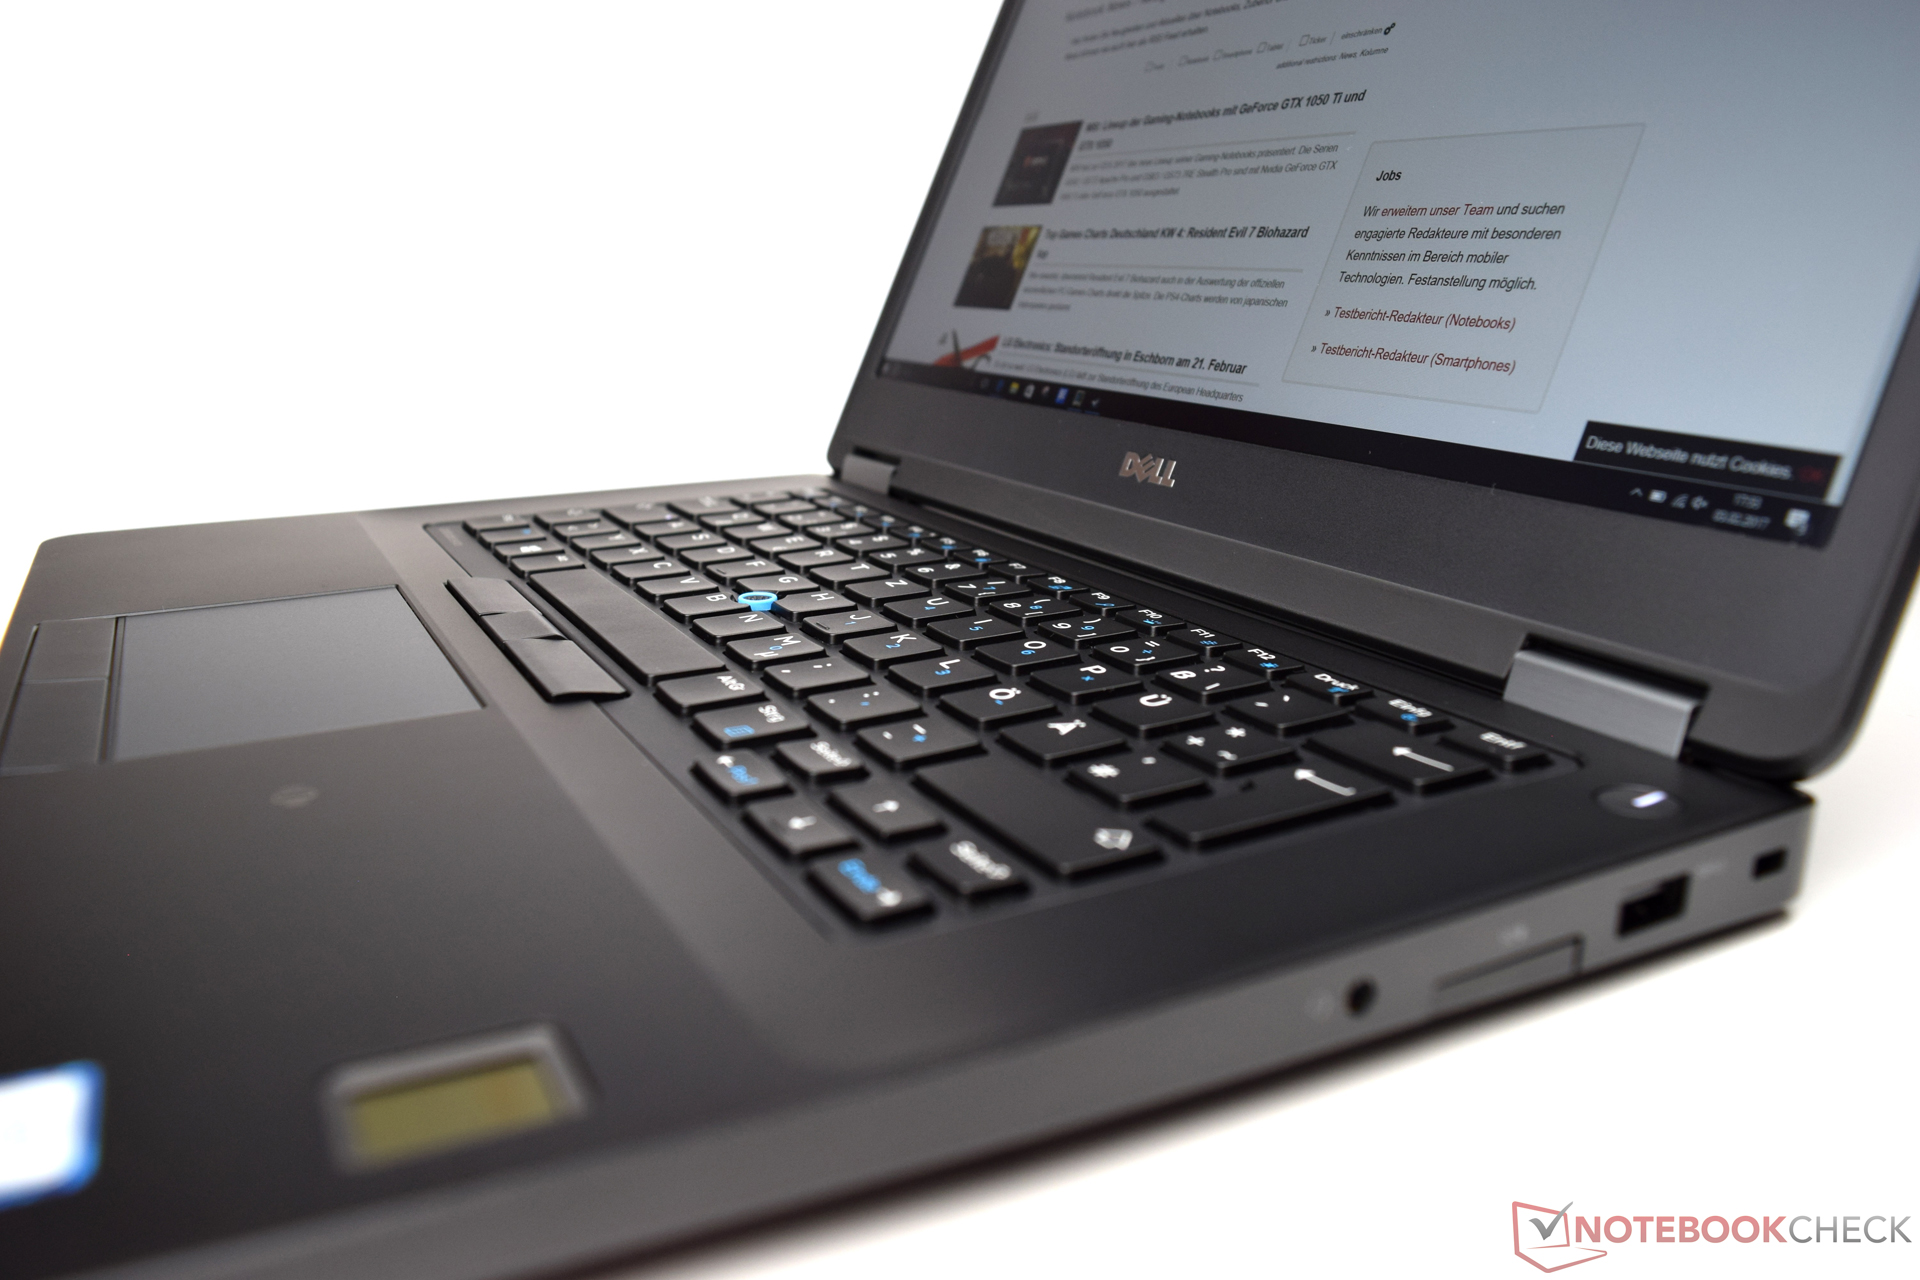
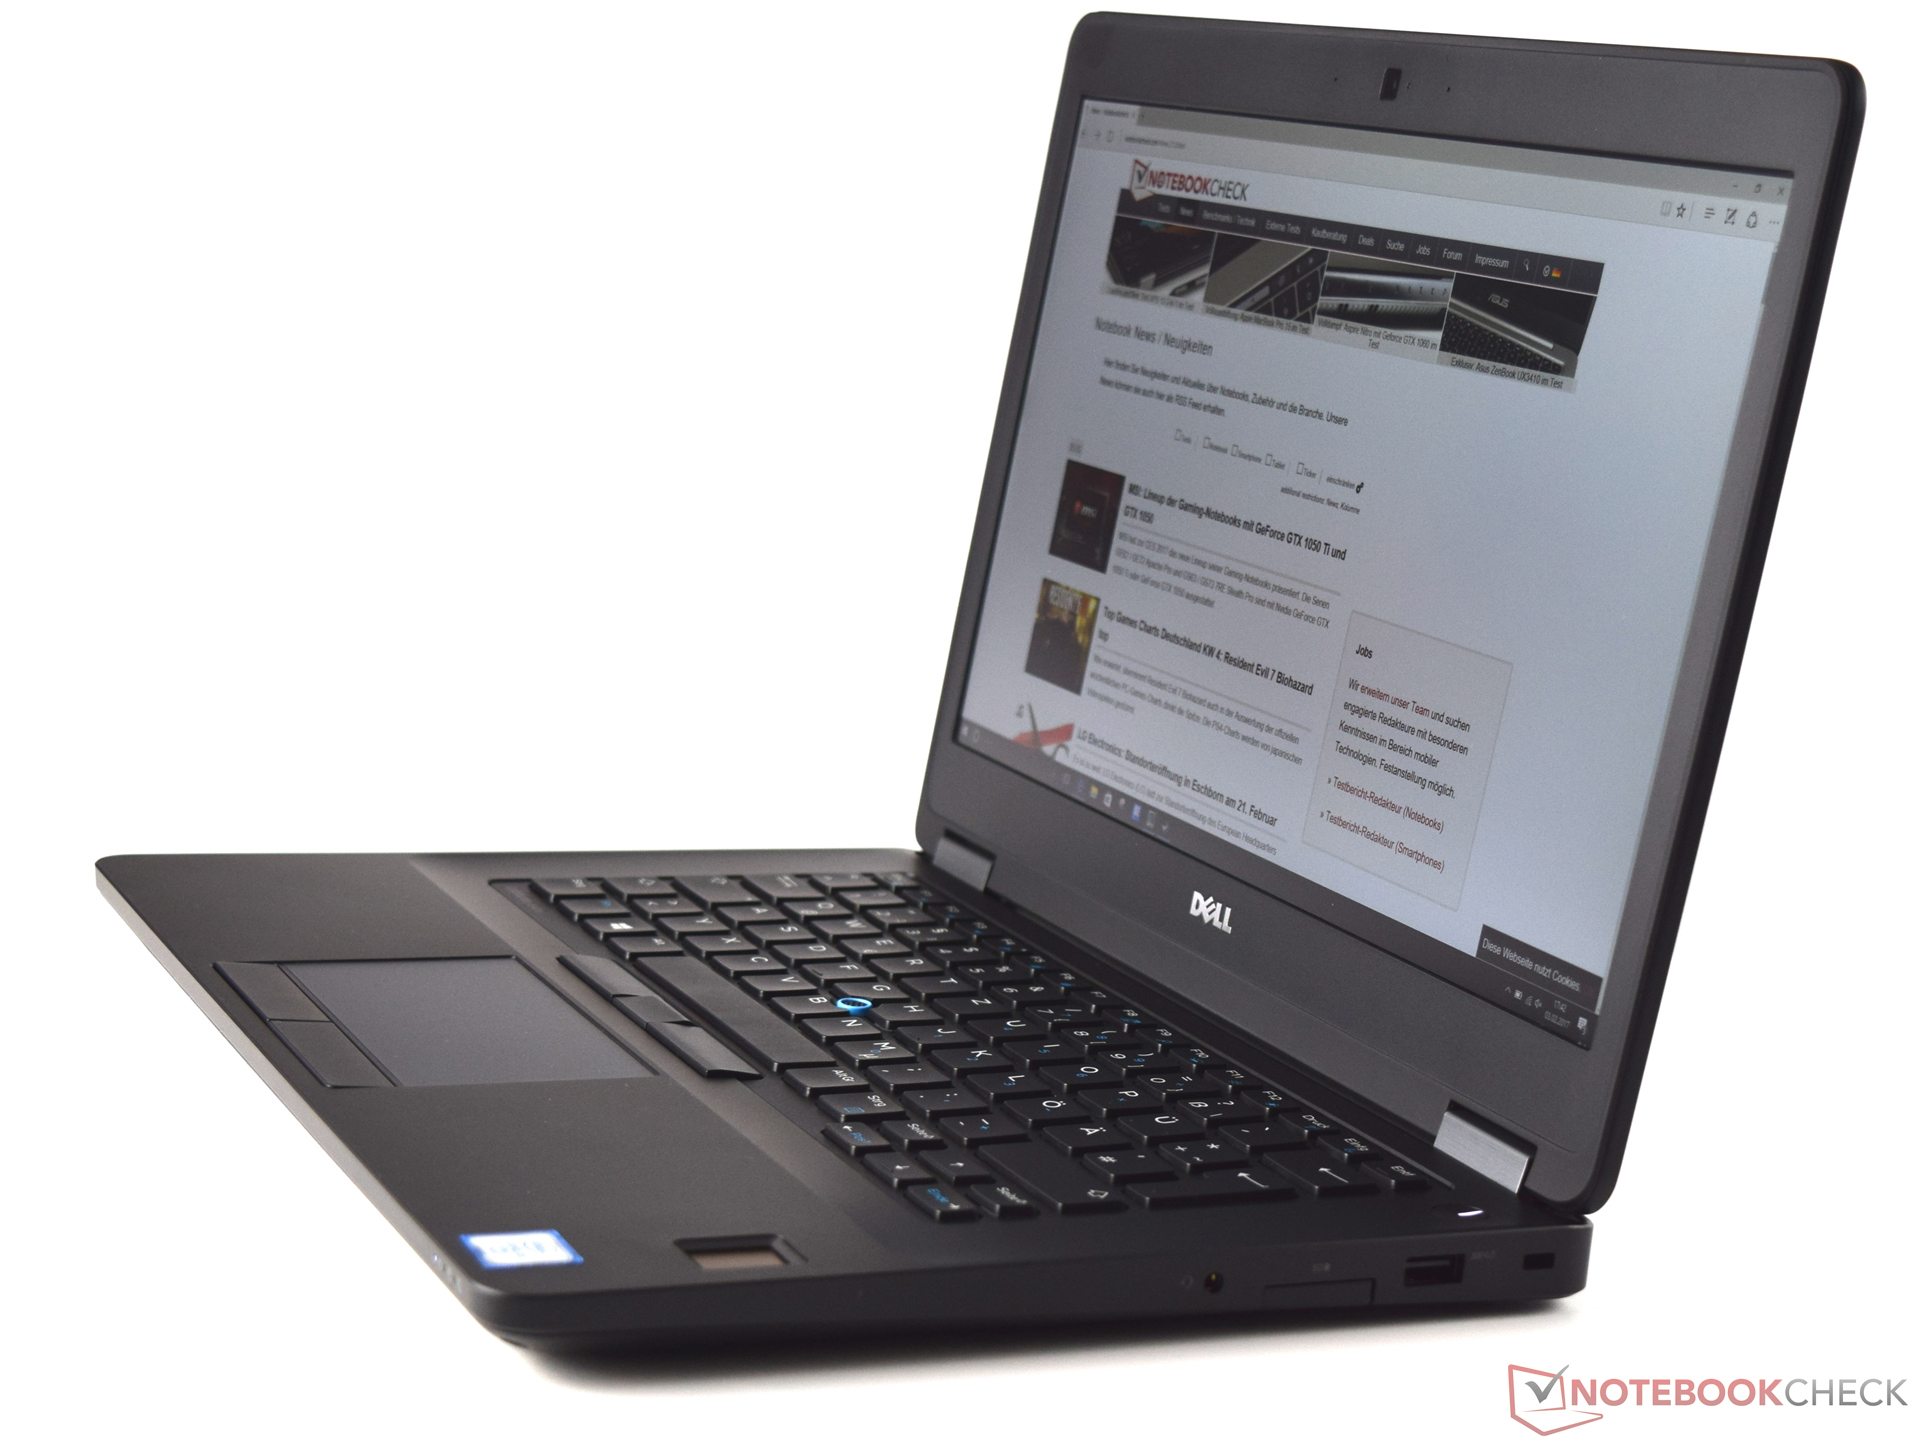
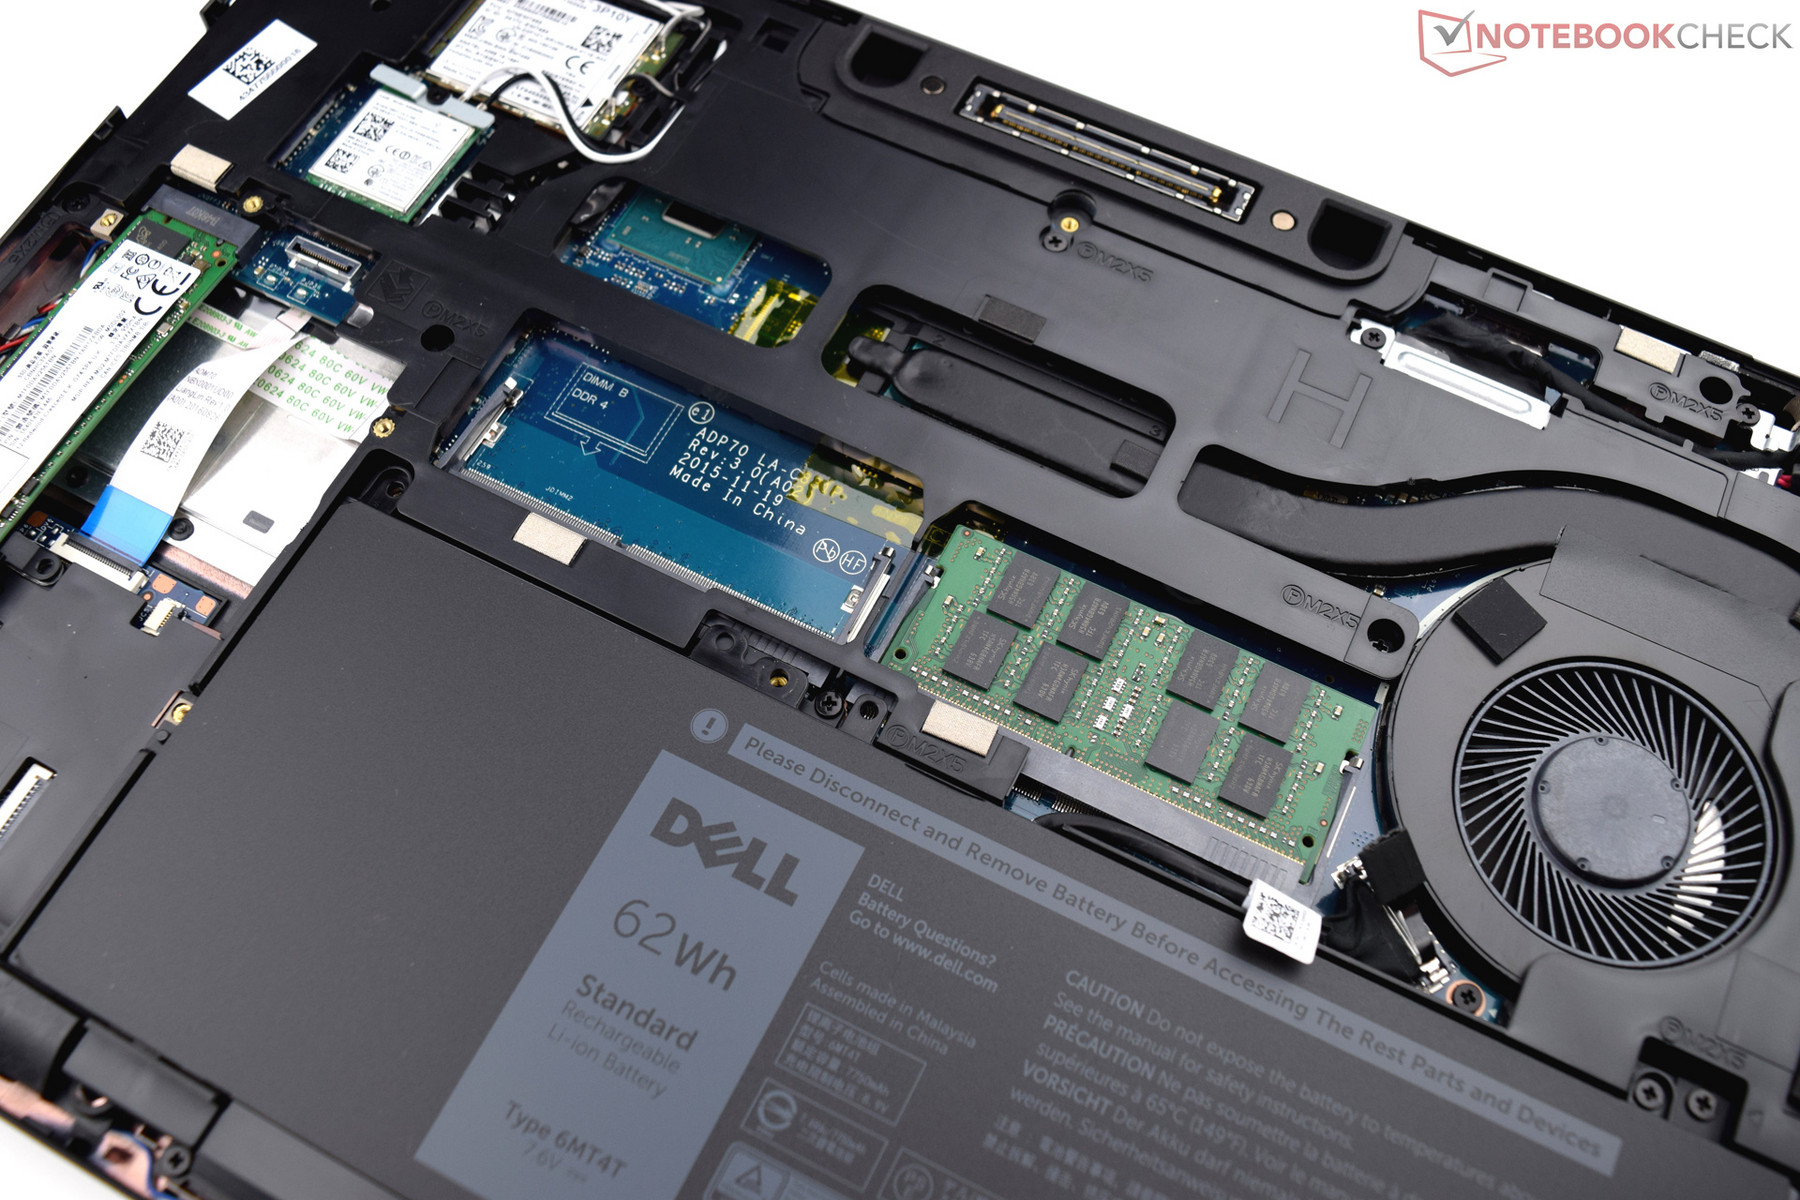
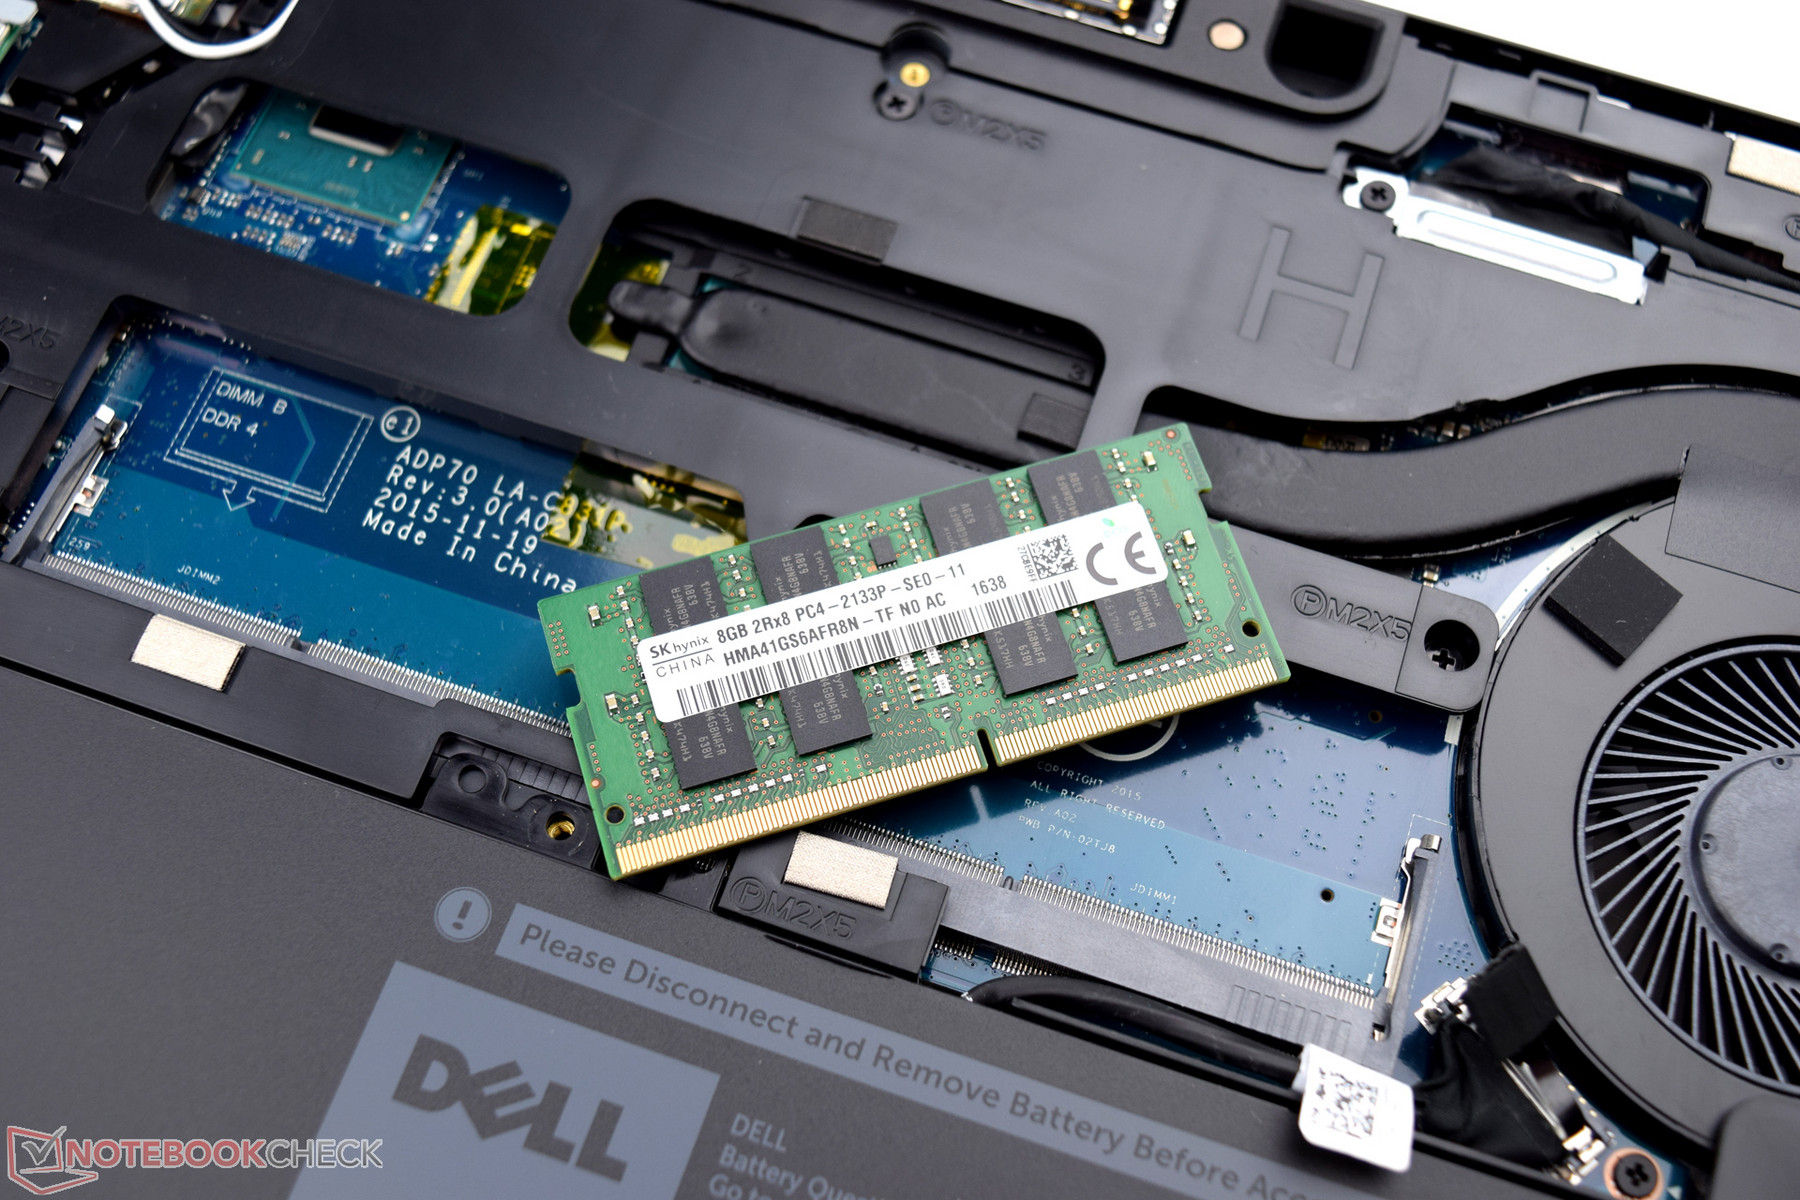
Dell presenta un portátil business de construcción soberbia y decente potencia de cálculo. Aunque el procesador Skylake sigue dentro del Dell Latitude 14 E5470, los nuevos procesadores Kaby Lake a veces quedan derrotados. Cuatro núcleos físicos son sencillamente más eficientes cuando las apliciaciones son capaces de Multithreading. La combinación de potente procesador, 8 GB de RAM, y 256 GB SSD aseguran un sistema rápido.
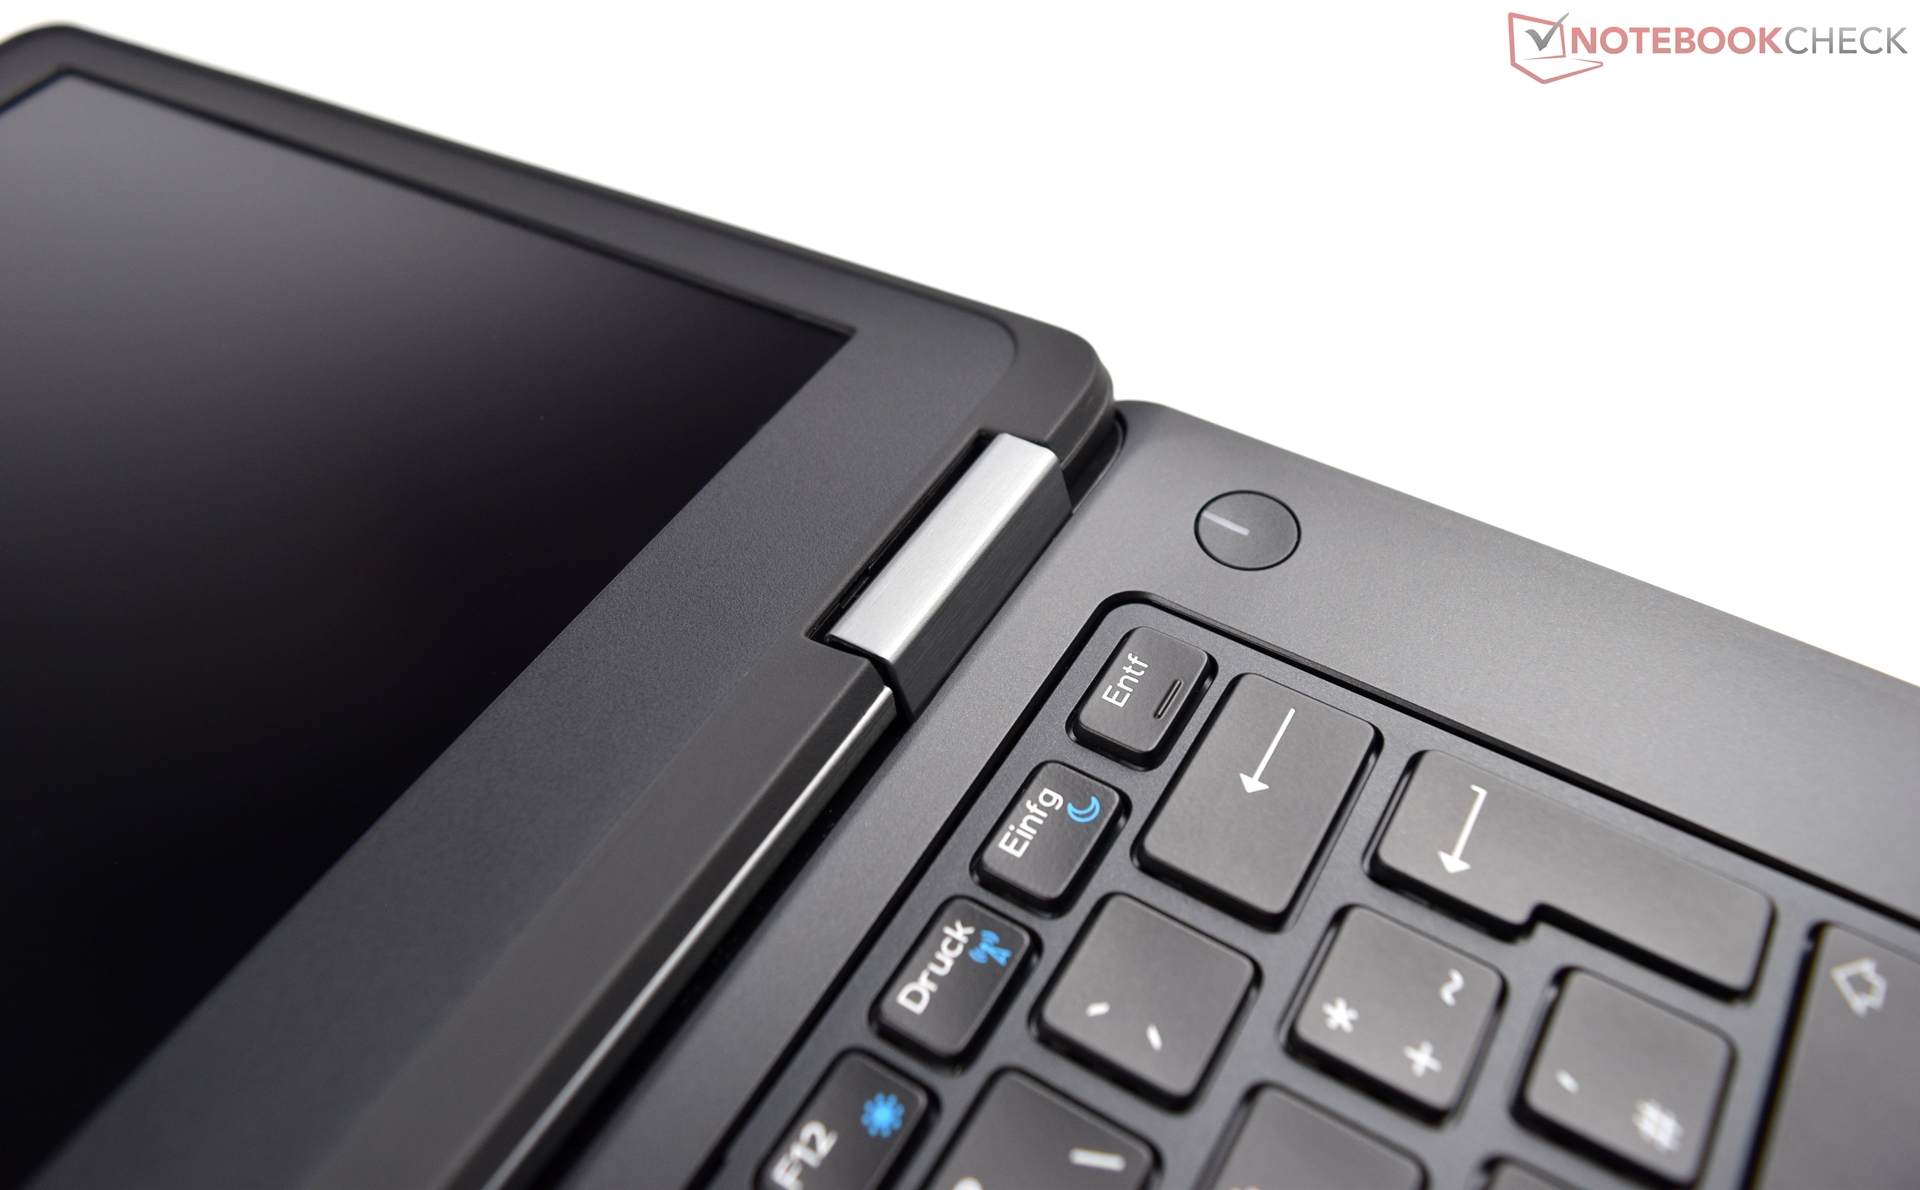
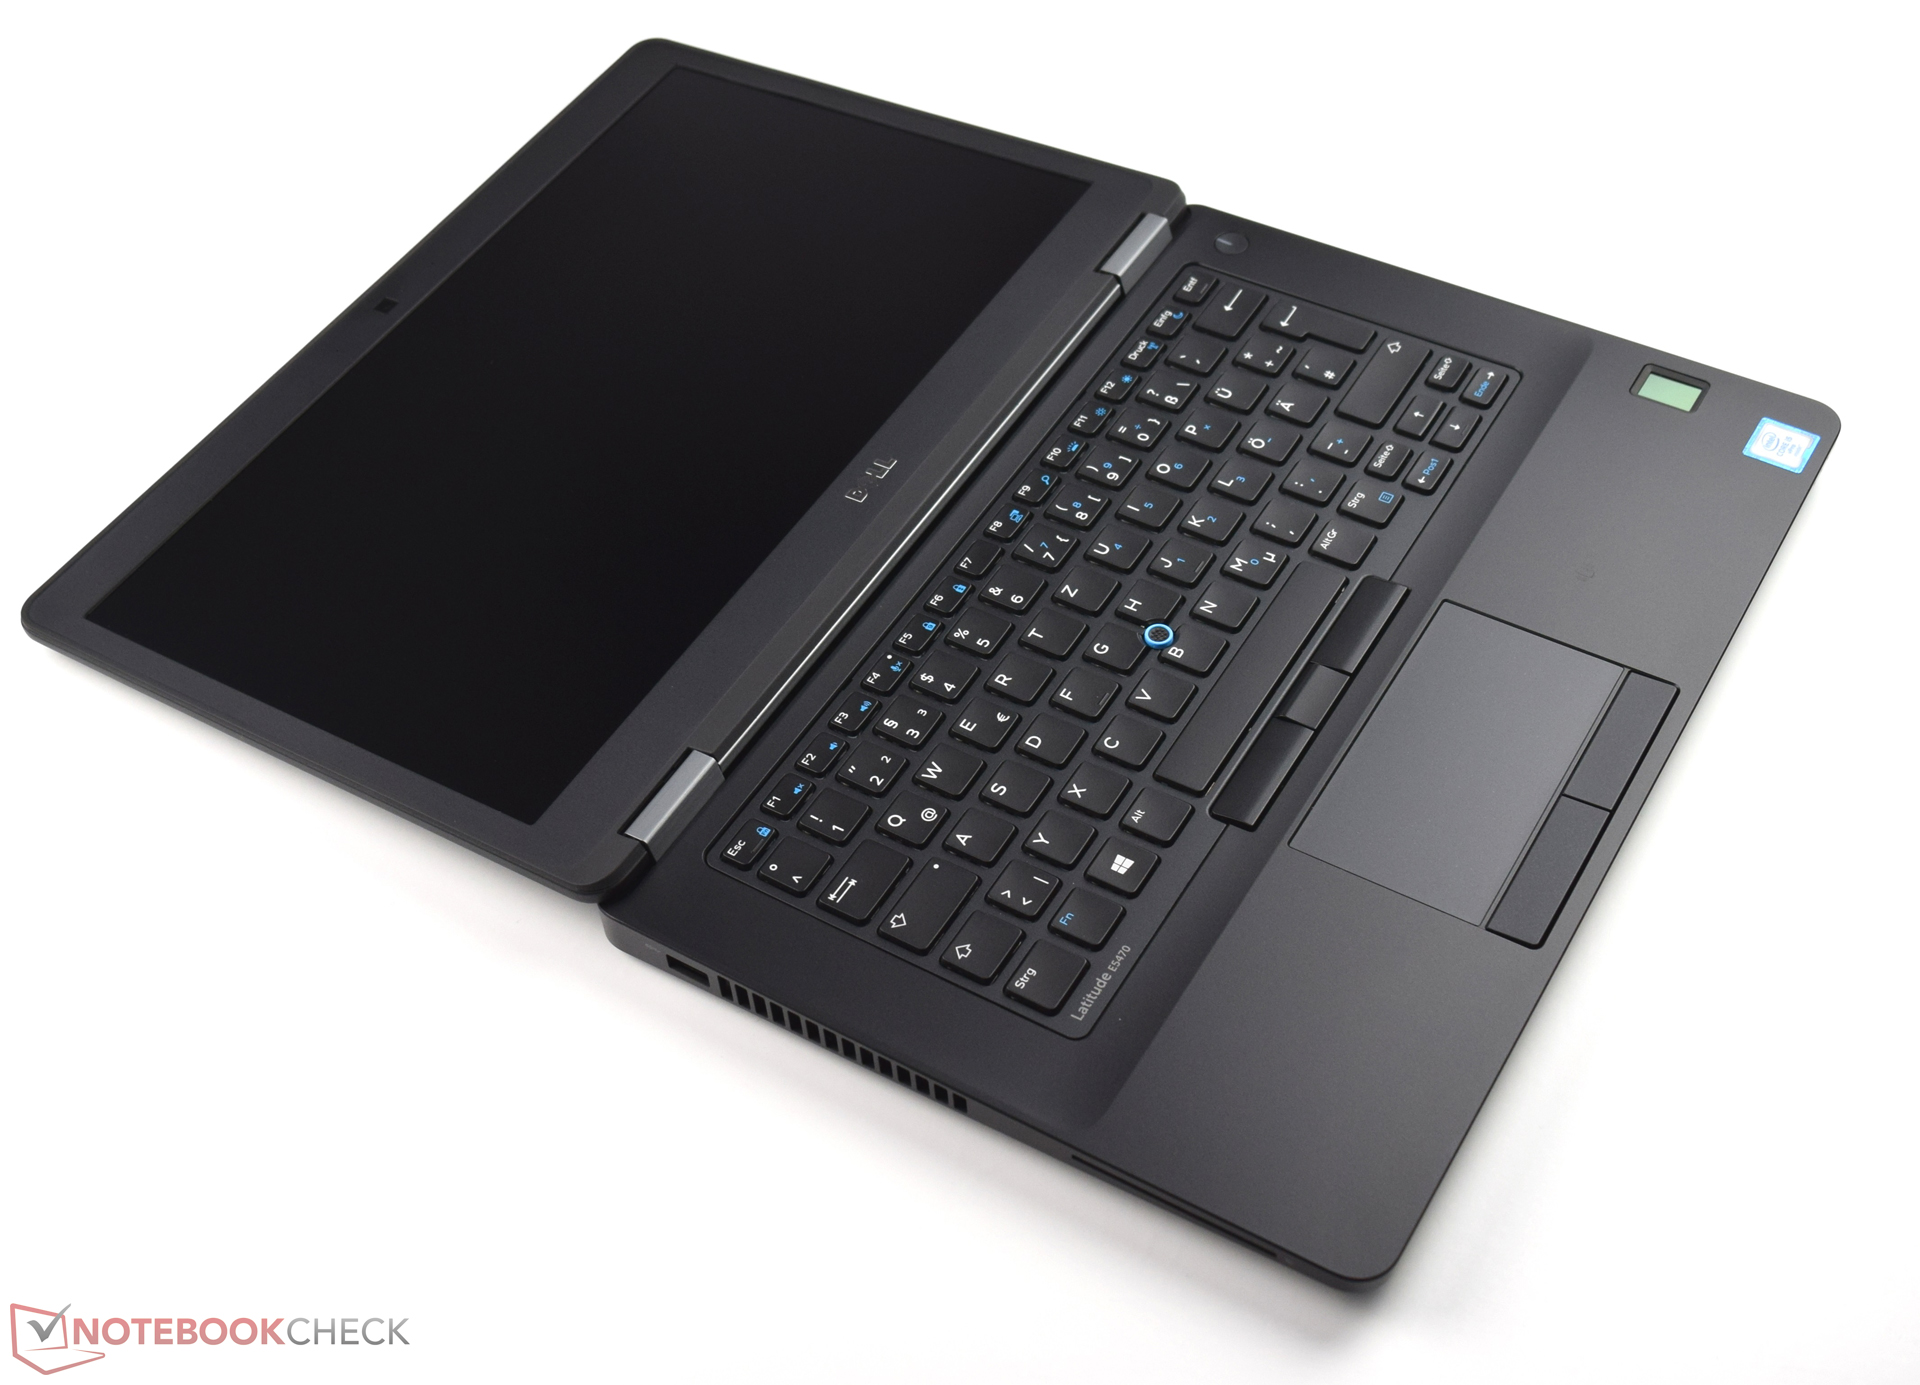
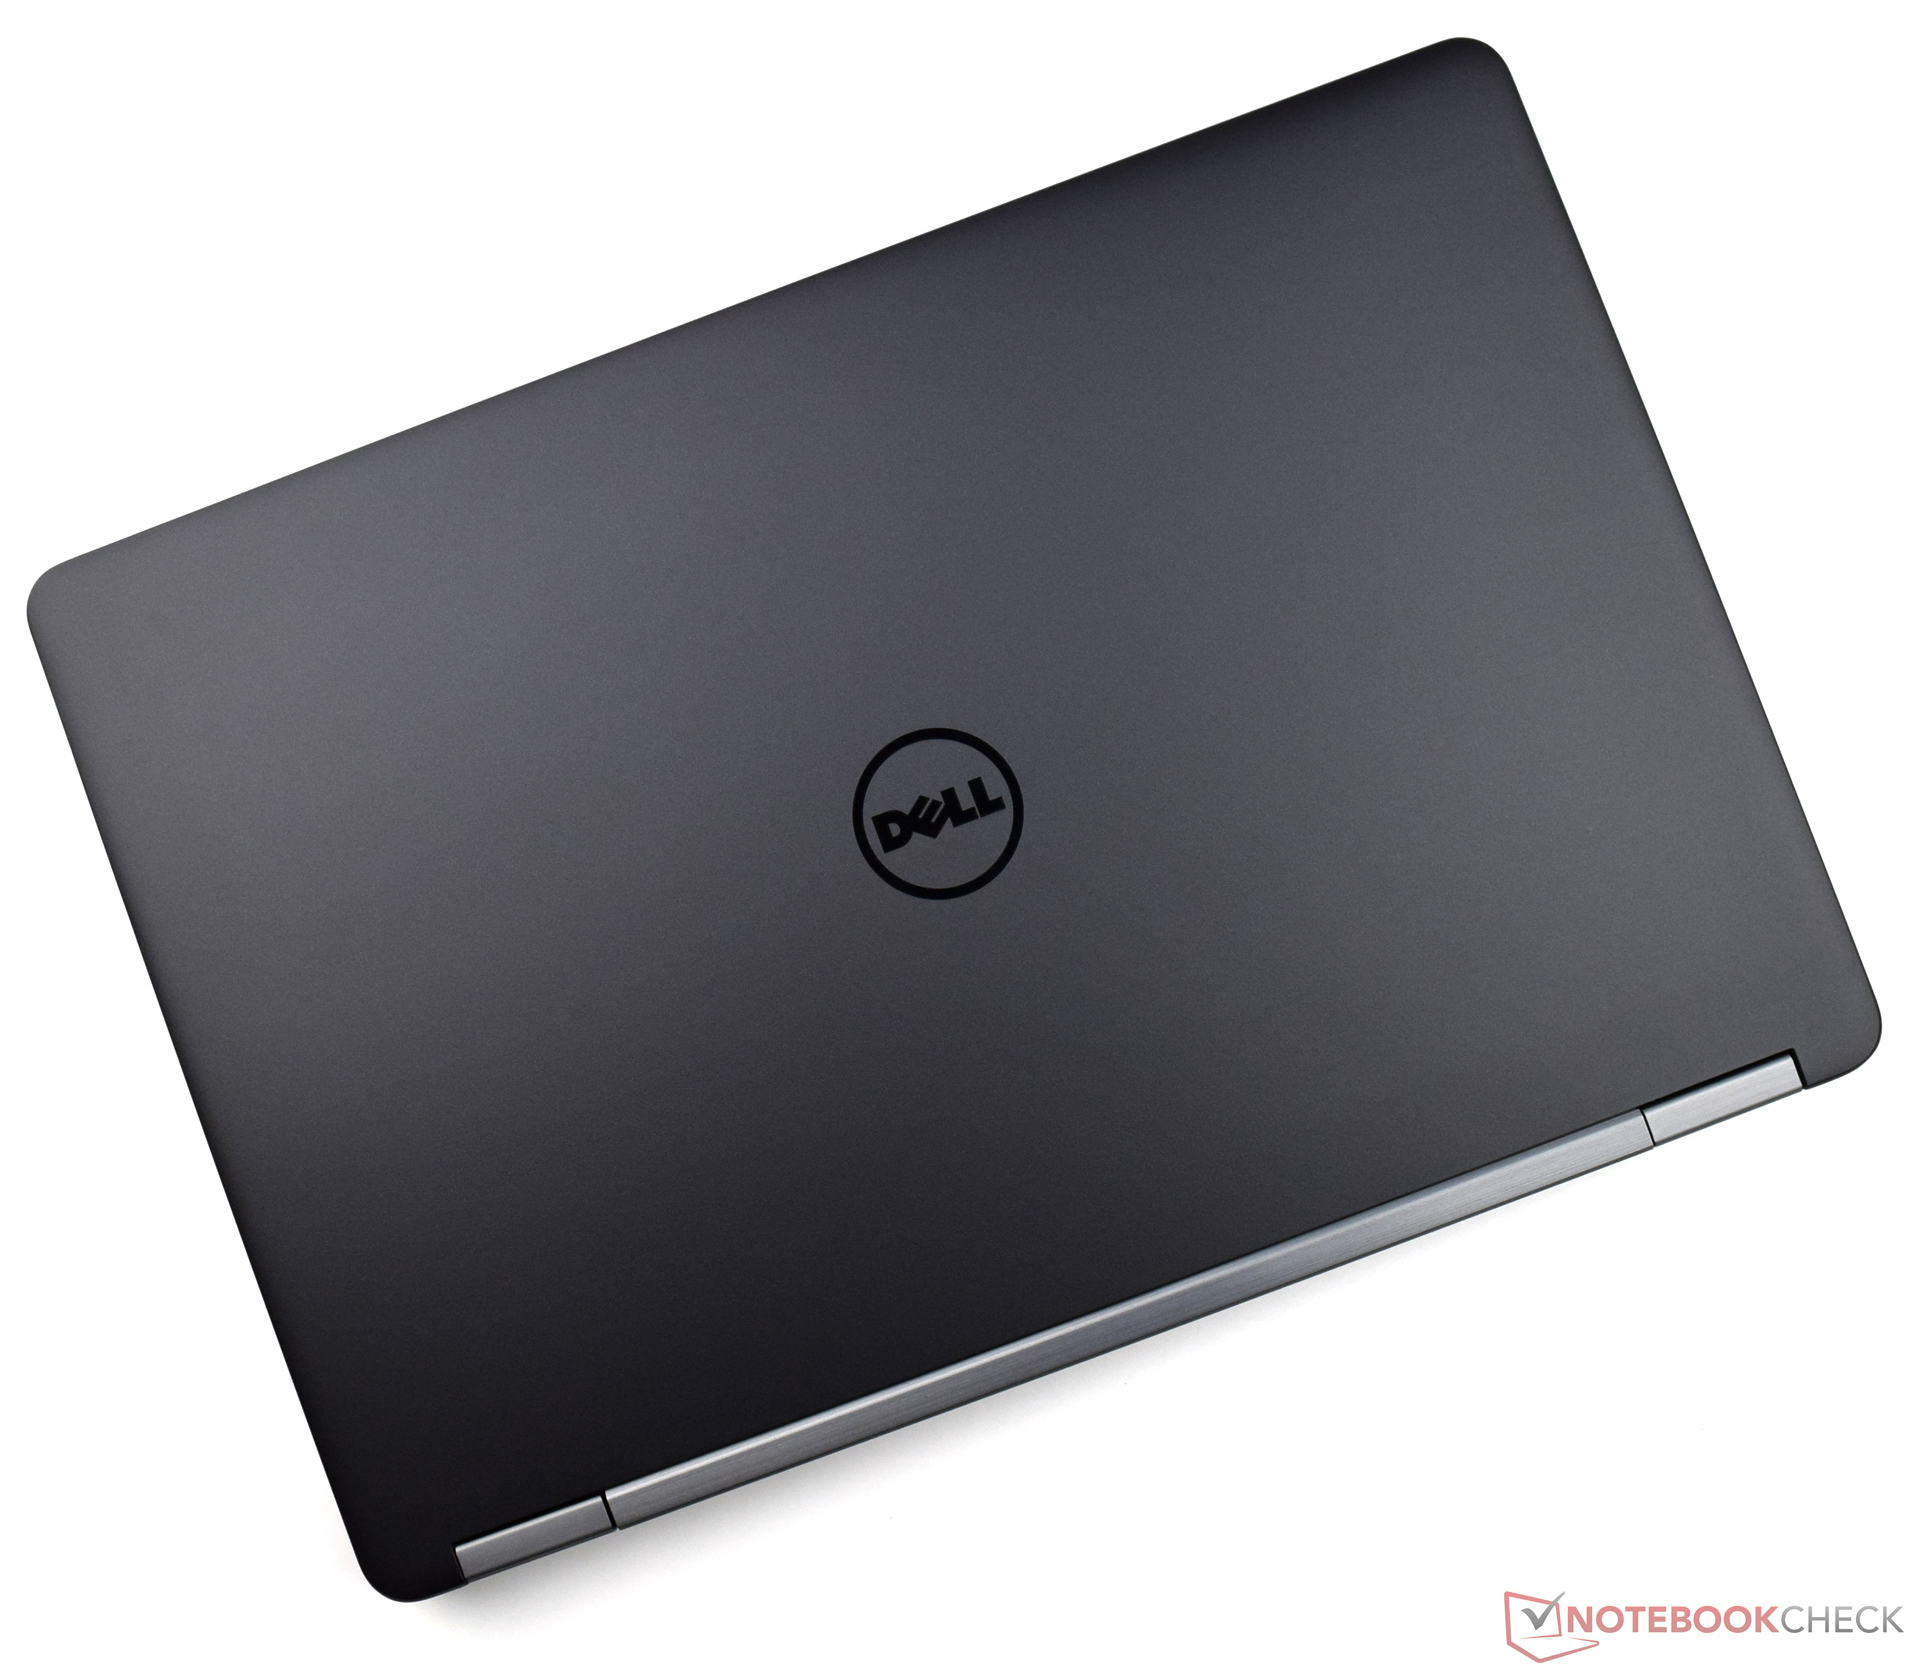
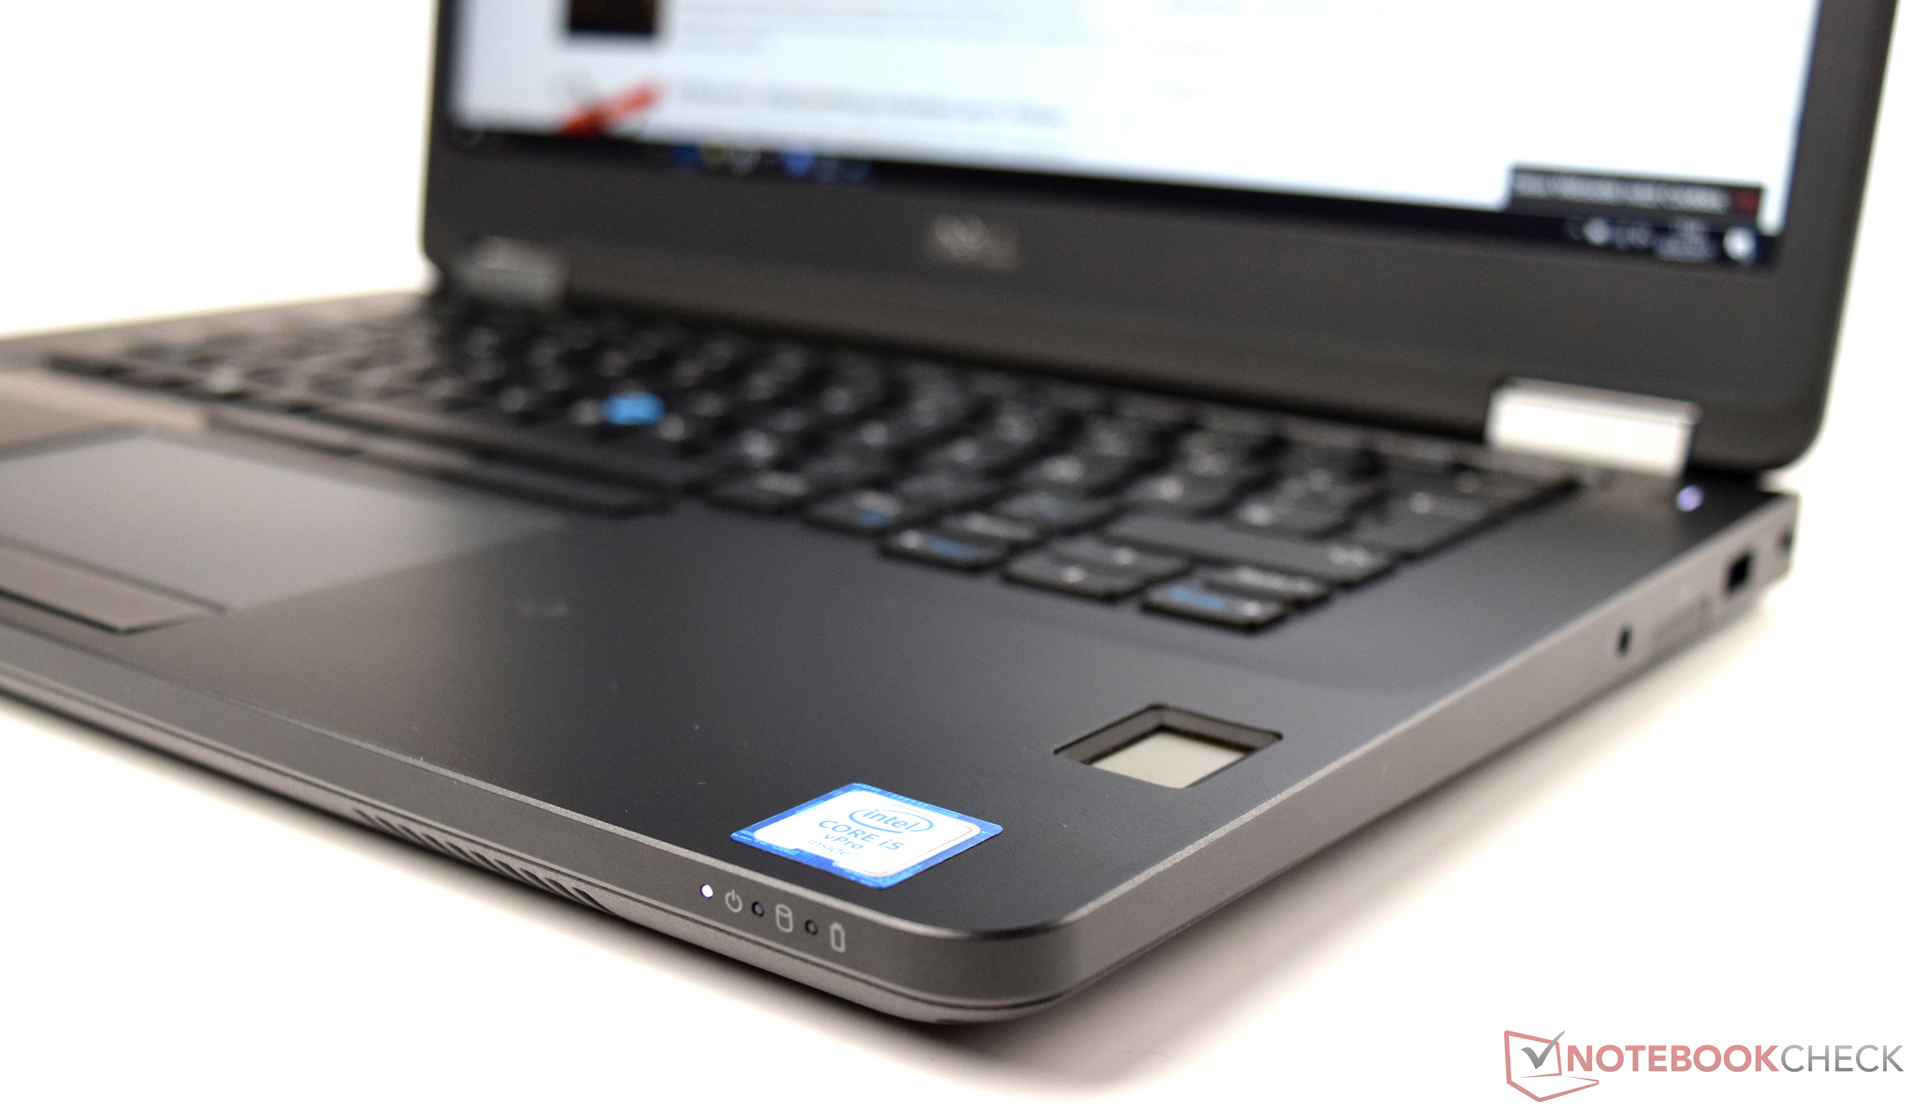
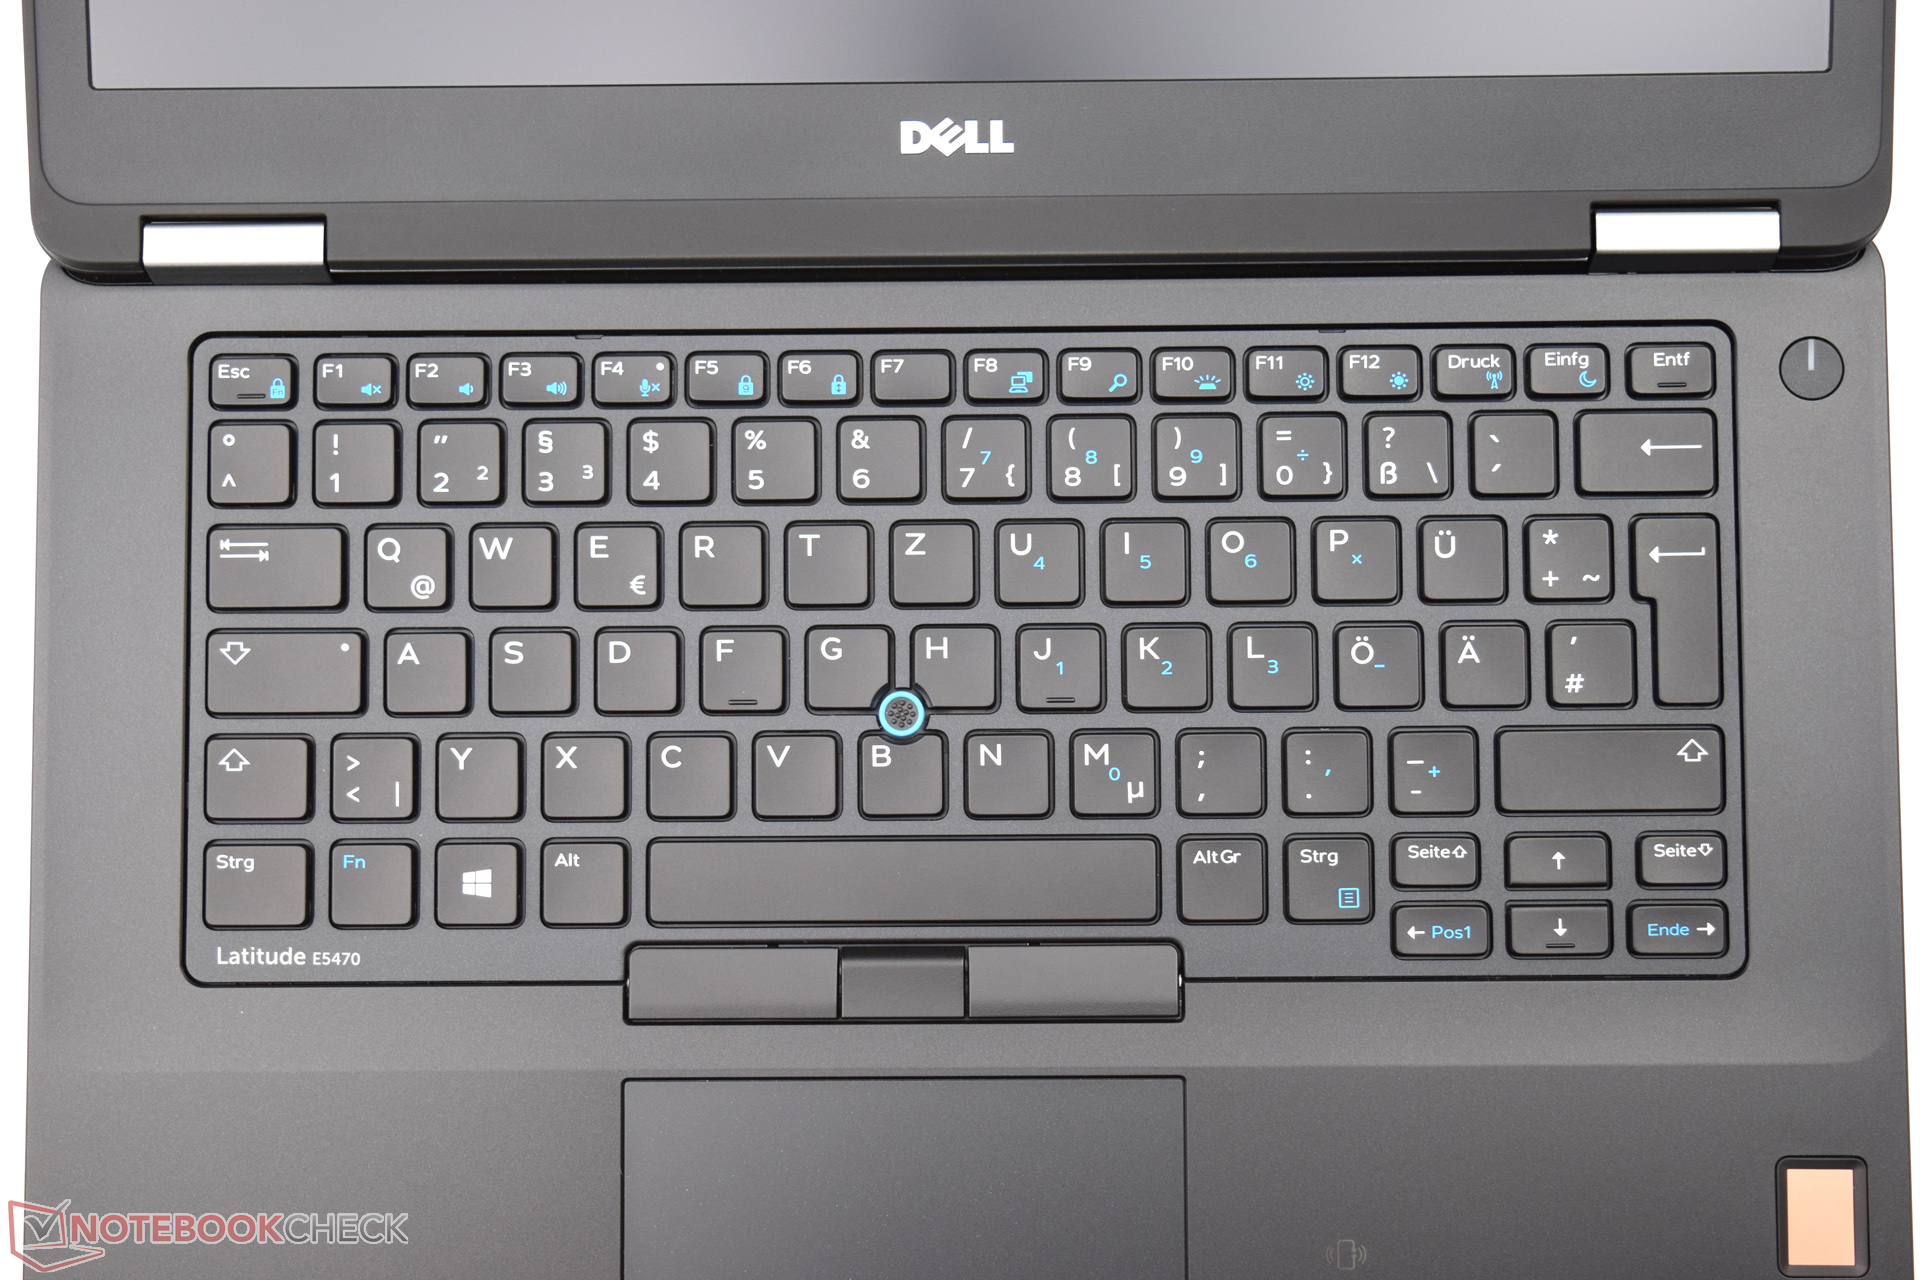
El Dell Latitude 14 E5470 nos convenció con su buen rendimiento de sistema. Los dispositivos de entrada, la sólida y estilosa carcasa, y la construcción de primera están hechos todos para dar una larga vida de servicio. Varias características de seguridad y los útiles accesorios pueden facilitar la rutina futura de la oficina.
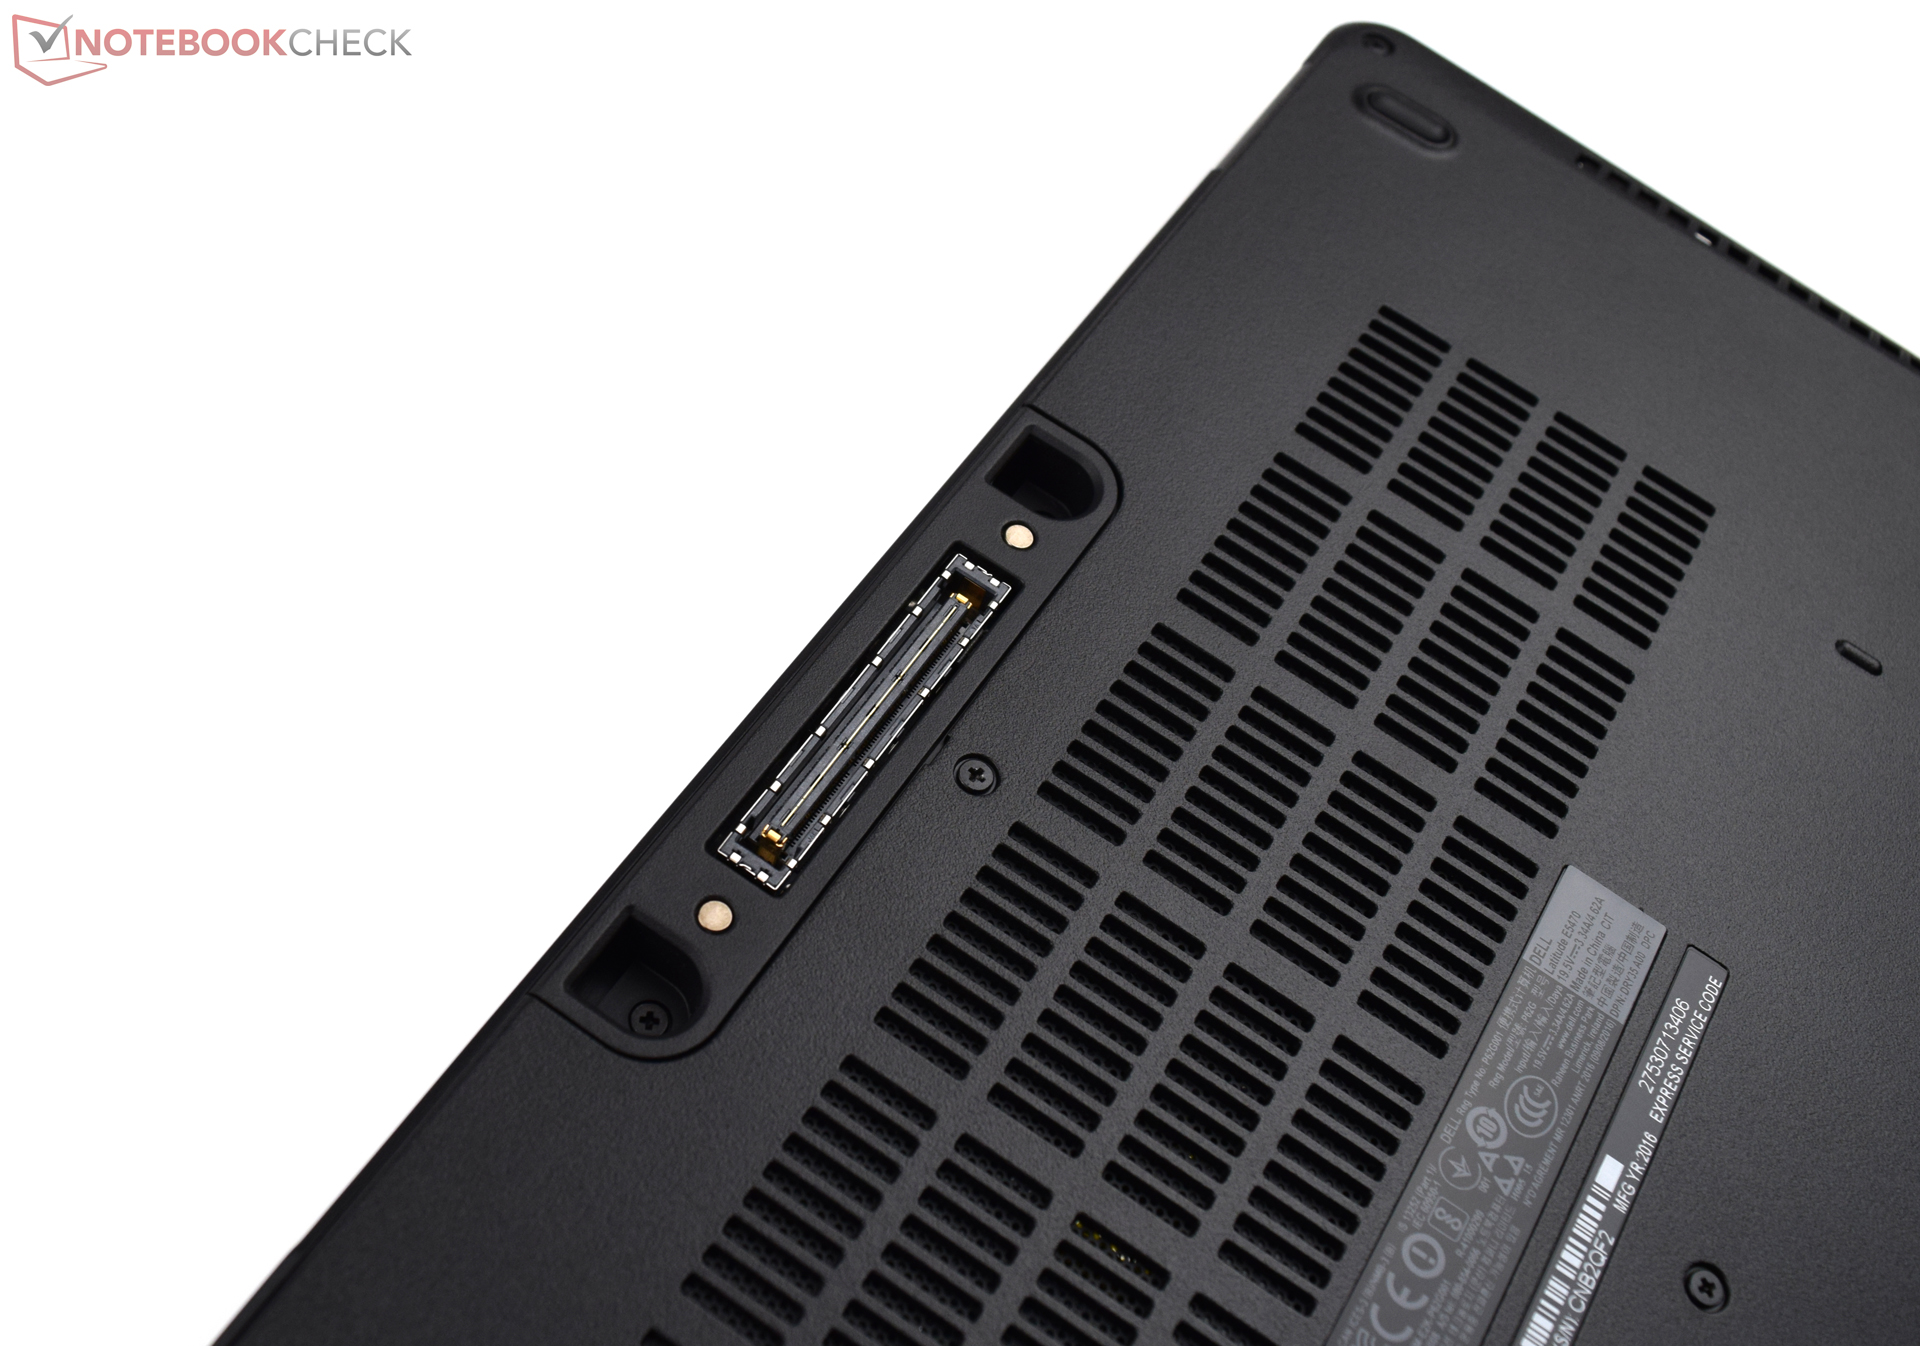
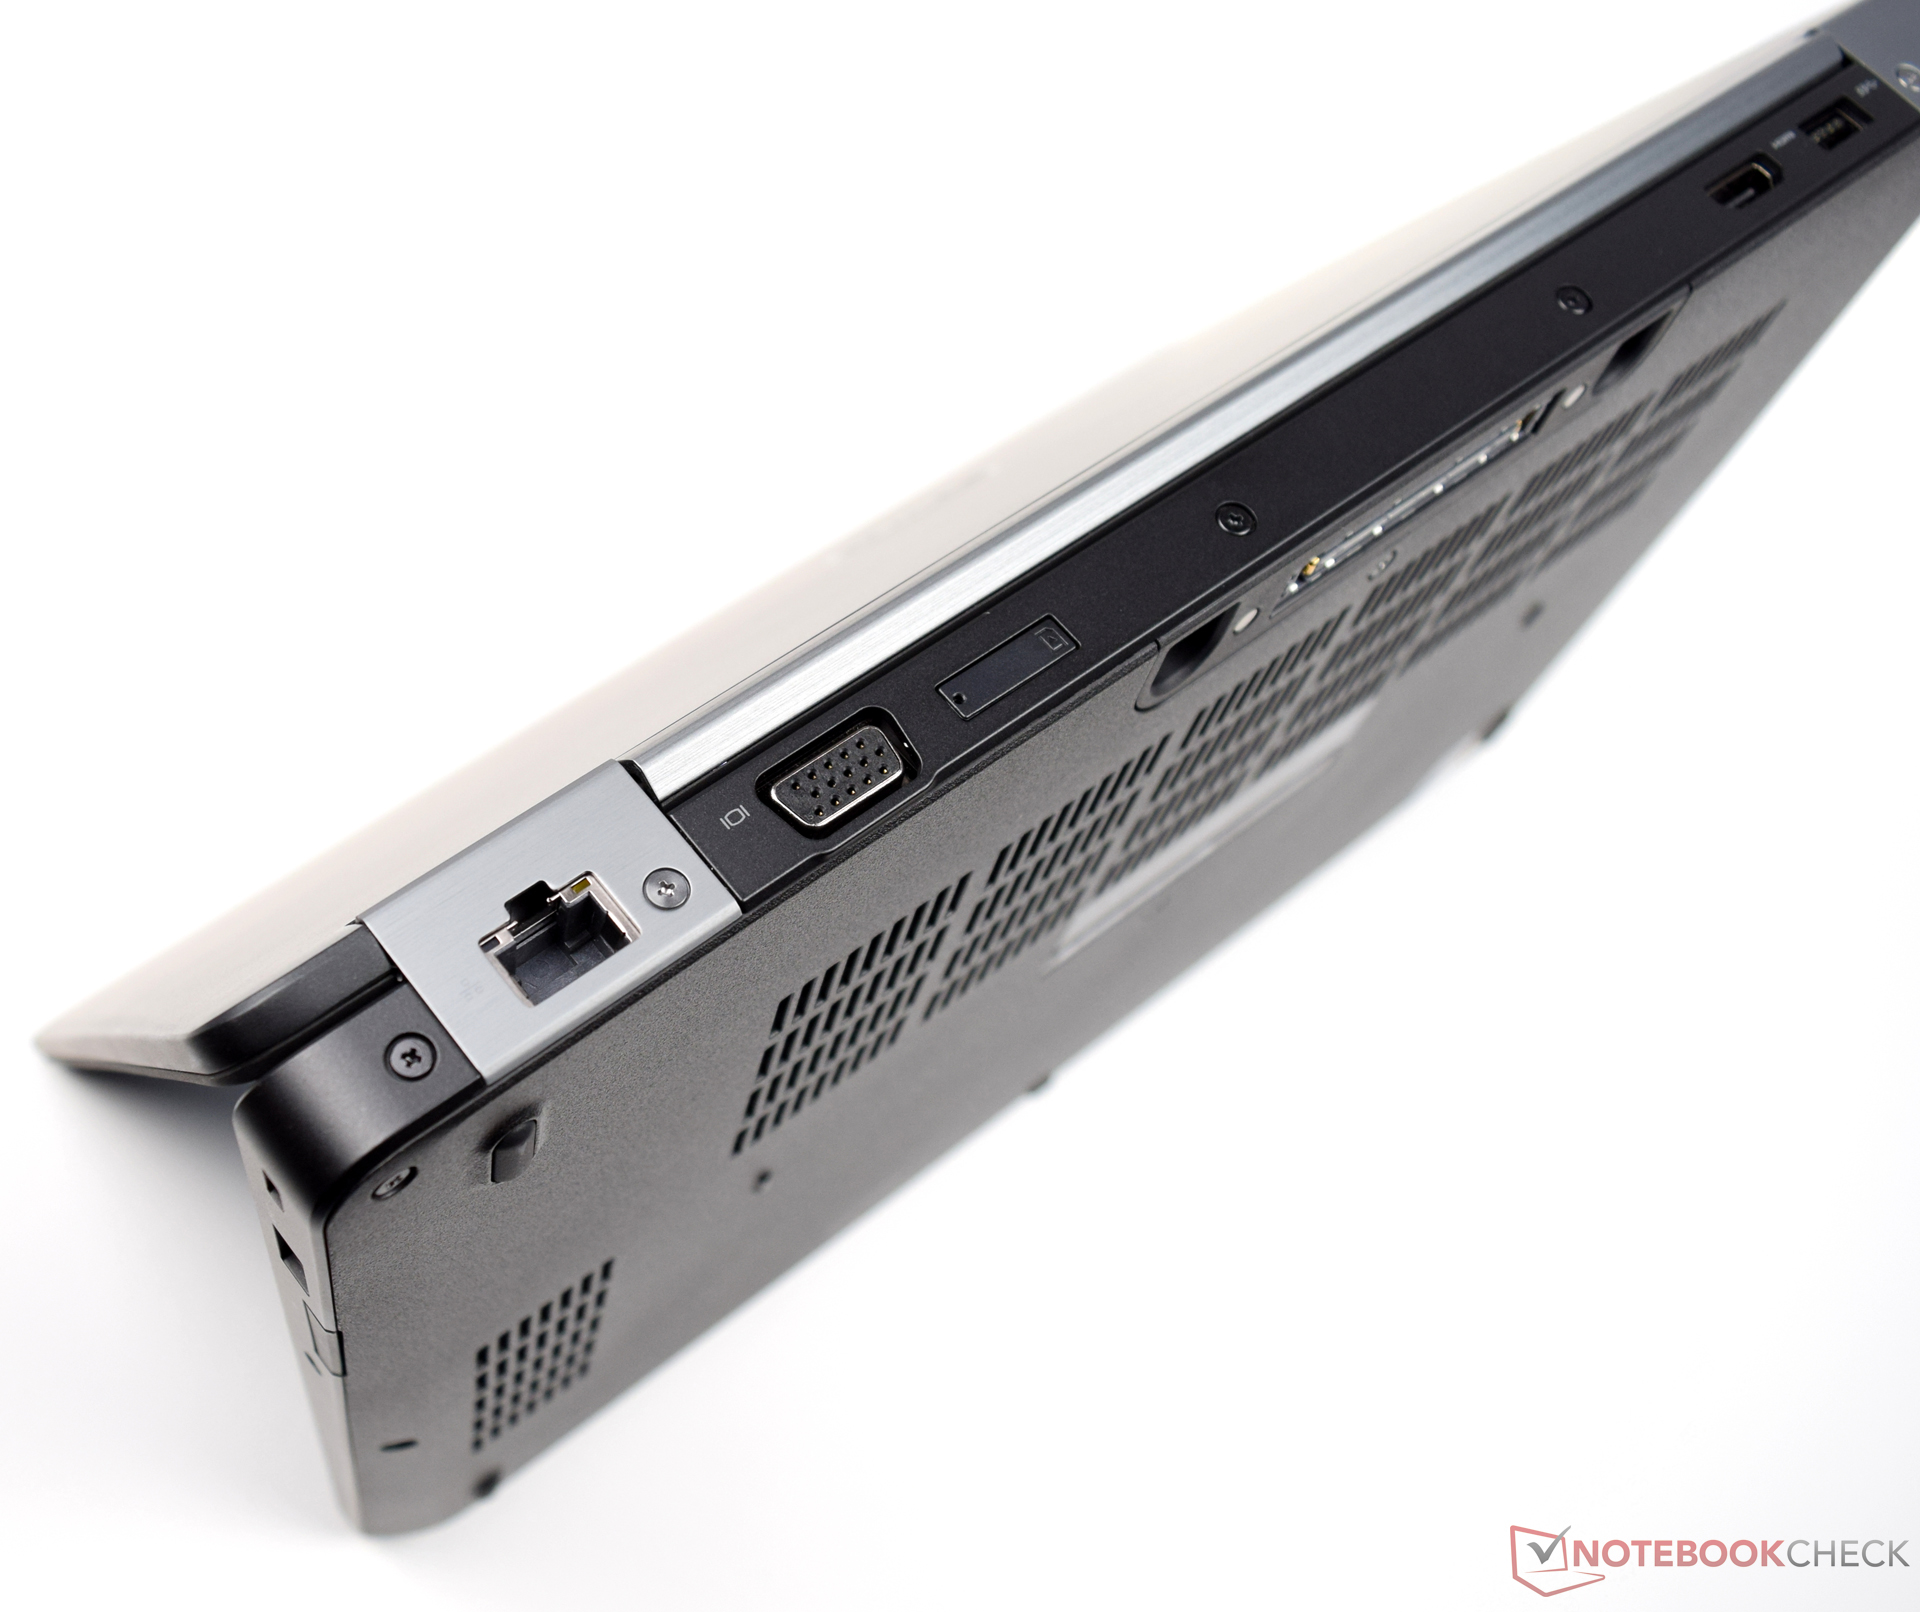
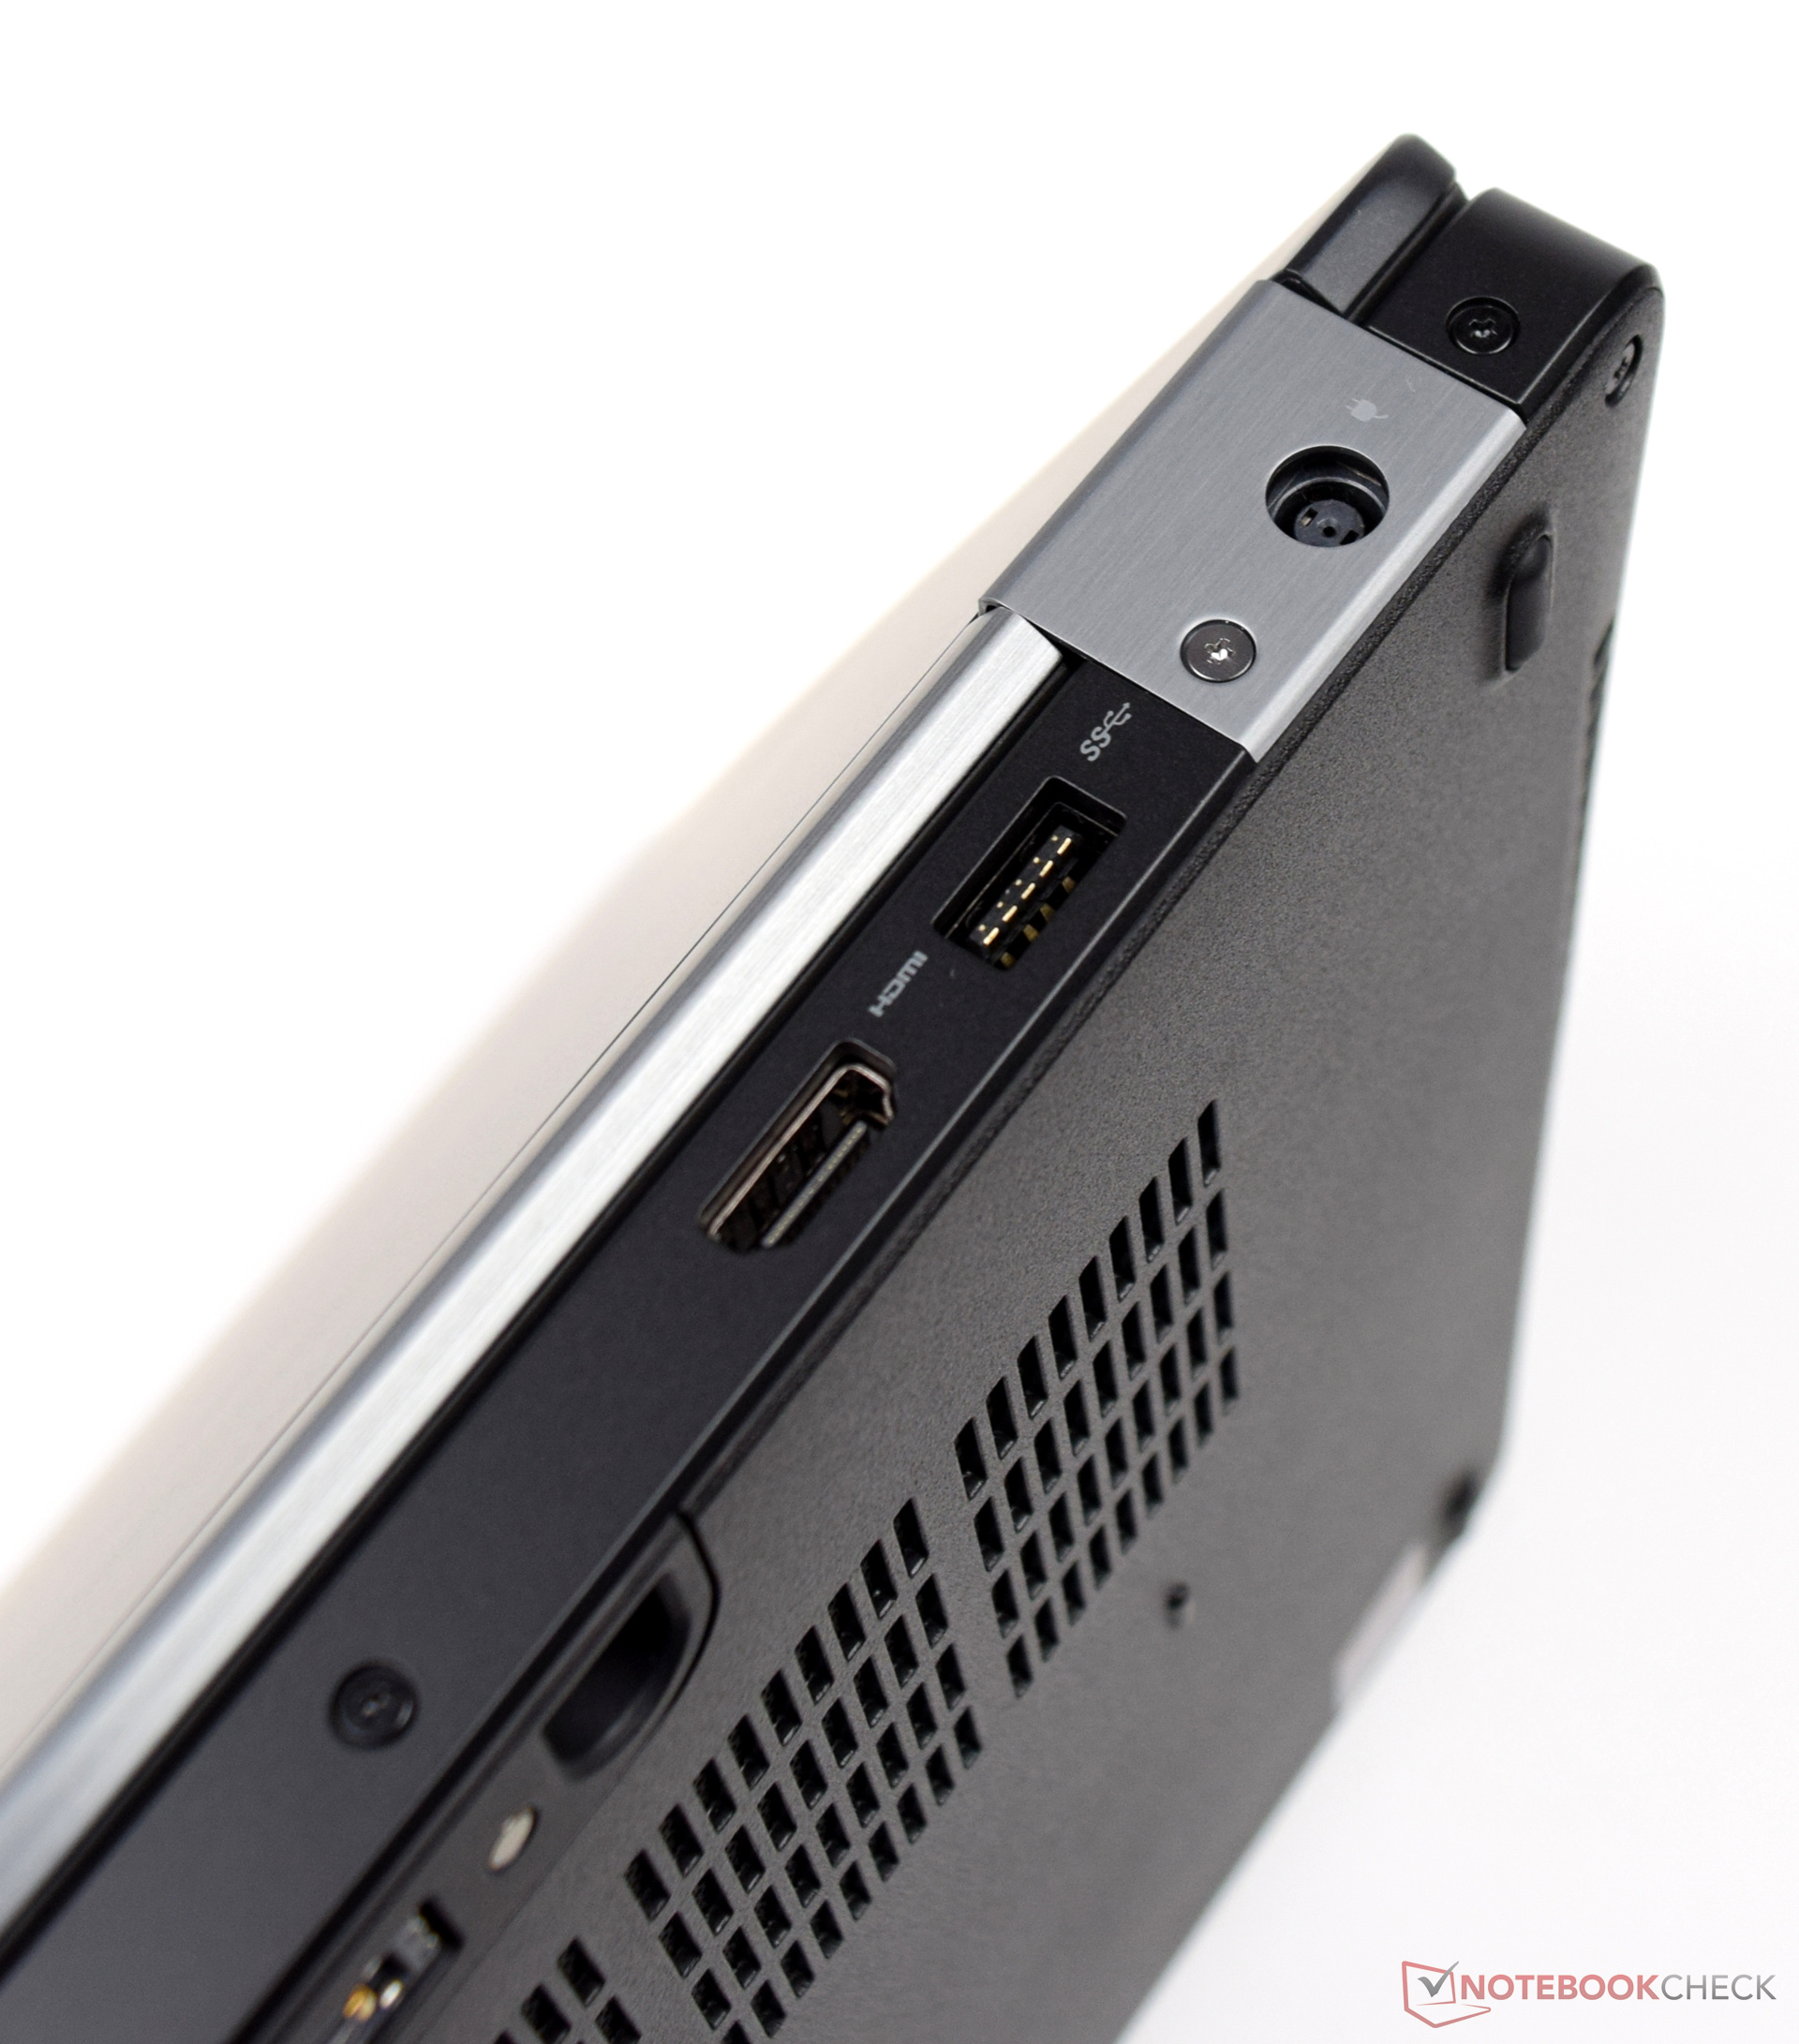
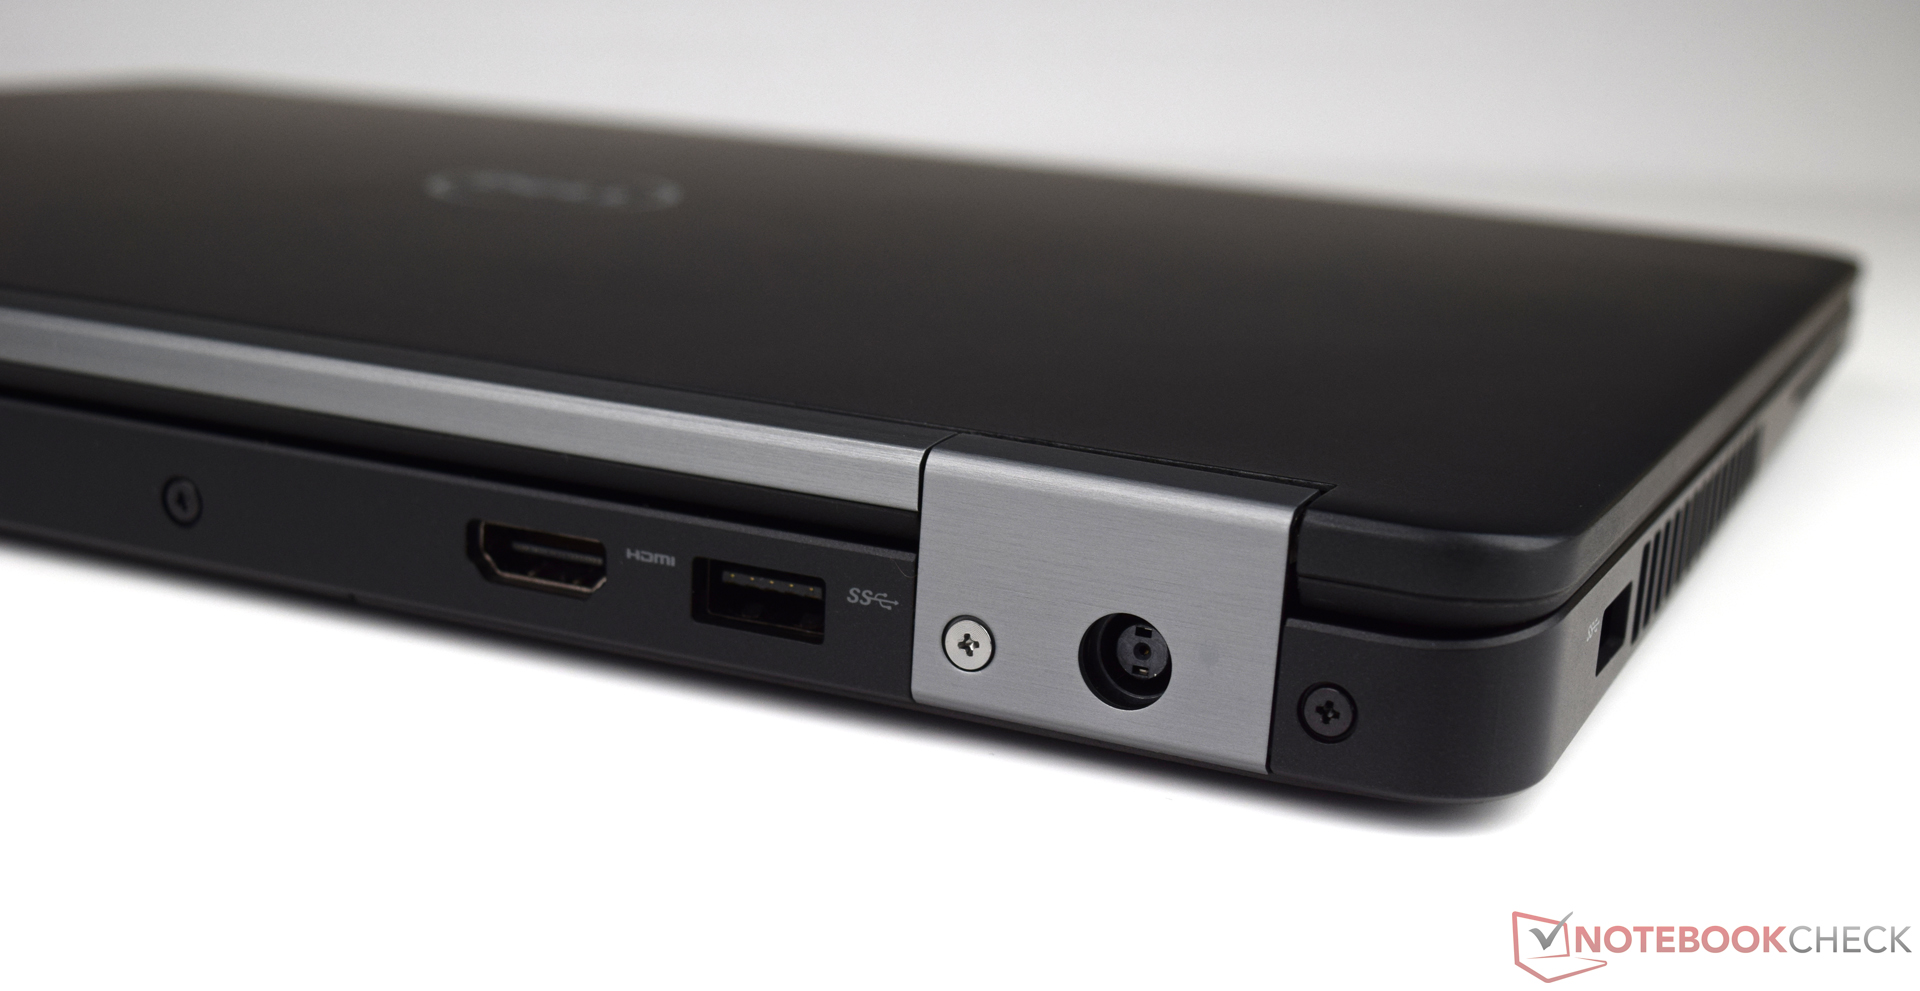
El Dell Latitude 14 E5470 no da muchos motivos de queja, pero nos habría gustado tener al menos un puerto USB Type-C Gen.2 para el futuro. La pantalla con sus buenas valoraciones es un paso en la dirección adecuada. Sin embargo, para este precio podría haber tenido algo más de contraste.
Pero podemos decir en definitiva que el Dell Latitude 14 E5470 es un buen dispositivo de oficina para la jornada laboral en la empresa. Las diversas características añaden puntos extra y podrían ser el factor decisivo para su compra.
Ésta es una versión acortada del análisis original. Puedes leer el análisis completo en inglés aquí.
Dell Latitude 14 E5470
- 02/10/2017 v6 (old)
Sebastian Bade