Breve análisis del Lenovo ThinkPad 13 (Core i3-7100U, Full HD)
| SD Card Reader | |
| average JPG Copy Test (av. of 3 runs) | |
| Lenovo ThinkPad E560 20EV000MGE | |
| Lenovo Thinkpad 13-20J1001BUS | |
| Lenovo ThinkPad 13-20GKS01100 | |
| Dell Latitude 14 3470 | |
| maximum AS SSD Seq Read Test (1GB) | |
| Lenovo Thinkpad 13-20J1001BUS | |
| Lenovo ThinkPad 13-20GKS01100 | |
| Dell Latitude 14 3470 | |
| Networking | |
| iperf3 transmit AX12 | |
| Lenovo Thinkpad 13-20J1001BUS | |
| Lenovo ThinkPad 13-20J2S00G00 | |
| iperf3 receive AX12 | |
| Lenovo Thinkpad 13-20J1001BUS | |
| Lenovo ThinkPad 13-20J2S00G00 | |
| |||||||||||||||||||||||||
iluminación: 88 %
Brillo con batería: 266.4 cd/m²
Contraste: 859:1 (Negro: 0.31 cd/m²)
ΔE ColorChecker Calman: 5.3 | ∀{0.5-29.43 Ø4.73}
ΔE Greyscale Calman: 3.3 | ∀{0.09-98 Ø4.97}
60% sRGB (Argyll 1.6.3 3D)
38% AdobeRGB 1998 (Argyll 1.6.3 3D)
41.92% AdobeRGB 1998 (Argyll 3D)
60.7% sRGB (Argyll 3D)
40.57% Display P3 (Argyll 3D)
Gamma: 2.36
CCT: 6843 K
| Lenovo Thinkpad 13-20J1001BUS Lenovo LEN4094, IPS, 13.3", 1920x1080 | Lenovo ThinkPad 13-20GKS01100 LP133WF2-SPL1, , 13.3", 1920x1080 | Lenovo ThinkPad E560 20EV000MGE Lenovo N156B6-L07, TN LED, 15.6", 1366x768 | Dell Latitude 14 3470 Innolux N140BGE, TN LED, 14", 1366x768 | |
|---|---|---|---|---|
| Display | -5% | -7% | -1% | |
| Display P3 Coverage (%) | 40.57 | 38.35 -5% | 37.63 -7% | 40.21 -1% |
| sRGB Coverage (%) | 60.7 | 57.4 -5% | 56.7 -7% | 60.5 0% |
| AdobeRGB 1998 Coverage (%) | 41.92 | 39.66 -5% | 38.88 -7% | 41.55 -1% |
| Response Times | -5% | -10% | -10% | |
| Response Time Grey 50% / Grey 80% * (ms) | 32.8 ? | 43.2 ? -32% | 50 ? -52% | 47 ? -43% |
| Response Time Black / White * (ms) | 34.4 ? | 26.8 ? 22% | 23 ? 33% | 26 ? 24% |
| PWM Frequency (Hz) | ||||
| Screen | 3% | -56% | -50% | |
| Brightness middle (cd/m²) | 266.4 | 233 -13% | 241 -10% | 206 -23% |
| Brightness (cd/m²) | 250 | 227 -9% | 226 -10% | 193 -23% |
| Brightness Distribution (%) | 88 | 86 -2% | 89 1% | 87 -1% |
| Black Level * (cd/m²) | 0.31 | 0.22 29% | 0.48 -55% | 0.48 -55% |
| Contrast (:1) | 859 | 1059 23% | 502 -42% | 429 -50% |
| Colorchecker dE 2000 * | 5.3 | 5.41 -2% | 12.43 -135% | 11 -108% |
| Colorchecker dE 2000 max. * | 21 | 13.61 35% | 21.03 -0% | 19.57 7% |
| Greyscale dE 2000 * | 3.3 | 4.15 -26% | 13.24 -301% | 11.51 -249% |
| Gamma | 2.36 93% | 2.45 90% | 2.61 84% | 2.23 99% |
| CCT | 6843 95% | 6773 96% | 15733 41% | 13671 48% |
| Color Space (Percent of AdobeRGB 1998) (%) | 38 | 36.52 -4% | 36 -5% | 38.46 1% |
| Color Space (Percent of sRGB) (%) | 60 | 57.16 -5% | 57 -5% | 60.61 1% |
| Media total (Programa/Opciones) | -2% /
0% | -24% /
-40% | -20% /
-35% |
* ... más pequeño es mejor
Tiempos de respuesta del display
| ↔ Tiempo de respuesta de Negro a Blanco | ||
|---|---|---|
| 34.4 ms ... subida ↗ y bajada ↘ combinada | ↗ 21.2 ms subida | 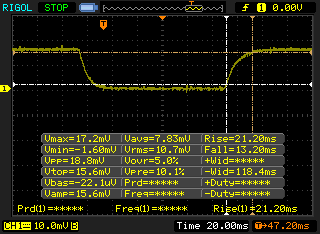 |
| ↘ 13.2 ms bajada | ||
| La pantalla mostró tiempos de respuesta lentos en nuestros tests y podría ser demasiado lenta para los jugones. En comparación, todos los dispositivos de prueba van de ##min### (mínimo) a 240 (máximo) ms. » 92 % de todos los dispositivos son mejores. Eso quiere decir que el tiempo de respuesta es peor que la media (19.9 ms) de todos los dispositivos testados. | ||
| ↔ Tiempo de respuesta 50% Gris a 80% Gris | ||
| 32.8 ms ... subida ↗ y bajada ↘ combinada | ↗ 18 ms subida | 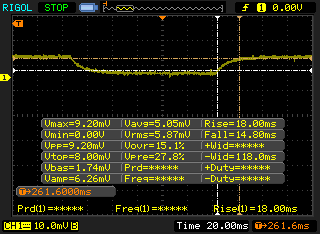 |
| ↘ 14.8 ms bajada | ||
| La pantalla mostró tiempos de respuesta lentos en nuestros tests y podría ser demasiado lenta para los jugones. En comparación, todos los dispositivos de prueba van de ##min### (mínimo) a 636 (máximo) ms. » 44 % de todos los dispositivos son mejores. Eso quiere decir que el tiempo de respuesta es similar al dispositivo testado medio (31.1 ms). | ||
Parpadeo de Pantalla / PWM (Pulse-Width Modulation)
| Parpadeo de Pantalla / PWM no detectado | 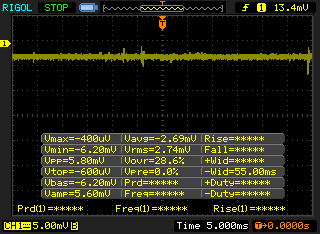 | ||
Comparación: 52 % de todos los dispositivos testados no usaron PWM para atenuar el display. Si se usó, medimos una media de 7794 (mínimo: 5 - máxmo: 343500) Hz. | |||
| Cinebench R11.5 | |
| CPU Single 64Bit | |
| Lenovo ThinkPad E560 20EV000MGE | |
| Dell Latitude 14 3470 | |
| Lenovo Thinkpad 13-20J1001BUS | |
| CPU Multi 64Bit | |
| Lenovo Thinkpad 13-20J1001BUS | |
| Lenovo ThinkPad E560 20EV000MGE | |
| Dell Latitude 14 3470 | |
| Cinebench R10 | |
| Rendering Multiple CPUs 32Bit | |
| Lenovo Thinkpad 13-20J1001BUS | |
| Lenovo ThinkPad E560 20EV000MGE | |
| Rendering Single 32Bit | |
| Lenovo Thinkpad 13-20J1001BUS | |
| Lenovo ThinkPad E560 20EV000MGE | |
| wPrime 2.10 - 1024m | |
| Lenovo Thinkpad 13-20J1001BUS | |
* ... más pequeño es mejor
| PCMark 8 | |
| Home Score Accelerated v2 | |
| Lenovo Thinkpad 13-20J1001BUS | |
| Dell Latitude 14 3470 | |
| Lenovo ThinkPad 13-20GKS01100 | |
| Lenovo ThinkPad E560 20EV000MGE | |
| Work Score Accelerated v2 | |
| Lenovo Thinkpad 13-20J1001BUS | |
| Lenovo ThinkPad 13-20GKS01100 | |
| Dell Latitude 14 3470 | |
| Lenovo ThinkPad E560 20EV000MGE | |
| Creative Score Accelerated v2 | |
| Lenovo Thinkpad 13-20J1001BUS | |
| Lenovo ThinkPad 13-20GKS01100 | |
| Lenovo ThinkPad E560 20EV000MGE | |
| PCMark 7 Score | 3294 puntos | |
| PCMark 8 Home Score Accelerated v2 | 3163 puntos | |
| PCMark 8 Creative Score Accelerated v2 | 3886 puntos | |
| PCMark 8 Work Score Accelerated v2 | 4139 puntos | |
ayuda | ||
| Lenovo Thinkpad 13-20J1001BUS | Lenovo ThinkPad 13-20GKS01100 Samsung SSD PM871 MZNLN256HCHP | Lenovo ThinkPad E560 20EV000MGE Western Digital WD Black Mobile 500GB (WD5000LPLX) | Dell Latitude 14 3470 Toshiba MQ01ACF050 | HP ProBook 440 G4 Z2Y47ES Samsung CM871a MZNTY256HDHP | |
|---|---|---|---|---|---|
| CrystalDiskMark 3.0 | 16% | -87% | -90% | 25% | |
| Read Seq (MB/s) | 447.3 | 461.7 3% | 120.4 -73% | 108.9 -76% | 524 17% |
| Write Seq (MB/s) | 331.3 | 297.8 -10% | 123.1 -63% | 103.2 -69% | 466.9 41% |
| Read 512 (MB/s) | 315.7 | 351.6 11% | 34.31 -89% | 404 28% | |
| Write 512 (MB/s) | 247.2 | 298.4 21% | 66.8 -73% | 292.5 18% | |
| Read 4k (MB/s) | 34.46 | 31.85 -8% | 0.373 -99% | 0.362 -99% | 33.08 -4% |
| Write 4k (MB/s) | 76.1 | 68.5 -10% | 1.29 -98% | 0.946 -99% | 80.2 5% |
| Read 4k QD32 (MB/s) | 235.3 | 360.9 53% | 0.976 -100% | 0.721 -100% | 379.4 61% |
| Write 4k QD32 (MB/s) | 162.2 | 276.2 70% | 1.285 -99% | 0.901 -99% | 216.2 33% |

| 3DMark | |
| 1280x720 Cloud Gate Standard Graphics | |
| Lenovo ThinkPad 13-20GKS01100 | |
| Lenovo Thinkpad 13-20J1001BUS | |
| Lenovo ThinkPad E560 20EV000MGE | |
| Dell Latitude 14 3470 | |
| 1920x1080 Ice Storm Extreme Graphics | |
| Lenovo Thinkpad 13-20J1001BUS | |
| 3DMark Ice Storm Standard Score | 34539 puntos | |
| 3DMark Cloud Gate Standard Score | 4409 puntos | |
ayuda | ||
| BioShock Infinite | |
| 1920x1080 Ultra Preset, DX11 (DDOF) (ordenar por valor) | |
| Lenovo Thinkpad 13-20J1001BUS | |
| 1366x768 High Preset (ordenar por valor) | |
| Lenovo ThinkPad 13-20GKS01100 | |
| Lenovo ThinkPad E560 20EV000MGE | |
| 1366x768 Medium Preset (ordenar por valor) | |
| Lenovo Thinkpad 13-20J1001BUS | |
| Lenovo ThinkPad 13-20GKS01100 | |
| Lenovo ThinkPad E560 20EV000MGE | |
| 1280x720 Very Low Preset (ordenar por valor) | |
| Lenovo Thinkpad 13-20J1001BUS | |
| Lenovo ThinkPad 13-20GKS01100 | |
| Lenovo ThinkPad E560 20EV000MGE | |
| Ashes of the Singularity - 1280x768 low (ordenar por valor) | |
| Lenovo Thinkpad 13-20J1001BUS | |
| bajo | medio | alto | ultra | |
|---|---|---|---|---|
| BioShock Infinite (2013) | 35 | 22 | 11 | |
| Ashes of the Singularity (2016) | 8.9 |
Ruido
| Ocioso |
| 28.7 / 28.7 / 28.7 dB(A) |
| Carga |
| 31.2 / 35.9 dB(A) |
 | ||
30 dB silencioso 40 dB(A) audible 50 dB(A) ruidosamente alto |
||
min: | ||
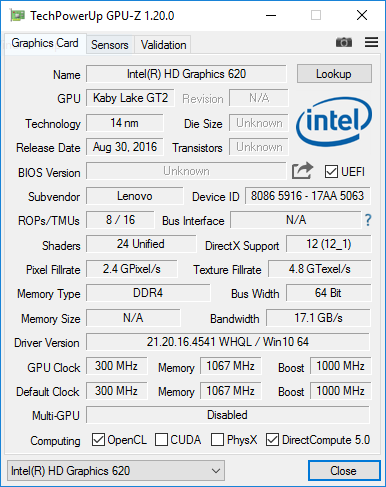
| Lenovo Thinkpad 13-20J1001BUS HD Graphics 620, i3-7100U | Lenovo ThinkPad 13-20GKS01100 HD Graphics 520, 6200U, Samsung SSD PM871 MZNLN256HCHP | Lenovo ThinkPad E560 20EV000MGE HD Graphics 520, 6100U, Western Digital WD Black Mobile 500GB (WD5000LPLX) | Dell Latitude 14 3470 HD Graphics 520, 6100U, Toshiba MQ01ACF050 | HP ProBook 440 G4 Z2Y47ES HD Graphics 620, i3-7100U, Samsung CM871a MZNTY256HDHP | Acer Spin 5 SP513-51 HD Graphics 520, 6100U, Hynix HFS128G39TND | |
|---|---|---|---|---|---|---|
| Noise | 0% | -12% | -7% | -10% | -5% | |
| apagado / medio ambiente * (dB) | 28.7 | 29.1 -1% | 31.2 -9% | 29.2 -2% | 30.9 -8% | 30.5 -6% |
| Idle Minimum * (dB) | 28.7 | 29.1 -1% | 32.3 -13% | 32.3 -13% | 30 -5% | 30.5 -6% |
| Idle Average * (dB) | 28.7 | 29.1 -1% | 32.3 -13% | 32.3 -13% | 31.8 -11% | 30.5 -6% |
| Idle Maximum * (dB) | 28.7 | 29.1 -1% | 32.5 -13% | 32.3 -13% | 33.5 -17% | 30.6 -7% |
| Load Average * (dB) | 31.2 | 31.5 -1% | 36 -15% | 33.3 -7% | 35.7 -14% | 31 1% |
| Load Maximum * (dB) | 35.9 | 33.5 7% | 38.8 -8% | 33.4 7% | 38.5 -7% | 36.8 -3% |
* ... más pequeño es mejor
(±) La temperatura máxima en la parte superior es de 44.4 °C / 112 F, frente a la media de 34.3 °C / 94 F, que oscila entre 21.2 y 62.5 °C para la clase Office.
(-) El fondo se calienta hasta un máximo de 55.4 °C / 132 F, frente a la media de 36.8 °C / 98 F
(+) En reposo, la temperatura media de la parte superior es de 25.8 °C / 78# F, frente a la media del dispositivo de 29.5 °C / 85 F.
(+) El reposamanos y el panel táctil están a una temperatura inferior a la de la piel, con un máximo de 26.2 °C / 79.2 F y, por tanto, son fríos al tacto.
(±) La temperatura media de la zona del reposamanos de dispositivos similares fue de 27.5 °C / 81.5 F (+1.3 °C / 2.3 F).
Lenovo Thinkpad 13-20J1001BUS análisis de audio
(±) | la sonoridad del altavoz es media pero buena (75.1 dB)
Graves 100 - 315 Hz
(-) | casi sin bajos - de media 16.8% inferior a la mediana
(±) | la linealidad de los graves es media (14.7% delta a frecuencia anterior)
Medios 400 - 2000 Hz
(+) | medios equilibrados - a sólo 2.1% de la mediana
(+) | los medios son lineales (6.3% delta a la frecuencia anterior)
Altos 2 - 16 kHz
(+) | máximos equilibrados - a sólo 2.5% de la mediana
(±) | la linealidad de los máximos es media (8.4% delta a frecuencia anterior)
Total 100 - 16.000 Hz
(±) | la linealidad del sonido global es media (18.4% de diferencia con la mediana)
En comparación con la misma clase
» 33% de todos los dispositivos probados de esta clase eran mejores, 7% similares, 60% peores
» El mejor tuvo un delta de 7%, la media fue 21%, el peor fue ###max##%
En comparación con todos los dispositivos probados
» 41% de todos los dispositivos probados eran mejores, 8% similares, 52% peores
» El mejor tuvo un delta de 4%, la media fue 24%, el peor fue ###max##%
Lenovo ThinkPad 13-20GKS01100 análisis de audio
(±) | la sonoridad del altavoz es media pero buena (78.4 dB)
Graves 100 - 315 Hz
(±) | lubina reducida - en promedio 11.8% inferior a la mediana
(-) | los graves no son lineales (15.4% delta a la frecuencia anterior)
Medios 400 - 2000 Hz
(±) | medias más altas - de media 6.8% más altas que la mediana
(+) | los medios son lineales (4.5% delta a la frecuencia anterior)
Altos 2 - 16 kHz
(+) | máximos equilibrados - a sólo 2.7% de la mediana
(+) | los máximos son lineales (6.6% delta a la frecuencia anterior)
Total 100 - 16.000 Hz
(±) | la linealidad del sonido global es media (19.6% de diferencia con la mediana)
En comparación con la misma clase
» 40% de todos los dispositivos probados de esta clase eran mejores, 8% similares, 52% peores
» El mejor tuvo un delta de 7%, la media fue 21%, el peor fue ###max##%
En comparación con todos los dispositivos probados
» 49% de todos los dispositivos probados eran mejores, 7% similares, 44% peores
» El mejor tuvo un delta de 4%, la media fue 24%, el peor fue ###max##%
| Off / Standby | |
| Ocioso | |
| Carga |
|
Clave:
min: | |
| Lenovo Thinkpad 13-20J1001BUS i3-7100U, HD Graphics 620, , IPS, 1920x1080, 13.3" | Lenovo ThinkPad 13-20GKS01100 6200U, HD Graphics 520, Samsung SSD PM871 MZNLN256HCHP, , 1920x1080, 13.3" | Lenovo ThinkPad E560 20EV000MGE 6100U, HD Graphics 520, Western Digital WD Black Mobile 500GB (WD5000LPLX), TN LED, 1366x768, 15.6" | Dell Latitude 14 3470 6100U, HD Graphics 520, Toshiba MQ01ACF050, TN LED, 1366x768, 14" | HP ProBook 440 G4 Z2Y47ES i3-7100U, HD Graphics 620, Samsung CM871a MZNTY256HDHP, TN, 1920x1080, 14" | Acer Spin 5 SP513-51 6100U, HD Graphics 520, Hynix HFS128G39TND, IPS LED, 1920x1080, 13.3" | |
|---|---|---|---|---|---|---|
| Power Consumption | -1% | -19% | -25% | -20% | -8% | |
| Idle Minimum * (Watt) | 3.5 | 3.1 11% | 5.2 -49% | 5 -43% | 5.7 -63% | 4.1 -17% |
| Idle Average * (Watt) | 5.7 | 5.5 4% | 7.25 -27% | 6.8 -19% | 6.8 -19% | 6.8 -19% |
| Idle Maximum * (Watt) | 6.2 | 6 3% | 7.9 -27% | 8.9 -44% | 7.8 -26% | 7.9 -27% |
| Load Average * (Watt) | 24.1 | 25.8 -7% | 25.1 -4% | 26.2 -9% | 20.2 16% | 20.4 15% |
| Load Maximum * (Watt) | 28.5 | 33.6 -18% | 25.1 12% | 31.8 -12% | 30.6 -7% | 26.8 6% |
* ... más pequeño es mejor
| Lenovo Thinkpad 13-20J1001BUS i3-7100U, HD Graphics 620, 42 Wh | Lenovo ThinkPad 13-20GKS01100 6200U, HD Graphics 520, 42 Wh | Lenovo ThinkPad E560 20EV000MGE 6100U, HD Graphics 520, 48 Wh | Dell Latitude 14 3470 6100U, HD Graphics 520, 41 Wh | HP ProBook 440 G4 Z2Y47ES i3-7100U, HD Graphics 620, 48 Wh | Acer Spin 5 SP513-51 6100U, HD Graphics 520, 45 Wh | |
|---|---|---|---|---|---|---|
| Duración de Batería | -8% | 8% | -22% | 22% | -10% | |
| Reader / Idle (h) | 16.5 | 15.7 -5% | 14.8 -10% | 11.1 -33% | 20.2 22% | 12.5 -24% |
| WiFi v1.3 (h) | 9.7 | 6.2 -36% | 9.4 -3% | 4.6 -53% | 7.7 -21% | |
| Load (h) | 1.9 | 2.2 16% | 2.6 37% | 2.3 21% | 2.2 16% | |
| WiFi (h) | 10.1 |
Pro
Contra
El ThinkPad 13 descansa en un buen puesto. Mantiene muchos de los puntos sobresalientes de sus hermanos ThinkPad más maduros, las series T y X. El teclado es de los mejores que hay, el aguante de batería da para una jornada laboral completa, y el rendimiento es adecuado, si no un poco decepcionante. Sin embargo, han tenido que hacer recortes para mantener bajo el precio. Al teclado le falta iluminación, lo que daña una experiencia de mecanografiado por lo demás excelente, y la falta de Thunderbolt 3 limita severamente las opciones de conectividad.
Quizá el mayor inconveniente aquí sea el precio. Para un sistema de más de $1000, nuestro ThinkPad 13 ofrece unas especificaciones ciertamente deslucidas. Hasta el modelo base del ThinkPad 13 con Intel Celeron 3865U (1.8 GHz, 2 MB Cache) y display TN 1366x768 arranca en $700 a fecha de redacción. Hay varios dispositivos con mejores entrañas a precios muy inferiores. Aunque no los incluimos en nuestras comparaciones, tanto el Asus Zenbook UX305UA como el Dell XPS 13 (2016) pueden configurarse con el doble de RAM y almacenamiento y con una CPU ULV Core i5 por un precio similar al de nuestro modelo de pruebas (y a veces por menos).
En general, el ThinkPad 13 es un paquete atractivo para usuarios business que necesiten algo entre la serie Lenovo X de 12.5" y la serie T de 14". El gran aguante de la batería y los estelares dispositivos de entrada compensan algunos de los sacrificios hechos. Sin embargo, actualizarse a Kaby Lake no merece la pena el elevado precio. Como tal, sugerimos que o esperes a que Lenovo ponga el dispositivo en rebajas o encuentres un ThinkPad 13 2016 más barato con un procesador Skylake.
Ésta es una versión acortada del análisis original. Puedes leer el análisis completo en inglés aquí.
Lenovo Thinkpad 13-20J1001BUS
- 04/28/2017 v6 (old)
Sam Medley
Price comparison
