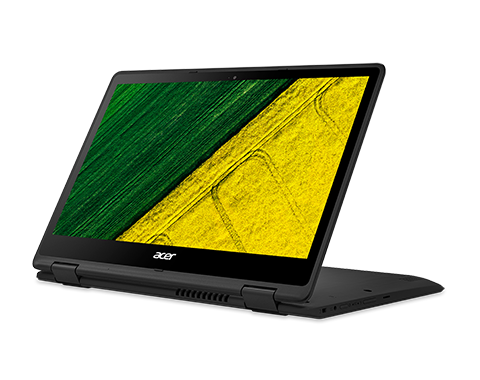
Breve análisis del Convertible Acer Spin 5 SP513-51
| Networking | |
| iperf3 transmit AX12 | |
| HP Omen 17-w100ng | |
| Acer Spin 5 SP513-51 | |
| Dell Inspiron 15 5000 5567-1753 | |
| iperf3 receive AX12 | |
| HP Omen 17-w100ng | |
| Dell Inspiron 15 5000 5567-1753 | |
| Acer Spin 5 SP513-51 | |
| |||||||||||||||||||||||||
iluminación: 87 %
Brillo con batería: 245 cd/m²
Contraste: 1167:1 (Negro: 0.21 cd/m²)
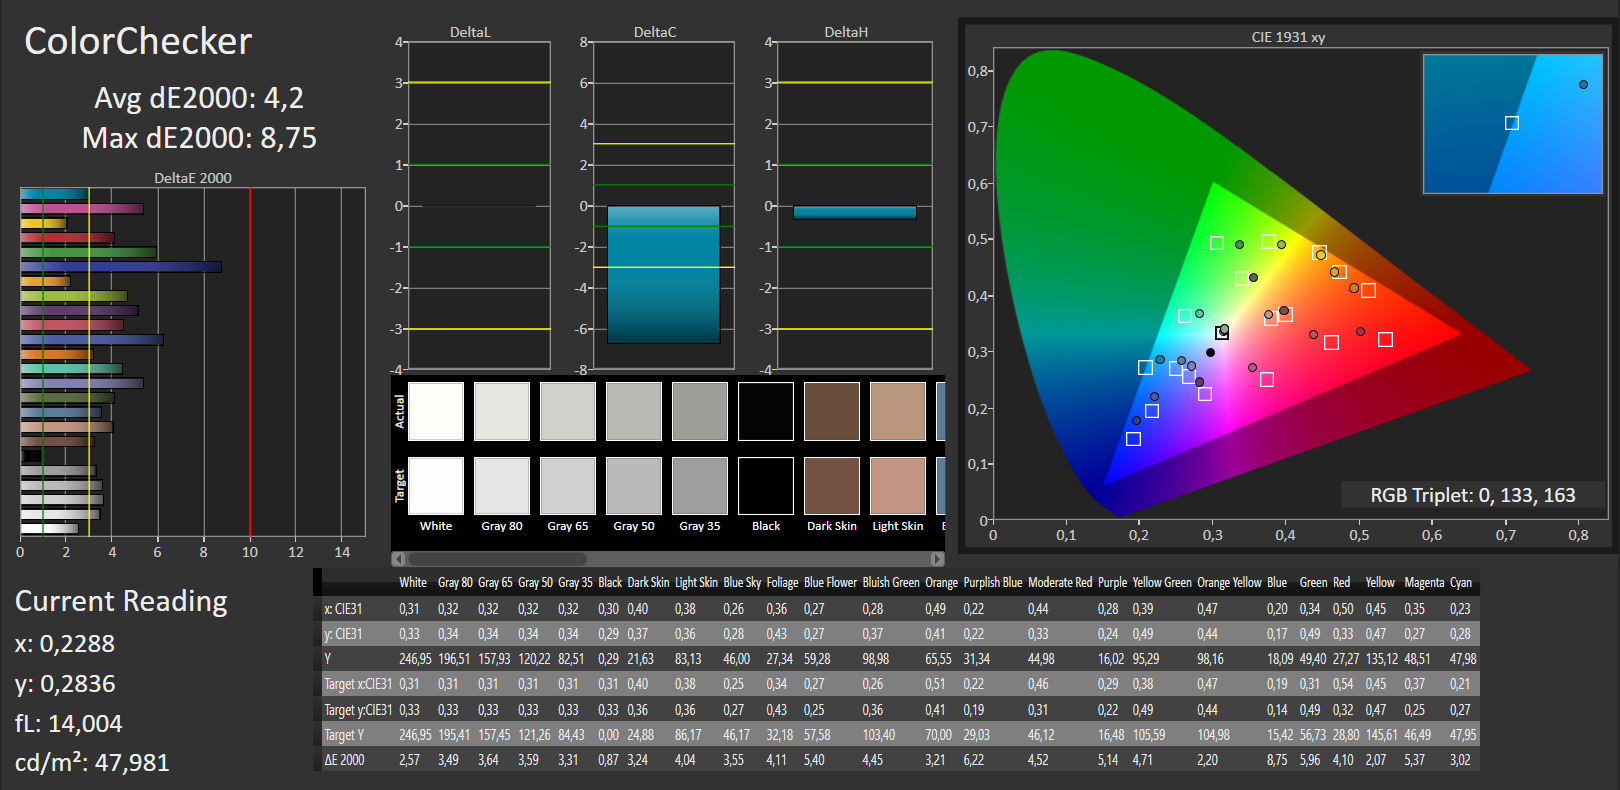
ΔE ColorChecker Calman: 4.2 | ∀{0.5-29.43 Ø4.71}
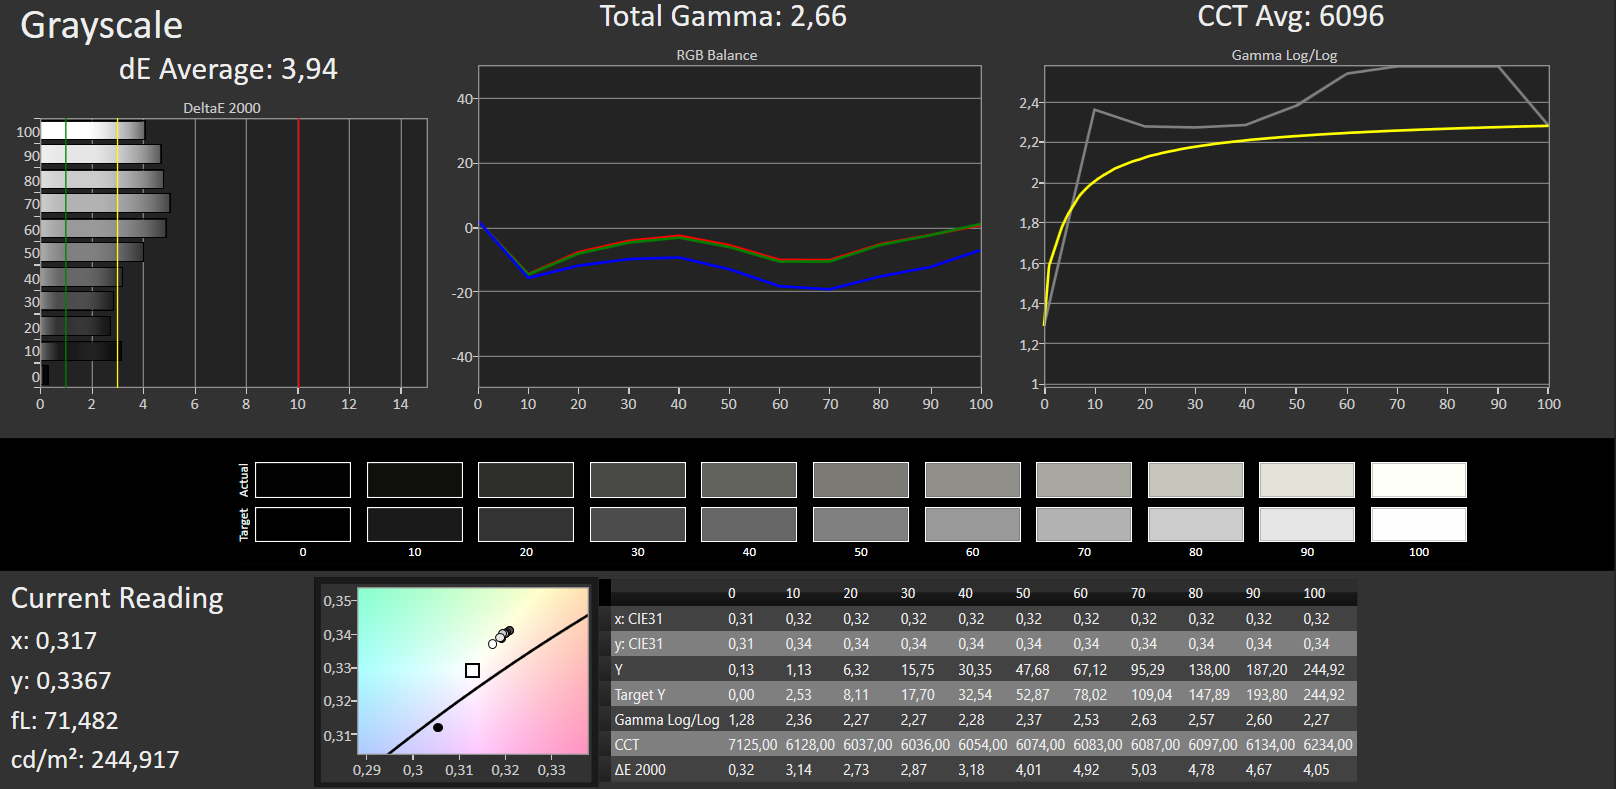
ΔE Greyscale Calman: 3.94 | ∀{0.09-98 Ø4.96}
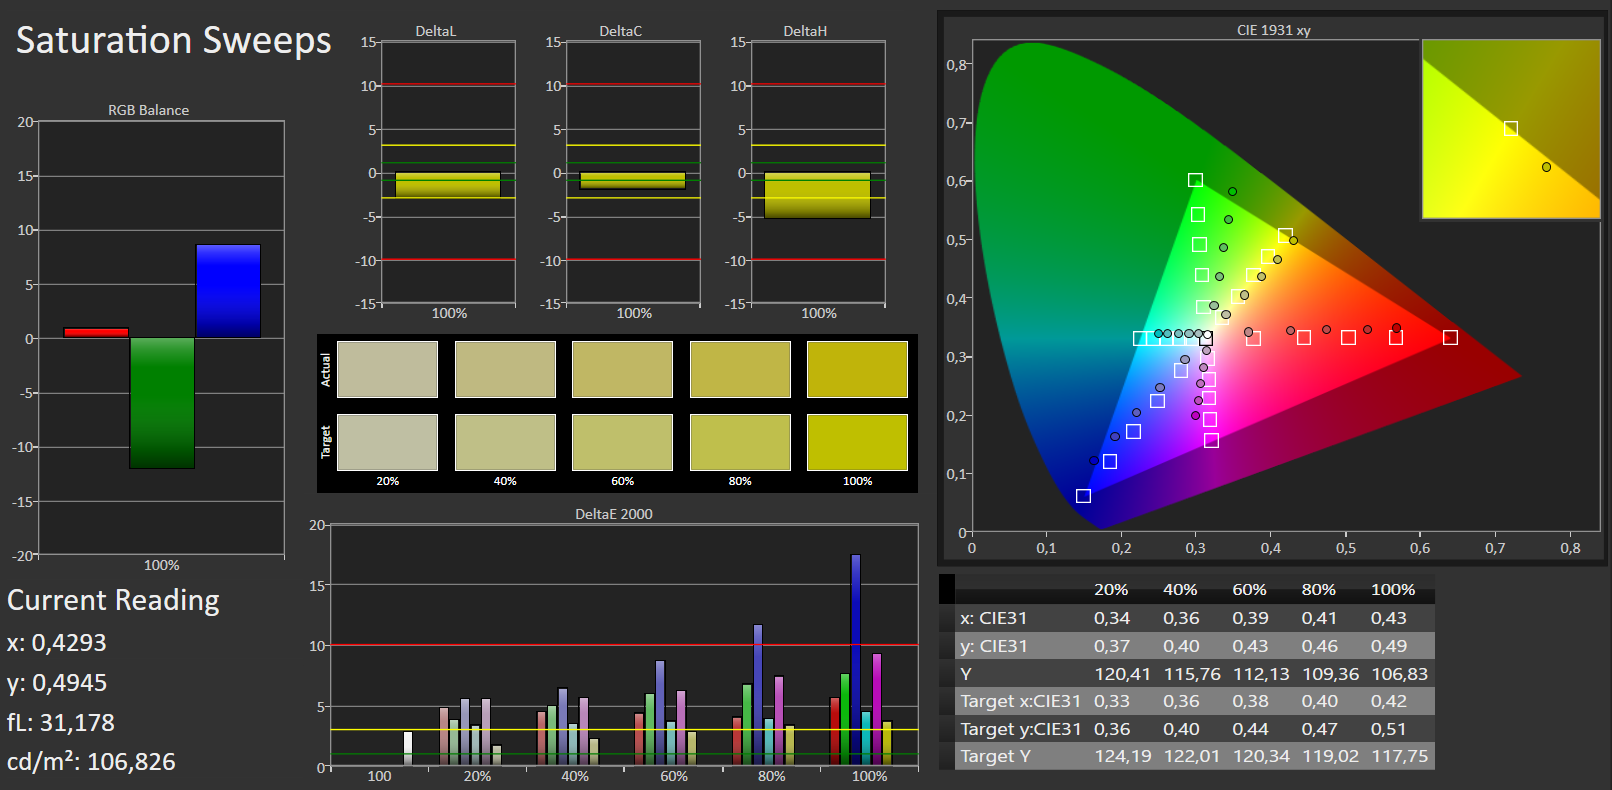
59% sRGB (Argyll 1.6.3 3D)
38% AdobeRGB 1998 (Argyll 1.6.3 3D)
41.32% AdobeRGB 1998 (Argyll 3D)
59.5% sRGB (Argyll 3D)
39.99% Display P3 (Argyll 3D)
Gamma: 2.66
CCT: 6096 K
| Acer Spin 5 SP513-51 B133HAB01.0, , 1920x1080, 13.3" | Dell Inspiron 13 7359-4839 Samsung SDC864D / 133HL [Dell P/N: PVFF5], , 1920x1080, 13.3" | Lenovo Yoga 510-14IKB BOE0637 / BOE DT NV140FHM-N41, , 1920x1080, 14" | HP Pavilion x360 13-u102ng LG Philips, , 1920x1080, 13.3" | Acer Spin 7 SP714-51-M09D AUO B140HAN03.2 / AUO323D, , 1920x1080, 14" | HP Spectre x360 13-w023dx Chi Mei CMN1367, , 1920x1080, 13.3" | |
|---|---|---|---|---|---|---|
| Display | 1% | 5% | -1% | 52% | 58% | |
| Display P3 Coverage (%) | 39.99 | 40.31 1% | 41.78 4% | 39.43 -1% | 61.5 54% | 65.4 64% |
| sRGB Coverage (%) | 59.5 | 60.5 2% | 62.9 6% | 59.1 -1% | 89.1 50% | 90.4 52% |
| AdobeRGB 1998 Coverage (%) | 41.32 | 41.65 1% | 43.17 4% | 40.76 -1% | 62.9 52% | 65.8 59% |
| Response Times | 13% | -20% | 20% | 7% | 19% | |
| Response Time Grey 50% / Grey 80% * (ms) | 56 ? | 38 ? 32% | 53 ? 5% | 38 ? 32% | 51 ? 9% | 33.2 ? 41% |
| Response Time Black / White * (ms) | 27 ? | 29 ? -7% | 39 ? -44% | 25 ? 7% | 26 ? 4% | 28 ? -4% |
| PWM Frequency (Hz) | 350 ? | |||||
| Screen | -31% | -13% | -15% | -39% | -7% | |
| Brightness middle (cd/m²) | 245 | 253 3% | 243 -1% | 277 13% | 344 40% | 334.6 37% |
| Brightness (cd/m²) | 233 | 232 0% | 248 6% | 263 13% | 292 25% | 319 37% |
| Brightness Distribution (%) | 87 | 83 -5% | 91 5% | 88 1% | 72 -17% | 90 3% |
| Black Level * (cd/m²) | 0.21 | 0.28 -33% | 0.32 -52% | 0.31 -48% | 0.26 -24% | 0.336 -60% |
| Contrast (:1) | 1167 | 904 -23% | 759 -35% | 894 -23% | 1323 13% | 996 -15% |
| Colorchecker dE 2000 * | 4.2 | 6.36 -51% | 5.44 -30% | 5.57 -33% | 12.65 -201% | 6.21 -48% |
| Colorchecker dE 2000 max. * | 8.75 | 12.72 -45% | 9.73 -11% | 13.6 -55% | 17.8 -103% | 12 -37% |
| Greyscale dE 2000 * | 3.94 | 10.26 -160% | 4.74 -20% | 4.56 -16% | 12.95 -229% | 7.71 -96% |
| Gamma | 2.66 83% | 2.28 96% | 2.38 92% | 2.28 96% | 1.33 165% | 2.36 93% |
| CCT | 6096 107% | 6500 100% | 7799 83% | 6648 98% | 6441 101% | 6458 101% |
| Color Space (Percent of AdobeRGB 1998) (%) | 38 | 38 0% | 39.6 4% | 38 0% | 58 53% | 58.6 54% |
| Color Space (Percent of sRGB) (%) | 59 | 60 2% | 62.5 6% | 59 0% | 89 51% | 90 53% |
| Media total (Programa/Opciones) | -6% /
-19% | -9% /
-10% | 1% /
-7% | 7% /
-15% | 23% /
9% |
* ... más pequeño es mejor
Tiempos de respuesta del display
| ↔ Tiempo de respuesta de Negro a Blanco | ||
|---|---|---|
| 27 ms ... subida ↗ y bajada ↘ combinada | ↗ 8 ms subida | 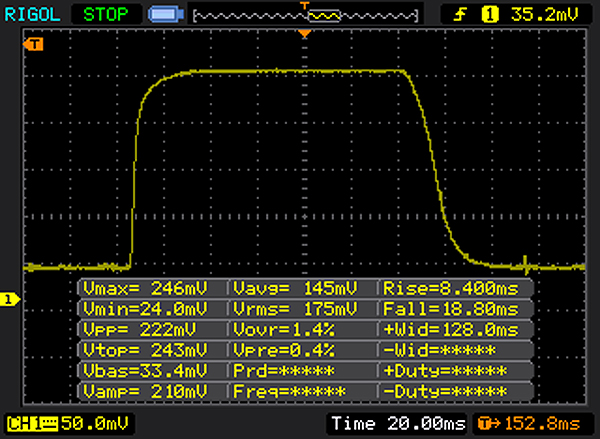 |
| ↘ 19 ms bajada | ||
| La pantalla mostró tiempos de respuesta relativamente lentos en nuestros tests pero podría ser demasiado lenta para los jugones. En comparación, todos los dispositivos de prueba van de ##min### (mínimo) a 240 (máximo) ms. » 68 % de todos los dispositivos son mejores. Eso quiere decir que el tiempo de respuesta es peor que la media (19.8 ms) de todos los dispositivos testados. | ||
| ↔ Tiempo de respuesta 50% Gris a 80% Gris | ||
| 56 ms ... subida ↗ y bajada ↘ combinada | ↗ 18 ms subida | 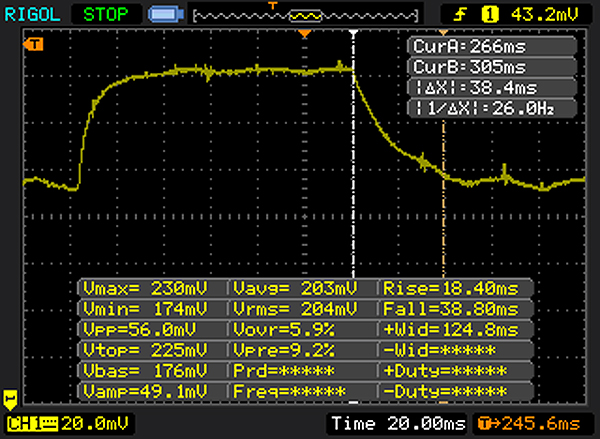 |
| ↘ 38 ms bajada | ||
| La pantalla mostró tiempos de respuesta lentos en nuestros tests y podría ser demasiado lenta para los jugones. En comparación, todos los dispositivos de prueba van de ##min### (mínimo) a 636 (máximo) ms. » 93 % de todos los dispositivos son mejores. Eso quiere decir que el tiempo de respuesta es peor que la media (30.9 ms) de todos los dispositivos testados. | ||
Parpadeo de Pantalla / PWM (Pulse-Width Modulation)
| Parpadeo de Pantalla / PWM no detectado | ||
Comparación: 52 % de todos los dispositivos testados no usaron PWM para atenuar el display. Si se usó, medimos una media de 7744 (mínimo: 5 - máxmo: 343500) Hz. | ||
| PCMark 8 Home Score Accelerated v2 | 3224 puntos | |
| PCMark 8 Work Score Accelerated v2 | 4121 puntos | |
ayuda | ||
| Acer Spin 5 SP513-51 Hynix HFS128G39TND | Acer Spin 7 SP714-51-M09D Kingston RBUSNS4180S3256GG | Dell Inspiron 13 7359-4839 Liteonit LCH-256V2S | HP Spectre x360 13-w023dx Samsung PM951 NVMe MZVLV512 | Lenovo Yoga 910-13IKB-80VF004CGE Samsung PM951 NVMe MZVLV512 | |
|---|---|---|---|---|---|
| AS SSD | 62% | 43% | 218% | 168% | |
| Seq Read (MB/s) | 503 | 433.2 -14% | 506 1% | 1455 189% | 1389 176% |
| Seq Write (MB/s) | 115.7 | 361.5 212% | 270.3 134% | 548 374% | 560 384% |
| 4K Read (MB/s) | 24.45 | 41.2 69% | 24.79 1% | 37.75 54% | 39.92 63% |
| 4K Write (MB/s) | 57.2 | 66.6 16% | 72.7 27% | 129.7 127% | 132.9 132% |
| 4K-64 Read (MB/s) | 333.8 | 345.6 4% | 290.8 -13% | 1420 325% | 671 101% |
| 4K-64 Write (MB/s) | 91.3 | 270.7 196% | 206.1 126% | 501 449% | 422.2 362% |
| Access Time Read * (ms) | 0.098 | 0.099 -1% | 0.082 16% | 0.042 57% | 0.034 65% |
| Access Time Write * (ms) | 0.269 | 0.169 37% | 0.051 81% | 0.03 89% | 0.028 90% |
| Score Total (Points) | 766 | 1036 35% | 856 12% | 3064 300% | 1865 143% |
* ... más pequeño es mejor

| 3DMark 11 - 1280x720 Performance GPU | |
| Lenovo Yoga 510-14IKB | |
| Lenovo Yoga 910-13IKB-80VF004CGE | |
| HP Pavilion x360 13-u102ng | |
| Dell Inspiron 13 7359-4839 | |
| Acer Spin 5 SP513-51 | |
| Acer Spin 7 SP714-51-M09D | |
| 3DMark | |
| 1280x720 Cloud Gate Standard Graphics | |
| Lenovo Yoga 910-13IKB-80VF004CGE | |
| HP Pavilion x360 13-u102ng | |
| Acer Spin 5 SP513-51 | |
| Dell Inspiron 13 7359-4839 | |
| Acer Spin 7 SP714-51-M09D | |
| Lenovo Yoga 510-14IKB | |
| 1920x1080 Fire Strike Graphics | |
| Lenovo Yoga 910-13IKB-80VF004CGE | |
| Lenovo Yoga 510-14IKB | |
| HP Pavilion x360 13-u102ng | |
| Acer Spin 5 SP513-51 | |
| 3DMark 11 Performance | 1321 puntos | |
| 3DMark Cloud Gate Standard Score | 4819 puntos | |
| 3DMark Fire Strike Score | 709 puntos | |
ayuda | ||
| bajo | medio | alto | ultra | |
|---|---|---|---|---|
| BioShock Infinite (2013) | 42.77 | 24.3 | 20.21 | 6.33 |
| Rise of the Tomb Raider (2016) | 16.8 | |||
| Civilization 6 (2016) | 27.9 | 10 |
Ruido
| Ocioso |
| 30.5 / 30.5 / 30.6 dB(A) |
| Carga |
| 31 / 36.8 dB(A) |
 | ||
30 dB silencioso 40 dB(A) audible 50 dB(A) ruidosamente alto |
||
min: | ||
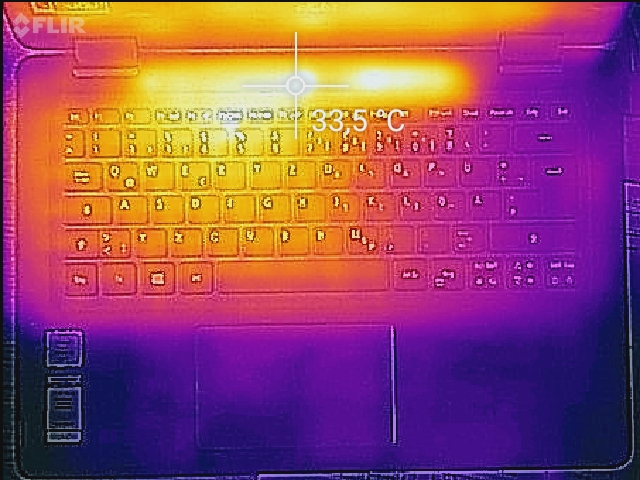
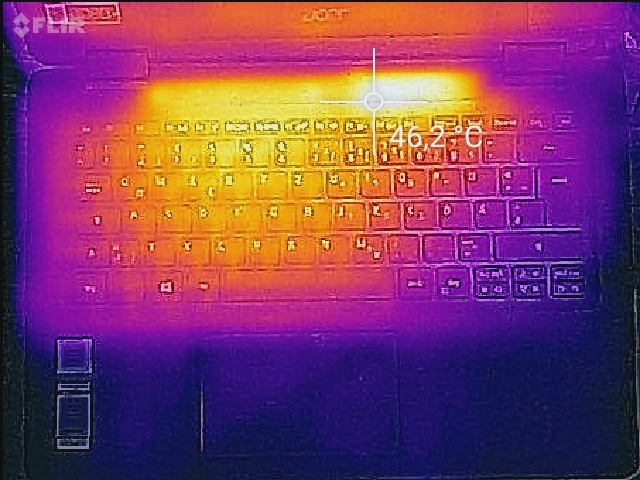
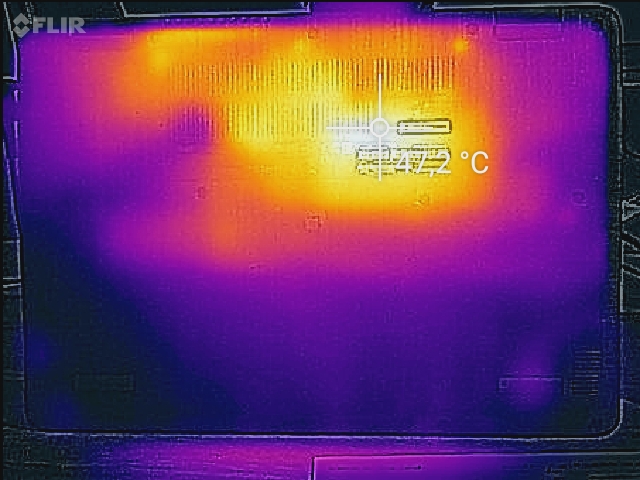
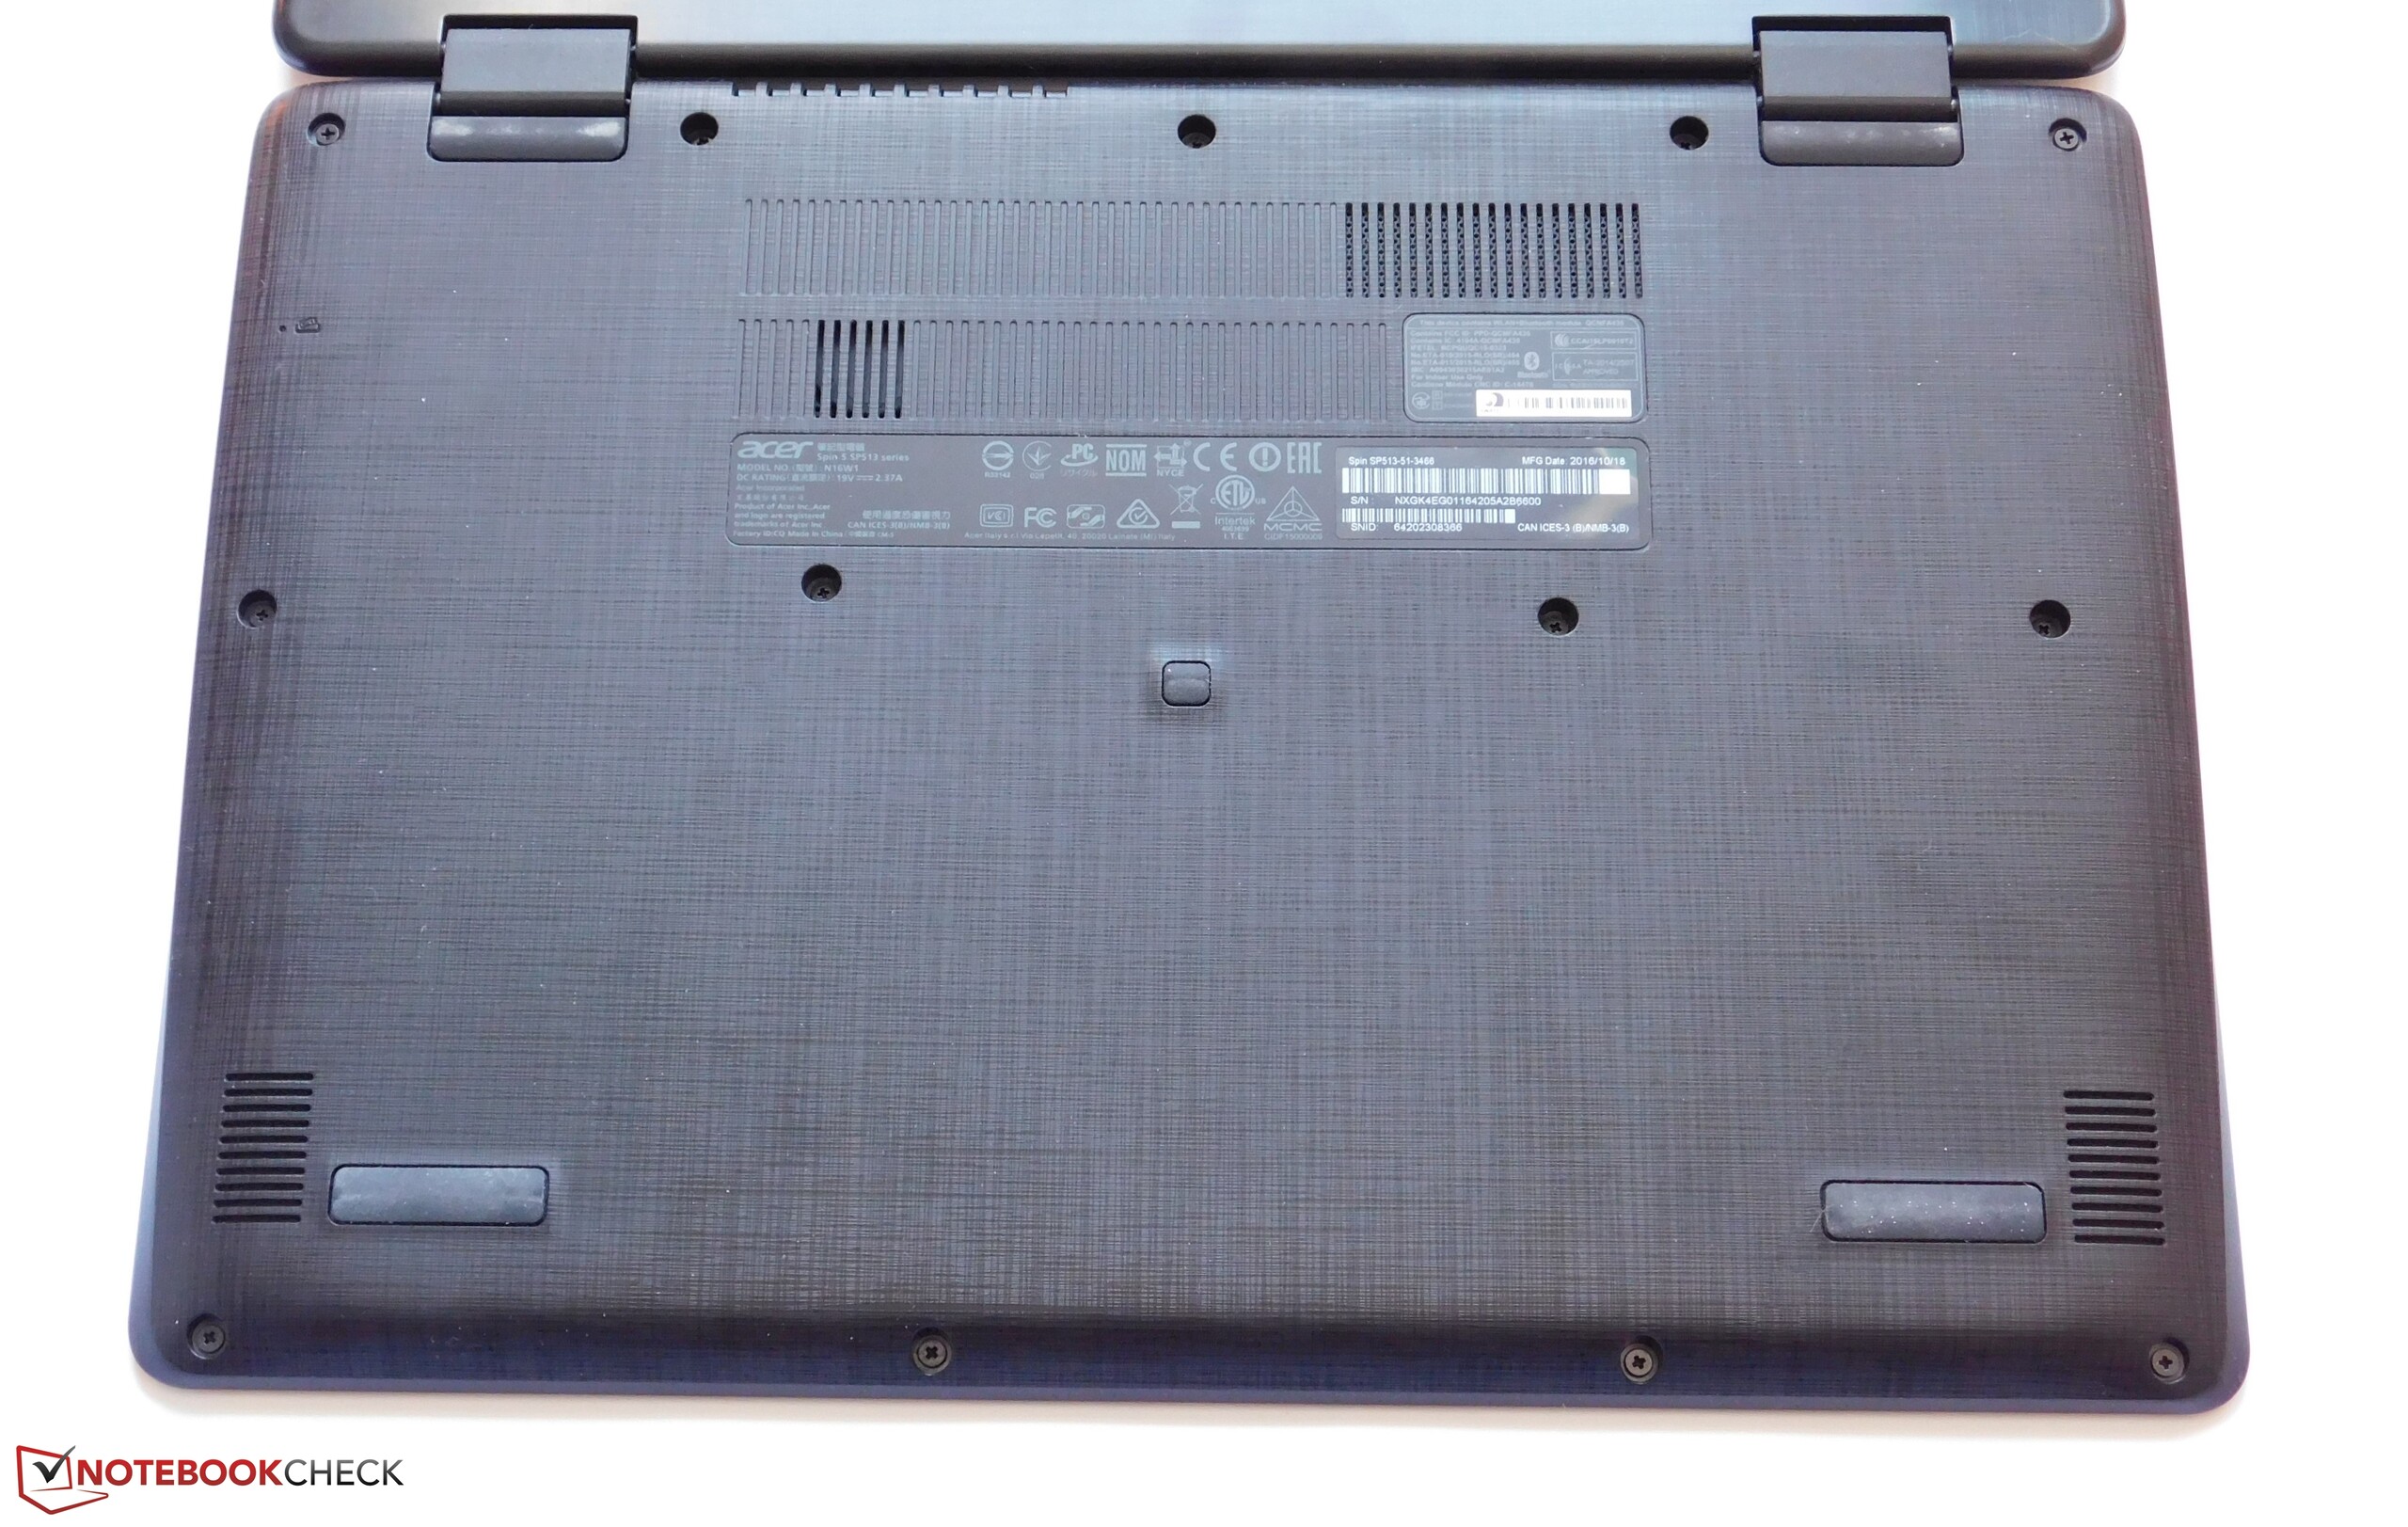
(+) La temperatura máxima en la parte superior es de 38.3 °C / 101 F, frente a la media de 35.4 °C / 96 F, que oscila entre 19.6 y 60 °C para la clase Convertible.
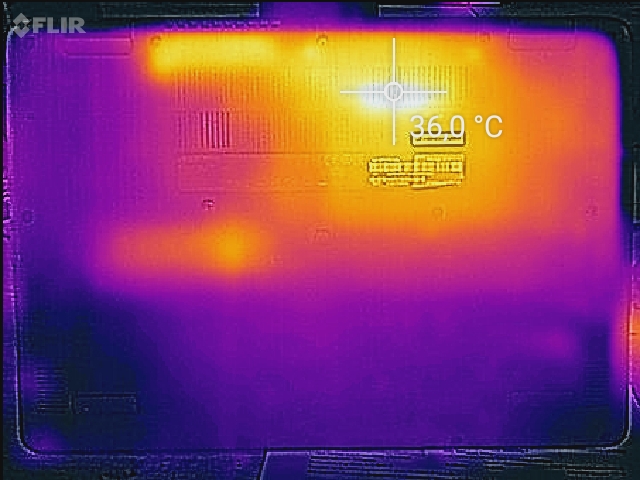
(±) El fondo se calienta hasta un máximo de 42.5 °C / 109 F, frente a la media de 36.9 °C / 98 F
(+) En reposo, la temperatura media de la parte superior es de 25.1 °C / 77# F, frente a la media del dispositivo de 30.3 °C / 87 F.
(+) El reposamanos y el panel táctil están a una temperatura inferior a la de la piel, con un máximo de 24 °C / 75.2 F y, por tanto, son fríos al tacto.
(+) La temperatura media de la zona del reposamanos de dispositivos similares fue de 28 °C / 82.4 F (+4 °C / 7.2 F).
Acer Spin 5 SP513-51 análisis de audio
(-) | altavoces no muy altos (#71 dB)
Graves 100 - 315 Hz
(-) | casi sin bajos - de media 23.4% inferior a la mediana
(±) | la linealidad de los graves es media (10.3% delta a frecuencia anterior)
Medios 400 - 2000 Hz
(+) | medios equilibrados - a sólo 4.1% de la mediana
(±) | la linealidad de los medios es media (11.9% delta respecto a la frecuencia anterior)
Altos 2 - 16 kHz
(+) | máximos equilibrados - a sólo 4.1% de la mediana
(+) | los máximos son lineales (5.4% delta a la frecuencia anterior)
Total 100 - 16.000 Hz
(±) | la linealidad del sonido global es media (22.7% de diferencia con la mediana)
En comparación con la misma clase
» 68% de todos los dispositivos probados de esta clase eran mejores, 5% similares, 27% peores
» El mejor tuvo un delta de 6%, la media fue 20%, el peor fue ###max##%
En comparación con todos los dispositivos probados
» 67% de todos los dispositivos probados eran mejores, 6% similares, 27% peores
» El mejor tuvo un delta de 4%, la media fue 23%, el peor fue ###max##%
Apple MacBook 12 (Early 2016) 1.1 GHz análisis de audio
(+) | los altavoces pueden reproducir a un volumen relativamente alto (#83.6 dB)
Graves 100 - 315 Hz
(±) | lubina reducida - en promedio 11.3% inferior a la mediana
(±) | la linealidad de los graves es media (14.2% delta a frecuencia anterior)
Medios 400 - 2000 Hz
(+) | medios equilibrados - a sólo 2.4% de la mediana
(+) | los medios son lineales (5.5% delta a la frecuencia anterior)
Altos 2 - 16 kHz
(+) | máximos equilibrados - a sólo 2% de la mediana
(+) | los máximos son lineales (4.5% delta a la frecuencia anterior)
Total 100 - 16.000 Hz
(+) | el sonido global es lineal (10.2% de diferencia con la mediana)
En comparación con la misma clase
» 7% de todos los dispositivos probados de esta clase eran mejores, 2% similares, 90% peores
» El mejor tuvo un delta de 5%, la media fue 18%, el peor fue ###max##%
En comparación con todos los dispositivos probados
» 5% de todos los dispositivos probados eran mejores, 1% similares, 94% peores
» El mejor tuvo un delta de 4%, la media fue 23%, el peor fue ###max##%
| Off / Standby | |
| Ocioso | |
| Carga |
|
Clave:
min: | |
| Acer Spin 5 SP513-51 6100U, HD Graphics 520, Hynix HFS128G39TND, IPS LED, 1920x1080, 13.3" | Acer Spin 7 SP714-51-M09D i5-7Y54, HD Graphics 615, Kingston RBUSNS4180S3256GG, IPS, 1920x1080, 14" | Dell Inspiron 13 7359-4839 6500U, HD Graphics 520, Liteonit LCH-256V2S, IPS, 1920x1080, 13.3" | Lenovo Yoga 510-14IKB i5-7200U, Radeon R5 M430, Samsung MZYTY256HDHP, IPS, 1920x1080, 14" | HP Pavilion x360 13-u102ng i5-7200U, HD Graphics 620, HGST Travelstar 5K1000 HTS541010A7E630, IPS, 1920x1080, 13.3" | |
|---|---|---|---|---|---|
| Power Consumption | -1% | -4% | -34% | -15% | |
| Idle Minimum * (Watt) | 4.1 | 4.3 -5% | 4 2% | 3.9 5% | 4.7 -15% |
| Idle Average * (Watt) | 6.8 | 7.4 -9% | 4.8 29% | 7.1 -4% | 7.2 -6% |
| Idle Maximum * (Watt) | 7.9 | 8 -1% | 7.6 4% | 7.7 3% | 7.9 -0% |
| Load Average * (Watt) | 20.4 | 22.1 -8% | 30 -47% | 33.4 -64% | 30 -47% |
| Load Maximum * (Watt) | 26.8 | 21.7 19% | 29.3 -9% | 55.9 -109% | 29 -8% |
* ... más pequeño es mejor
| Acer Spin 5 SP513-51 6100U, HD Graphics 520, 45 Wh | Acer Spin 7 SP714-51-M09D i5-7Y54, HD Graphics 615, 42 Wh | Dell Inspiron 13 7359-4839 6500U, HD Graphics 520, 44 Wh | Lenovo Yoga 510-14IKB i5-7200U, Radeon R5 M430, 35 Wh | HP Pavilion x360 13-u102ng i5-7200U, HD Graphics 620, 41 Wh | Lenovo Yoga 910-13IKB-80VF004CGE i7-7500U, HD Graphics 620, 78 Wh | |
|---|---|---|---|---|---|---|
| Duración de Batería | 2% | 2% | -15% | -31% | 38% | |
| Reader / Idle (h) | 12.5 | 12.5 0% | 14.8 18% | 12 -4% | 9.3 -26% | 17.8 42% |
| WiFi v1.3 (h) | 7.7 | 6.5 -16% | 8.1 5% | 6.2 -19% | 5.4 -30% | 10.7 39% |
| Load (h) | 2.2 | 2.7 23% | 1.8 -18% | 1.7 -23% | 1.4 -36% | 2.9 32% |
| H.264 (h) | 5.3 |
Pro
Contra
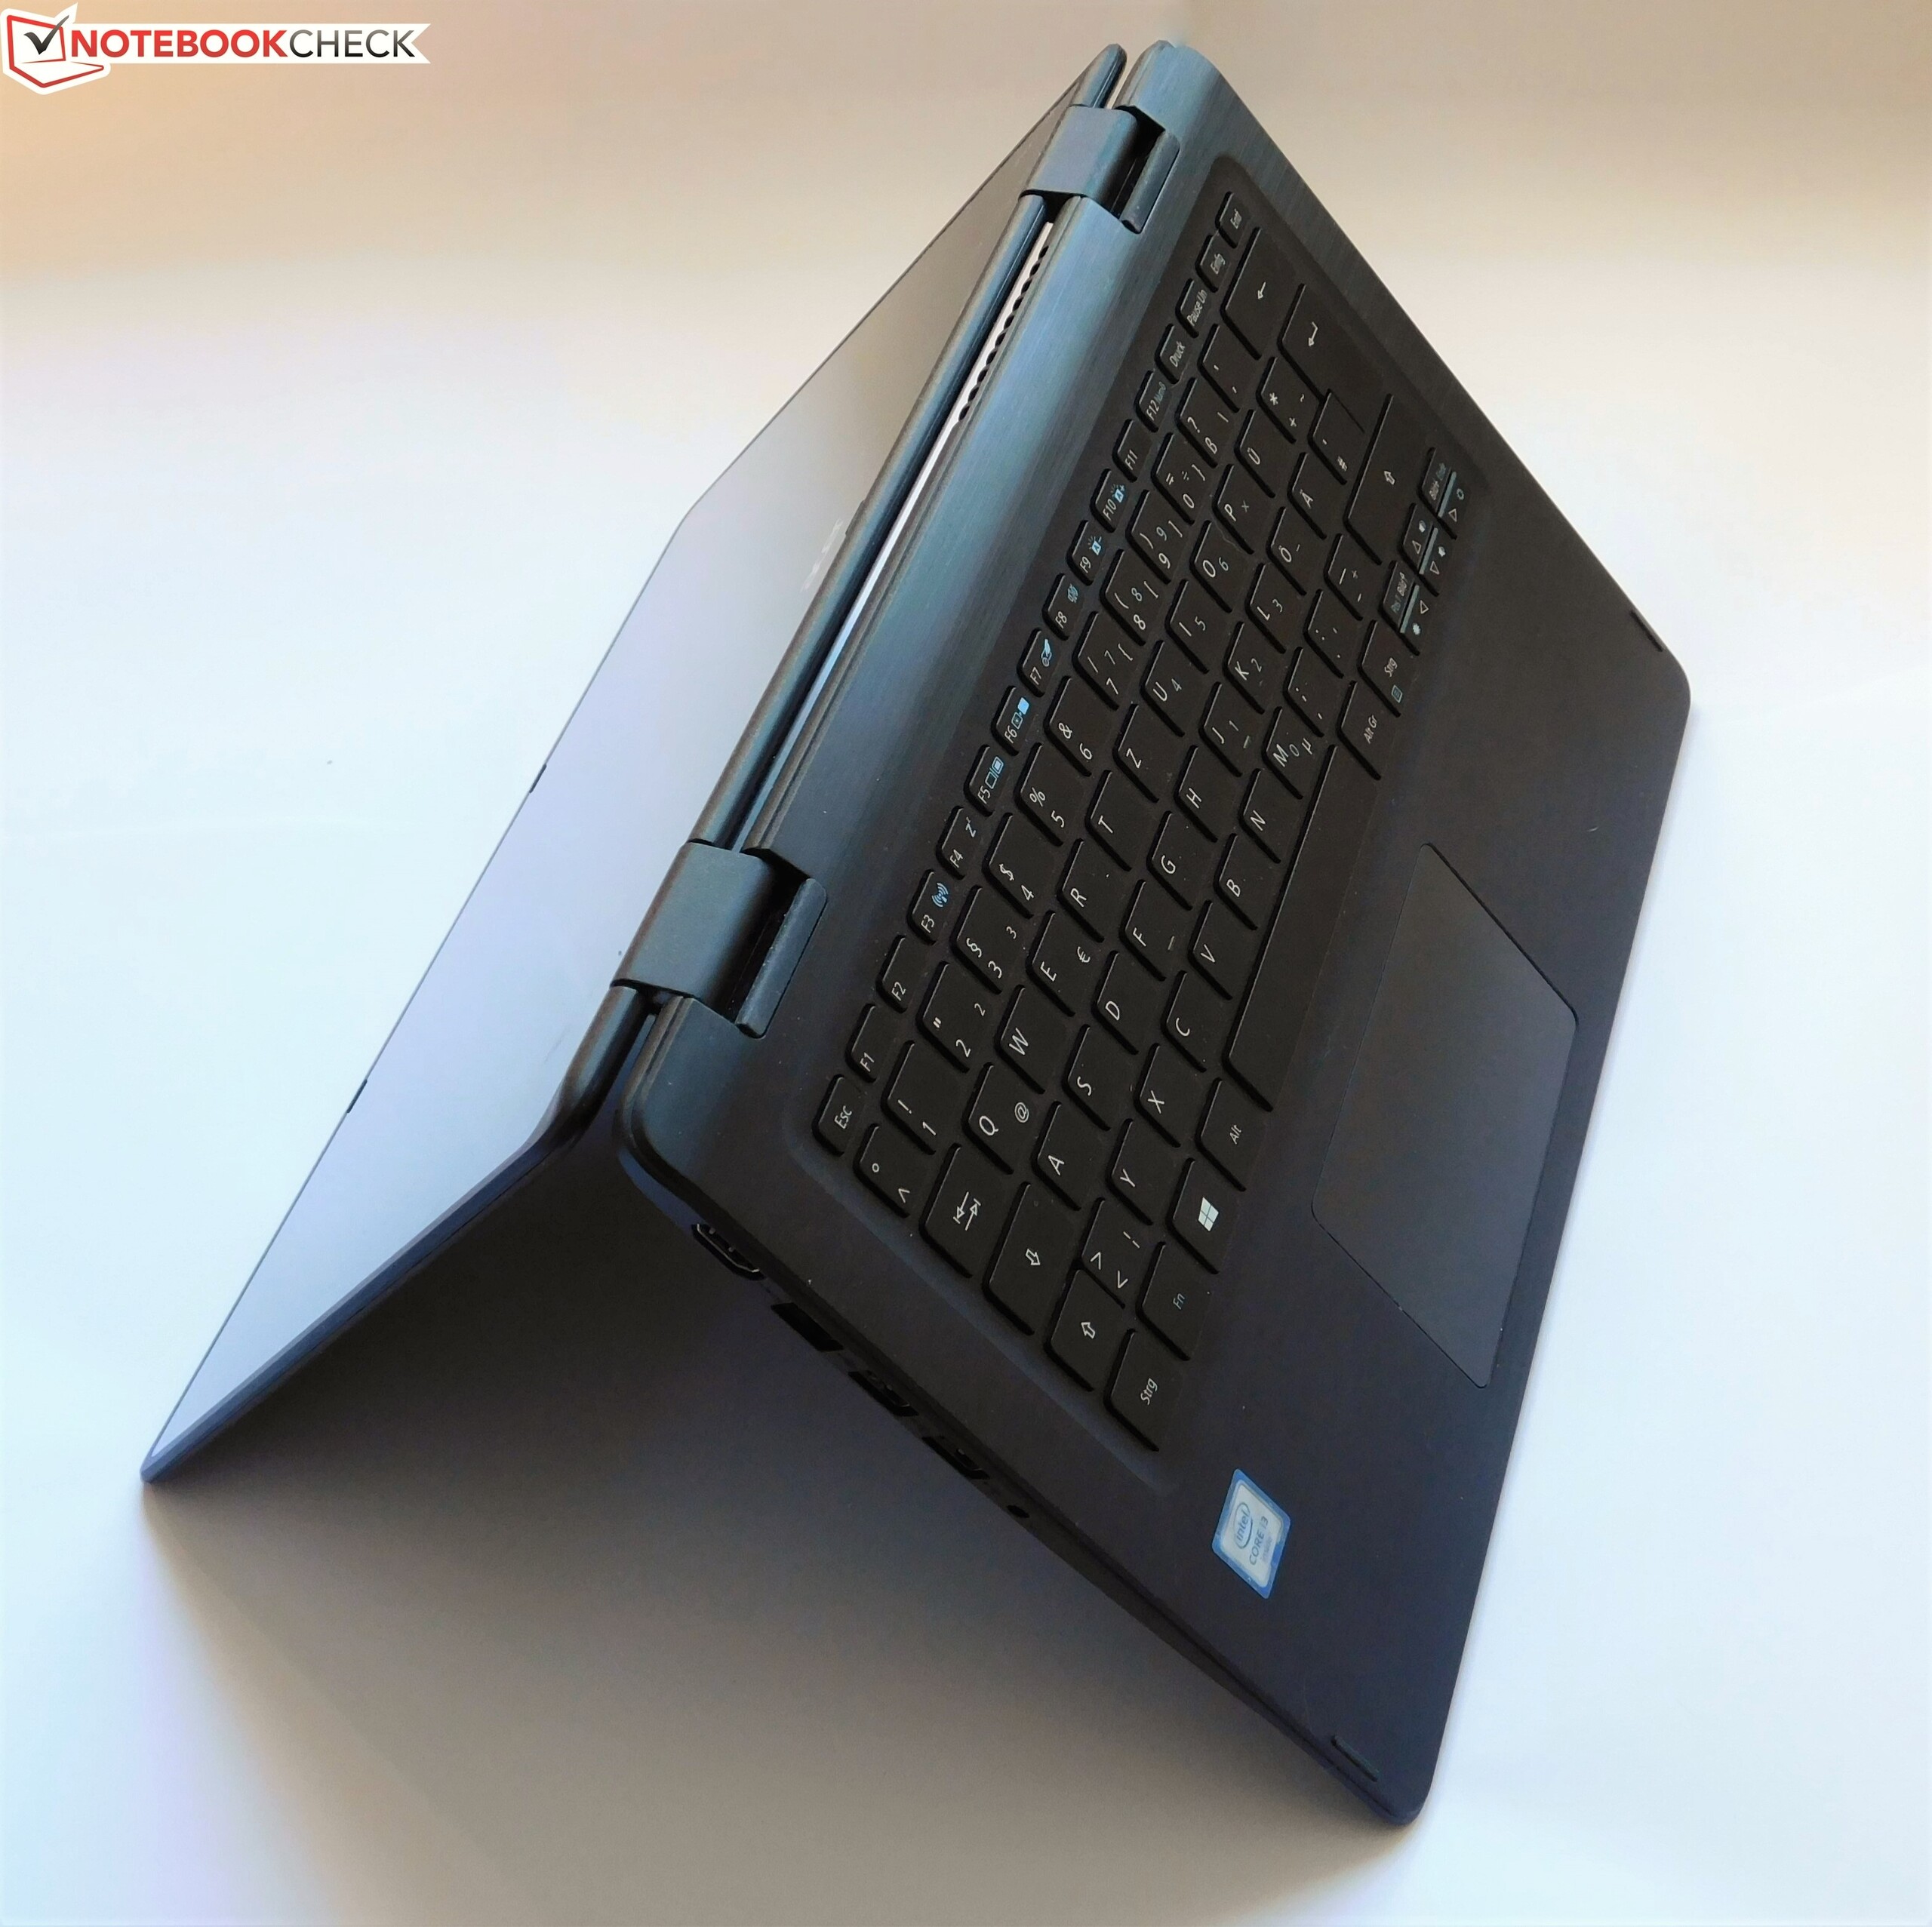
El Acer Spin 5 es un éxito. El modelo de pruebas convence con su ventilador quedo, buen rendimiento de ventilación, así como su preciso touchpad en particular. El chasis, la pantalla, y el aguante de batería están todos en la media y no revelan defectos serios.
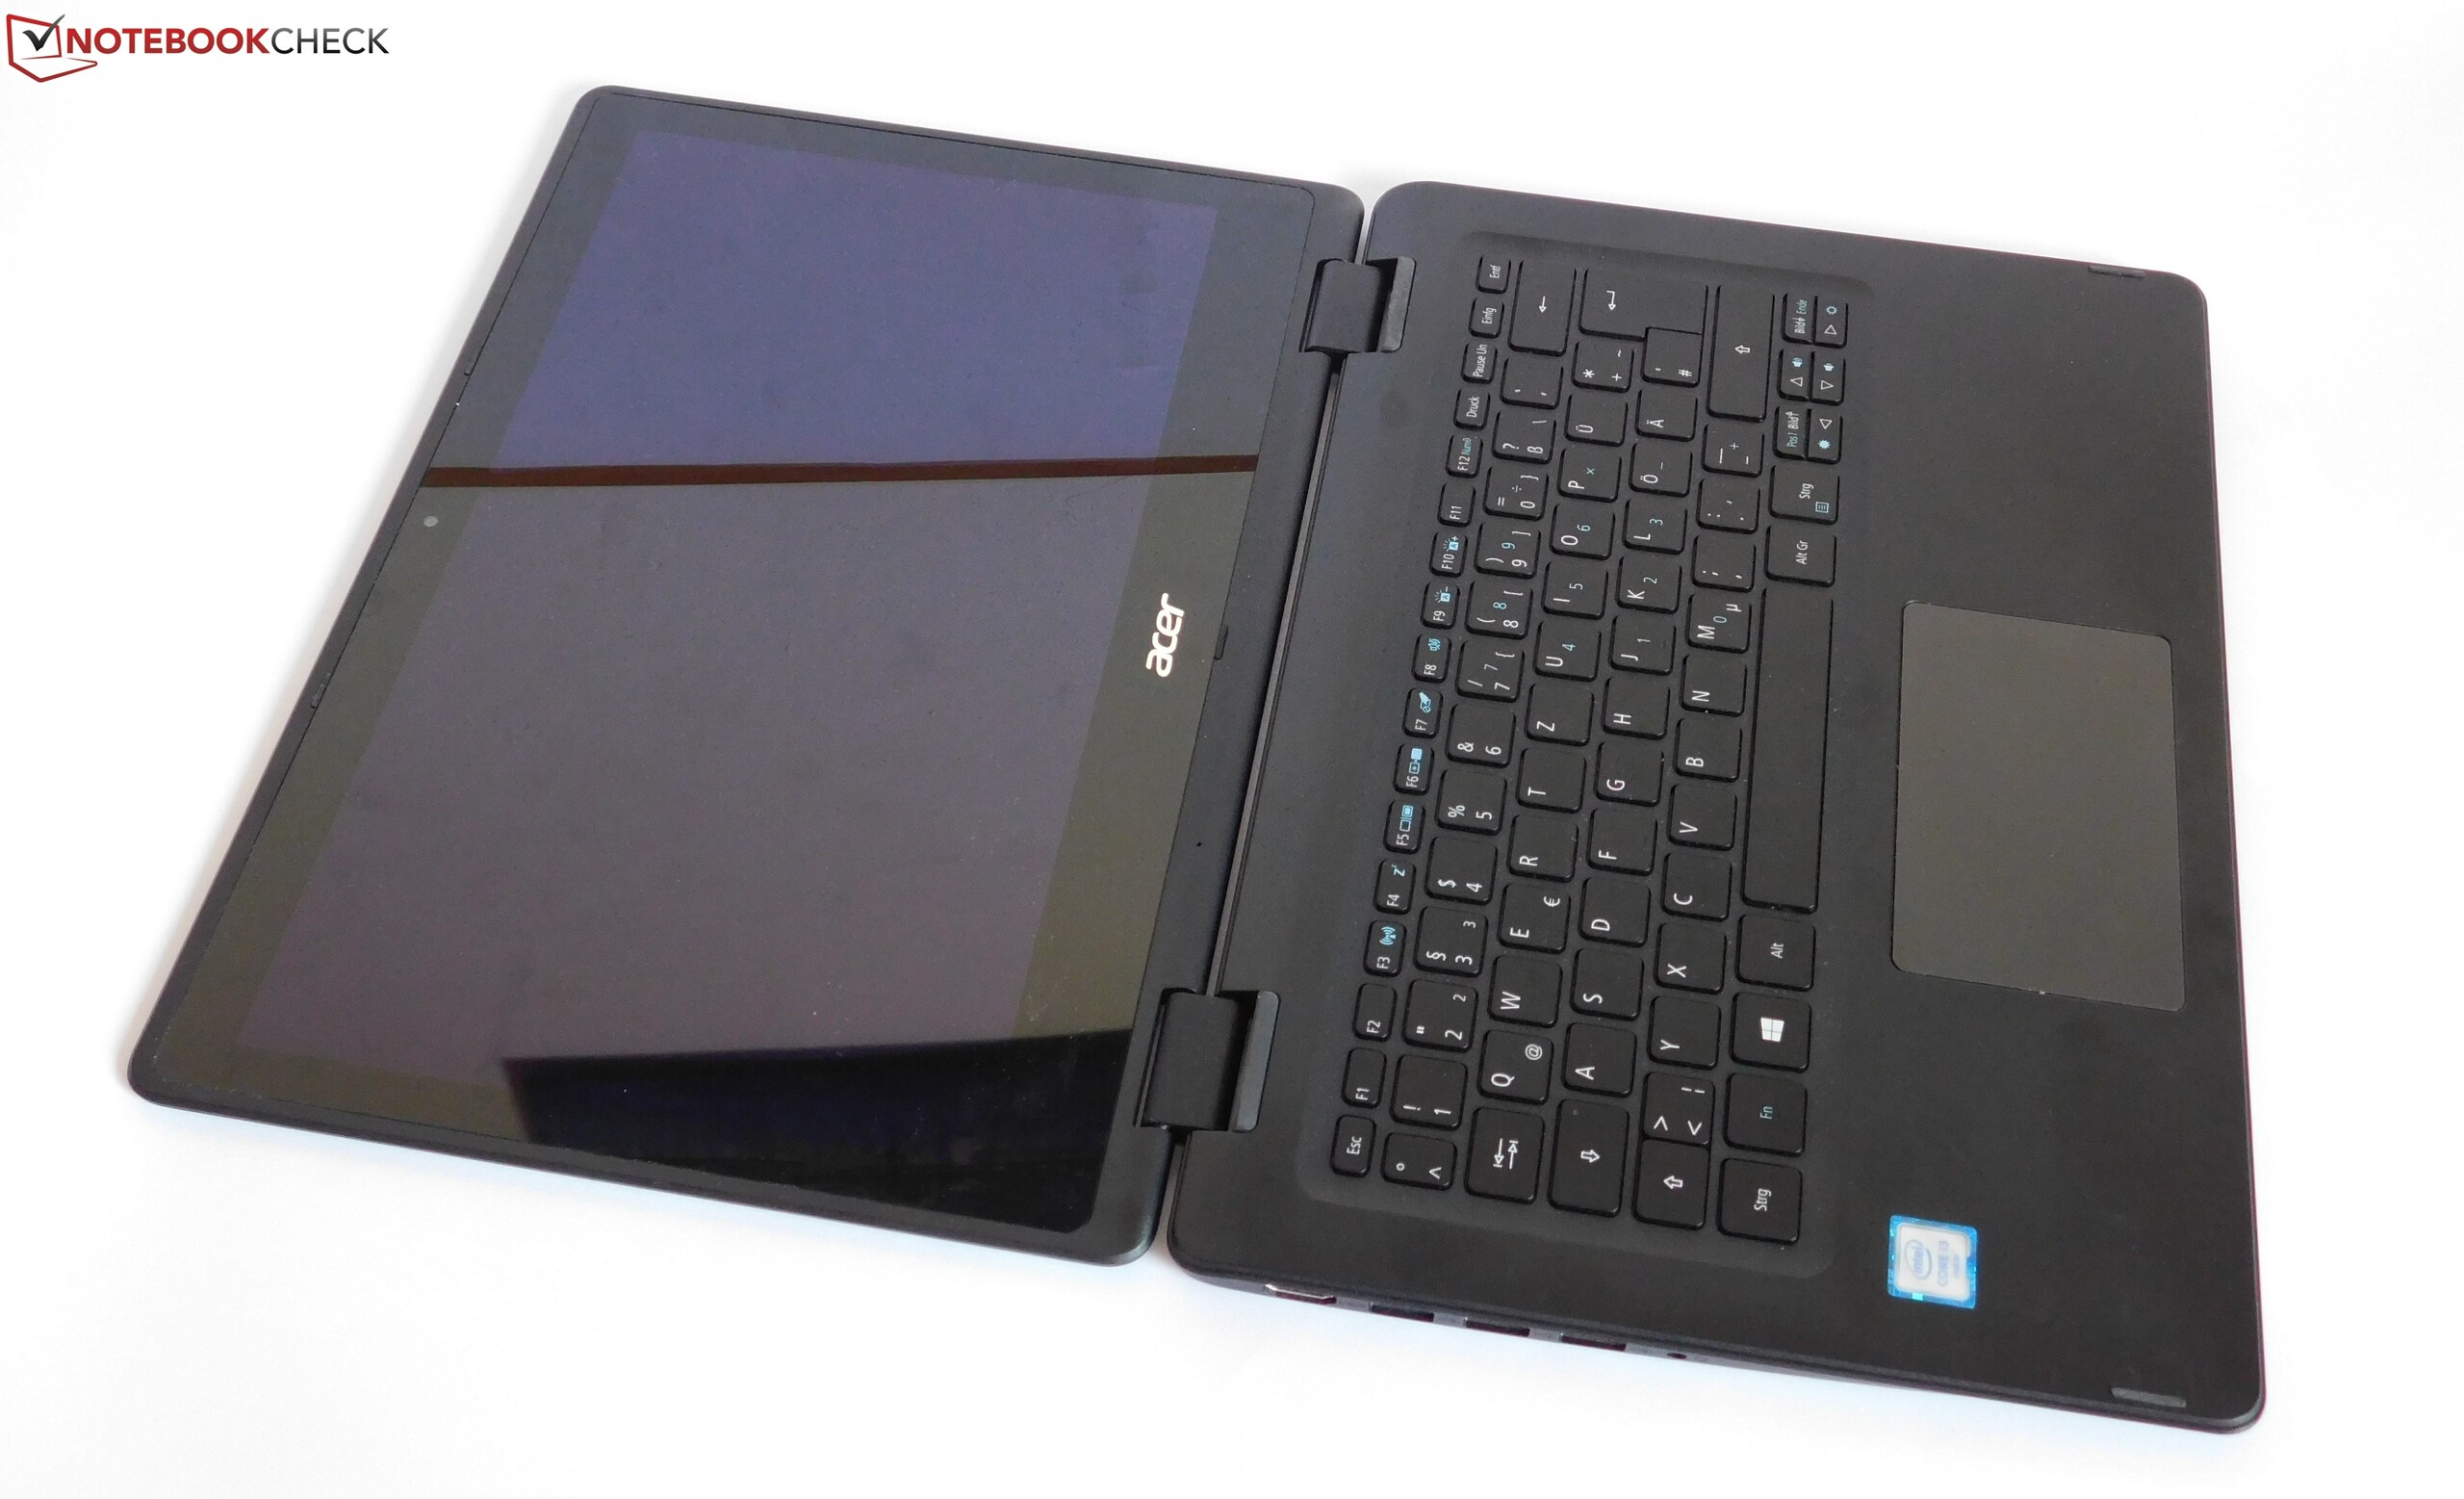
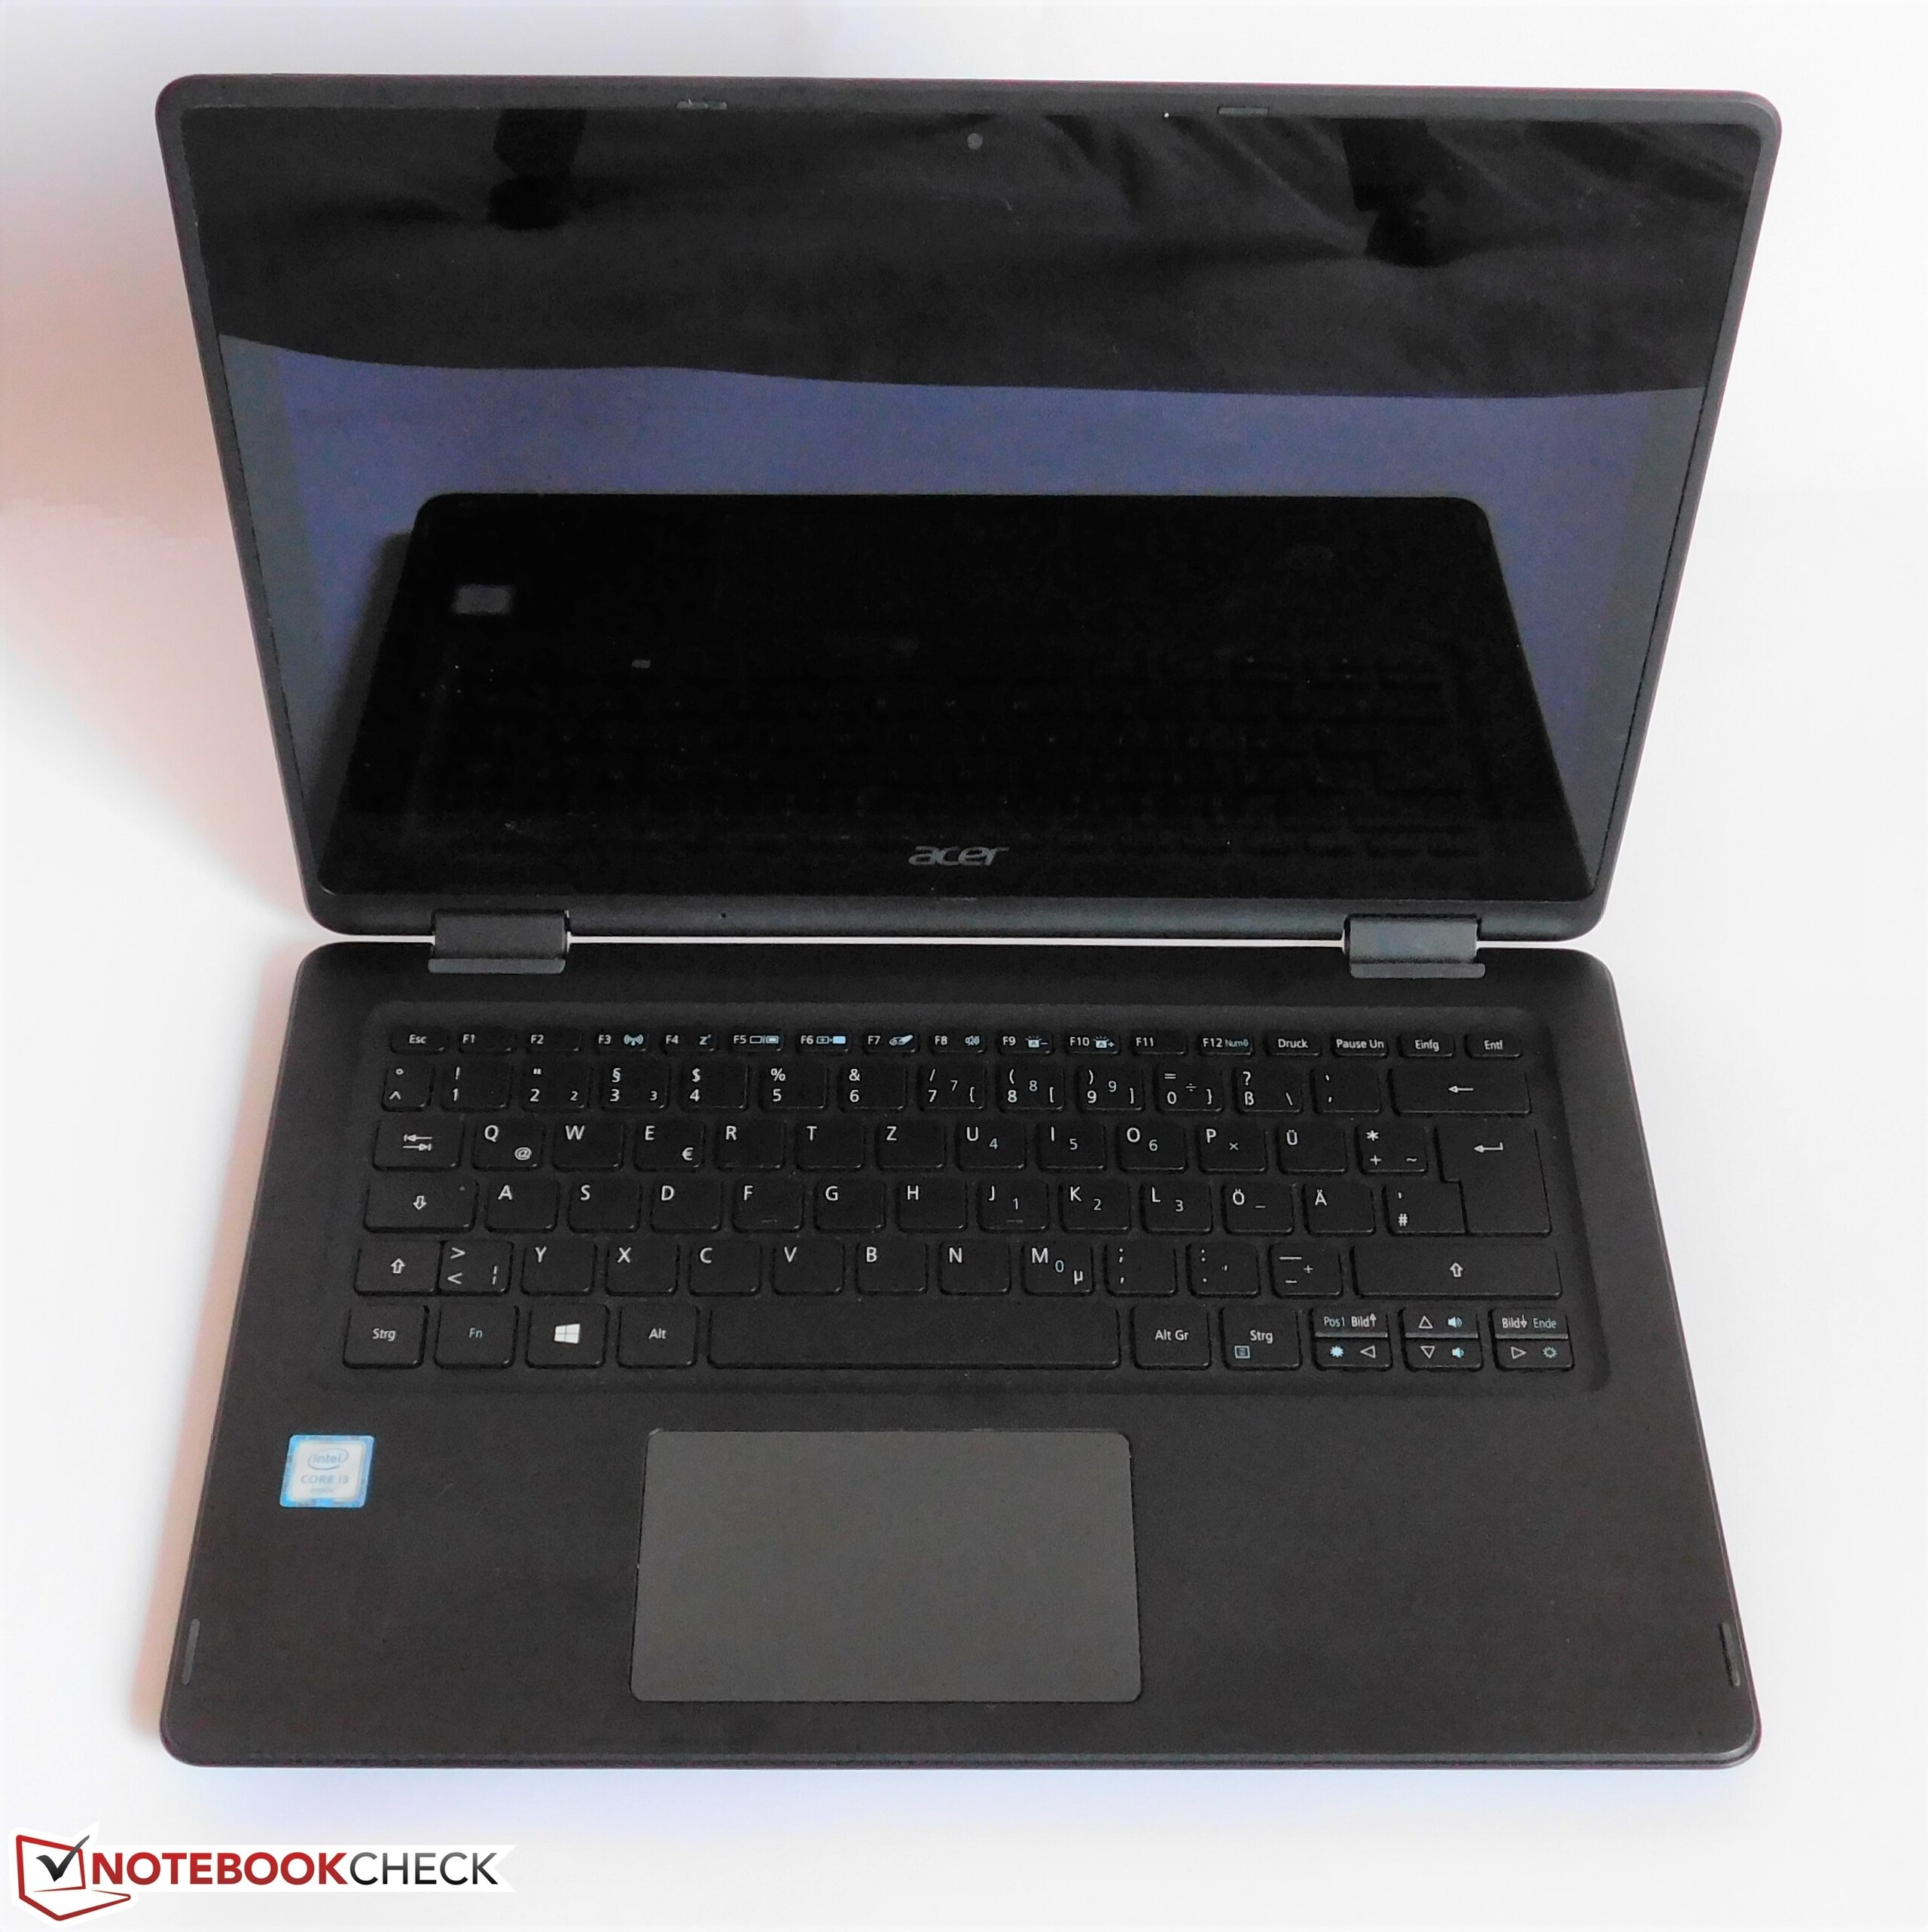
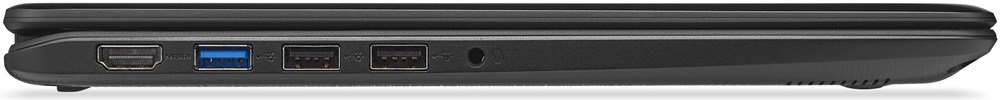
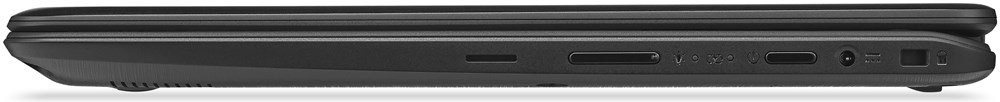
El teclado merece algo de crítica, ya que la experiencia de mecanografiado no es satisfactoria y la distribución está muy apretujada, lo que puede dar pie a errores. Luego están los puertos: Falta un puerto moderno USB Type-C, al igual que un lector de tarjetas SD de tamaño completo (lector microSD). Los largos tiempos de carga también son molestos.
Podemos recomendar el Acer Spin 5. Hay muchos aspectos positivos, sólo el teclado se queda algo corto. Las mayores ventajas son las emisiones con el quedo ventilador y las bajas temperaturas.
Con todo, el Acer Spin 5 sigue mereciéndose una recomendación. Es un dispositivo barato para navegar y aplicaciones ofimáticas, dónde funciona bien. La Core i3 no es particularmente potente, pero el portátil siempre está fresco y quedo a cambio.
Sin embargo, la competencia logra mejores relaciones precio-rendimiento: El Lenovo Yoga 510-14IKB con Core i3-7100U, 128 GB de SSD y 4 GB de RAM es 50 Euros más barato. El HP Pavilion x360 13 cuesta tanto como el Acer Spin 5, pero está equipado con la nueva Core i5-7200U y 8 GB de RAM, pero con un HDD de 1 TB en vez de un SSD de 128 GB, por lo que tendrás que decidir entre rendimiento y capacidad. Luego está, obviamente, el ruido adicional del HDD.
Ésta es una versión acortada del análisis original. Puedes leer el análisis completo en inglés aquí.
Acer Spin 5 SP513-51
- 01/23/2017 v6 (old)
Benjamin Herzig
Price comparison
