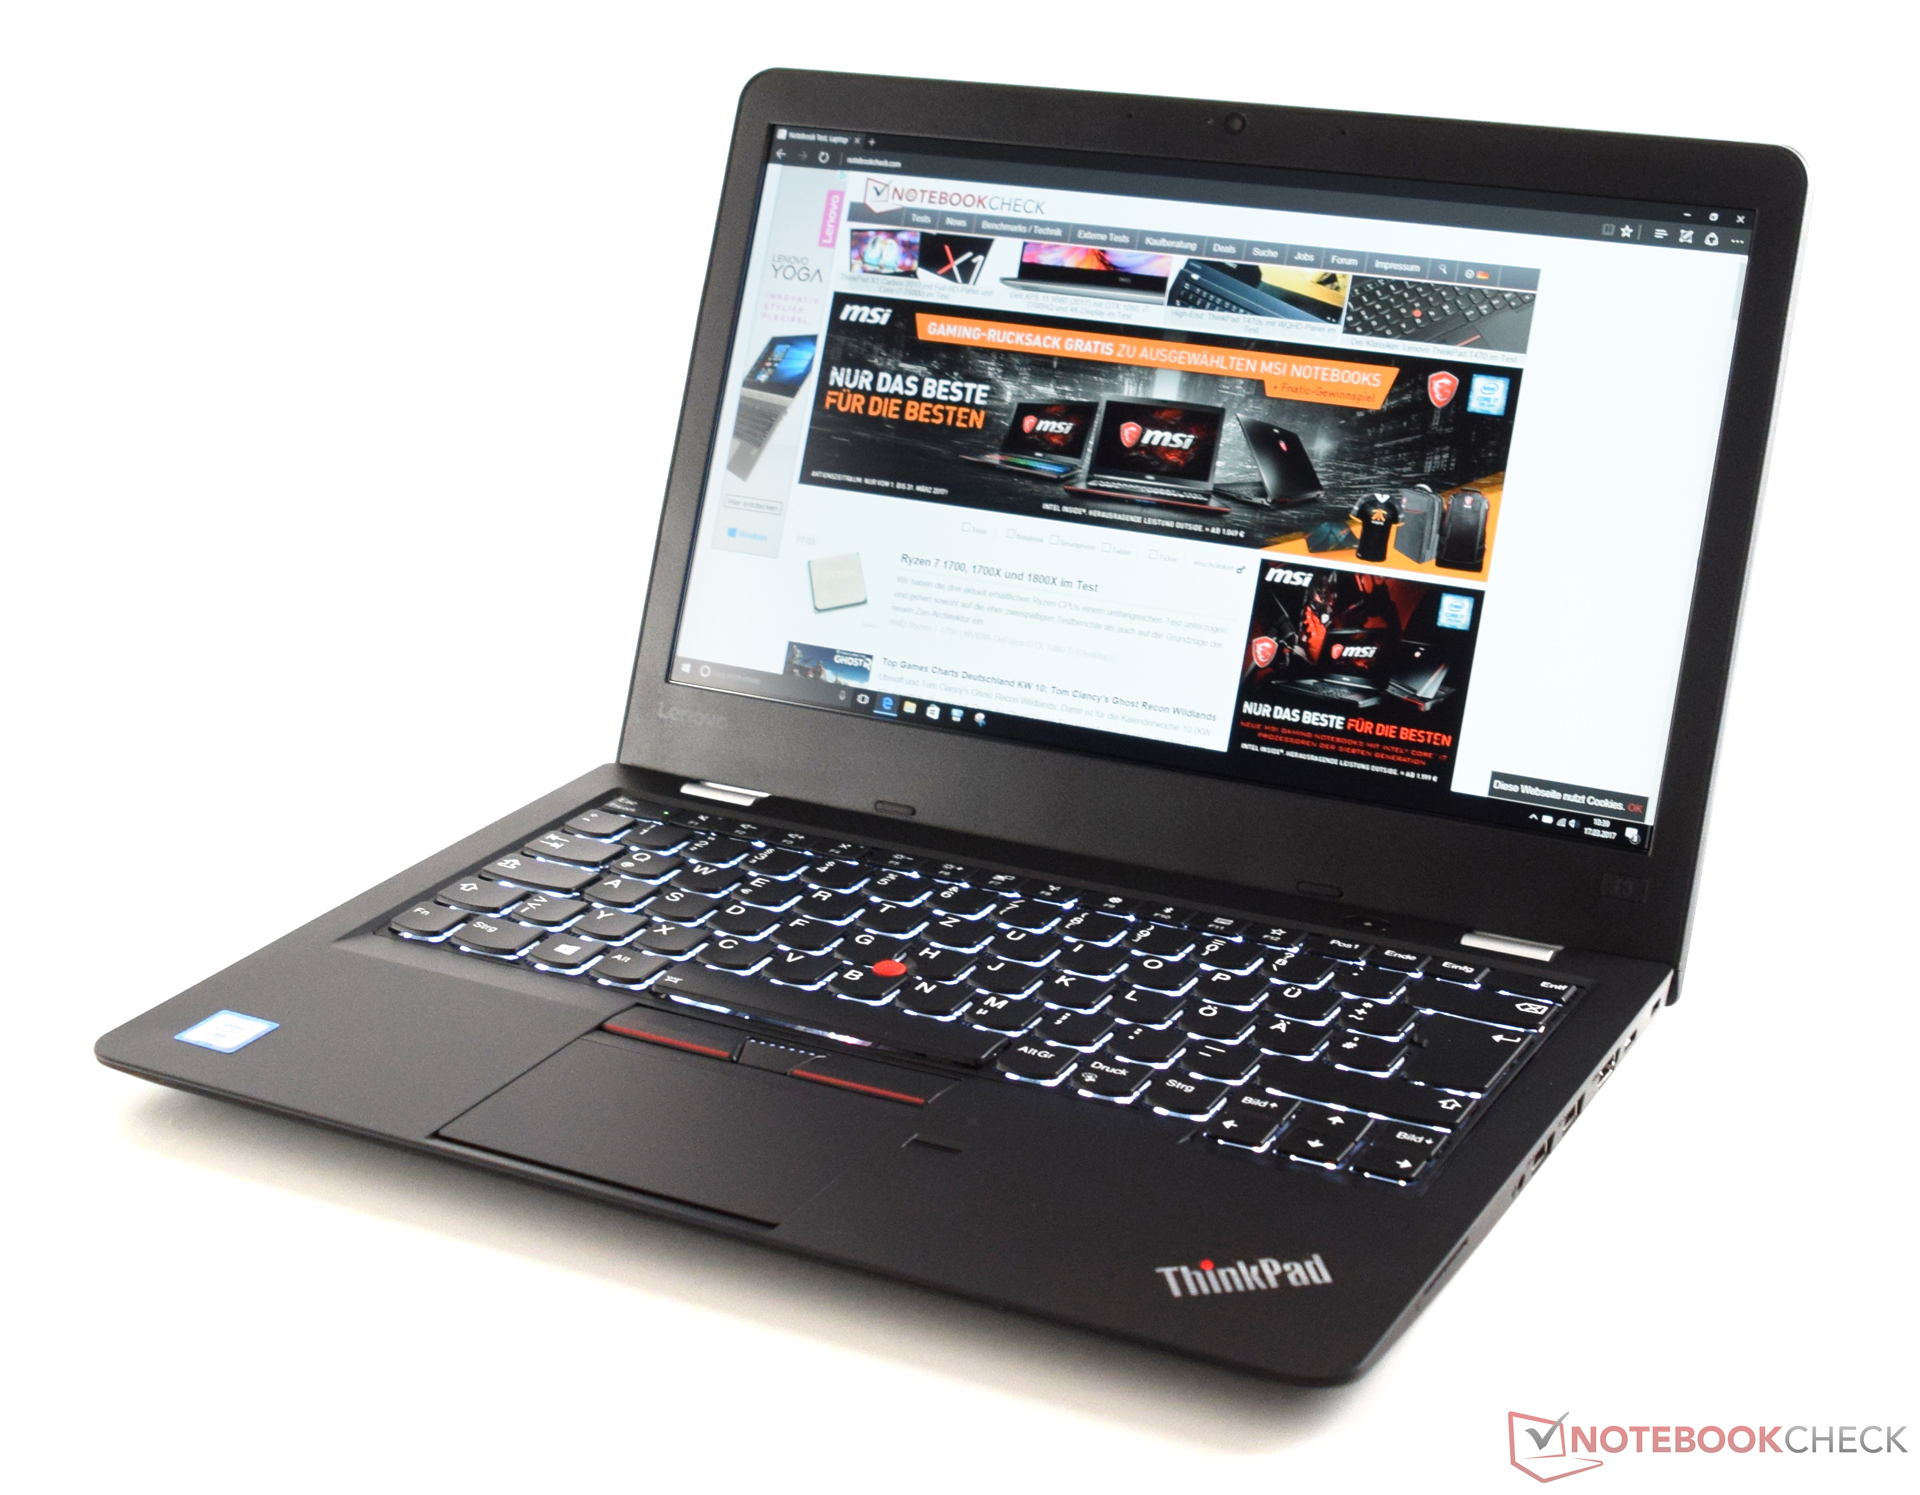
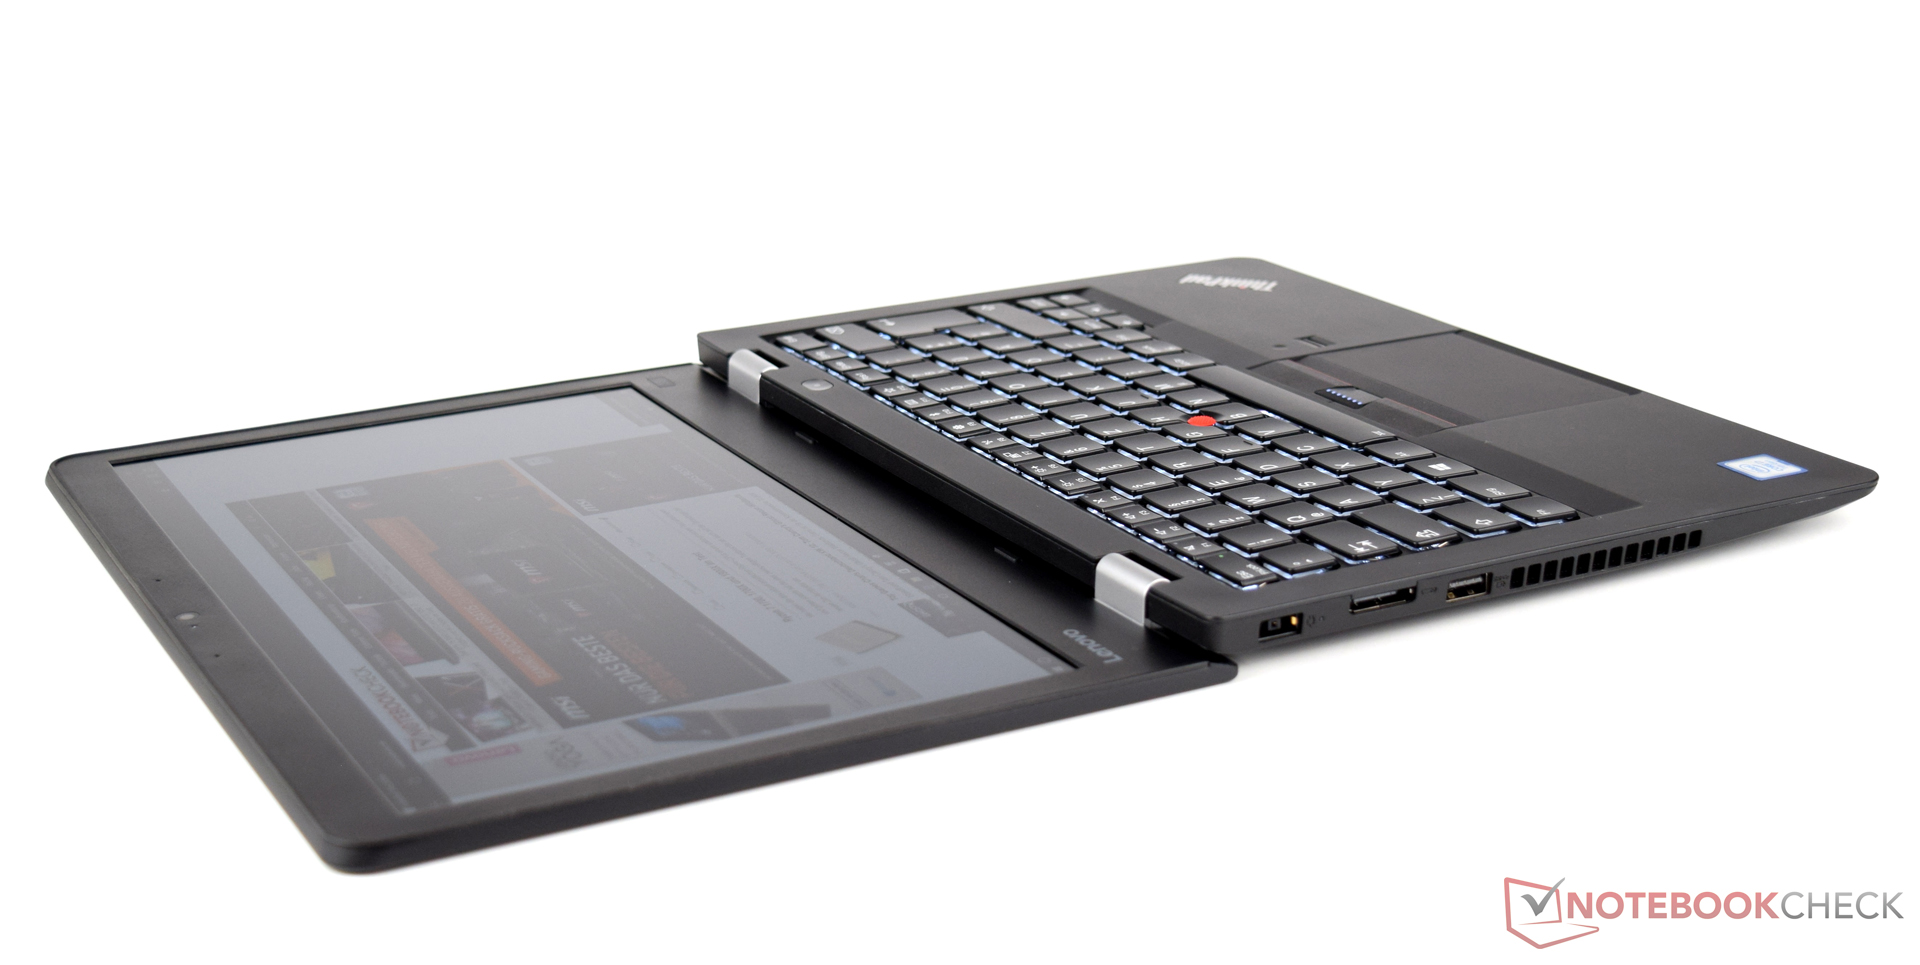
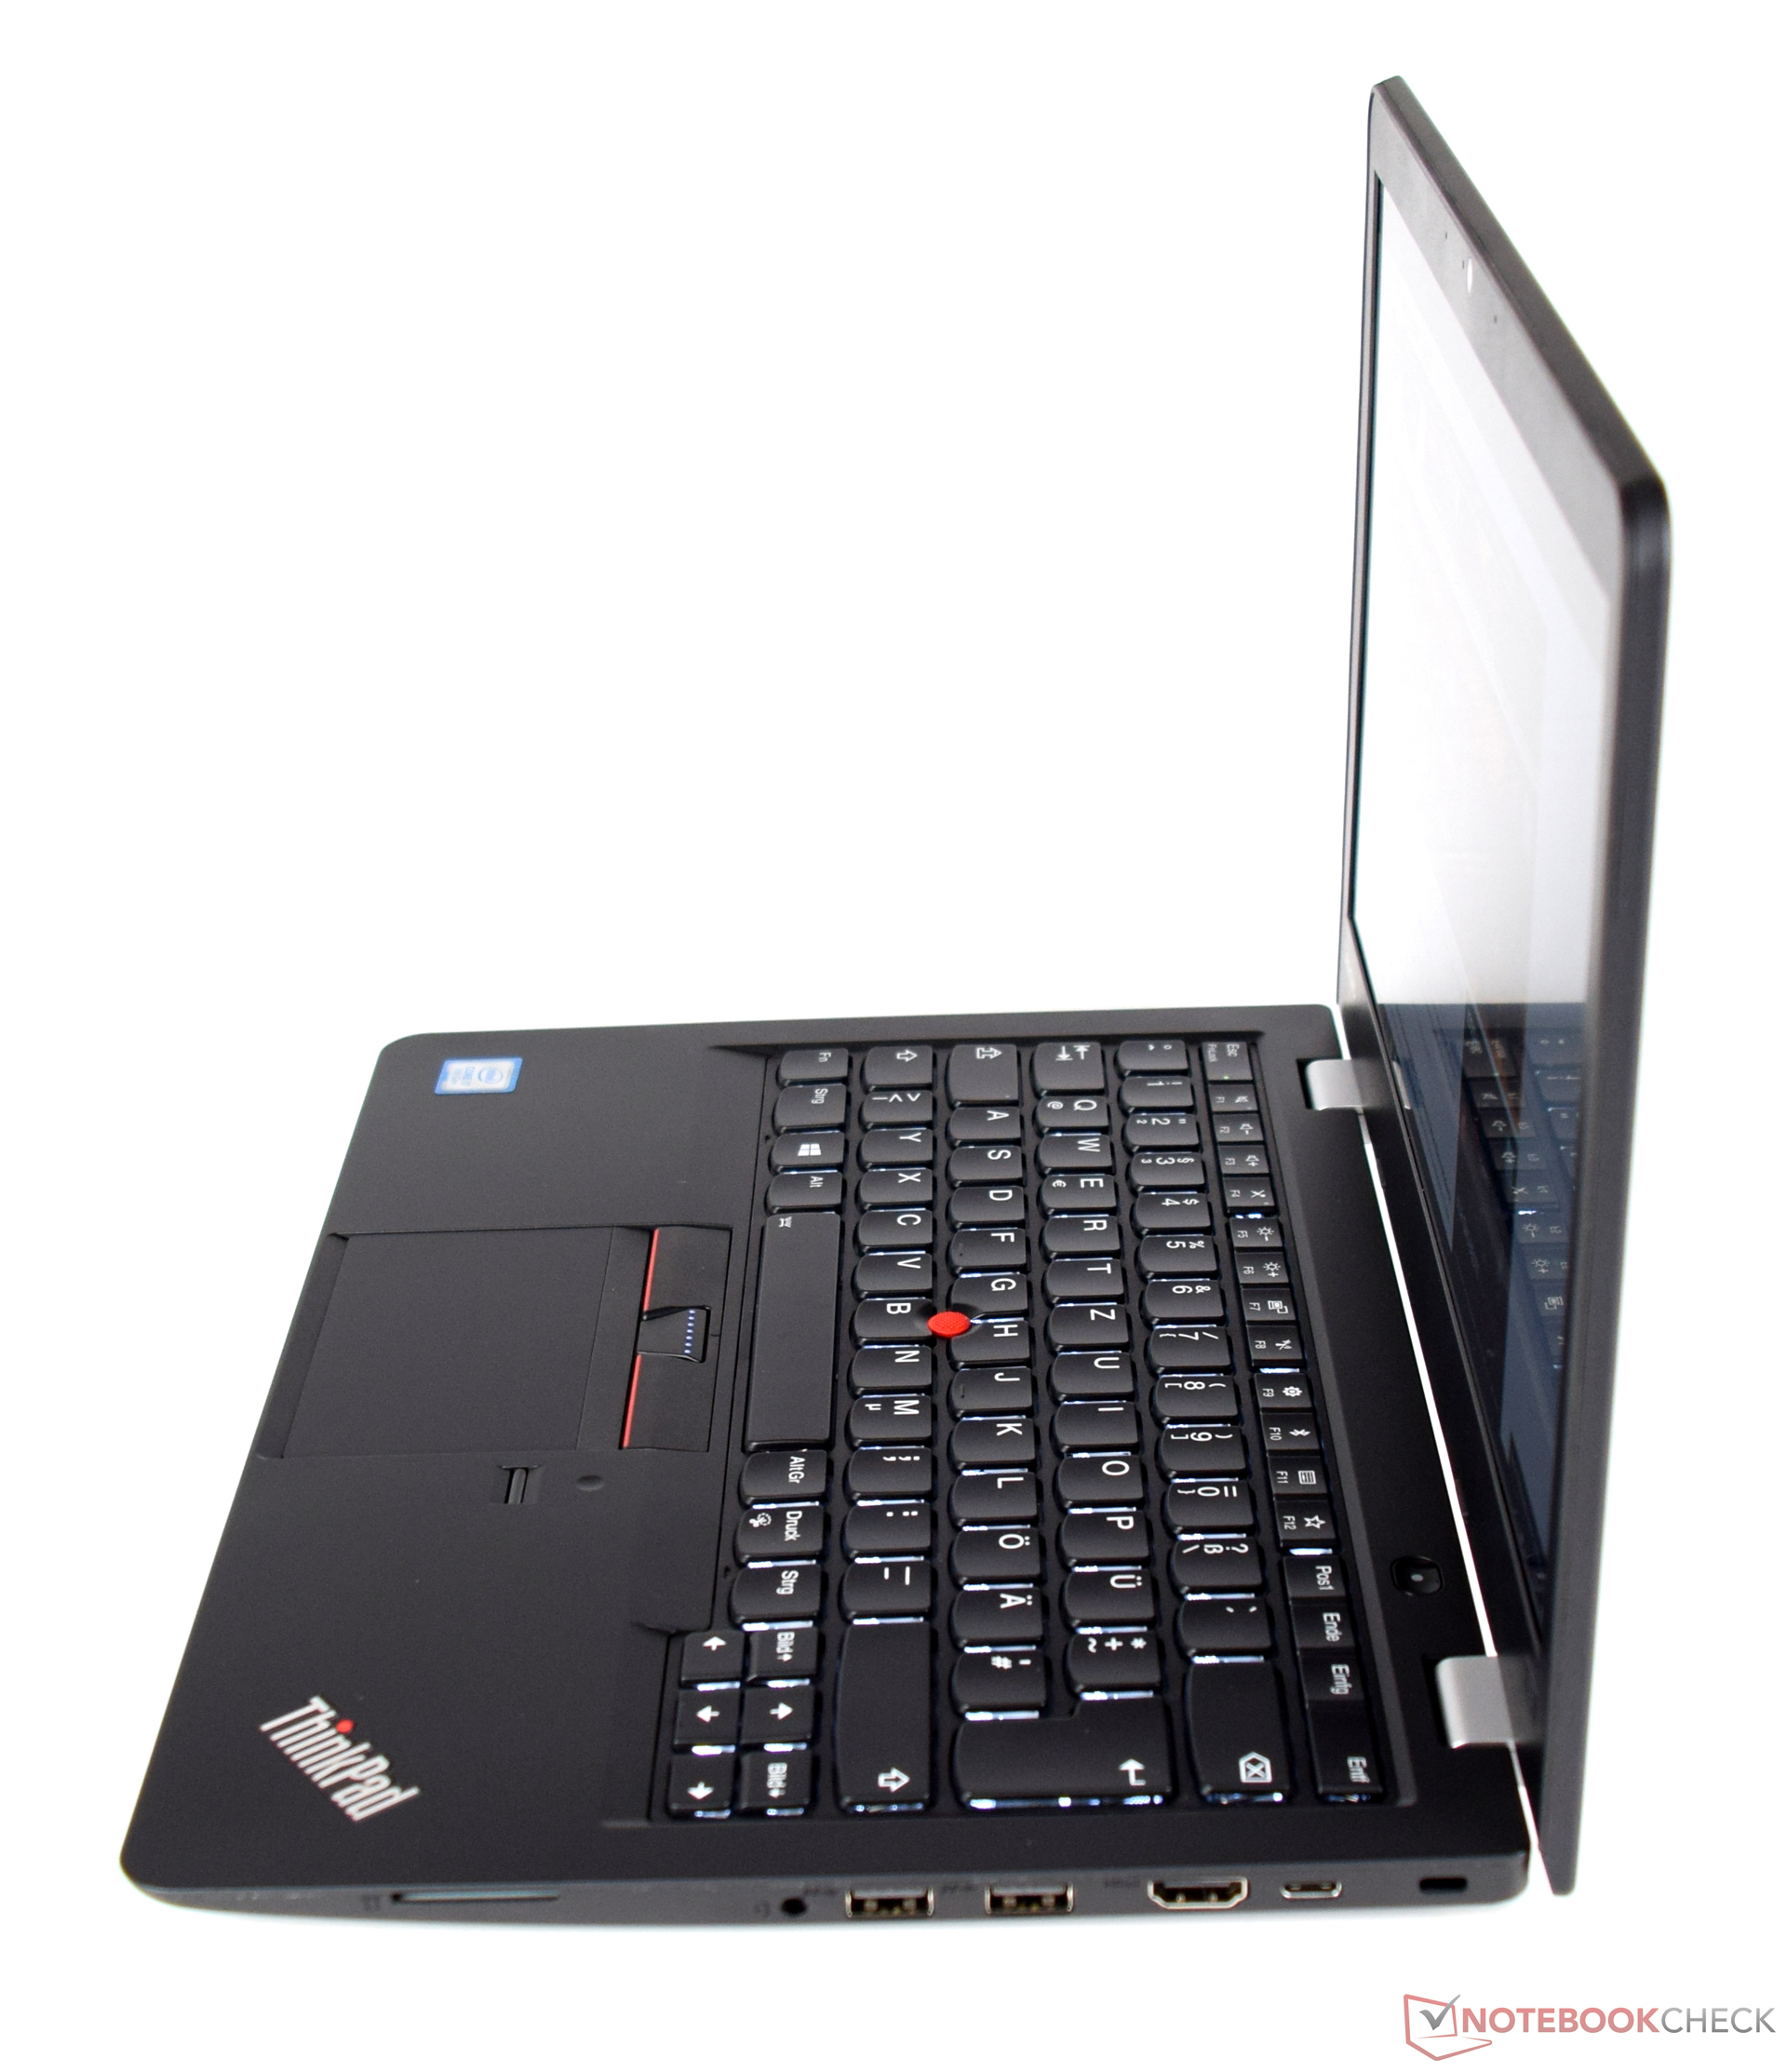
Breve análisis del Lenovo ThinkPad 13 2017 (Core i7, Full-HD)
| SD Card Reader | |
| average JPG Copy Test (av. of 3 runs) | |
| Dell XPS 13 9360 FHD i5 | |
| HP ProBook 430 G4-Y8B47EA | |
| Asus Zenbook UX310UA-FC347T iGP | |
| Lenovo ThinkPad 13-20GKS01100 | |
| Lenovo ThinkPad 13-20J2S00G00 | |
| maximum AS SSD Seq Read Test (1GB) | |
| Dell XPS 13 9360 FHD i5 | |
| HP ProBook 430 G4-Y8B47EA | |
| Asus Zenbook UX310UA-FC347T iGP | |
| Lenovo ThinkPad 13-20GKS01100 | |
| Lenovo ThinkPad 13-20J2S00G00 | |
| Networking | |
| iperf3 transmit AX12 | |
| Asus Zenbook UX310UA-FC347T iGP (jseb) | |
| Dell XPS 13 9360 FHD i5 | |
| Lenovo ThinkPad 13-20J2S00G00 | |
| iperf3 receive AX12 | |
| Lenovo ThinkPad 13-20J2S00G00 | |
| Dell XPS 13 9360 FHD i5 | |
| Asus Zenbook UX310UA-FC347T iGP (jseb) | |
| |||||||||||||||||||||||||
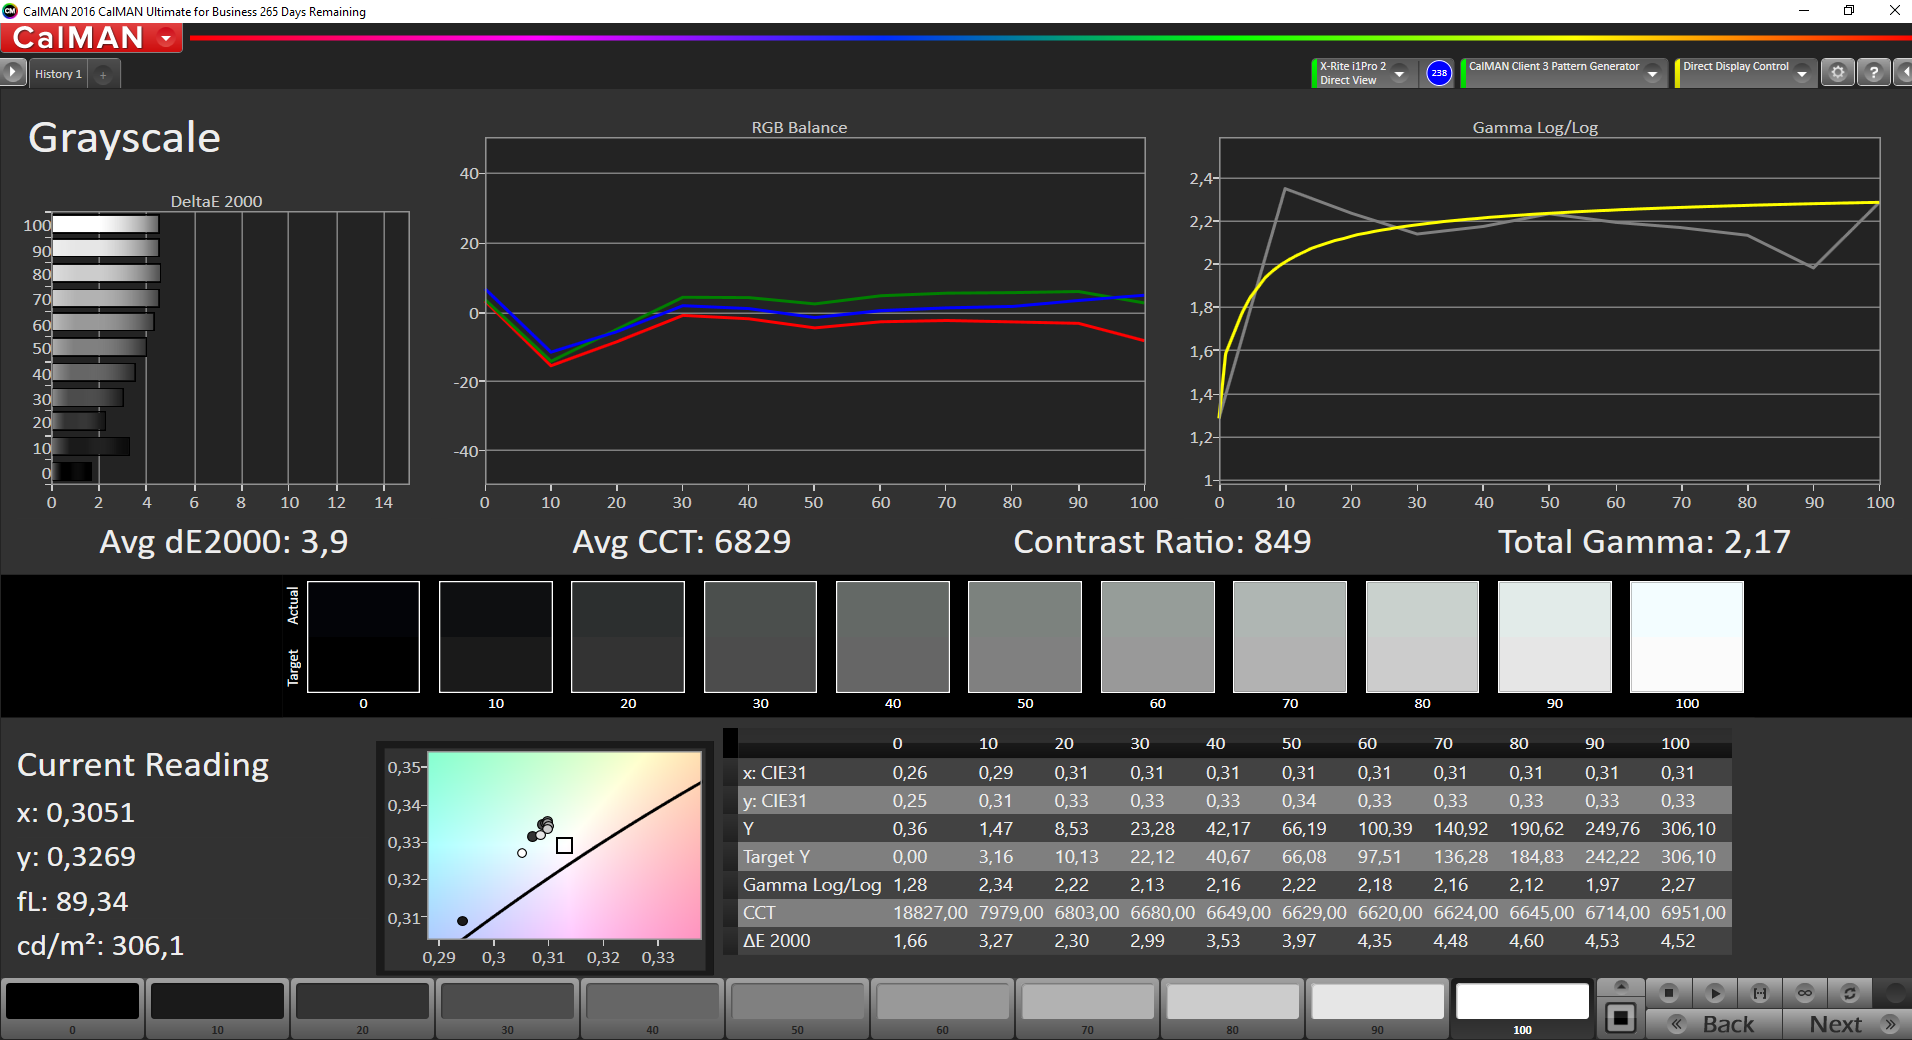
iluminación: 89 %
Brillo con batería: 306 cd/m²
Contraste: 850:1 (Negro: 0.36 cd/m²)
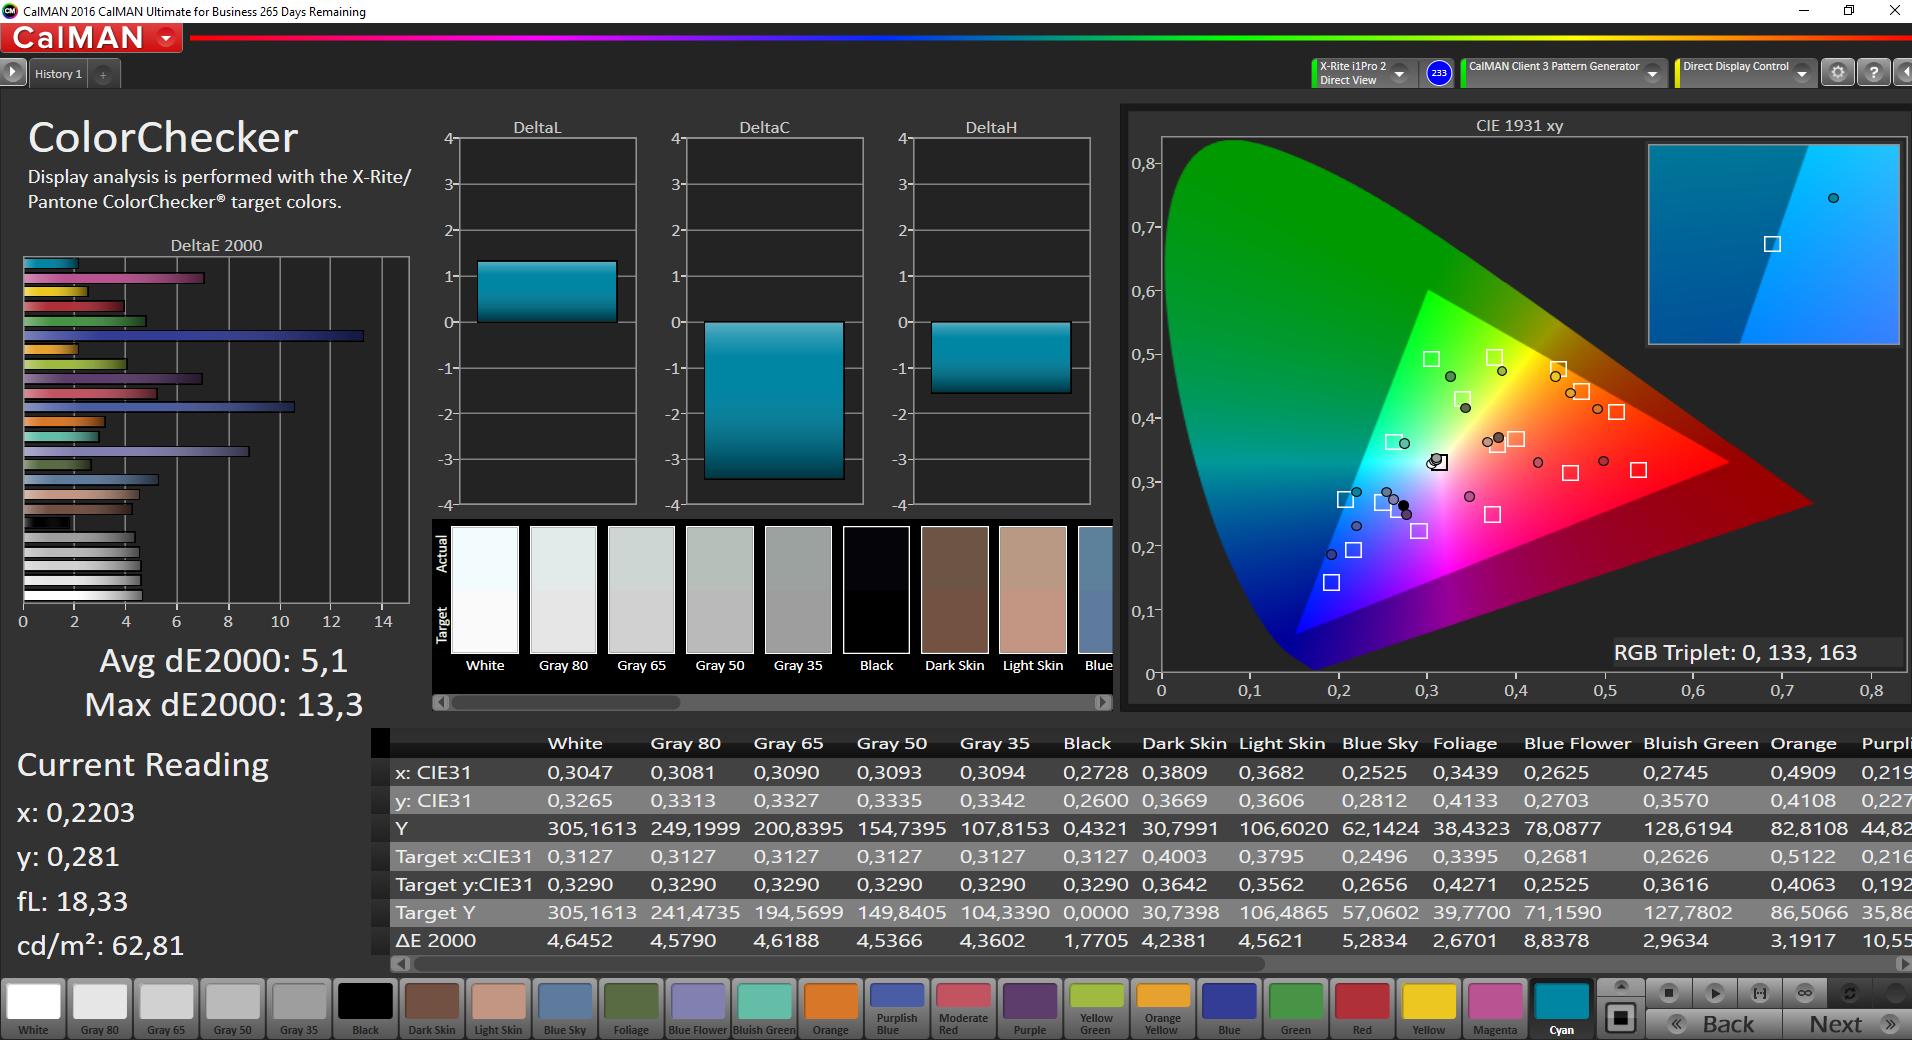
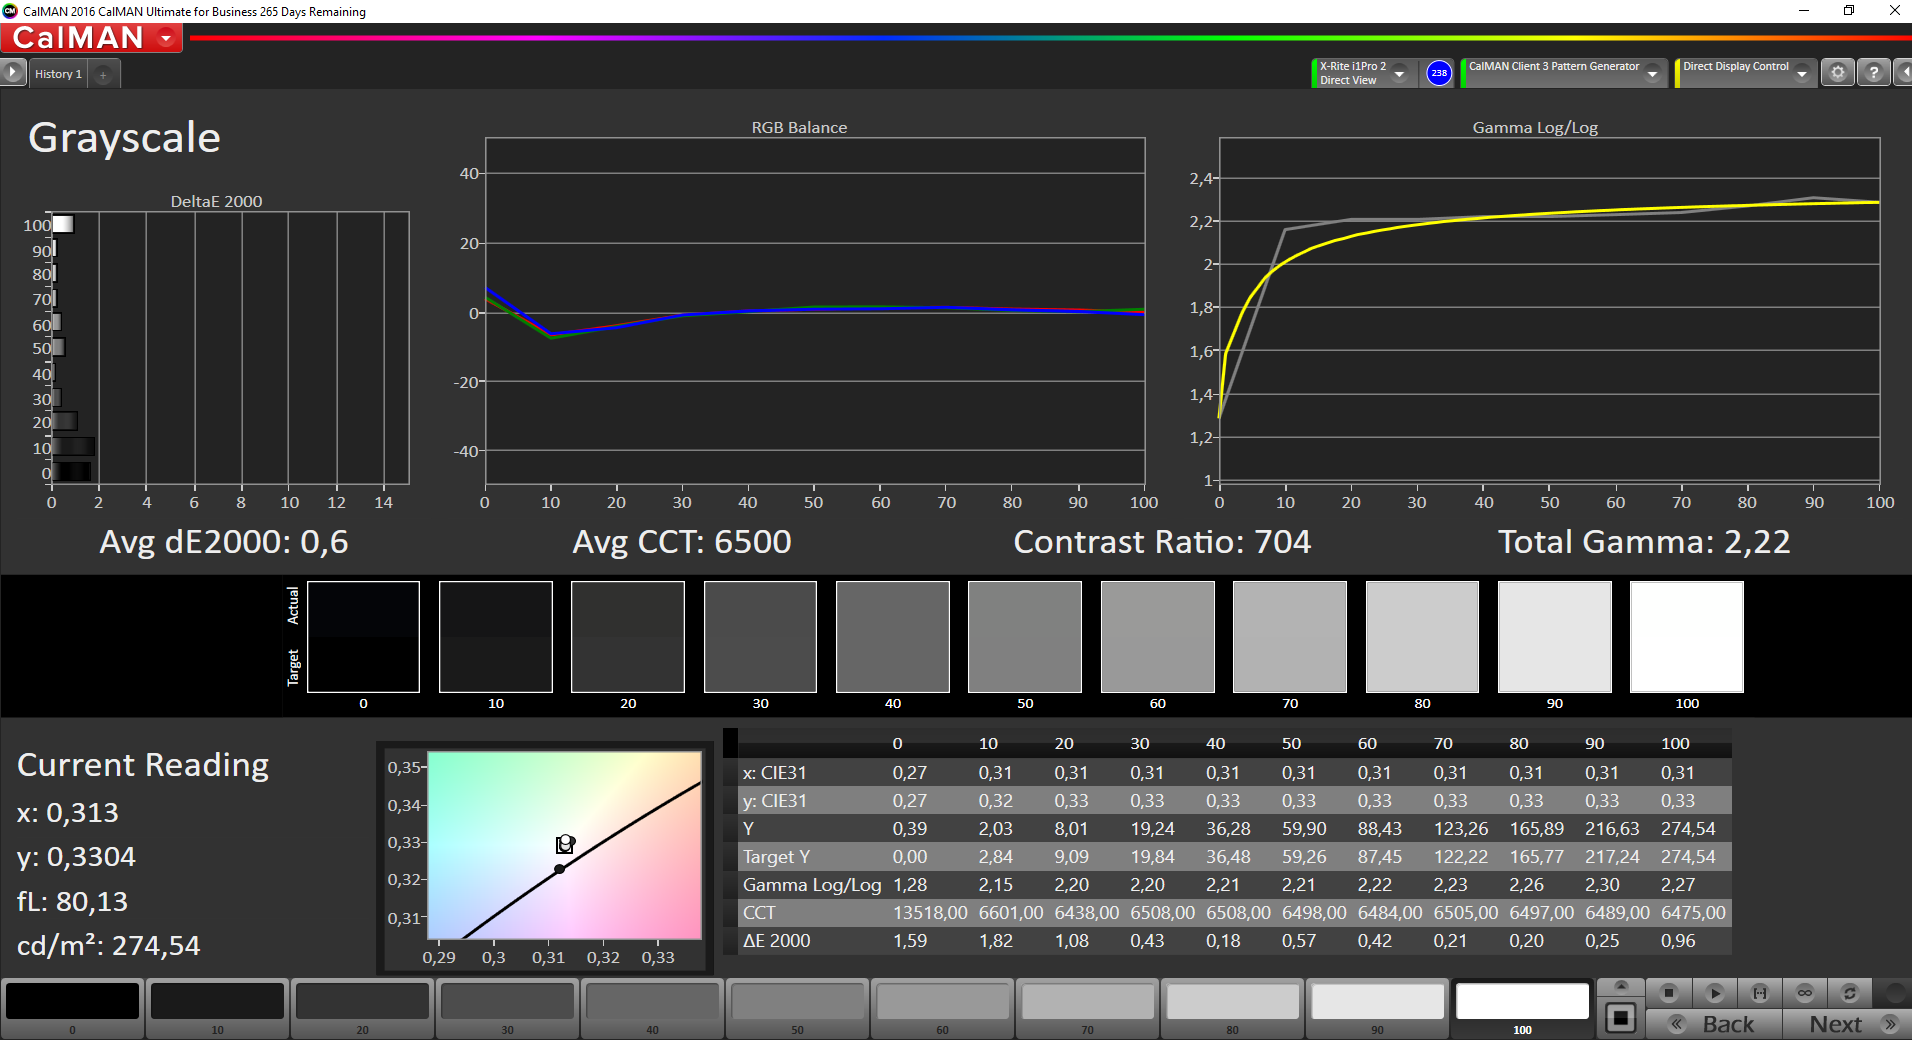
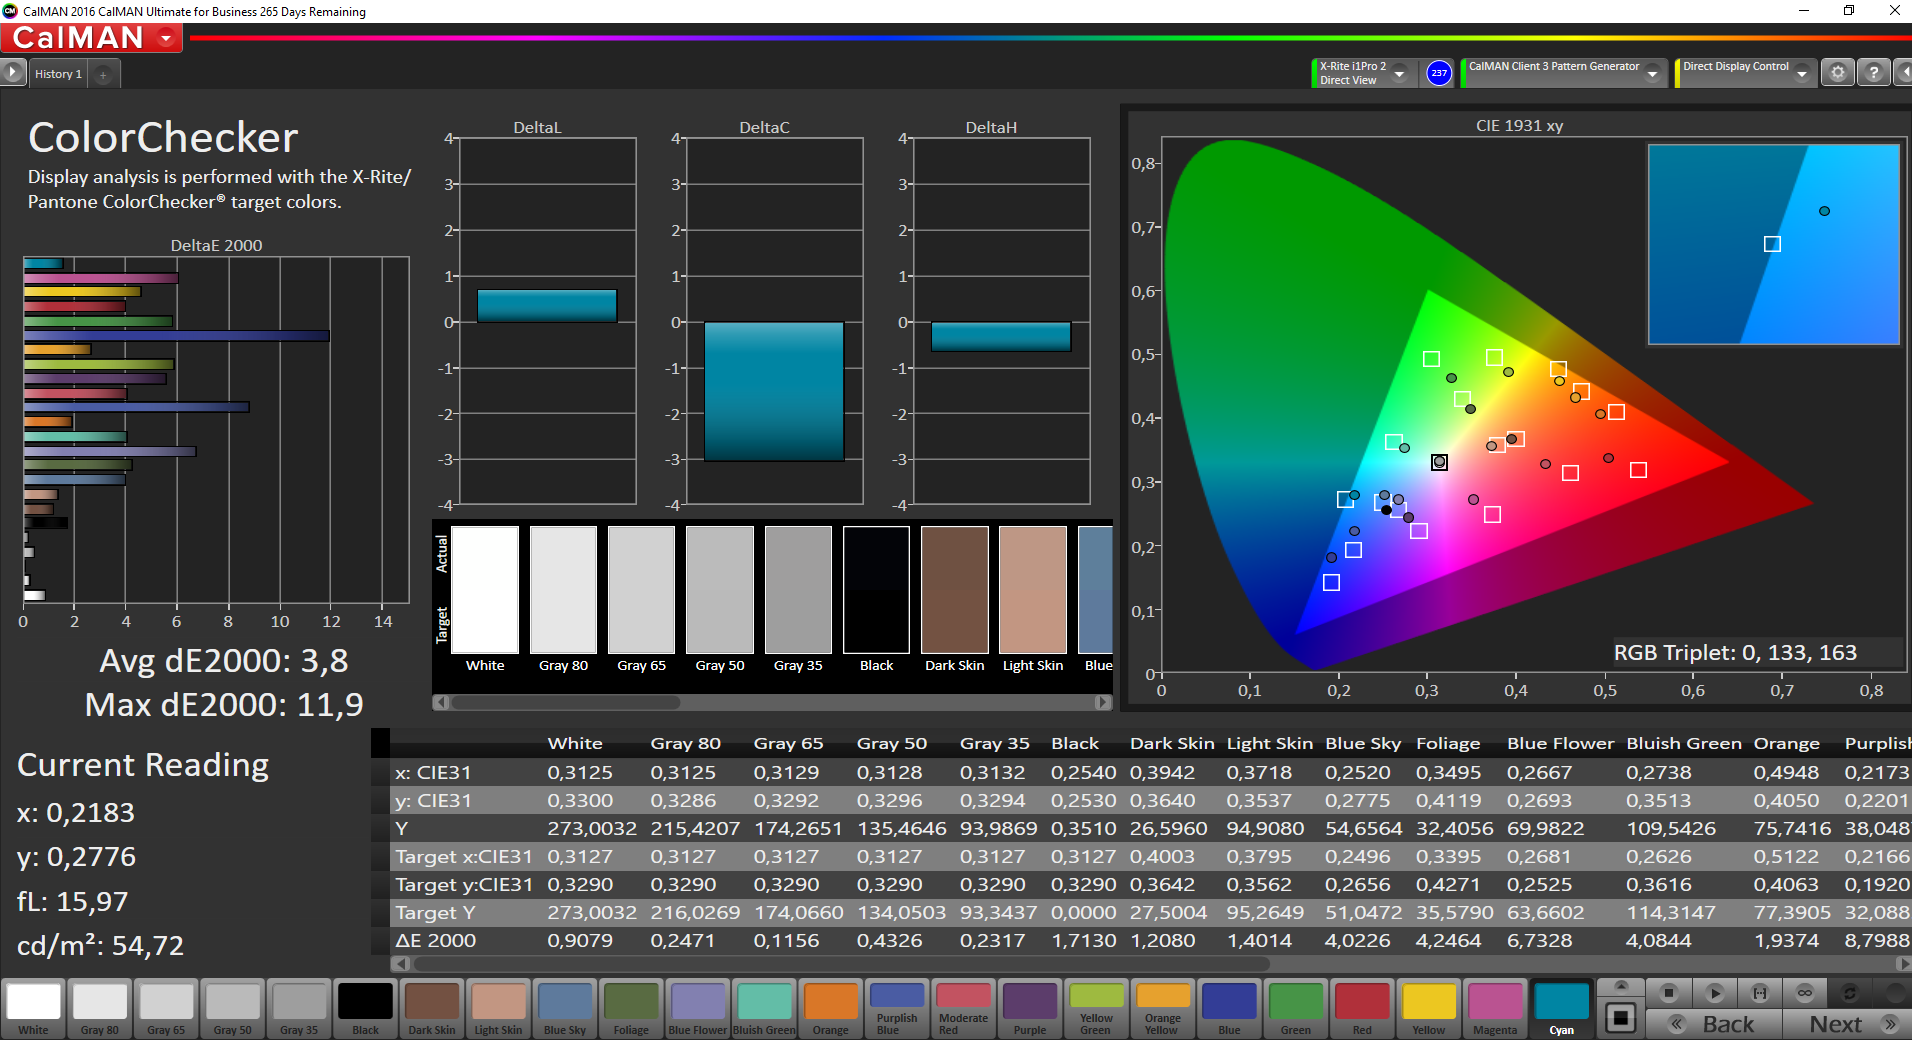
ΔE ColorChecker Calman: 5.1 | ∀{0.5-29.43 Ø4.73}
ΔE Greyscale Calman: 3.9 | ∀{0.09-98 Ø4.97}
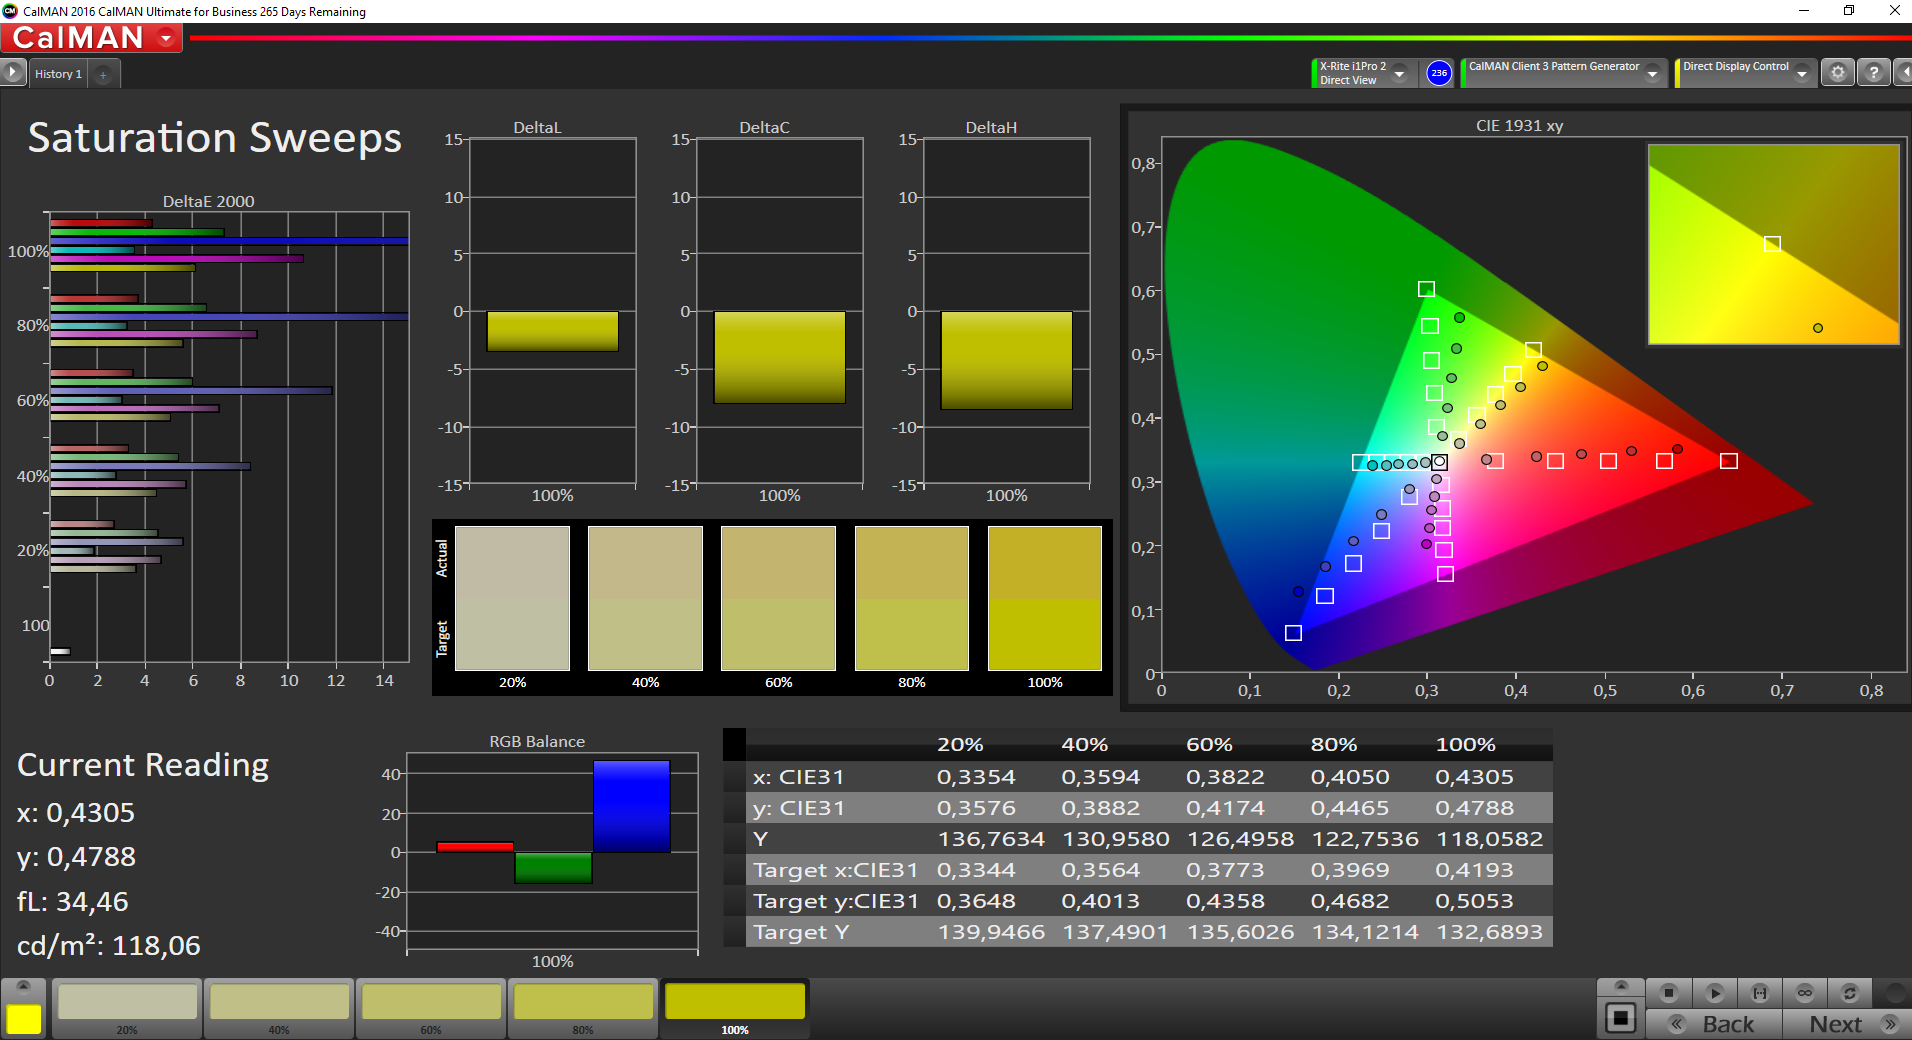
59.75% sRGB (Argyll 1.6.3 3D)
38.24% AdobeRGB 1998 (Argyll 1.6.3 3D)
41.54% AdobeRGB 1998 (Argyll 3D)
60% sRGB (Argyll 3D)
40.16% Display P3 (Argyll 3D)
Gamma: 2.17
CCT: 6829 K
| Lenovo ThinkPad 13-20J2S00G00 LP133WF2-SPL78, , 1920x1080, 13.3" | Lenovo ThinkPad 13-20GKS01100 LP133WF2-SPL1, , 1920x1080, 13.3" | HP ProBook 430 G4-Y8B47EA LGD052D, , 1920x1080, 13.3" | Asus Zenbook UX310UA-FC347T iGP AU Optronics AUO272D, , 1920x1080, 13.3" | Dell XPS 13 9360 FHD i5 Sharp SHP1449 LQ133M1, , 1920x1080, 13.3" | |
|---|---|---|---|---|---|
| Display | -5% | -4% | 42% | 22% | |
| Display P3 Coverage (%) | 40.16 | 38.35 -5% | 38.55 -4% | 64.2 60% | 48.94 22% |
| sRGB Coverage (%) | 60 | 57.4 -4% | 57.8 -4% | 65.3 9% | 73.3 22% |
| AdobeRGB 1998 Coverage (%) | 41.54 | 39.66 -5% | 39.85 -4% | 65.3 57% | 50.5 22% |
| Response Times | -3% | -1% | 11% | -4% | |
| Response Time Grey 50% / Grey 80% * (ms) | 43.6 ? | 43.2 ? 1% | 42.4 ? 3% | 40 ? 8% | 32.8 ? 25% |
| Response Time Black / White * (ms) | 25.2 ? | 26.8 ? -6% | 26.4 ? -5% | 22 ? 13% | 33.2 ? -32% |
| PWM Frequency (Hz) | 30860 ? | 200 ? | |||
| Screen | -1% | -4% | 18% | 15% | |
| Brightness middle (cd/m²) | 306 | 233 -24% | 253 -17% | 358 17% | 351.2 15% |
| Brightness (cd/m²) | 307 | 227 -26% | 249 -19% | 347 13% | 325 6% |
| Brightness Distribution (%) | 89 | 86 -3% | 92 3% | 87 -2% | 89 0% |
| Black Level * (cd/m²) | 0.36 | 0.22 39% | 0.32 11% | 0.26 28% | 0.195 46% |
| Contrast (:1) | 850 | 1059 25% | 791 -7% | 1377 62% | 1801 112% |
| Colorchecker dE 2000 * | 5.1 | 5.41 -6% | 5.28 -4% | 5.22 -2% | 7.4 -45% |
| Colorchecker dE 2000 max. * | 13.3 | 13.61 -2% | 13.66 -3% | 9.19 31% | 9.08 32% |
| Greyscale dE 2000 * | 3.9 | 4.15 -6% | 3.8 3% | 6.69 -72% | 6.71 -72% |
| Gamma | 2.17 101% | 2.45 90% | 2.3 96% | 2.35 94% | 2.74 80% |
| CCT | 6829 95% | 6773 96% | 6646 98% | 6745 96% | 7222 90% |
| Color Space (Percent of AdobeRGB 1998) (%) | 38.24 | 36.52 -4% | 36.7 -4% | 59 54% | 50.48 32% |
| Color Space (Percent of sRGB) (%) | 59.75 | 57.16 -4% | 57.6 -4% | 91 52% | 73.31 23% |
| Media total (Programa/Opciones) | -3% /
-2% | -3% /
-4% | 24% /
22% | 11% /
14% |
* ... más pequeño es mejor

Tiempos de respuesta del display
| ↔ Tiempo de respuesta de Negro a Blanco | ||
|---|---|---|
| 25.2 ms ... subida ↗ y bajada ↘ combinada | ↗ 12.8 ms subida | 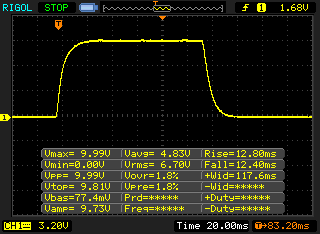 |
| ↘ 12.4 ms bajada | ||
| La pantalla mostró tiempos de respuesta relativamente lentos en nuestros tests pero podría ser demasiado lenta para los jugones. En comparación, todos los dispositivos de prueba van de ##min### (mínimo) a 240 (máximo) ms. » 60 % de todos los dispositivos son mejores. Eso quiere decir que el tiempo de respuesta es peor que la media (19.9 ms) de todos los dispositivos testados. | ||
| ↔ Tiempo de respuesta 50% Gris a 80% Gris | ||
| 43.6 ms ... subida ↗ y bajada ↘ combinada | ↗ 20.8 ms subida | 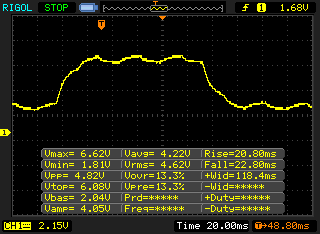 |
| ↘ 22.8 ms bajada | ||
| La pantalla mostró tiempos de respuesta lentos en nuestros tests y podría ser demasiado lenta para los jugones. En comparación, todos los dispositivos de prueba van de ##min### (mínimo) a 636 (máximo) ms. » 73 % de todos los dispositivos son mejores. Eso quiere decir que el tiempo de respuesta es peor que la media (31.1 ms) de todos los dispositivos testados. | ||
Parpadeo de Pantalla / PWM (Pulse-Width Modulation)
| Parpadeo de Pantalla / PWM detectado | 30860 Hz | ≤ 90 % de brillo | 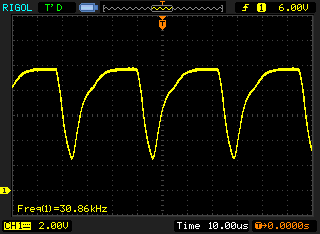 |
La retroiluminación del display parpadea a 30860 Hz (seguramente usa PWM - Pulse-Width Modulation) a un brillo del 90 % e inferior. Sobre este nivel de brillo no debería darse parpadeo / PWM. La frecuencia de 30860 Hz es bastante alta, por lo que la mayoría de gente sensible al parpadeo no debería ver parpadeo o tener fatiga visual. Comparación: 52 % de todos los dispositivos testados no usaron PWM para atenuar el display. Si se usó, medimos una media de 7784 (mínimo: 5 - máxmo: 343500) Hz. | |||
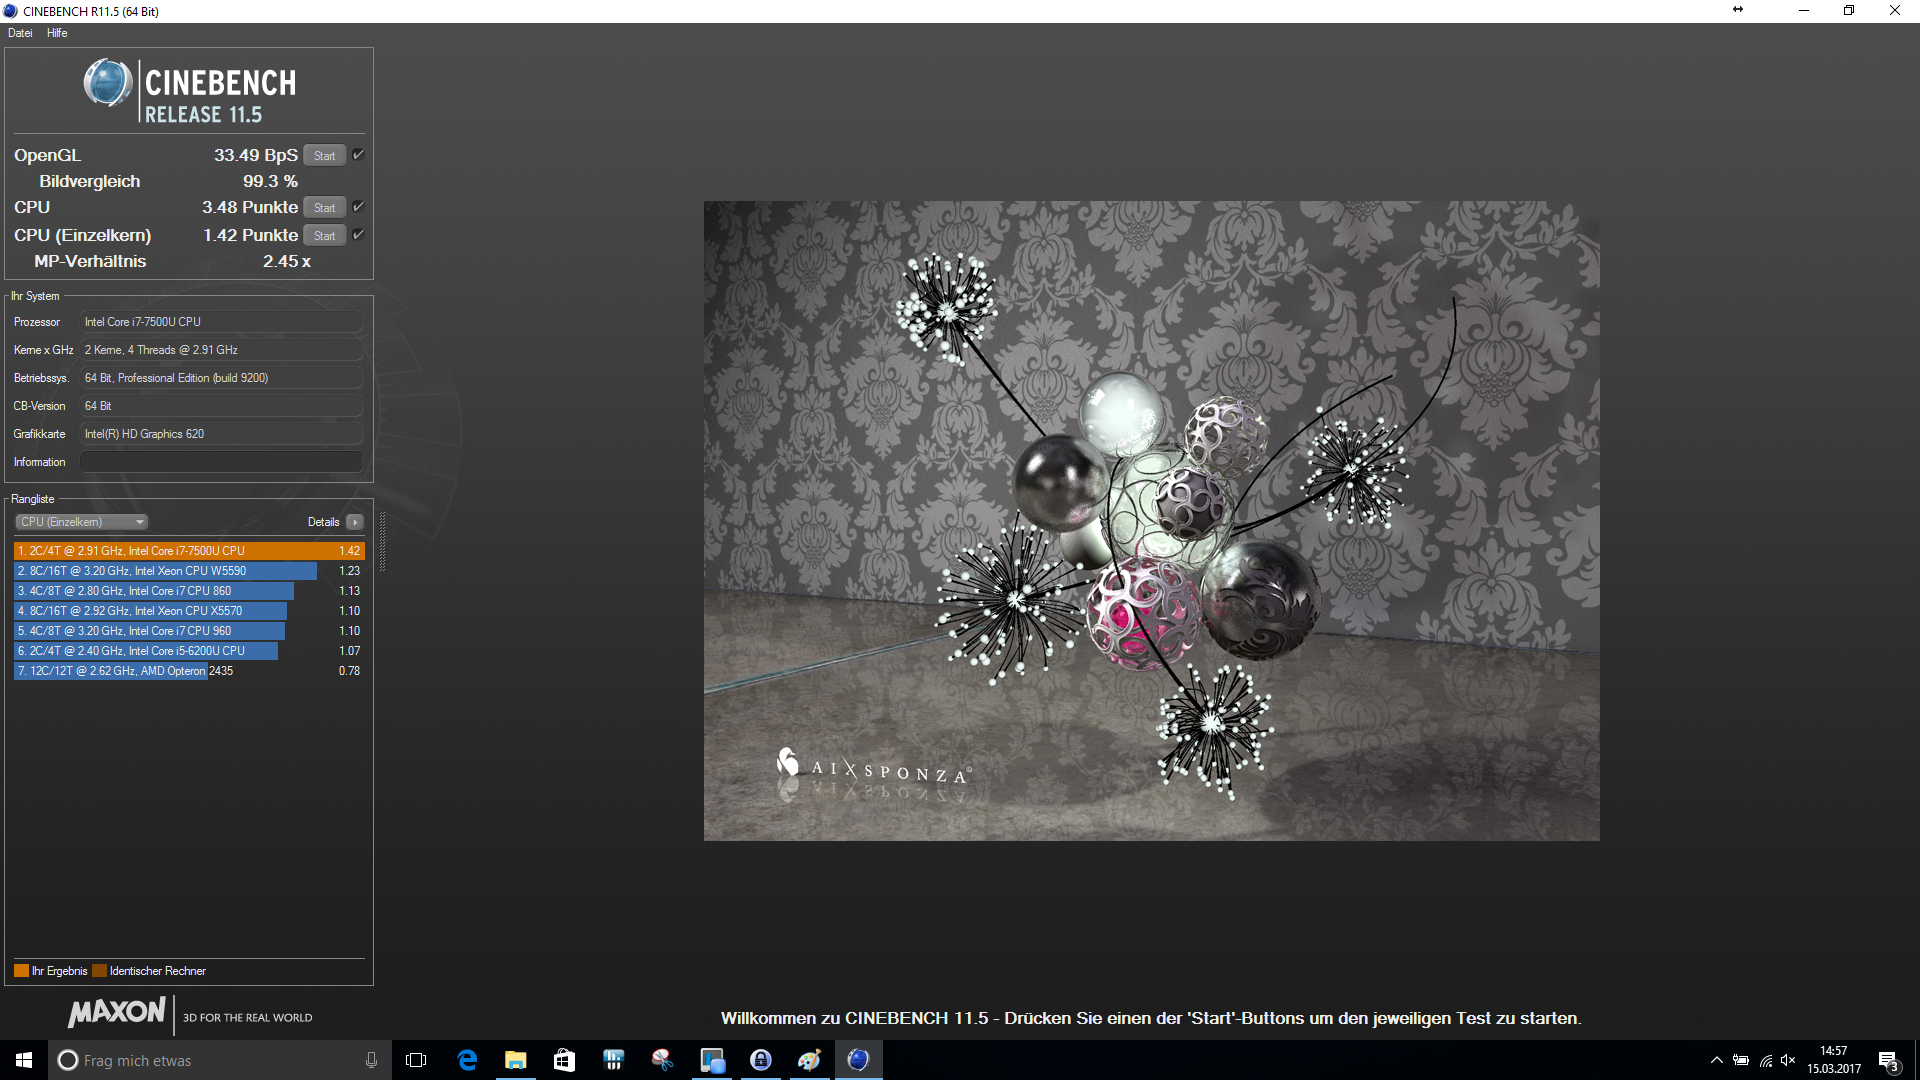
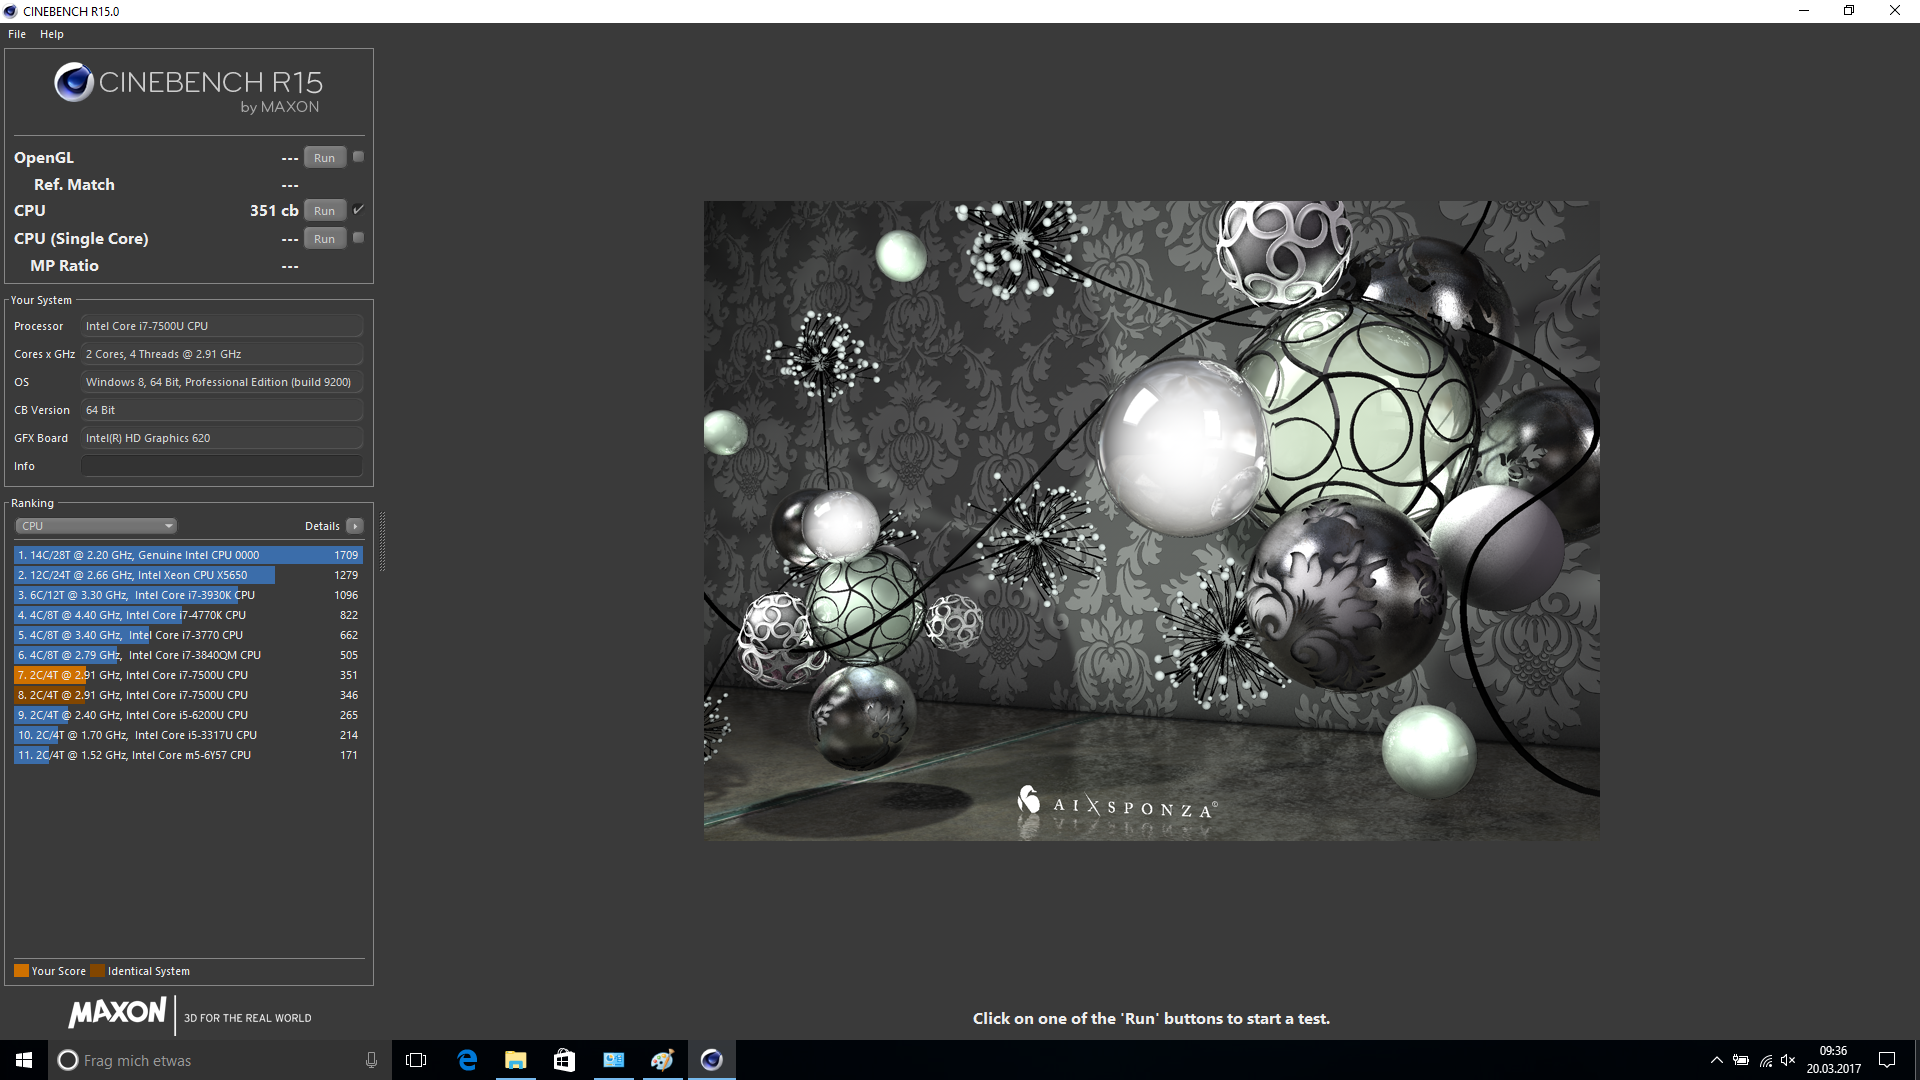
| Cinebench R11.5 | |
| CPU Single 64Bit | |
| Lenovo ThinkPad 13-20J2S00G00 | |
| Asus Zenbook UX310UA-FC347T iGP | |
| Dell XPS 13 9360 FHD i5 | |
| CPU Multi 64Bit | |
| Lenovo ThinkPad 13-20J2S00G00 | |
| Asus Zenbook UX310UA-FC347T iGP | |
| Dell XPS 13 9360 FHD i5 | |
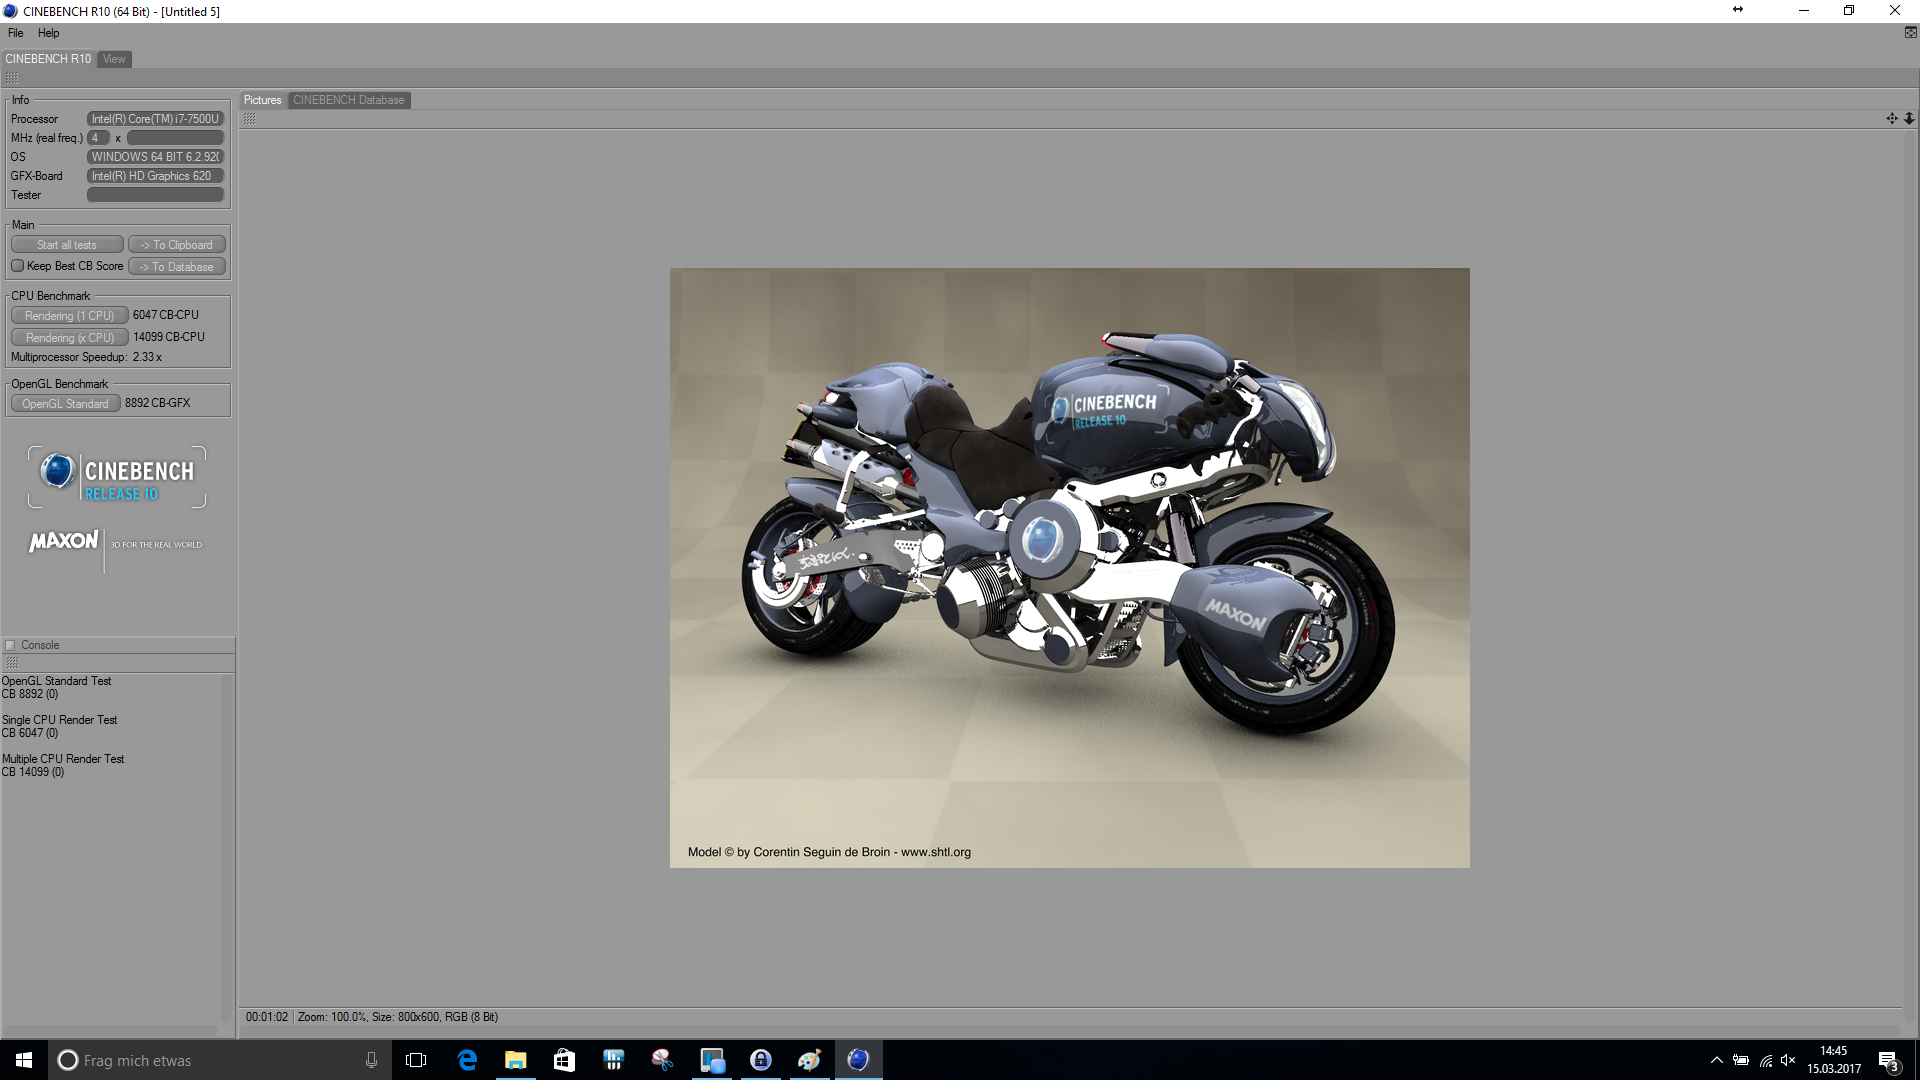
| Cinebench R10 | |
| Rendering Single CPUs 64Bit | |
| Asus Zenbook UX310UA-FC347T iGP | |
| Lenovo ThinkPad 13-20J2S00G00 | |
| Rendering Multiple CPUs 64Bit | |
| Asus Zenbook UX310UA-FC347T iGP | |
| Lenovo ThinkPad 13-20J2S00G00 | |
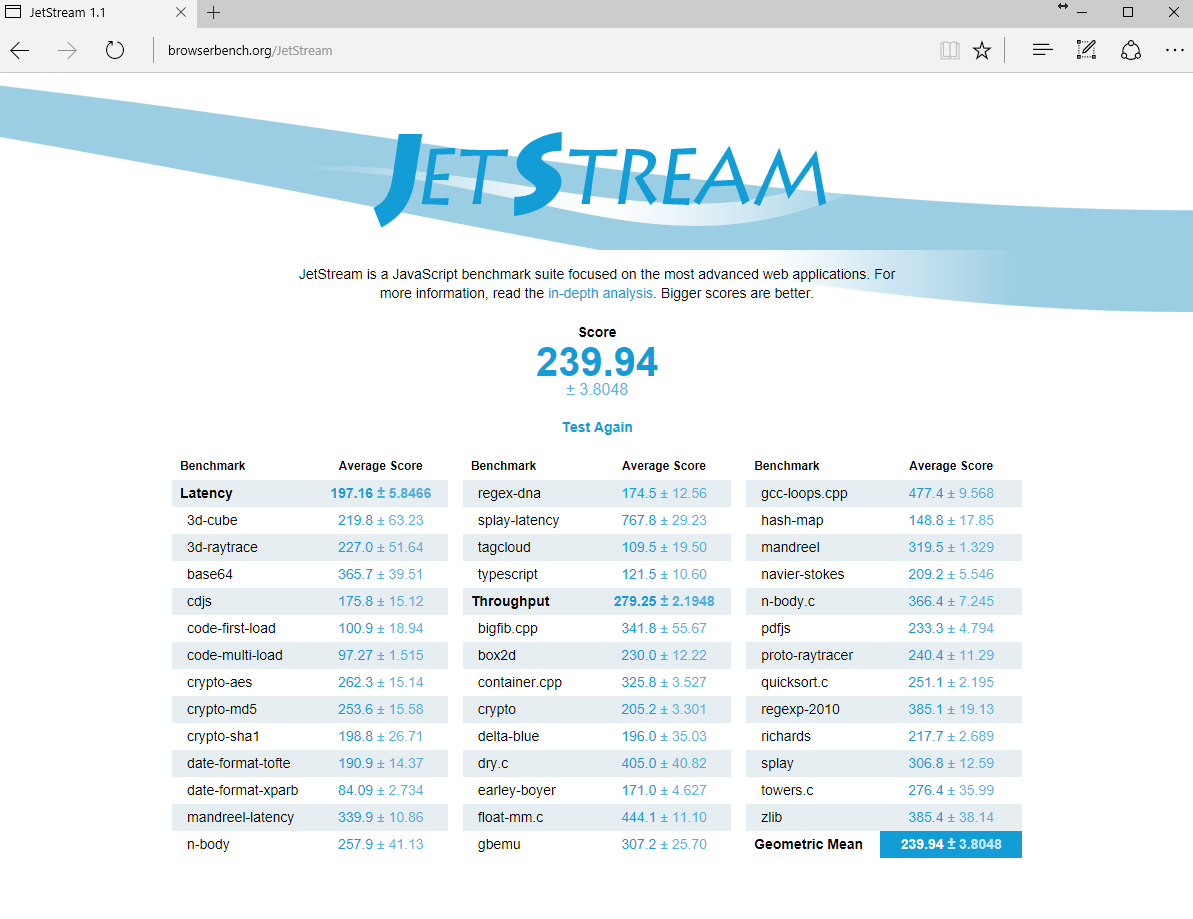
| JetStream 1.1 - 1.1 Total | |
| Lenovo ThinkPad 13-20J2S00G00 | |
| Asus Zenbook UX310UA-FC347T iGP | |
| HP ProBook 430 G4-Y8B47EA | |
| Lenovo ThinkPad 13-20GKS01100 | |
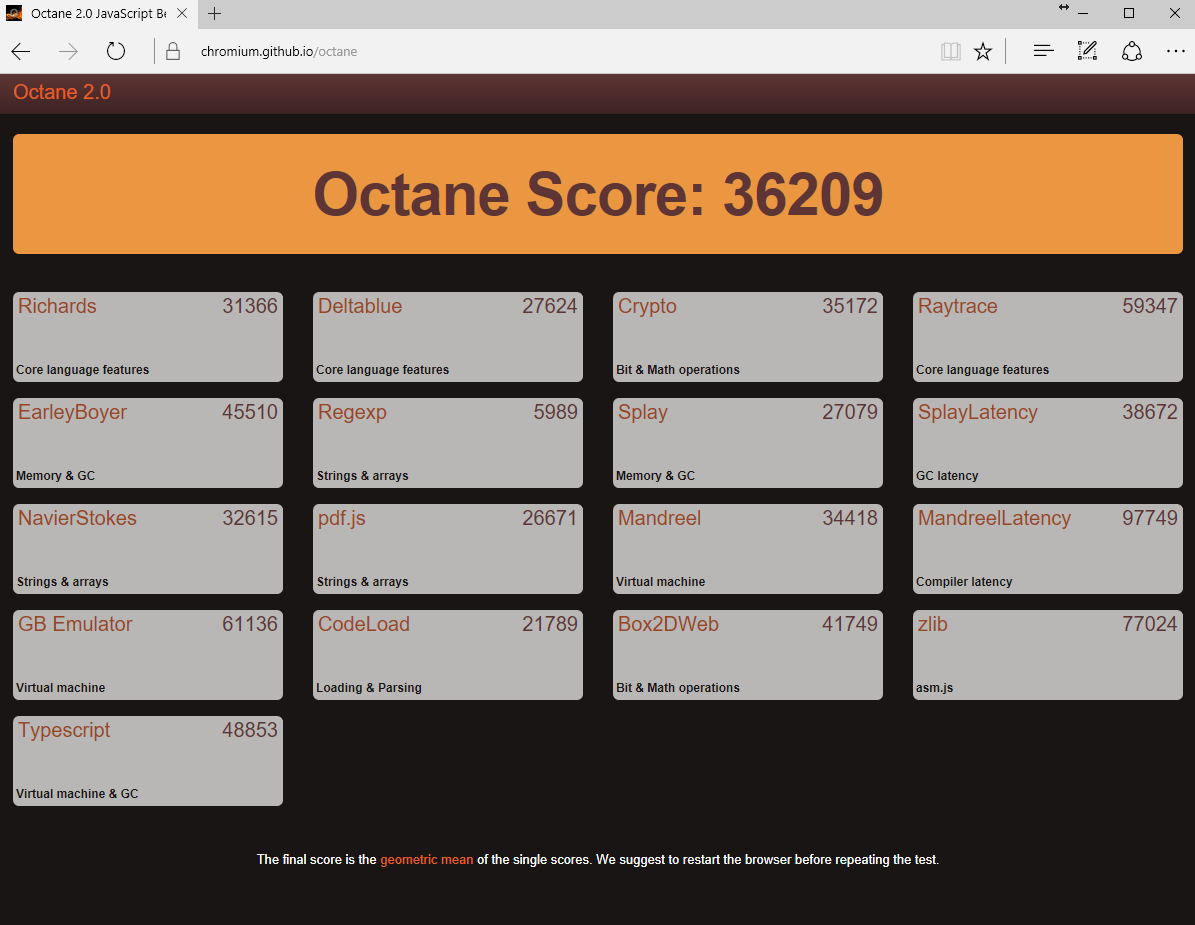
| Octane V2 - Total Score | |
| Lenovo ThinkPad 13-20J2S00G00 | |
| HP ProBook 430 G4-Y8B47EA | |
| Asus Zenbook UX310UA-FC347T iGP | |
| Dell XPS 13 9360 FHD i5 | |
| Lenovo ThinkPad 13-20GKS01100 | |
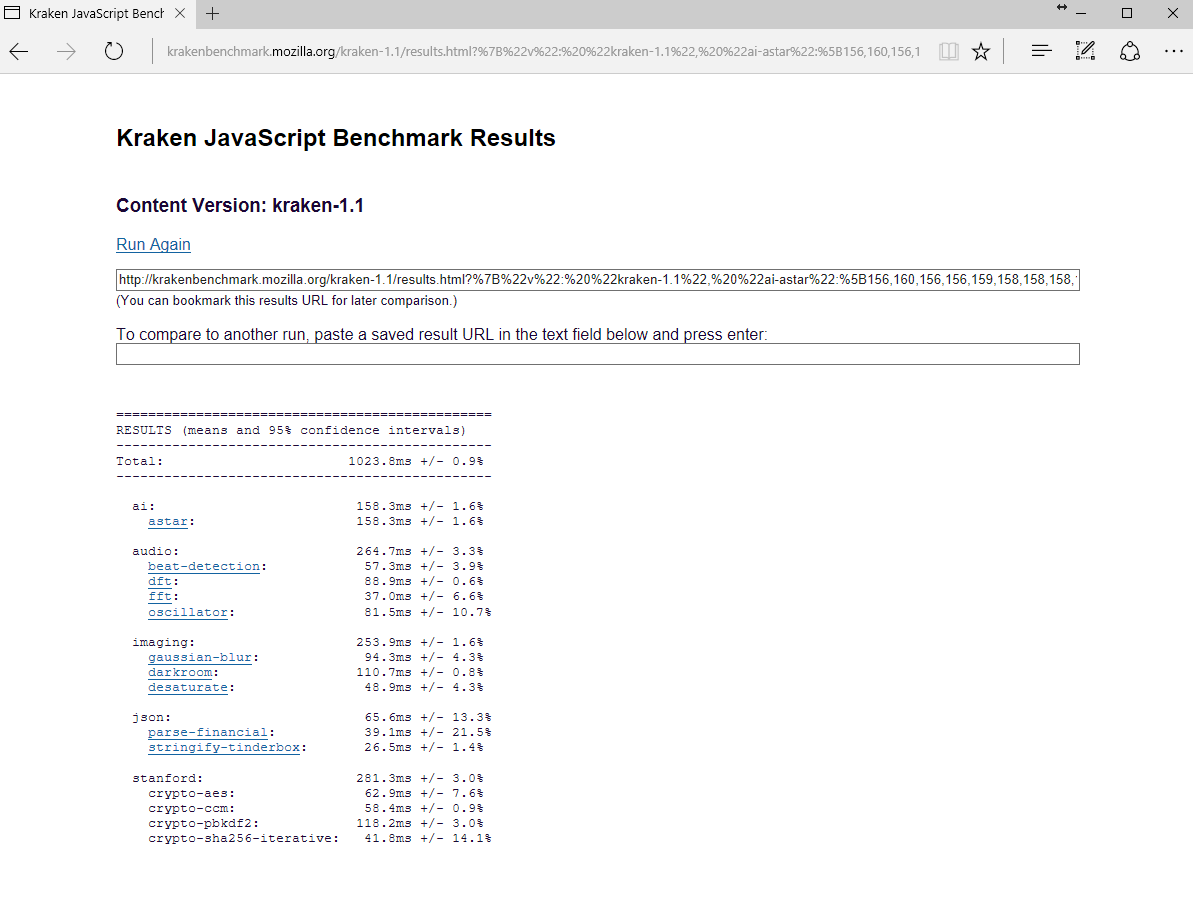
| Mozilla Kraken 1.1 - Total | |
| Lenovo ThinkPad 13-20GKS01100 | |
| Asus Zenbook UX310UA-FC347T iGP | |
| Lenovo ThinkPad 13-20J2S00G00 | |
| HP ProBook 430 G4-Y8B47EA | |
* ... más pequeño es mejor
| PCMark 7 - Score | |
| Asus Zenbook UX310UA-FC347T iGP | |
| HP ProBook 430 G4-Y8B47EA | |
| Lenovo ThinkPad 13-20J2S00G00 | |
| PCMark Vantage Result | 16210 puntos | |
| PCMark 7 Score | 5189 puntos | |
| PCMark 8 Home Score Accelerated v2 | 3705 puntos | |
| PCMark 8 Creative Score Accelerated v2 | 4583 puntos | |
| PCMark 8 Work Score Accelerated v2 | 4838 puntos | |
ayuda | ||
| Lenovo ThinkPad 13-20J2S00G00 Toshiba NVMe THNSF5512GPUK | Lenovo ThinkPad 13-20GKS01100 Samsung SSD PM871 MZNLN256HCHP | HP ProBook 430 G4-Y8B47EA SanDisk SD8SNAT256G1002 | Asus Zenbook UX310UA-FC347T iGP Micron SSD 1100 (MTFDDAV256TBN) | Dell XPS 13 9360 FHD i5 Toshiba NVMe THNSN5256GPUK | |
|---|---|---|---|---|---|
| CrystalDiskMark 3.0 | -41% | -49% | -39% | -3% | |
| Read Seq (MB/s) | 1143 | 461.7 -60% | 505 -56% | 489.4 -57% | 1233 8% |
| Write Seq (MB/s) | 653 | 297.8 -54% | 328.9 -50% | 431.6 -34% | 733 12% |
| Read 512 (MB/s) | 629 | 351.6 -44% | 313.6 -50% | 356.7 -43% | 1036 65% |
| Write 512 (MB/s) | 518 | 298.4 -42% | 301 -42% | 389.1 -25% | 439.9 -15% |
| Read 4k (MB/s) | 31.96 | 31.85 0% | 21.69 -32% | 26.68 -17% | 29.31 -8% |
| Write 4k (MB/s) | 138.5 | 68.5 -51% | 80.4 -42% | 88.7 -36% | 116.9 -16% |
| Read 4k QD32 (MB/s) | 578 | 360.9 -38% | 132.2 -77% | 246.3 -57% | 479.2 -17% |
| Write 4k QD32 (MB/s) | 443.1 | 276.2 -38% | 258.8 -42% | 251.5 -43% | 218.3 -51% |

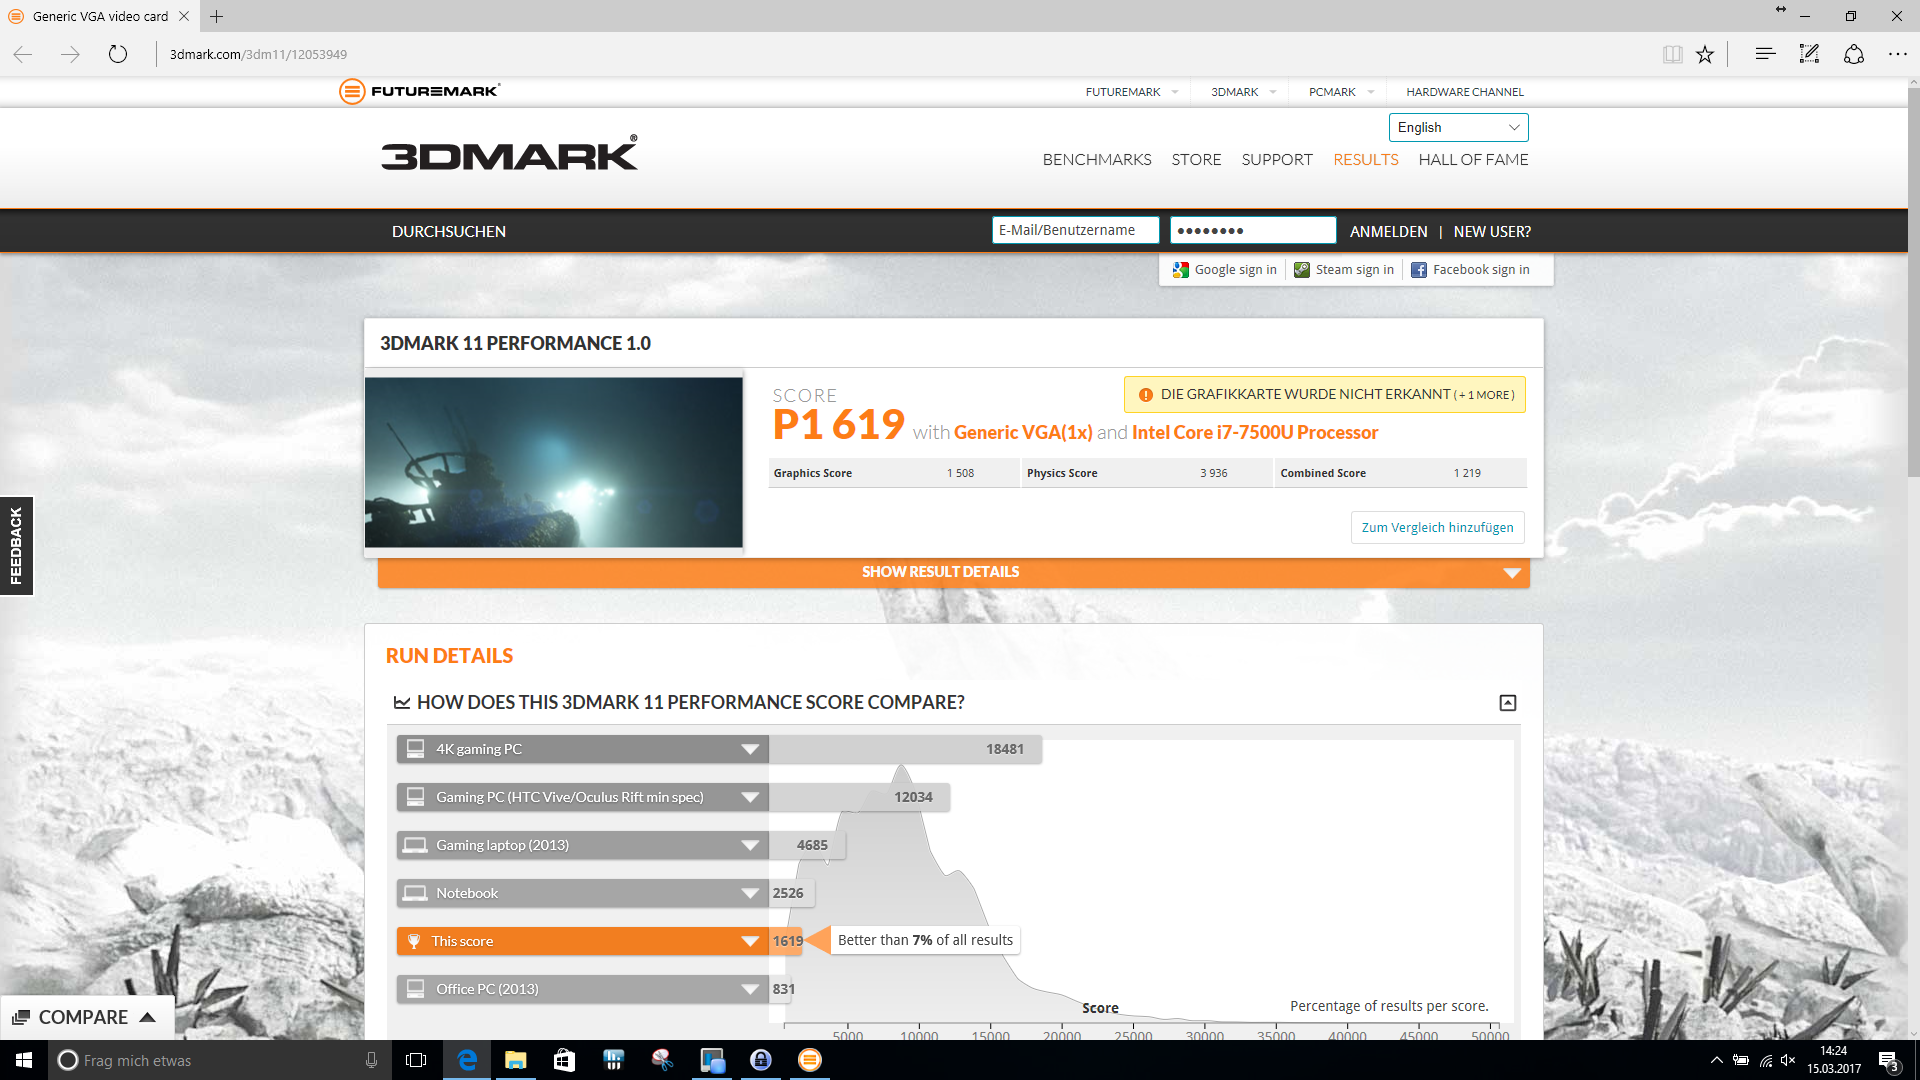
| 3DMark 11 - 1280x720 Performance GPU | |
| Asus Zenbook UX310UA-FC347T iGP | |
| Dell XPS 13 9360 FHD i5 | |
| Lenovo ThinkPad 13-20J2S00G00 | |
| HP ProBook 430 G4-Y8B47EA | |
| Lenovo ThinkPad 13-20GKS01100 | |
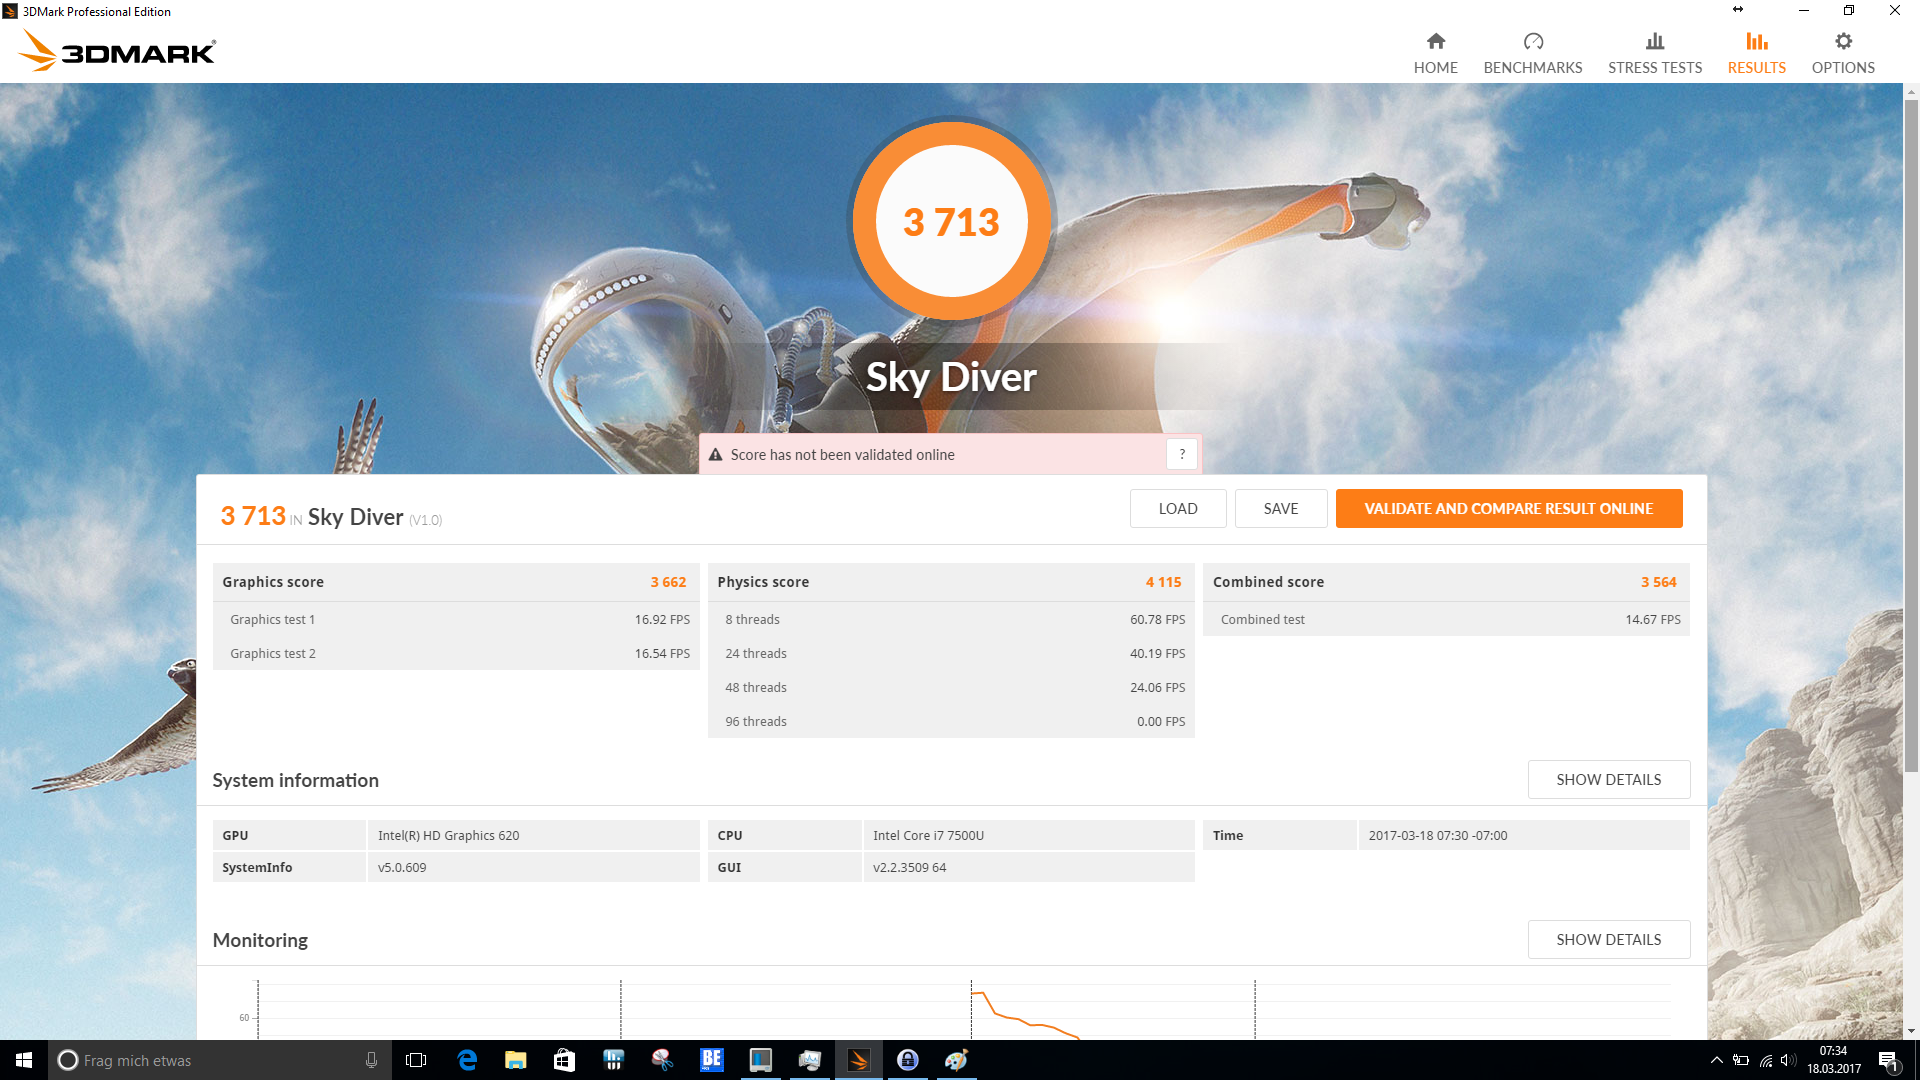
| 3DMark | |
| 1280x720 Cloud Gate Standard Graphics | |
| Asus Zenbook UX310UA-FC347T iGP | |
| Dell XPS 13 9360 FHD i5 | |
| HP ProBook 430 G4-Y8B47EA | |
| Lenovo ThinkPad 13-20GKS01100 | |
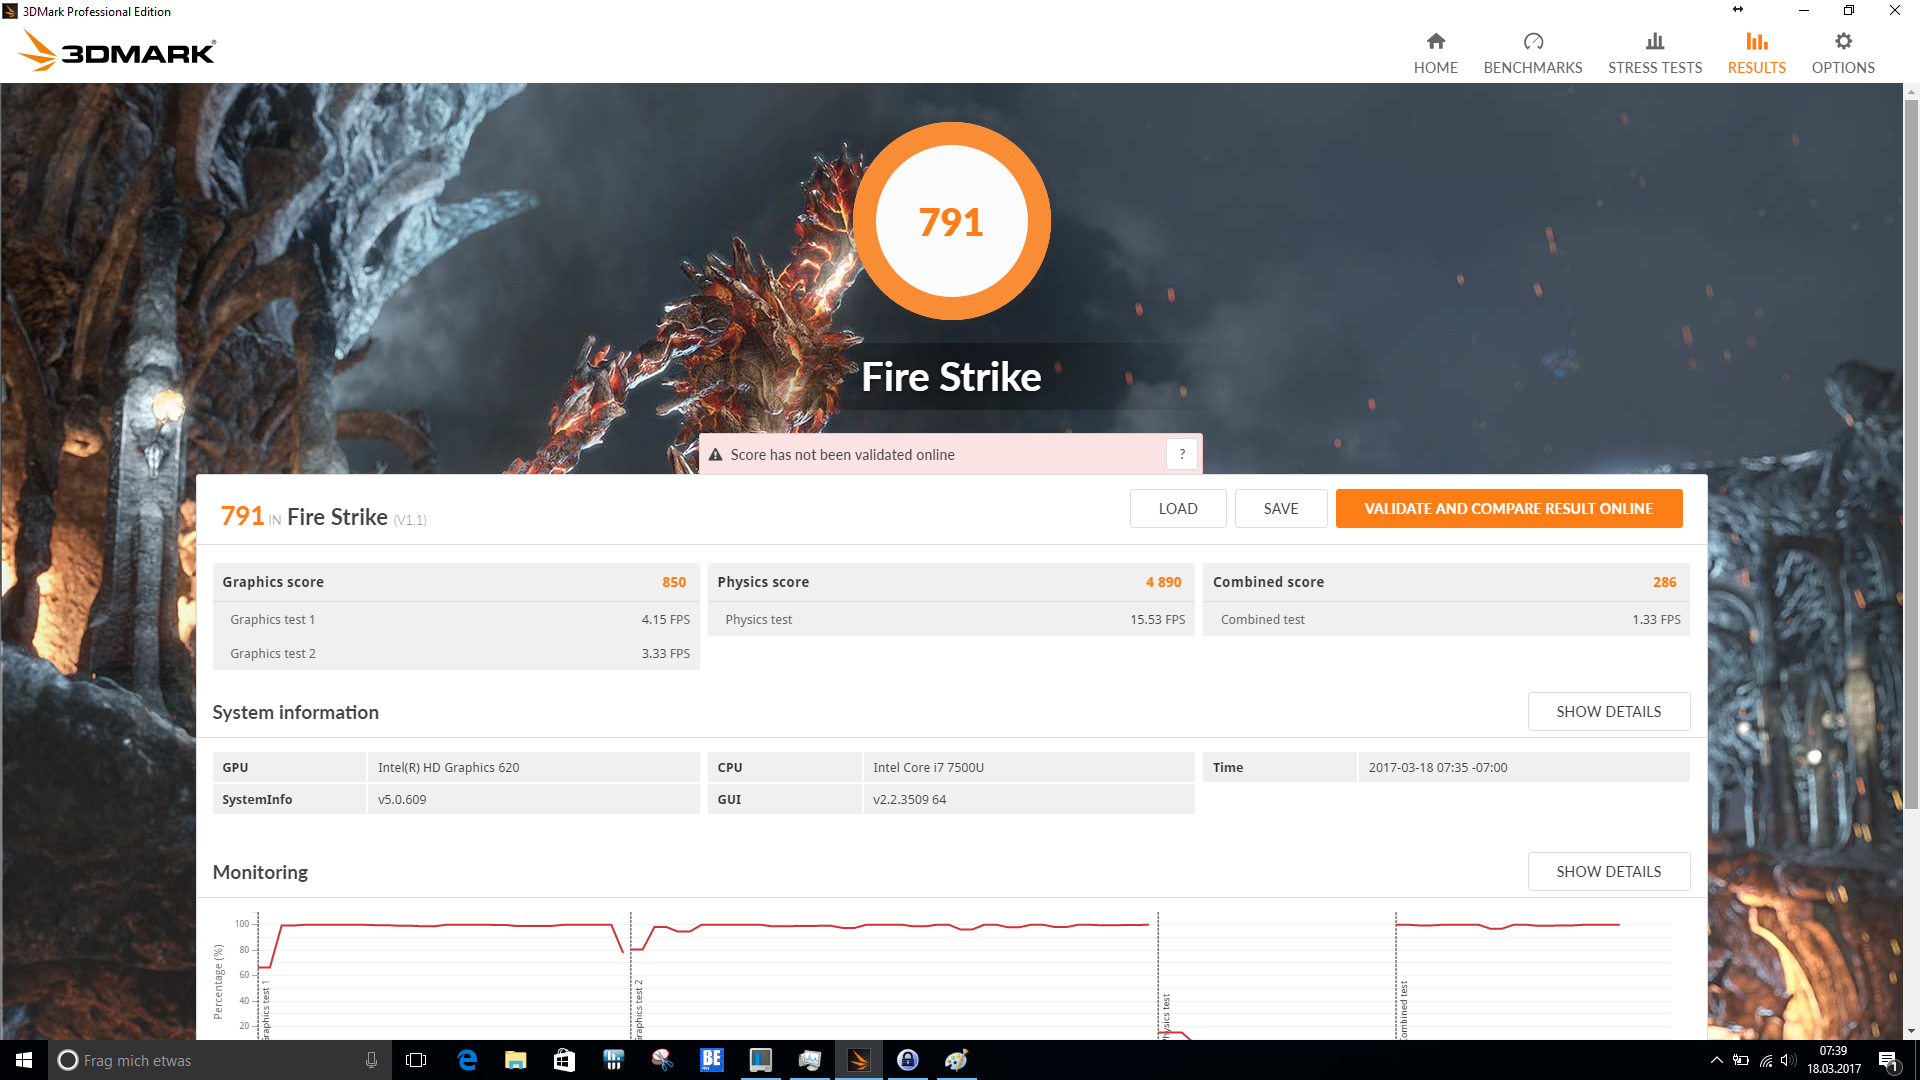
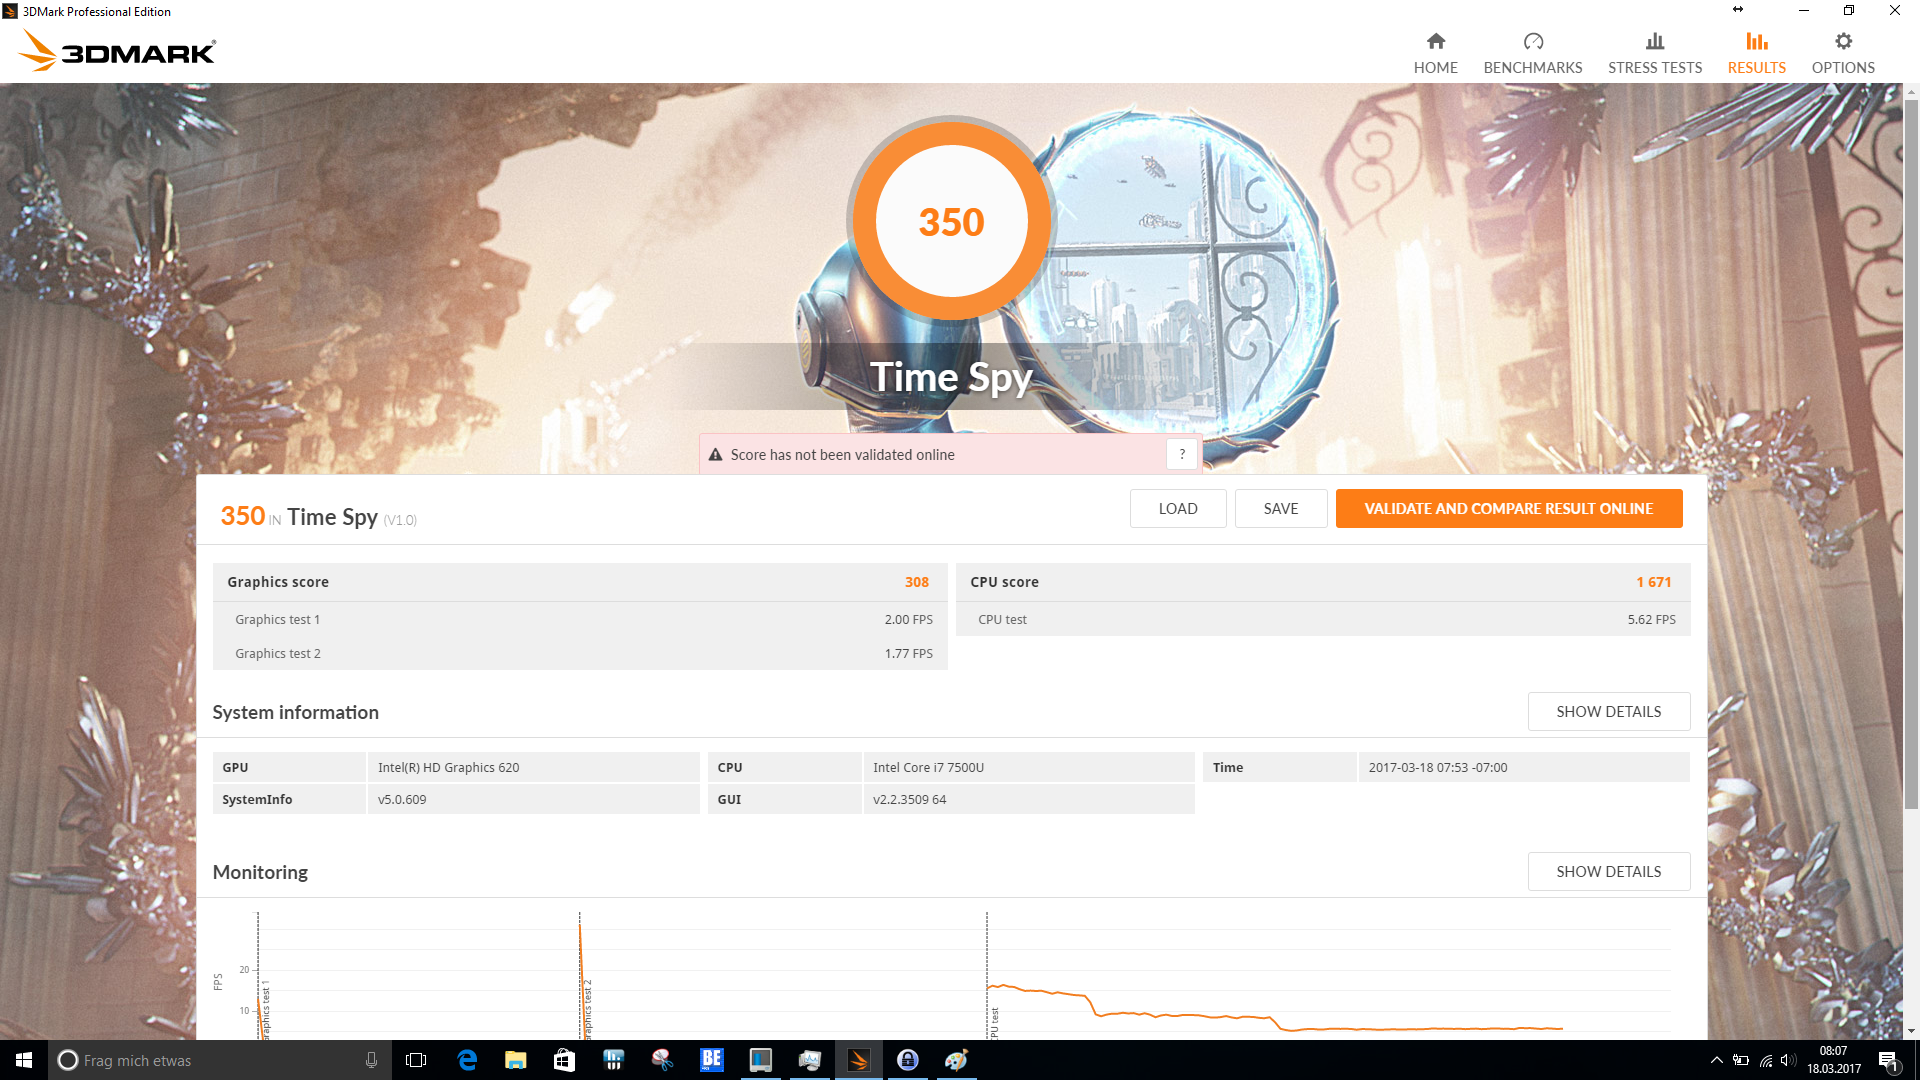
| 1920x1080 Fire Strike Graphics | |
| Asus Zenbook UX310UA-FC347T iGP | |
| Dell XPS 13 9360 FHD i5 | |
| HP ProBook 430 G4-Y8B47EA | |
| Lenovo ThinkPad 13-20GKS01100 | |
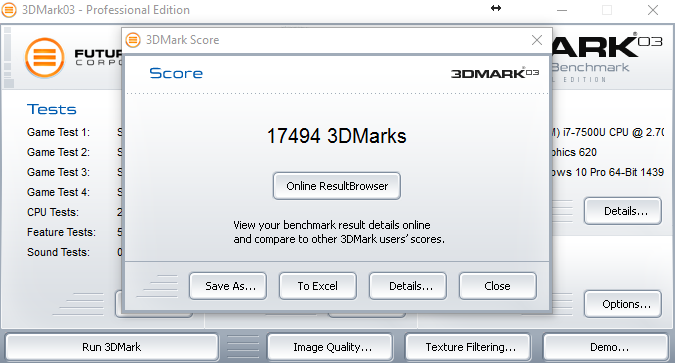
| 3DMark 03 Standard | 17494 puntos | |
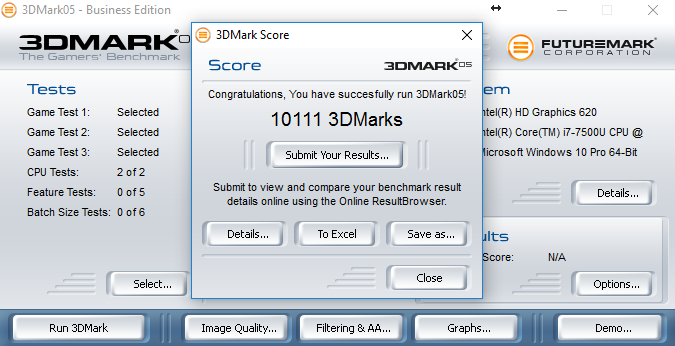
| 3DMark 05 Standard | 10111 puntos | |
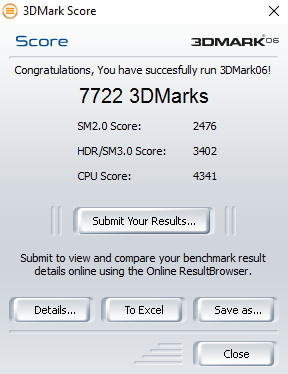
| 3DMark 06 Standard Score | 7722 puntos | |
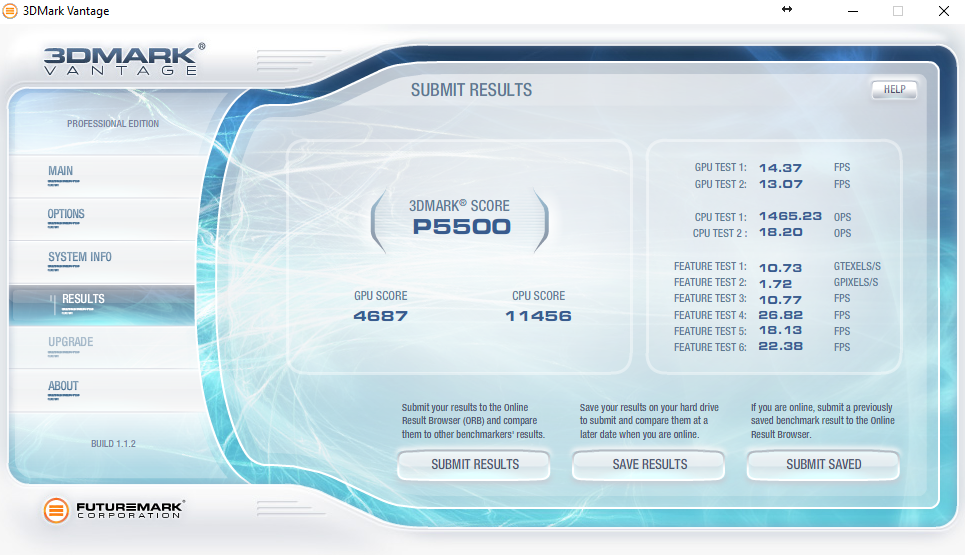
| 3DMark Vantage P Result | 5500 puntos | |
| 3DMark 11 Performance | 1619 puntos | |
ayuda | ||
| bajo | medio | alto | ultra | |
|---|---|---|---|---|
| BioShock Infinite (2013) | 44 | 25 | 21 | 6 |
| Battlefield 4 (2013) | 33 | 26 | 17 | 6 |
| The Witcher 3 (2015) | 13 | 10 | 5 | |
| Rise of the Tomb Raider (2016) | 15 | 9 | 6 |
Ruido
| Ocioso |
| 29.1 / 29.1 / 29.1 dB(A) |
| Carga |
| 31.9 / 31.9 dB(A) |
 | ||
30 dB silencioso 40 dB(A) audible 50 dB(A) ruidosamente alto |
||
min: | ||
| Lenovo ThinkPad 13-20J2S00G00 i7-7500U, HD Graphics 620 | Lenovo ThinkPad 13-20GKS01100 6200U, HD Graphics 520 | HP ProBook 430 G4-Y8B47EA i7-7500U, HD Graphics 620 | Asus Zenbook UX310UA-FC347T iGP i7-7500U, HD Graphics 620 | Dell XPS 13 9360 FHD i5 i5-7200U, HD Graphics 620 | |
|---|---|---|---|---|---|
| Noise | -1% | -3% | -7% | 0% | |
| apagado / medio ambiente * (dB) | 29.1 | 29.1 -0% | 29.1 -0% | 30.7 -5% | |
| Idle Minimum * (dB) | 29.1 | 29.1 -0% | 29.1 -0% | 30.9 -6% | 28.9 1% |
| Idle Average * (dB) | 29.1 | 29.1 -0% | 29.1 -0% | 30.9 -6% | 28.9 1% |
| Idle Maximum * (dB) | 29.1 | 29.1 -0% | 29.1 -0% | 30.9 -6% | 28.9 1% |
| Load Average * (dB) | 31.9 | 31.5 1% | 33.4 -5% | 35.6 -12% | 30.9 3% |
| Load Maximum * (dB) | 31.9 | 33.5 -5% | 36 -13% | 34.1 -7% | 33.5 -5% |
* ... más pequeño es mejor
(±) La temperatura máxima en la parte superior es de 44.7 °C / 112 F, frente a la media de 34.3 °C / 94 F, que oscila entre 21.2 y 62.5 °C para la clase Office.
(-) El fondo se calienta hasta un máximo de 54.7 °C / 130 F, frente a la media de 36.8 °C / 98 F
(+) En reposo, la temperatura media de la parte superior es de 23.5 °C / 74# F, frente a la media del dispositivo de 29.5 °C / 85 F.
(±) El reposamanos y el touchpad pueden calentarse mucho al tacto con un máximo de 39.8 °C / 103.6 F.
(-) La temperatura media de la zona del reposamanos de dispositivos similares fue de 27.5 °C / 81.5 F (-12.3 °C / -22.1 F).
| Lenovo ThinkPad 13-20J2S00G00 i7-7500U, HD Graphics 620 | Lenovo ThinkPad 13-20GKS01100 6200U, HD Graphics 520 | HP ProBook 430 G4-Y8B47EA i7-7500U, HD Graphics 620 | Asus Zenbook UX310UA-FC347T iGP i7-7500U, HD Graphics 620 | Dell XPS 13 9360 FHD i5 i5-7200U, HD Graphics 620 | |
|---|---|---|---|---|---|
| Heat | -9% | -0% | 16% | 0% | |
| Maximum Upper Side * (°C) | 44.7 | 43.7 2% | 38.7 13% | 33.7 25% | 43.4 3% |
| Maximum Bottom * (°C) | 54.7 | 44.2 19% | 39.4 28% | 34.1 38% | 49.2 10% |
| Idle Upper Side * (°C) | 24.2 | 31.4 -30% | 29.5 -22% | 25.2 -4% | 26.4 -9% |
| Idle Bottom * (°C) | 25.6 | 32.1 -25% | 30.6 -20% | 24.1 6% | 26.4 -3% |
* ... más pequeño es mejor
Lenovo ThinkPad 13-20J2S00G00 análisis de audio
(±) | la sonoridad del altavoz es media pero buena (74.1 dB)
Graves 100 - 315 Hz
(-) | casi sin bajos - de media 16.3% inferior a la mediana
(±) | la linealidad de los graves es media (11.1% delta a frecuencia anterior)
Medios 400 - 2000 Hz
(±) | medias más altas - de media 6.2% más altas que la mediana
(±) | la linealidad de los medios es media (8.8% delta respecto a la frecuencia anterior)
Altos 2 - 16 kHz
(+) | máximos equilibrados - a sólo 2% de la mediana
(+) | los máximos son lineales (6.9% delta a la frecuencia anterior)
Total 100 - 16.000 Hz
(±) | la linealidad del sonido global es media (21.3% de diferencia con la mediana)
En comparación con la misma clase
» 52% de todos los dispositivos probados de esta clase eran mejores, 9% similares, 39% peores
» El mejor tuvo un delta de 7%, la media fue 21%, el peor fue ###max##%
En comparación con todos los dispositivos probados
» 59% de todos los dispositivos probados eran mejores, 7% similares, 33% peores
» El mejor tuvo un delta de 4%, la media fue 24%, el peor fue ###max##%
HP ProBook 430 G4-Y8B47EA análisis de audio
(+) | los altavoces pueden reproducir a un volumen relativamente alto (#84.6 dB)
Graves 100 - 315 Hz
(-) | casi sin bajos - de media 19.7% inferior a la mediana
(±) | la linealidad de los graves es media (13.1% delta a frecuencia anterior)
Medios 400 - 2000 Hz
(+) | medios equilibrados - a sólo 3.8% de la mediana
(+) | los medios son lineales (6.8% delta a la frecuencia anterior)
Altos 2 - 16 kHz
(±) | máximos más altos - de media 5.7% más altos que la mediana
(+) | los máximos son lineales (5.4% delta a la frecuencia anterior)
Total 100 - 16.000 Hz
(±) | la linealidad del sonido global es media (18.9% de diferencia con la mediana)
En comparación con la misma clase
» 35% de todos los dispositivos probados de esta clase eran mejores, 7% similares, 58% peores
» El mejor tuvo un delta de 7%, la media fue 21%, el peor fue ###max##%
En comparación con todos los dispositivos probados
» 44% de todos los dispositivos probados eran mejores, 8% similares, 48% peores
» El mejor tuvo un delta de 4%, la media fue 24%, el peor fue ###max##%
| Off / Standby | |
| Ocioso | |
| Carga |
|
Clave:
min: | |
| Lenovo ThinkPad 13-20J2S00G00 i7-7500U, HD Graphics 620 | Lenovo ThinkPad 13-20GKS01100 6200U, HD Graphics 520 | HP ProBook 430 G4-Y8B47EA i7-7500U, HD Graphics 620 | Asus Zenbook UX310UA-FC347T iGP i7-7500U, HD Graphics 620 | Dell XPS 13 9360 FHD i5 i5-7200U, HD Graphics 620 | |
|---|---|---|---|---|---|
| Power Consumption | 8% | -14% | -12% | 13% | |
| Idle Minimum * (Watt) | 3.16 | 3.1 2% | 4.2 -33% | 3.5 -11% | 4.1 -30% |
| Idle Average * (Watt) | 5.9 | 5.5 7% | 6.5 -10% | 6.6 -12% | 4.2 29% |
| Idle Maximum * (Watt) | 6.5 | 6 8% | 7.2 -11% | 7.5 -15% | 5.1 22% |
| Load Average * (Watt) | 30.6 | 25.8 16% | 28.7 6% | 34.7 -13% | 22.1 28% |
| Load Maximum * (Watt) | 35.8 | 33.6 6% | 43.5 -22% | 39.6 -11% | 29.4 18% |
* ... más pequeño es mejor
| Lenovo ThinkPad 13-20J2S00G00 i7-7500U, HD Graphics 620, 42 Wh | Lenovo ThinkPad 13-20GKS01100 6200U, HD Graphics 520, 42 Wh | HP ProBook 430 G4-Y8B47EA i7-7500U, HD Graphics 620, 48 Wh | Asus Zenbook UX310UA-FC347T iGP i7-7500U, HD Graphics 620, 48 Wh | Dell XPS 13 9360 FHD i5 i5-7200U, HD Graphics 620, 60 Wh | |
|---|---|---|---|---|---|
| Duración de Batería | 22% | 41% | 25% | 57% | |
| Reader / Idle (h) | 15.1 | 15.7 4% | 15.9 5% | 16.1 7% | 21.6 43% |
| H.264 (h) | 5.2 | 7.8 50% | 8.7 67% | 6.9 33% | |
| WiFi v1.3 (h) | 7.9 | 6.2 -22% | 7.2 -9% | 9.6 22% | 11.3 43% |
| Load (h) | 1.4 | 2.2 57% | 2.8 100% | 1.9 36% | 2.6 86% |
Pro
Contra

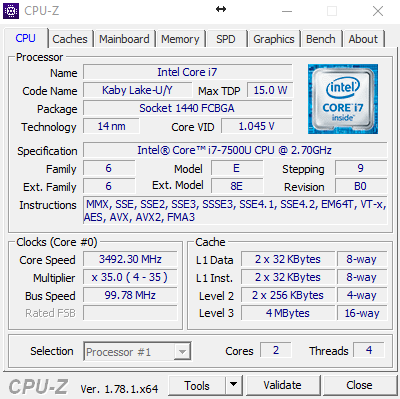
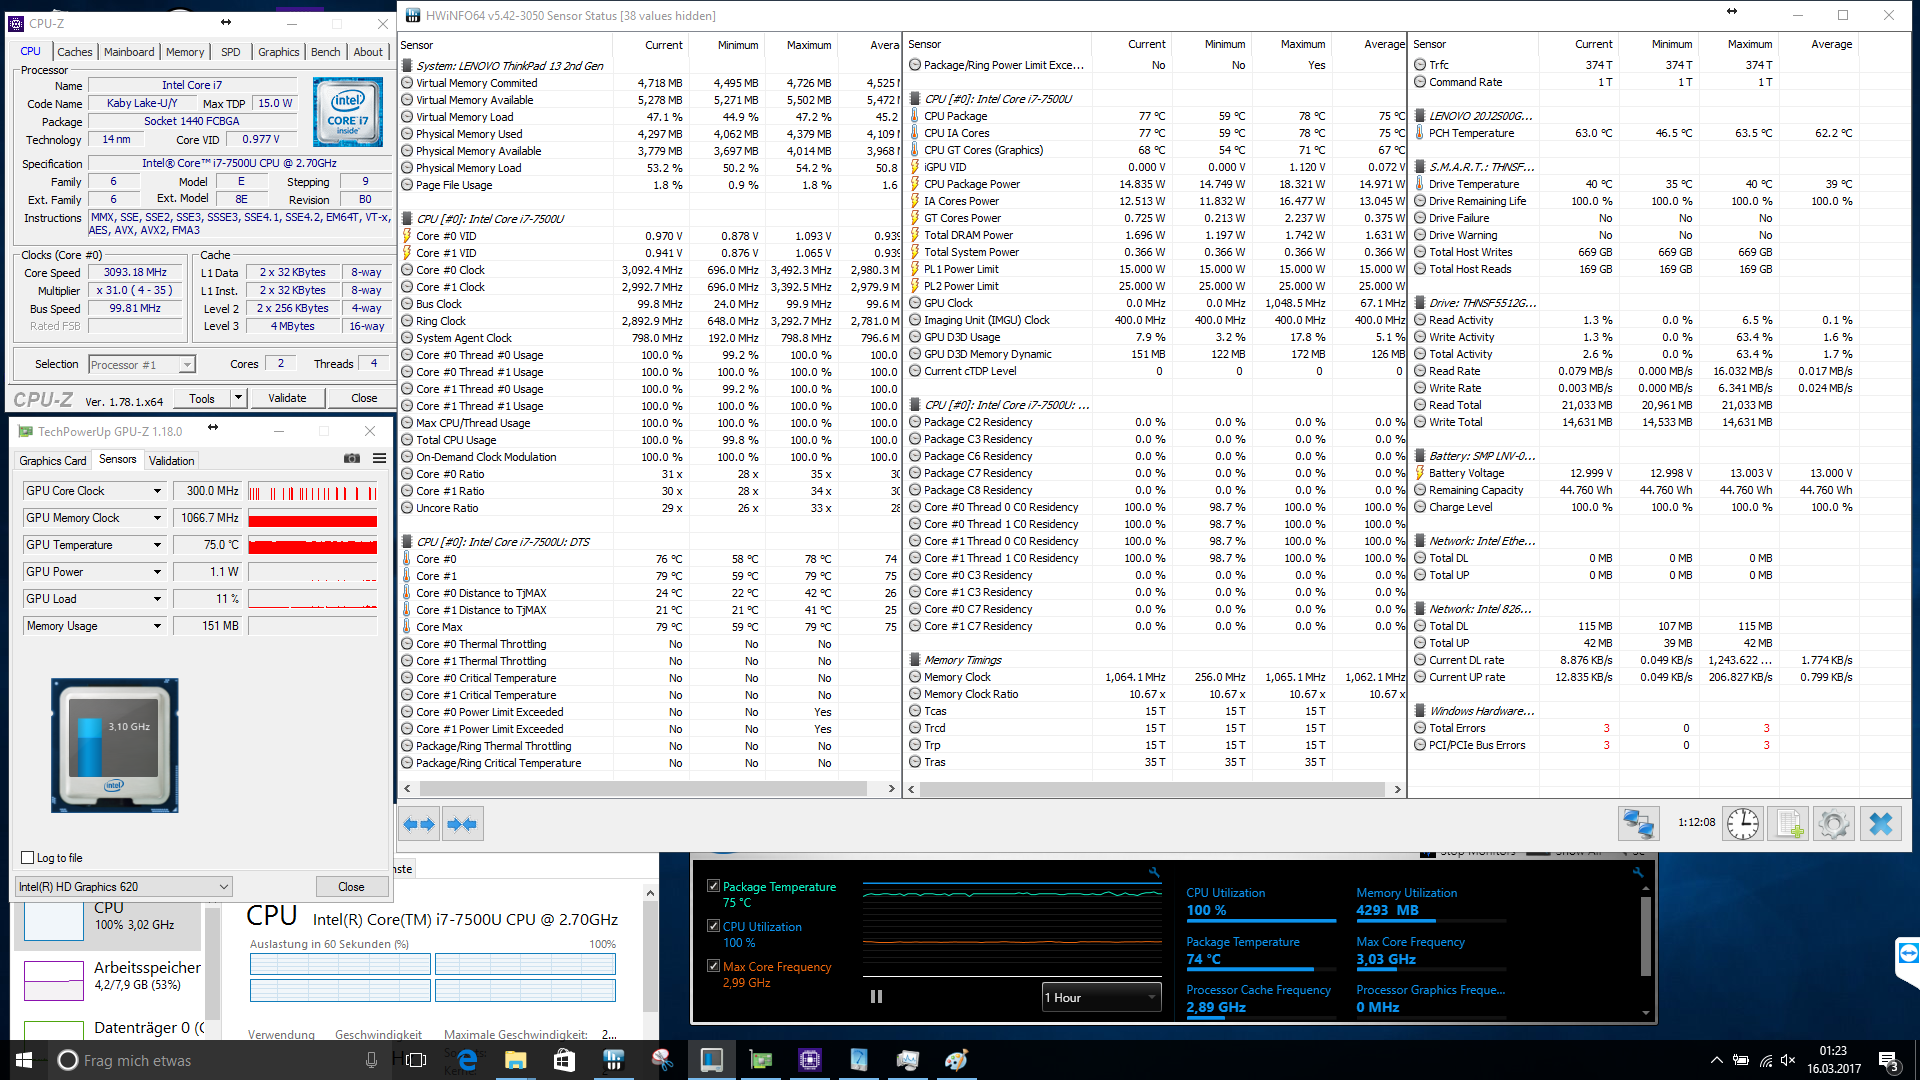
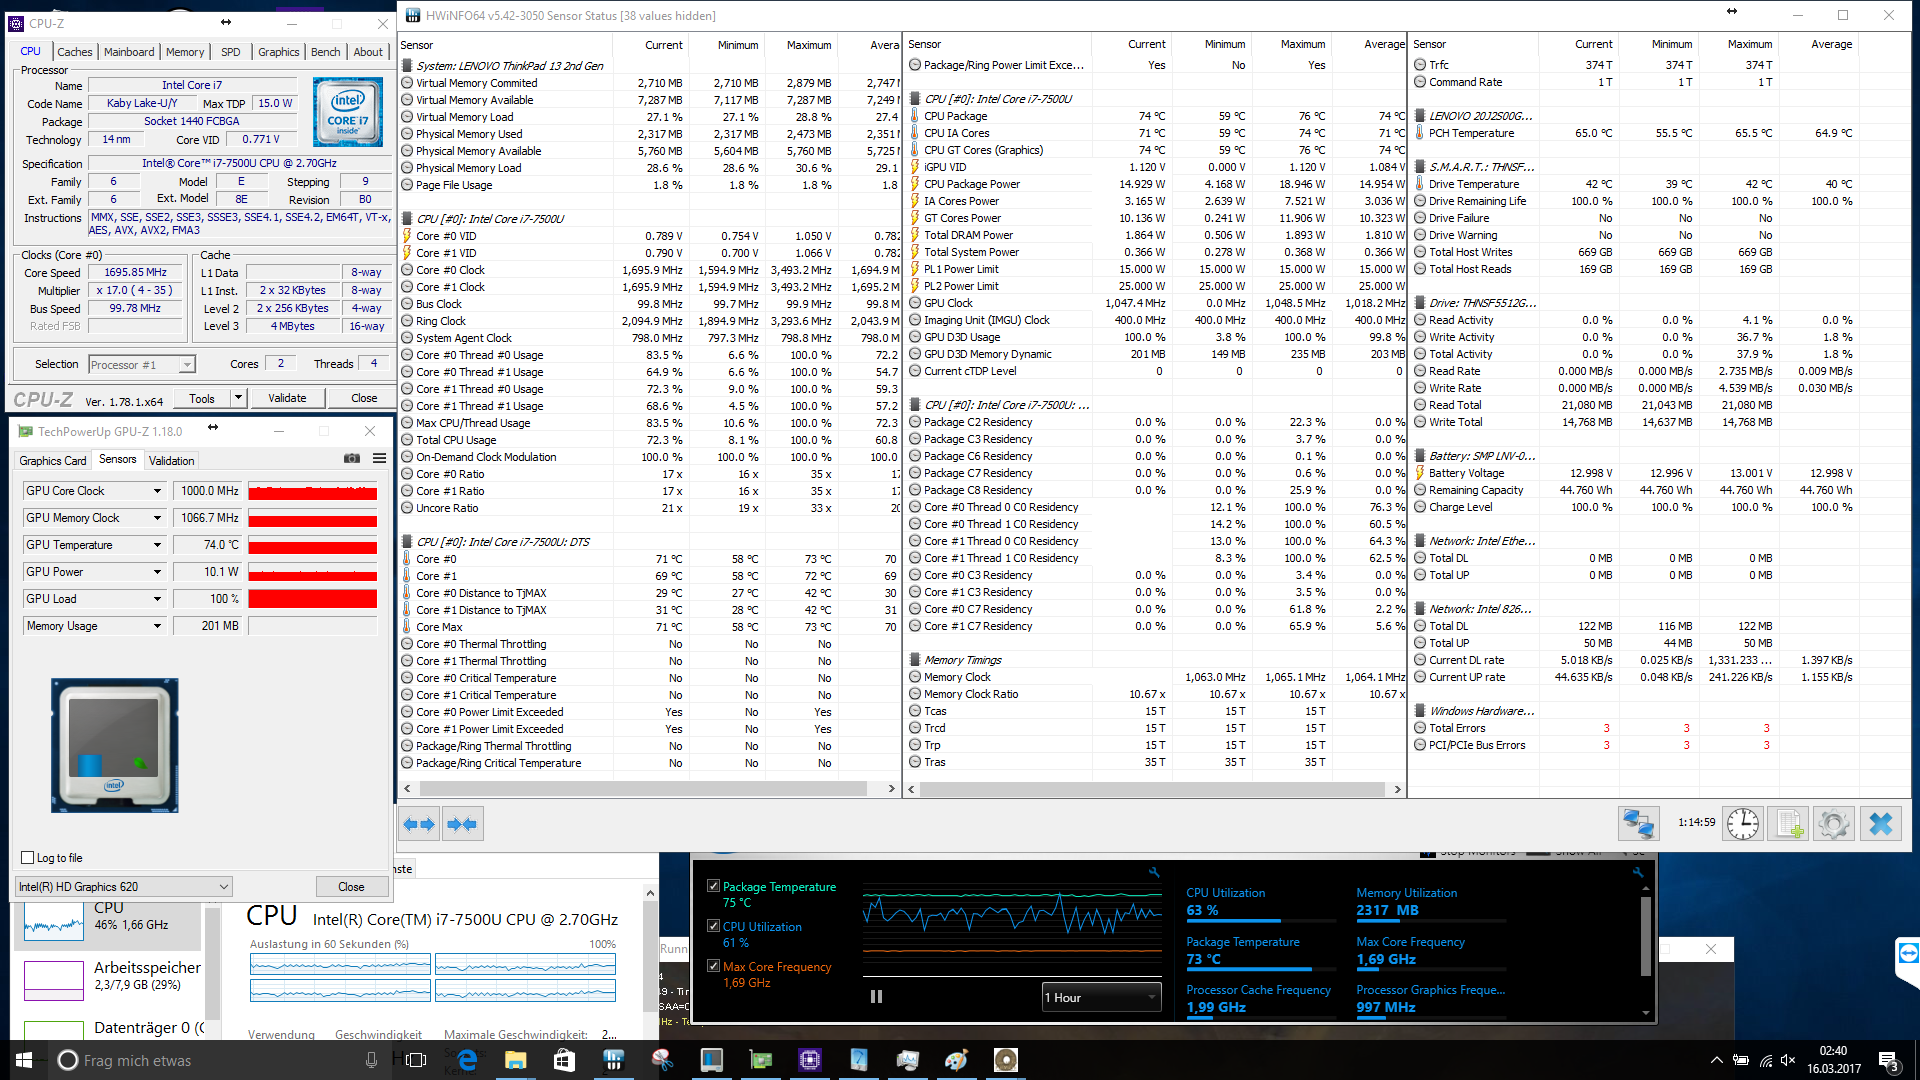
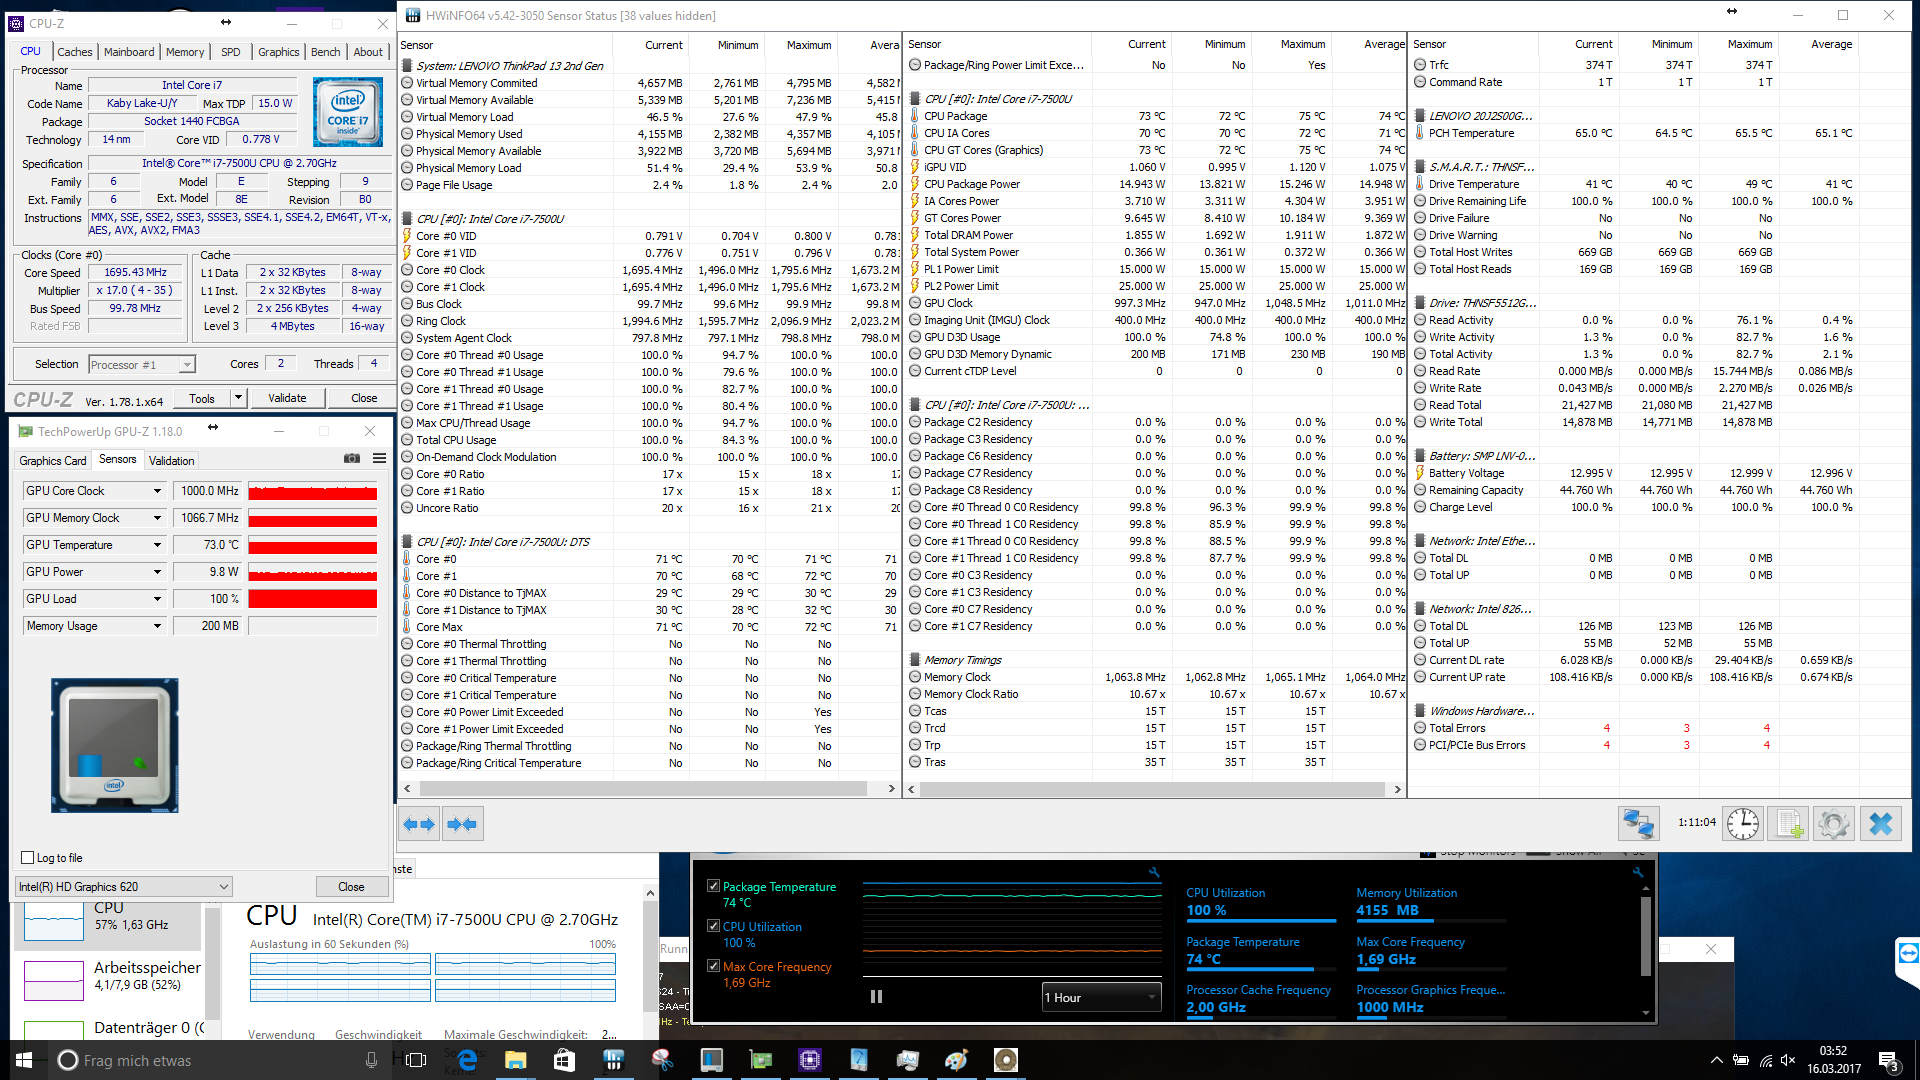
El Lenovo ThinkPad 13 (2017) es un sólido portátil business básico. El rendimiento que presenta justifica su precio de compra de 1230 Euros. Los compradores se llevan una veloz Intel Core i7-7500U que puede desarrollar una gran parte de su potencial incluso bajo carga (sin ralentización térmica). El SSD de 512GB es veloz y está al día gracias al interfaz PCIe. Los 8 GB de RAM DDR4 son suficientes para la mayoría de aplicaciones ofimáticas y se puede ampliar con un segundo módulo cuando sea necesario.
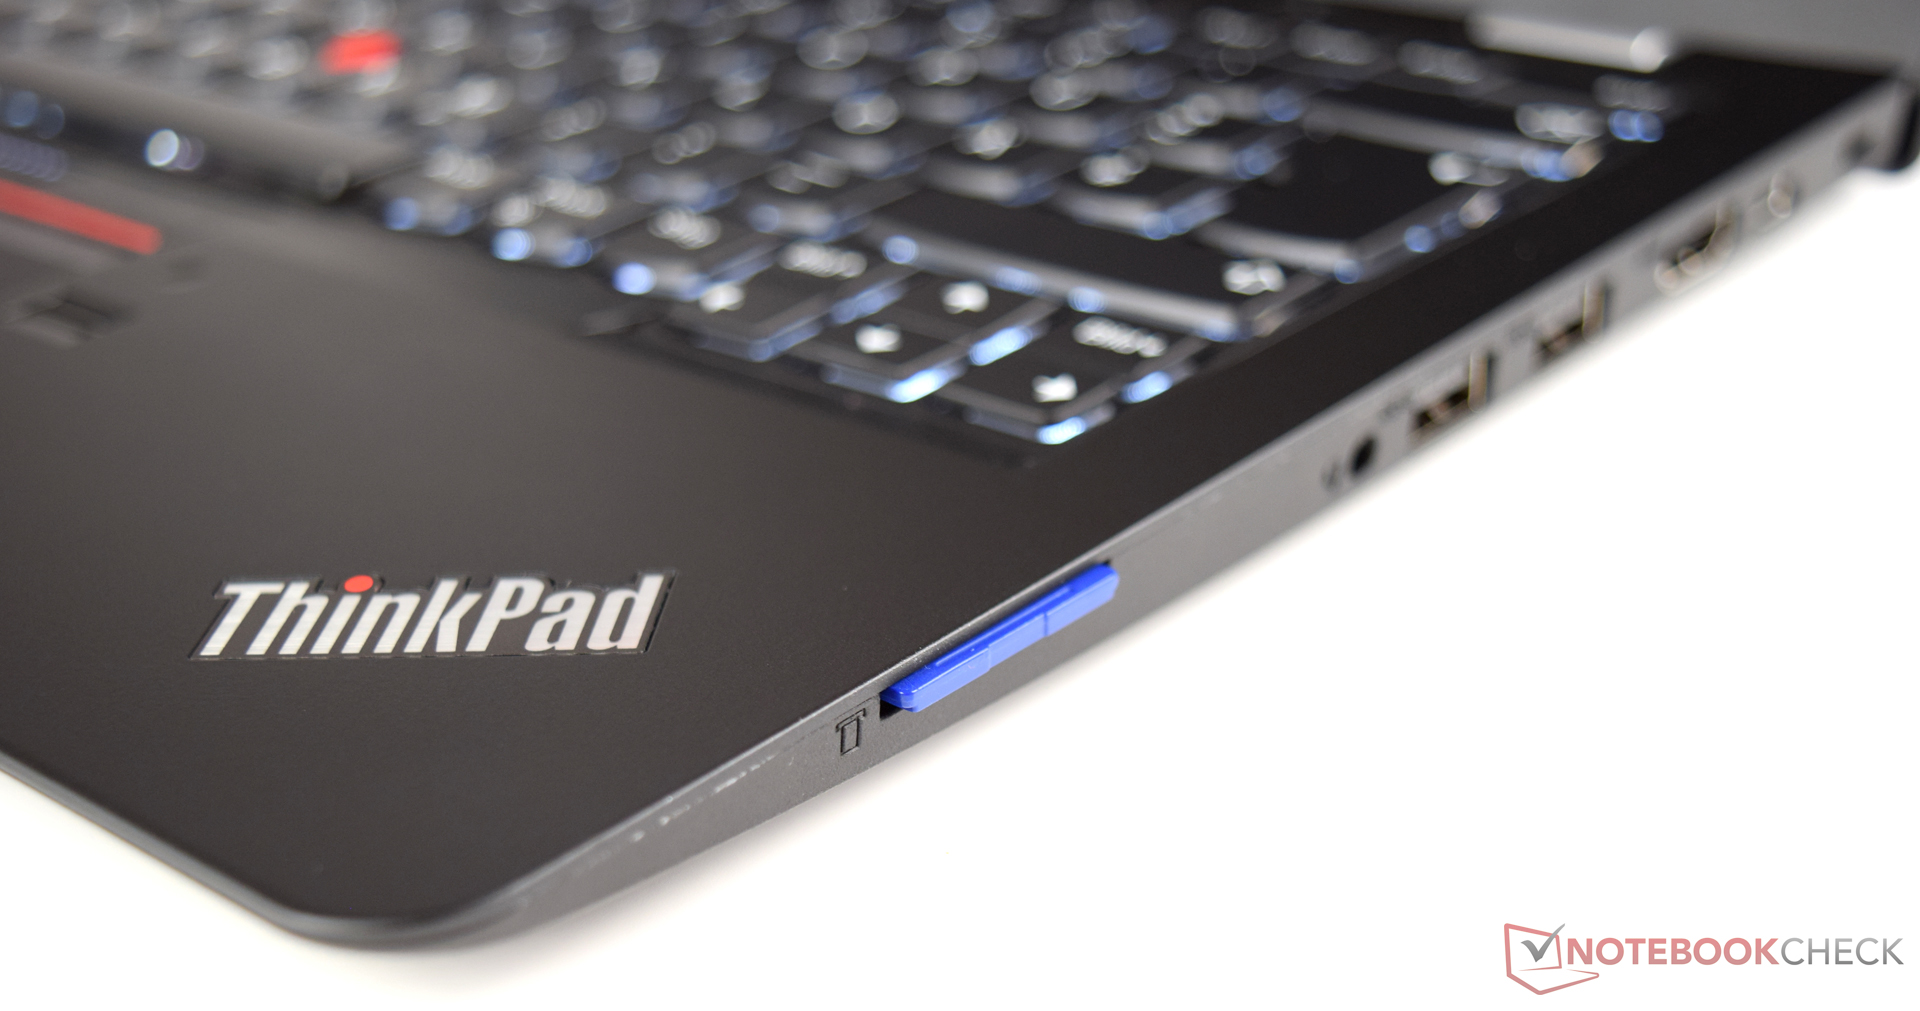
El Lenovo ThinkPad 13 (2017) llama la atención en la categoría business principalmente con su buena relación precio-rendimiento. Los usuarios que no necesiten un lector SmartCard y puedan aceptar la garantía de 12 meses deberían echarle un vistazo de cerca a la línea ThinkPad 13.
Como hemos dicho, la falta de un lector de SmartCard que no está disponible opcionalmente puede llevar a los compradores a dispositivos que sí ofrezcan esta característica. En resumen, nos gusta mucho el Lenovo ThinkPad 13 (2017). El dispositivo puntúa principalmente con sus buenos dispositivos de entrada y su buen rendimiento general. La pantalla es un poco de todo, ya que tiene buen brillo por un lado, pero muy poca cobertura de color por la otra. Sin embargo, estas críticas no deberían jugar un papel importante en la decisión de compra si el dispositivo se va a usar como sustituto de sobremesa con una base anclable opcional.
Ésta es una versión acortada del análisis original. Puedes leer el análisis completo en inglés aquí.
Lenovo ThinkPad 13-20J2S00G00
- 03/20/2017 v6 (old)
Sebastian Bade