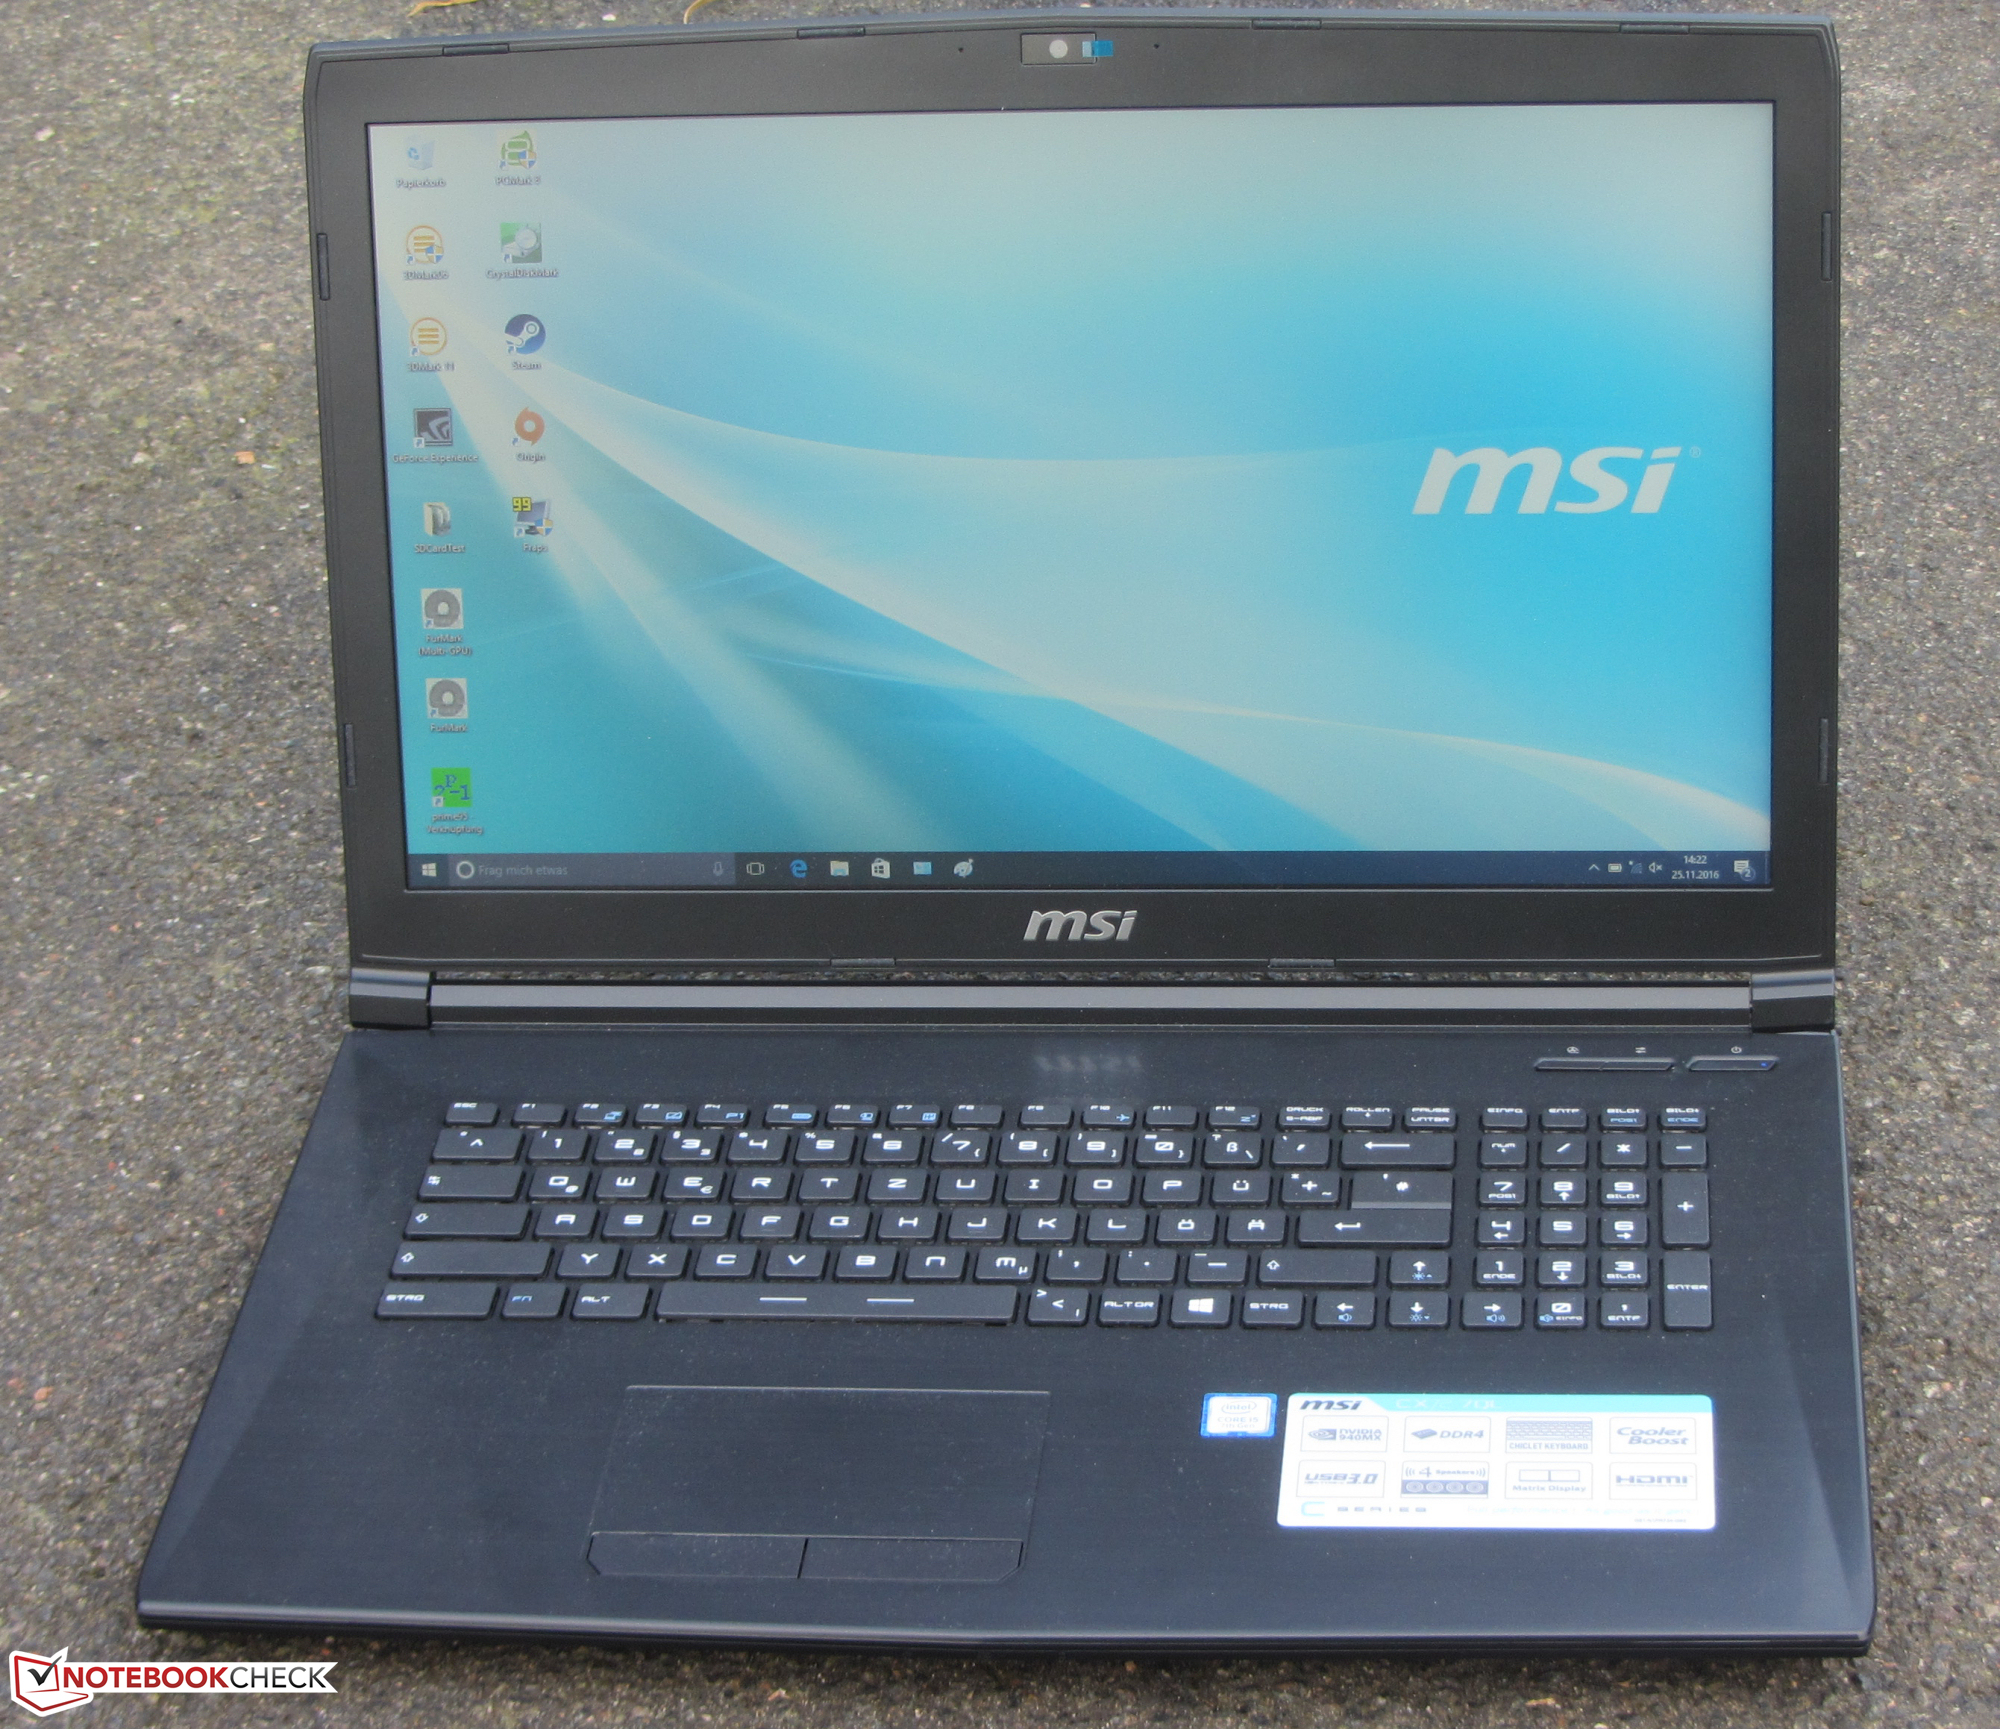
Breve análisis del MSI CX72-7QLi581
| SD Card Reader | |
| average JPG Copy Test (av. of 3 runs) | |
| Acer Aspire E5-774G-78NA | |
| Asus F756UX-T7013T | |
| MSI CX72-7QLi581 | |
| Lenovo IdeaPad 300-17ISK 80QH001EGE | |
| Acer TravelMate P278-MG-76L2 | |
| maximum AS SSD Seq Read Test (1GB) | |
| Acer Aspire E5-774G-78NA | |
| Asus F756UX-T7013T | |
| Acer TravelMate P278-MG-76L2 | |
| Lenovo IdeaPad 300-17ISK 80QH001EGE | |
| MSI CX72-7QLi581 | |
| Networking | |
| iperf Server (receive) TCP 1 m | |
| Acer Aspire E5-774G-78NA (seb) | |
| MSI CX72-7QLi581 (jseb) | |
| iperf Client (transmit) TCP 1 m | |
| Acer Aspire E5-774G-78NA (seb) | |
| MSI CX72-7QLi581 (jseb) | |
| |||||||||||||||||||||||||
iluminación: 77 %
Brillo con batería: 268 cd/m²
Contraste: 273:1 (Negro: 0.98 cd/m²)
ΔE ColorChecker Calman: 11.26 | ∀{0.5-29.43 Ø4.73}
ΔE Greyscale Calman: 12.45 | ∀{0.09-98 Ø4.97}
71% sRGB (Argyll 1.6.3 3D)
46% AdobeRGB 1998 (Argyll 1.6.3 3D)
52% AdobeRGB 1998 (Argyll 3D)
70.8% sRGB (Argyll 3D)
53% Display P3 (Argyll 3D)
Gamma: 2.03
CCT: 12273 K
| MSI CX72-7QLi581 TN LED, 1600x900, 17.3" | Acer Aspire E5-774G-78NA TN LED, 1920x1080, 17.3" | Asus F756UX-T7013T TN LED, 1920x1080, 17.3" | Acer TravelMate P278-MG-76L2 TN LED, 1920x1080, 17.3" | Lenovo IdeaPad 300-17ISK 80QH001EGE TN LED, 1600x900, 17.3" | |
|---|---|---|---|---|---|
| Display | 34% | 26% | 28% | 3% | |
| Display P3 Coverage (%) | 53 | 72.3 36% | 63.9 21% | 68.8 30% | 52.4 -1% |
| sRGB Coverage (%) | 70.8 | 94.8 34% | 93.7 32% | 90.6 28% | 76.1 7% |
| AdobeRGB 1998 Coverage (%) | 52 | 69.3 33% | 64.6 24% | 66.3 27% | 54.2 4% |
| Response Times | 6% | 9% | 7% | 3% | |
| Response Time Grey 50% / Grey 80% * (ms) | 43 ? | 43 ? -0% | 42 ? 2% | 41 ? 5% | 42 ? 2% |
| Response Time Black / White * (ms) | 25 ? | 22 ? 12% | 21 ? 16% | 23 ? 8% | 24 ? 4% |
| PWM Frequency (Hz) | 50 ? | 1000 ? | 1000 ? | 1000 ? | |
| Screen | 46% | 73% | 35% | 12% | |
| Brightness middle (cd/m²) | 268 | 320 19% | 268 0% | 362 35% | 205 -24% |
| Brightness (cd/m²) | 262 | 302 15% | 255 -3% | 344 31% | 182 -31% |
| Brightness Distribution (%) | 77 | 86 12% | 83 8% | 84 9% | 77 0% |
| Black Level * (cd/m²) | 0.98 | 0.4 59% | 0.17 83% | 0.57 42% | 0.43 56% |
| Contrast (:1) | 273 | 800 193% | 1576 477% | 635 133% | 477 75% |
| Colorchecker dE 2000 * | 11.26 | 7.78 31% | 7.18 36% | 9.54 15% | 9.75 13% |
| Colorchecker dE 2000 max. * | 17.88 | 12.74 29% | 11.67 35% | 16.11 10% | 16.02 10% |
| Greyscale dE 2000 * | 12.45 | 8.87 29% | 7.97 36% | 10.39 17% | 12.09 3% |
| Gamma | 2.03 108% | 2.27 97% | 2.34 94% | 2.55 86% | 2.62 84% |
| CCT | 12273 53% | 8979 72% | 8541 76% | 11093 59% | 12875 50% |
| Color Space (Percent of AdobeRGB 1998) (%) | 46 | 62 35% | 59 28% | 59 28% | 49 7% |
| Color Space (Percent of sRGB) (%) | 71 | 95 34% | 94 32% | 90 27% | 76 7% |
| Media total (Programa/Opciones) | 29% /
38% | 36% /
55% | 23% /
30% | 6% /
9% |
* ... más pequeño es mejor
Parpadeo de Pantalla / PWM (Pulse-Width Modulation)
| Parpadeo de Pantalla / PWM detectado | 50 Hz | ≤ 50 % de brillo | 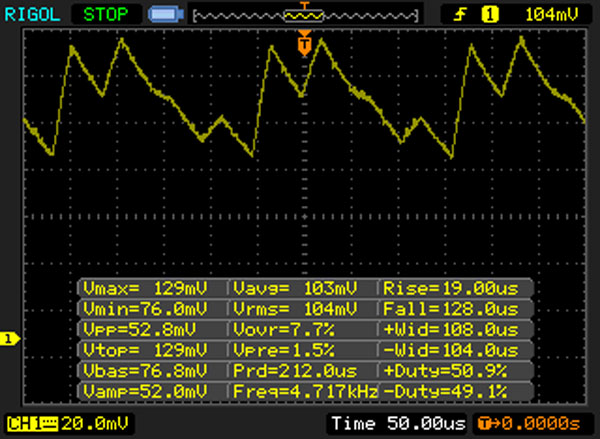 |
La retroiluminación del display parpadea a 50 Hz (seguramente usa PWM - Pulse-Width Modulation) a un brillo del 50 % e inferior. Sobre este nivel de brillo no debería darse parpadeo / PWM. La frecuencia de 50 Hz es bajísima, por lo que el parpadeo puede causar fatiga visual y cefaleas cuando se usa mucho tiempo. Comparación: 52 % de todos los dispositivos testados no usaron PWM para atenuar el display. Si se usó, medimos una media de 7784 (mínimo: 5 - máxmo: 343500) Hz. | |||
Tiempos de respuesta del display
| ↔ Tiempo de respuesta de Negro a Blanco | ||
|---|---|---|
| 25 ms ... subida ↗ y bajada ↘ combinada | ↗ 7 ms subida | 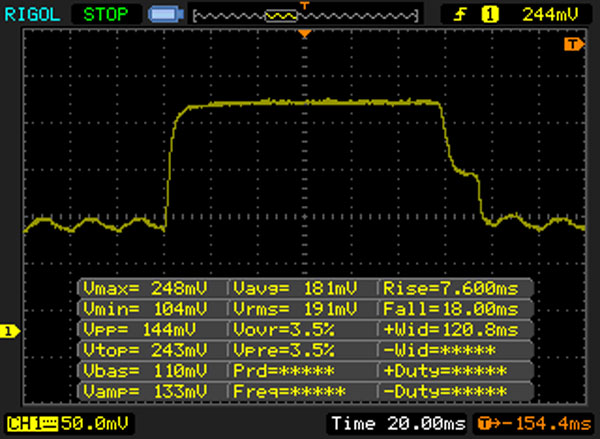 |
| ↘ 18 ms bajada | ||
| La pantalla mostró tiempos de respuesta relativamente lentos en nuestros tests pero podría ser demasiado lenta para los jugones. En comparación, todos los dispositivos de prueba van de ##min### (mínimo) a 240 (máximo) ms. » 59 % de todos los dispositivos son mejores. Eso quiere decir que el tiempo de respuesta es peor que la media (19.9 ms) de todos los dispositivos testados. | ||
| ↔ Tiempo de respuesta 50% Gris a 80% Gris | ||
| 43 ms ... subida ↗ y bajada ↘ combinada | ↗ 22 ms subida | 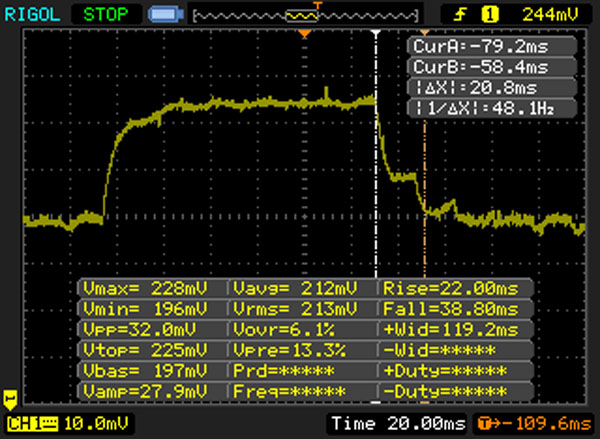 |
| ↘ 21 ms bajada | ||
| La pantalla mostró tiempos de respuesta lentos en nuestros tests y podría ser demasiado lenta para los jugones. En comparación, todos los dispositivos de prueba van de ##min### (mínimo) a 636 (máximo) ms. » 71 % de todos los dispositivos son mejores. Eso quiere decir que el tiempo de respuesta es peor que la media (31.1 ms) de todos los dispositivos testados. | ||
| Cinebench R15 | |
| CPU Single 64Bit | |
| Acer Aspire E5-774G-78NA | |
| Acer TravelMate P278-MG-76L2 | |
| MSI CX72-7QLi581 | |
| Lenovo IdeaPad 300-17ISK 80QH001EGE | |
| Asus F756UX-T7013T | |
| CPU Multi 64Bit | |
| MSI CX72-7QLi581 | |
| Acer Aspire E5-774G-78NA | |
| Acer TravelMate P278-MG-76L2 | |
| Lenovo IdeaPad 300-17ISK 80QH001EGE | |
| Asus F756UX-T7013T | |
| Geekbench 3 | |
| 32 Bit Single-Core Score | |
| Acer Aspire E5-774G-78NA | |
| MSI CX72-7QLi581 | |
| Lenovo IdeaPad 300-17ISK 80QH001EGE | |
| 32 Bit Multi-Core Score | |
| Acer Aspire E5-774G-78NA | |
| MSI CX72-7QLi581 | |
| Lenovo IdeaPad 300-17ISK 80QH001EGE | |
| Geekbench 4.0 | |
| 64 Bit Single-Core Score | |
| MSI CX72-7QLi581 | |
| 64 Bit Multi-Core Score | |
| MSI CX72-7QLi581 | |
| JetStream 1.1 - 1.1 Total | |
| Acer Aspire E5-774G-78NA | |
| MSI CX72-7QLi581 | |
| Lenovo IdeaPad 300-17ISK 80QH001EGE | |
| Acer TravelMate P278-MG-76L2 | |
| PCMark 8 Home Score Accelerated v2 | 3586 puntos | |
ayuda | ||
| PCMark 8 - Home Score Accelerated v2 | |
| Acer Aspire E5-774G-78NA | |
| MSI CX72-7QLi581 | |
| Acer TravelMate P278-MG-76L2 | |
| Lenovo IdeaPad 300-17ISK 80QH001EGE | |
| Asus F756UX-T7013T | |

| MSI CX72-7QLi581 WDC Scorpio Blue WD10JPVX-22JC3T0 | Acer Aspire E5-774G-78NA Lite-On CV1-8B256 | Asus F756UX-T7013T HGST Travelstar 5K1000 HTS541010A9E680 | Acer TravelMate P278-MG-76L2 Lite-On CV1-8B256 | Lenovo IdeaPad 300-17ISK 80QH001EGE Toshiba MQ01ABD100 | |
|---|---|---|---|---|---|
| CrystalDiskMark 3.0 | 9146% | -6% | 7900% | -17% | |
| Read Seq (MB/s) | 102.8 | 520 406% | 105.8 3% | 473 360% | 100.6 -2% |
| Write Seq (MB/s) | 100.2 | 332.8 232% | 105 5% | 366.3 266% | 96.3 -4% |
| Read 512 (MB/s) | 34.83 | 382.8 999% | 33.33 -4% | 329.4 846% | 28.15 -19% |
| Write 512 (MB/s) | 46.87 | 357.7 663% | 39.12 -17% | 357.3 662% | 43.34 -8% |
| Read 4k (MB/s) | 0.422 | 32.31 7556% | 0.413 -2% | 30.83 7206% | 0.312 -26% |
| Write 4k (MB/s) | 1.063 | 85.1 7906% | 0.947 -11% | 74.8 6937% | 0.792 -25% |
| Read 4k QD32 (MB/s) | 0.918 | 277.7 30151% | 0.812 -12% | 245.1 26599% | 0.708 -23% |
| Write 4k QD32 (MB/s) | 1.064 | 269.8 25257% | 0.968 -9% | 217.3 20323% | 0.764 -28% |
| 3DMark 11 Performance | 2508 puntos | |
ayuda | ||
| 3DMark 11 - 1280x720 Performance GPU | |
| Asus F756UX-T7013T | |
| Acer Aspire E5-774G-78NA | |
| MSI CX72-7QLi581 | |
| Acer TravelMate P278-MG-76L2 | |
| Lenovo IdeaPad 300-17ISK 80QH001EGE | |
| bajo | medio | alto | ultra | |
|---|---|---|---|---|
| BioShock Infinite (2013) | 99.9 | 53.8 | 45 | |
| Call of Duty Infinite Warfare (2016) | 37.6 | 34.4 | 17.8 | |
| Dishonored 2 (2016) | 18 | 14.7 |
Ruido
| Ocioso |
| 30.9 / 30.9 / 30.9 dB(A) |
| HDD |
| 31.4 dB(A) |
| DVD |
| 36.3 / dB(A) |
| Carga |
| 34 / 34.2 dB(A) |
 | ||
30 dB silencioso 40 dB(A) audible 50 dB(A) ruidosamente alto |
||
min: | ||
(±) La temperatura máxima en la parte superior es de 40.1 °C / 104 F, frente a la media de 36.8 °C / 98 F, que oscila entre 21 y 71 °C para la clase Multimedia.
(+) El fondo se calienta hasta un máximo de 36.6 °C / 98 F, frente a la media de 39.1 °C / 102 F
(+) En reposo, la temperatura media de la parte superior es de 25.2 °C / 77# F, frente a la media del dispositivo de 31.3 °C / 88 F.
(+) El reposamanos y el panel táctil están a una temperatura inferior a la de la piel, con un máximo de 31.7 °C / 89.1 F y, por tanto, son fríos al tacto.
(-) La temperatura media de la zona del reposamanos de dispositivos similares fue de 28.7 °C / 83.7 F (-3 °C / -5.4 F).
Apple MacBook 12 (Early 2016) 1.1 GHz análisis de audio
(+) | los altavoces pueden reproducir a un volumen relativamente alto (#83.6 dB)
Graves 100 - 315 Hz
(±) | lubina reducida - en promedio 11.3% inferior a la mediana
(±) | la linealidad de los graves es media (14.2% delta a frecuencia anterior)
Medios 400 - 2000 Hz
(+) | medios equilibrados - a sólo 2.4% de la mediana
(+) | los medios son lineales (5.5% delta a la frecuencia anterior)
Altos 2 - 16 kHz
(+) | máximos equilibrados - a sólo 2% de la mediana
(+) | los máximos son lineales (4.5% delta a la frecuencia anterior)
Total 100 - 16.000 Hz
(+) | el sonido global es lineal (10.2% de diferencia con la mediana)
En comparación con la misma clase
» 7% de todos los dispositivos probados de esta clase eran mejores, 2% similares, 91% peores
» El mejor tuvo un delta de 5%, la media fue 18%, el peor fue ###max##%
En comparación con todos los dispositivos probados
» 5% de todos los dispositivos probados eran mejores, 1% similares, 94% peores
» El mejor tuvo un delta de 4%, la media fue 24%, el peor fue ###max##%
| Off / Standby | |
| Ocioso | |
| Carga |
|
Clave:
min: | |
| Battery Runtime - WiFi Websurfing | |
| Lenovo IdeaPad 300-17ISK 80QH001EGE | |
| Acer Aspire E5-774G-78NA | |
| Acer TravelMate P278-MG-76L2 | |
| MSI CX72-7QLi581 | |
| Asus F756UX-T7013T | |
Pro
Contra
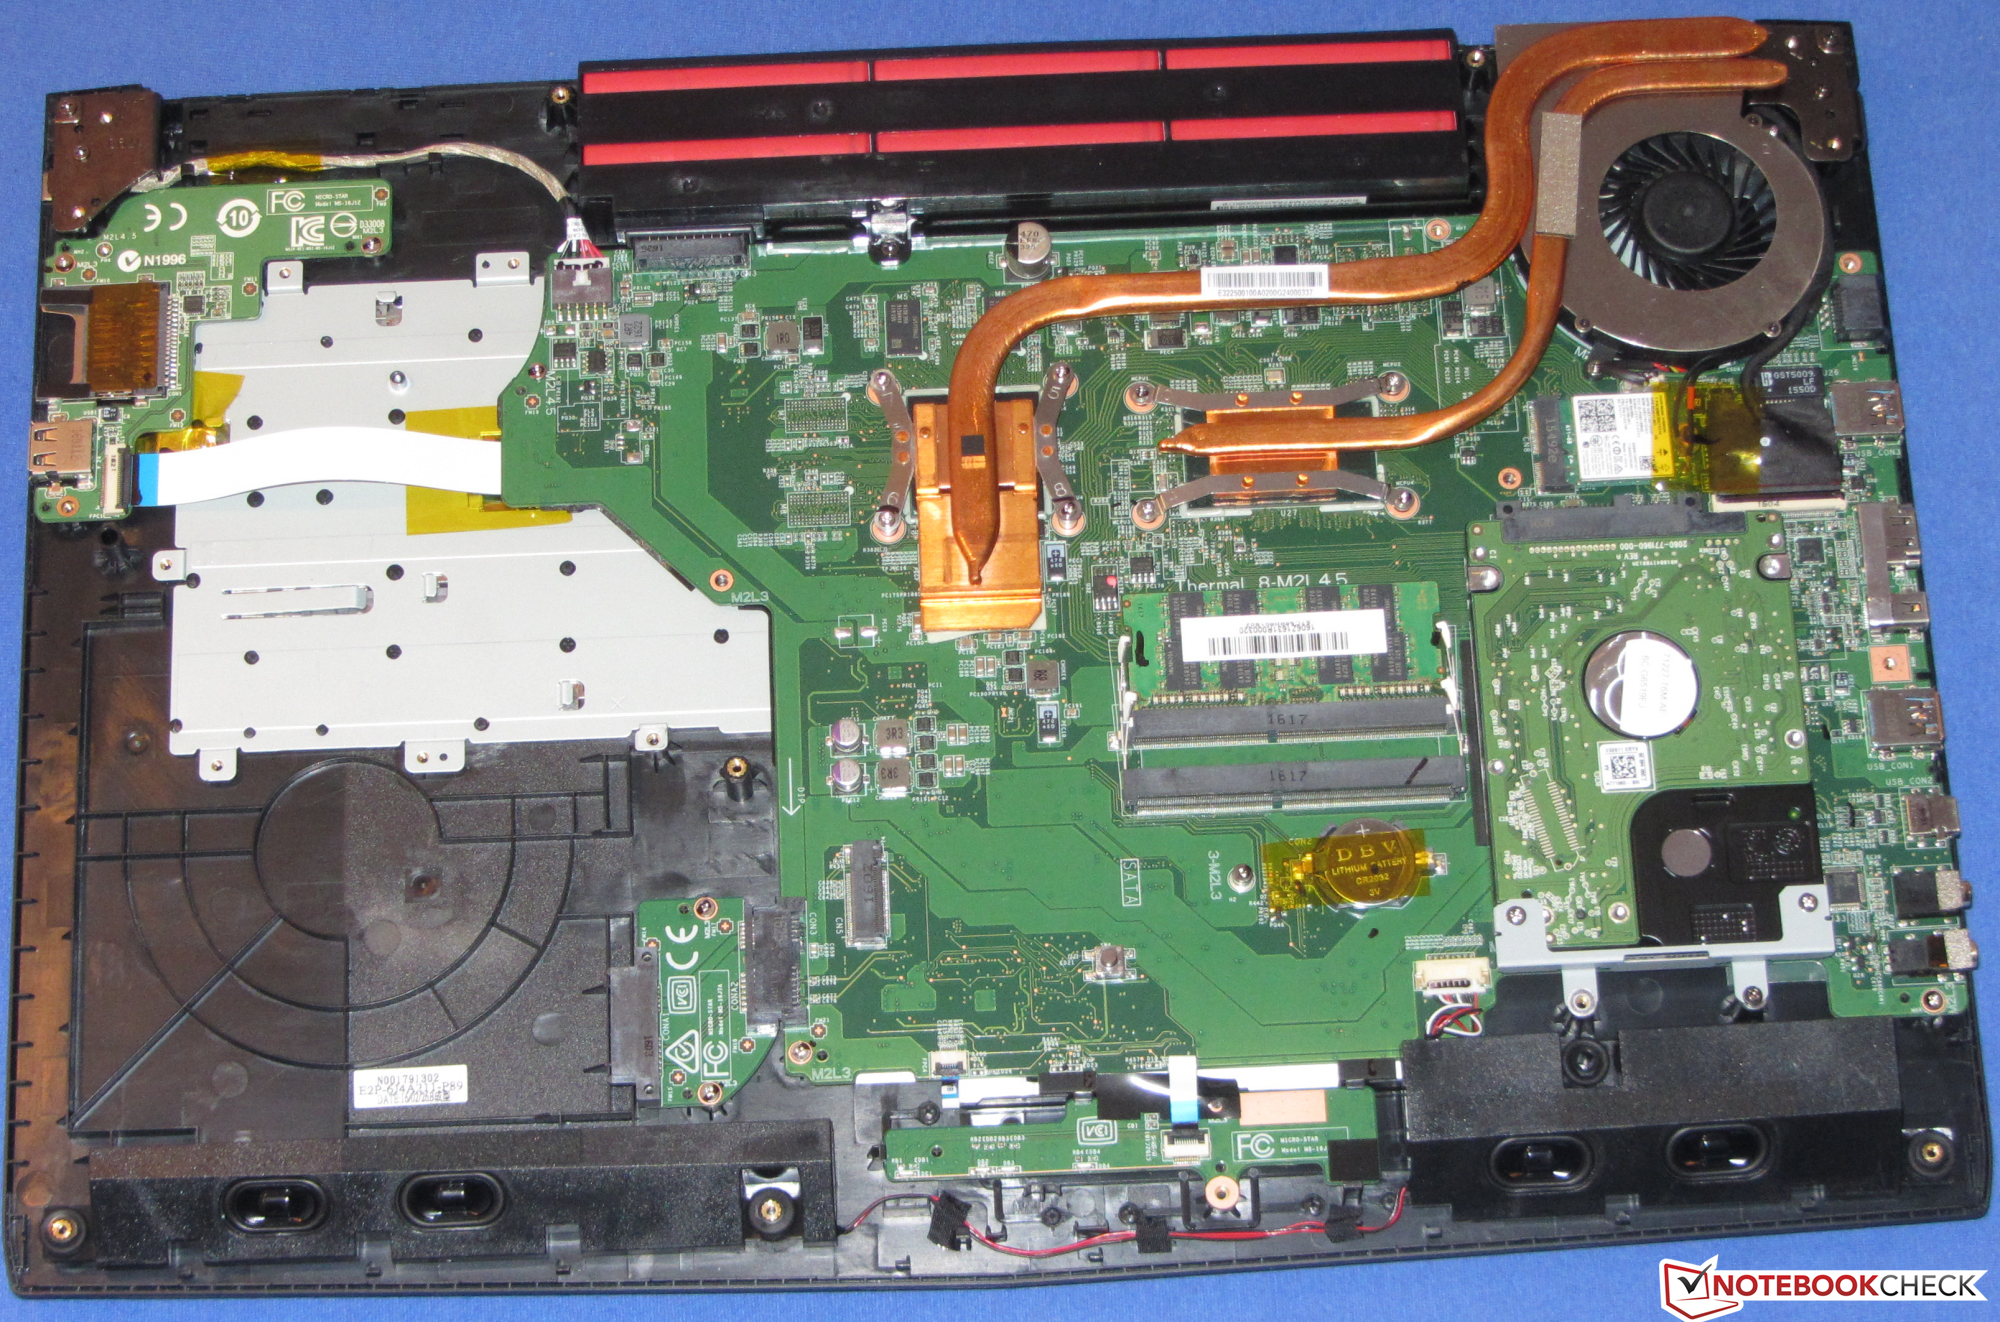
El MSI CX72-7QLi581 está destinado a su uso para tareas ofimáticas. Ofrece rendimiento suficiente para completar cualquier tarea e incluso para hacer correr algún juego. Funciona en silencio y apenas se calienta. Además, el portátil ofrece 1 TB de almacenamiento y puede ser actualizado por un SSD a través de la ranura M.2. Este procedimiento es posible a través del compartimento en la parte inferior. El teclado es muy bueno para uso doméstico y la duración de batería es decente. No nos gustó la pantalla HD+ por su escaso brillo y contraste.
El MSI CX72-7QLi581 es un solido todoterreno de 17.3-pulgadas para tareas de oficina. No tiene ningún punto particularmente destacable, pero tampoco ninguno particularmente criticable.
El Acer Aspire E5-774G recientemente analizado puede ser una buena alternativa. El E5-774G-553R está disponible por 800 euros y ofrece un HDD de 1TB además de un SSD. Tiene una pantalla FHD mucho mejor y la versión GDDR5 de la GPU GeForce 940MX, más potente.
Ésta es una versión acortada del análisis original. Puedes leer el análisis completo en inglés aquí.
MSI CX72-7QLi581
- 11/26/2016 v5.1 (old)
Sascha Mölck