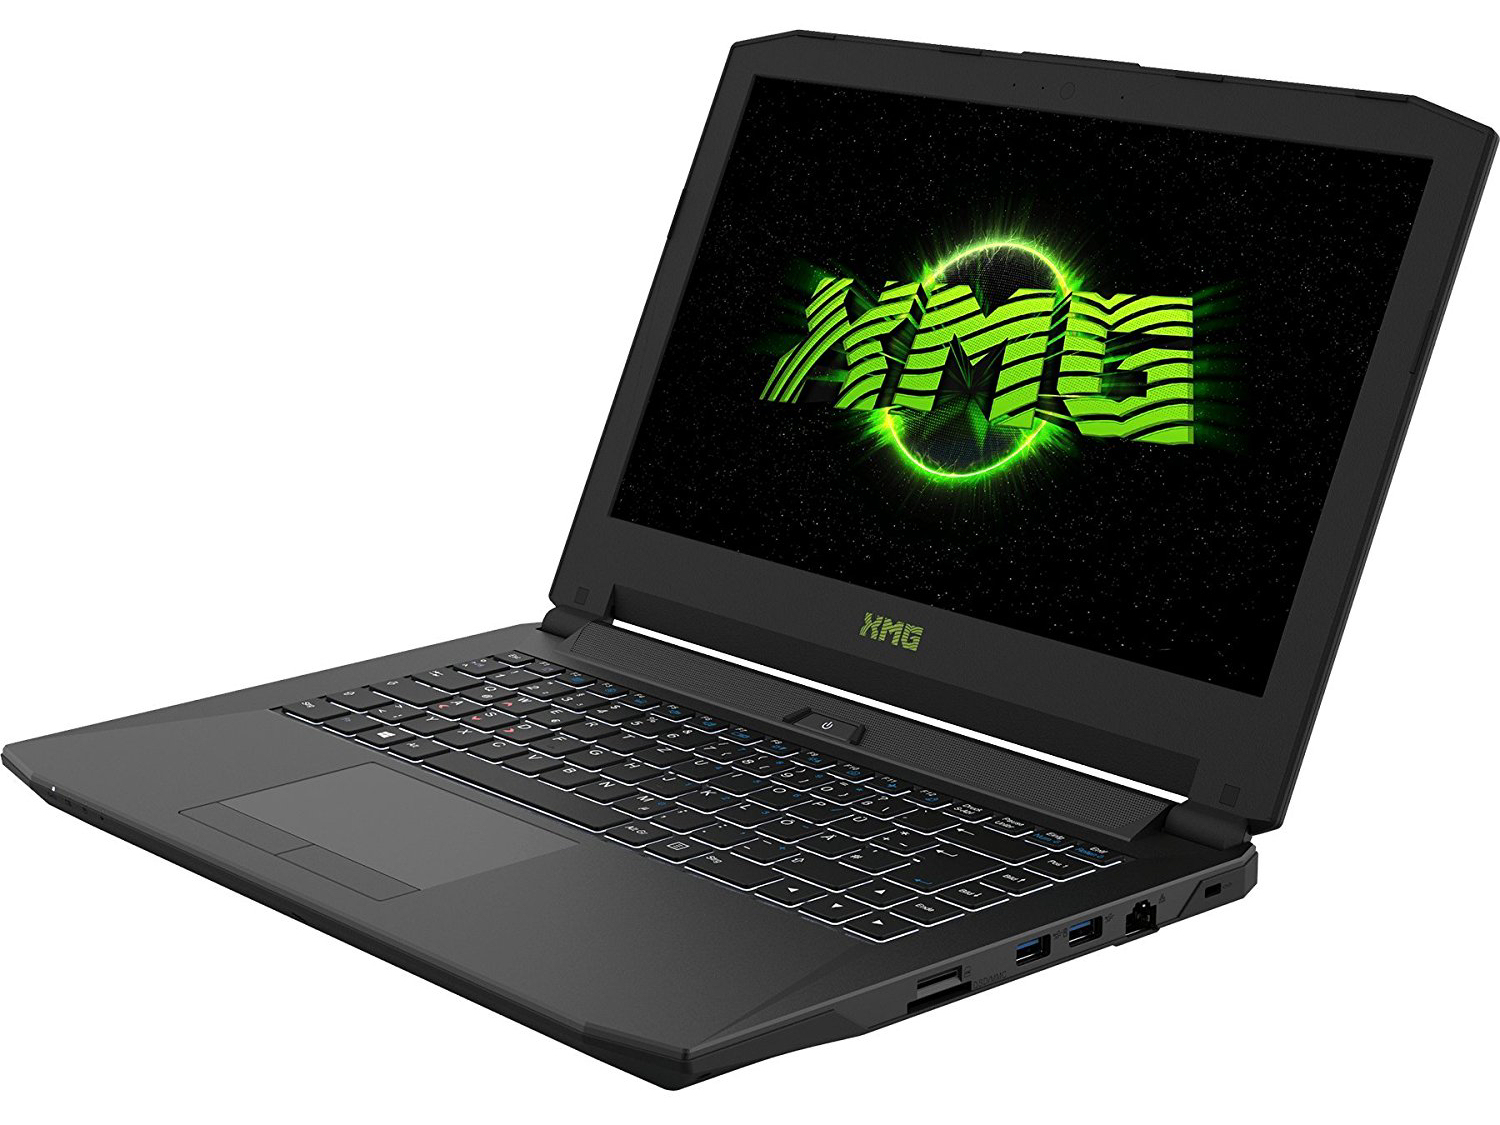
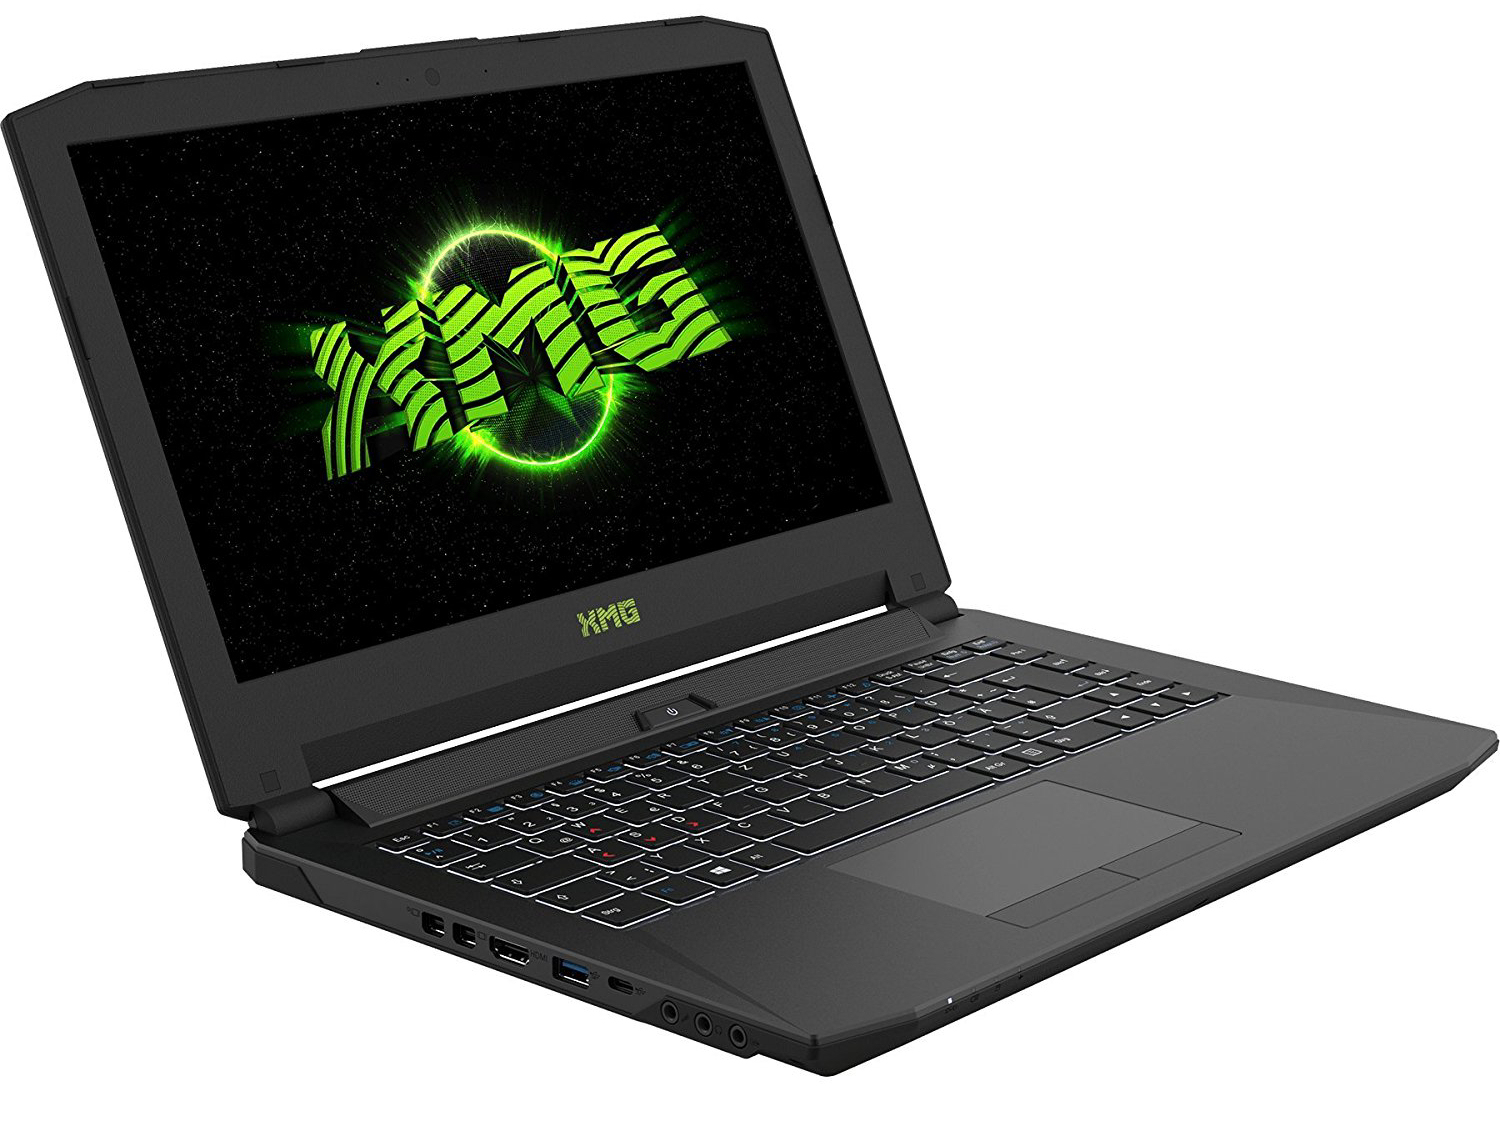
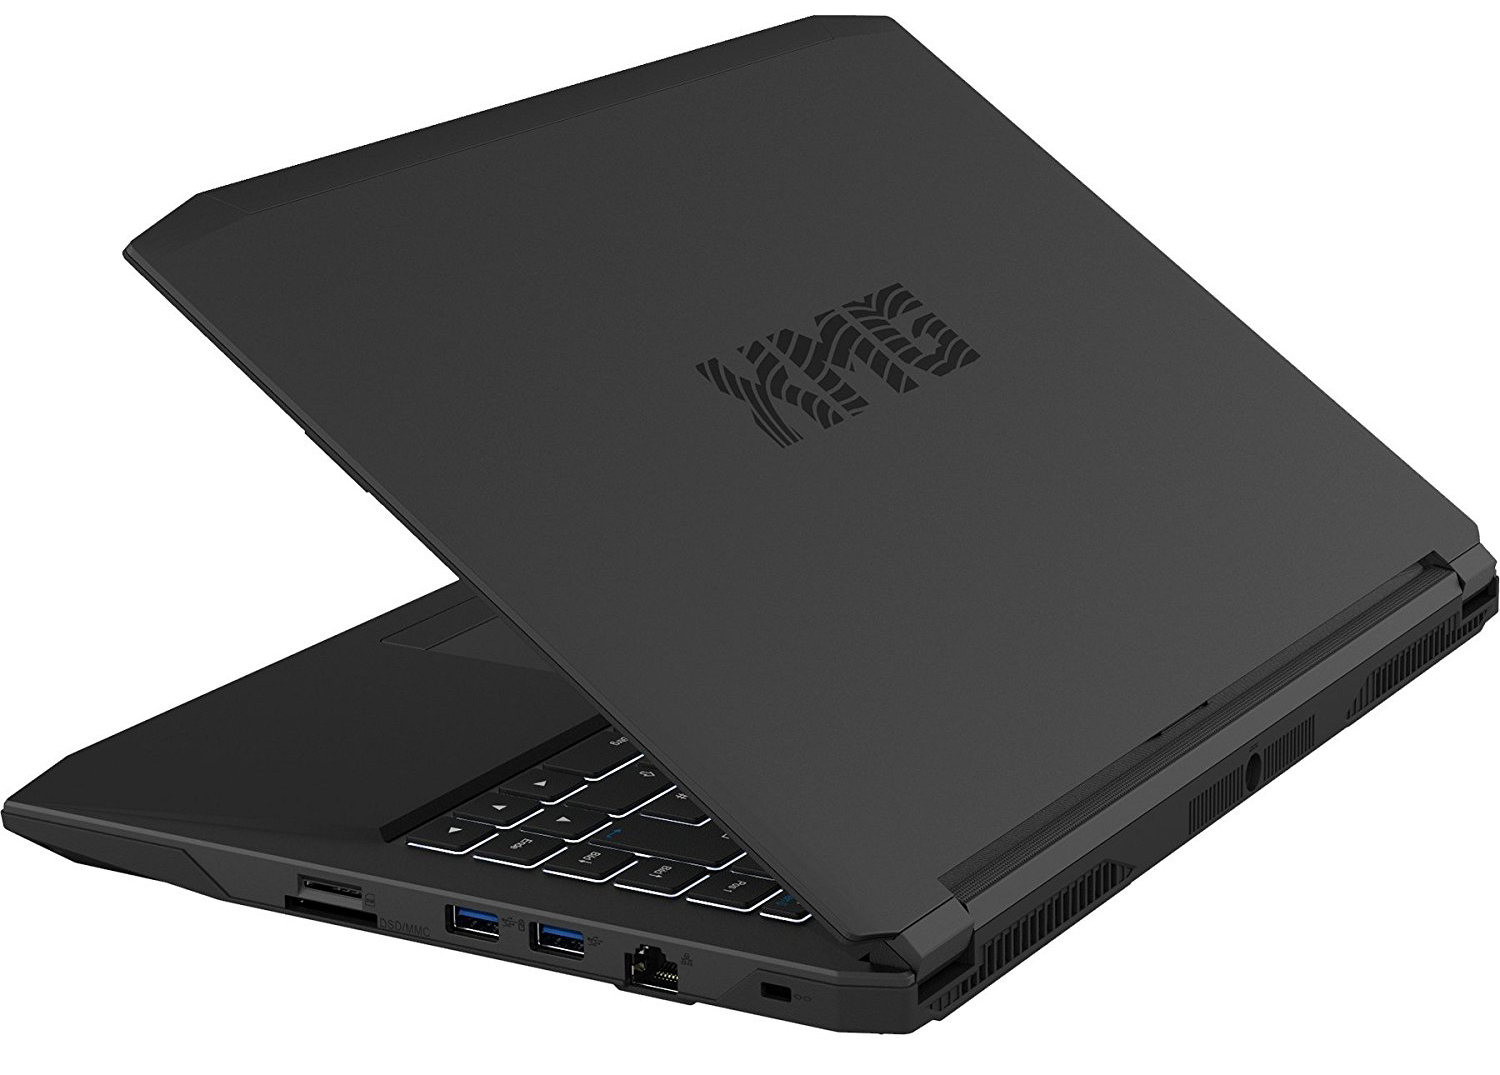
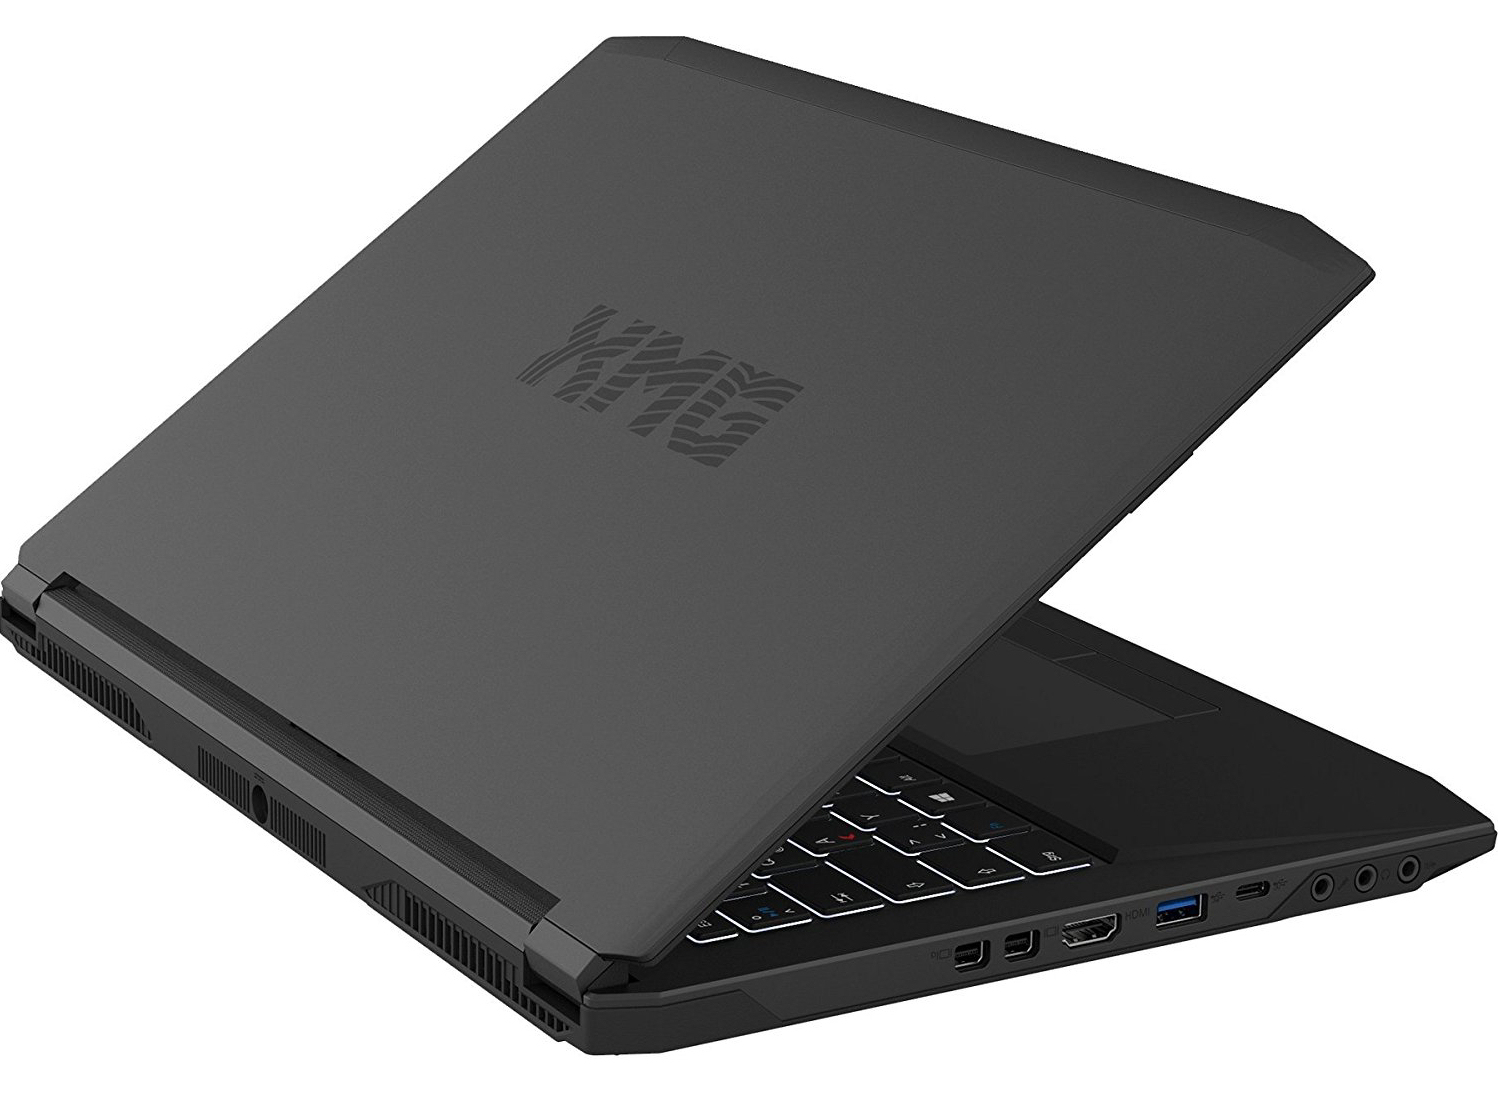
Breve análisis del Schenker Technologies XMG P407 (Clevo P641HK1)
| SD Card Reader | |
| average JPG Copy Test (av. of 3 runs) | |
| Schenker XMG P406 | |
| Schenker XMG P407 | |
| MSI GL62M 7RD-077 | |
| maximum AS SSD Seq Read Test (1GB) | |
| Schenker XMG P407 | |
| Schenker XMG P406 | |
| MSI GL62M 7RD-077 | |
| Networking | |
| iperf3 transmit AX12 | |
| Razer Blade (2016) FHD | |
| Schenker XMG P407 | |
| MSI GL62M 7RD-077 (jseb) | |
| iperf3 receive AX12 | |
| Razer Blade (2016) FHD | |
| Schenker XMG P407 | |
| MSI GL62M 7RD-077 (jseb) | |
| |||||||||||||||||||||||||
iluminación: 80 %
Brillo con batería: 298 cd/m²
Contraste: 1104:1 (Negro: 0.27 cd/m²)
ΔE ColorChecker Calman: 4.42 | ∀{0.5-29.43 Ø4.71}
ΔE Greyscale Calman: 4.11 | ∀{0.09-98 Ø4.96}
82% sRGB (Argyll 1.6.3 3D)
54% AdobeRGB 1998 (Argyll 1.6.3 3D)
60% AdobeRGB 1998 (Argyll 3D)
82.1% sRGB (Argyll 3D)
64.5% Display P3 (Argyll 3D)
Gamma: 2.5
CCT: 6329 K
| Schenker XMG P407 LG Philips LP140WF3-SPD1 (LGD046D), 1920x1080, 14" | Schenker XMG P406 LG Philips 140WF1 (LGD040A), 1920x1080, 14" | Razer Blade (2016) FHD LG Philips LP140WF3-SPD1 (LGD046D), 1920x1080, 14" | Gigabyte P34W v5 2560x1440, 14" | MSI GL62M 7RD-077 Chi Mei N156HGE-EAL, 1920x1080, 15.6" | |
|---|---|---|---|---|---|
| Display | 2% | 1% | -13% | 31% | |
| Display P3 Coverage (%) | 64.5 | 66.2 3% | 65.2 1% | 51.4 -20% | 85.4 32% |
| sRGB Coverage (%) | 82.1 | 82.8 1% | 83.4 2% | 76.6 -7% | 100 22% |
| AdobeRGB 1998 Coverage (%) | 60 | 60.5 1% | 60.9 1% | 52.8 -12% | 83.8 40% |
| Response Times | -15% | 2% | 9% | -1% | |
| Response Time Grey 50% / Grey 80% * (ms) | 47 ? | 56 ? -19% | 47 ? -0% | 41.2 ? 12% | 44 ? 6% |
| Response Time Black / White * (ms) | 27 ? | 30 ? -11% | 26 ? 4% | 25.4 ? 6% | 29 ? -7% |
| PWM Frequency (Hz) | 198 ? | ||||
| Screen | -1% | -1% | 3% | -50% | |
| Brightness middle (cd/m²) | 298 | 282 -5% | 272 -9% | 277.8 -7% | 258 -13% |
| Brightness (cd/m²) | 282 | 266 -6% | 277 -2% | 270 -4% | 234 -17% |
| Brightness Distribution (%) | 80 | 81 1% | 84 5% | 83 4% | 79 -1% |
| Black Level * (cd/m²) | 0.27 | 0.22 19% | 0.26 4% | 0.38 -41% | 0.54 -100% |
| Contrast (:1) | 1104 | 1282 16% | 1046 -5% | 731 -34% | 478 -57% |
| Colorchecker dE 2000 * | 4.42 | 4.98 -13% | 4.59 -4% | 2.71 39% | 9.74 -120% |
| Colorchecker dE 2000 max. * | 8.57 | 10.2 -19% | 8.49 1% | 5.47 36% | 14.6 -70% |
| Greyscale dE 2000 * | 4.11 | 4.08 1% | 4.28 -4% | 2.11 49% | 11.59 -182% |
| Gamma | 2.5 88% | 2.51 88% | 2.23 99% | 2.19 100% | 2.19 100% |
| CCT | 6329 103% | 5877 111% | 6848 95% | 6314 103% | 11851 55% |
| Color Space (Percent of AdobeRGB 1998) (%) | 54 | 54 0% | 55 2% | 48.5 -10% | 76 41% |
| Color Space (Percent of sRGB) (%) | 82 | 83 1% | 83 1% | 76.9 -6% | 100 22% |
| Media total (Programa/Opciones) | -5% /
-2% | 1% /
-0% | -0% /
0% | -7% /
-27% |
* ... más pequeño es mejor
Parpadeo de Pantalla / PWM (Pulse-Width Modulation)
| Parpadeo de Pantalla / PWM no detectado | 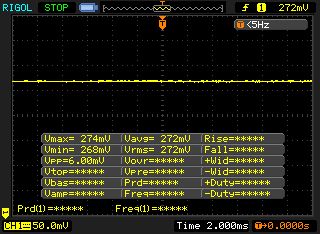 | ||
Comparación: 52 % de todos los dispositivos testados no usaron PWM para atenuar el display. Si se usó, medimos una media de 7748 (mínimo: 5 - máxmo: 343500) Hz. | |||
Tiempos de respuesta del display
| ↔ Tiempo de respuesta de Negro a Blanco | ||
|---|---|---|
| 27 ms ... subida ↗ y bajada ↘ combinada | ↗ 5 ms subida | 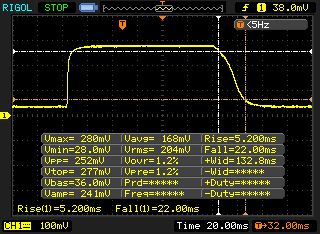 |
| ↘ 22 ms bajada | ||
| La pantalla mostró tiempos de respuesta relativamente lentos en nuestros tests pero podría ser demasiado lenta para los jugones. En comparación, todos los dispositivos de prueba van de ##min### (mínimo) a 240 (máximo) ms. » 67 % de todos los dispositivos son mejores. Eso quiere decir que el tiempo de respuesta es peor que la media (19.8 ms) de todos los dispositivos testados. | ||
| ↔ Tiempo de respuesta 50% Gris a 80% Gris | ||
| 47 ms ... subida ↗ y bajada ↘ combinada | ↗ 14 ms subida | 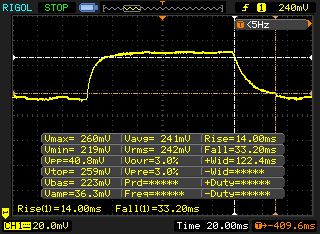 |
| ↘ 33 ms bajada | ||
| La pantalla mostró tiempos de respuesta lentos en nuestros tests y podría ser demasiado lenta para los jugones. En comparación, todos los dispositivos de prueba van de ##min### (mínimo) a 636 (máximo) ms. » 81 % de todos los dispositivos son mejores. Eso quiere decir que el tiempo de respuesta es peor que la media (30.9 ms) de todos los dispositivos testados. | ||
| Cinebench R15 | |
| CPU Single 64Bit | |
| Razer Blade (2016) FHD | |
| Schenker XMG P407 | |
| MSI GL62M 7RD-077 | |
| Schenker XMG P406 | |
| Gigabyte P34W v5 | |
| CPU Multi 64Bit | |
| Schenker XMG P407 | |
| MSI GL62M 7RD-077 | |
| Gigabyte P34W v5 | |
| Schenker XMG P406 | |
| Razer Blade (2016) FHD | |
| Cinebench R11.5 | |
| CPU Multi 64Bit | |
| MSI GL62M 7RD-077 | |
| Schenker XMG P407 | |
| Gigabyte P34W v5 | |
| Razer Blade (2016) FHD | |
| Schenker XMG P406 | |
| CPU Single 64Bit | |
| Razer Blade (2016) FHD | |
| Schenker XMG P407 | |
| Gigabyte P34W v5 | |
| MSI GL62M 7RD-077 | |
| Schenker XMG P406 | |
| Cinebench R10 | |
| Rendering Multiple CPUs 32Bit | |
| Schenker XMG P407 | |
| MSI GL62M 7RD-077 | |
| Razer Blade (2016) FHD | |
| Schenker XMG P406 | |
| Gigabyte P34W v5 | |
| Rendering Single 32Bit | |
| Schenker XMG P407 | |
| MSI GL62M 7RD-077 | |
| Razer Blade (2016) FHD | |
| Gigabyte P34W v5 | |
| Schenker XMG P406 | |
| Geekbench 3 | |
| 32 Bit Single-Core Score | |
| Schenker XMG P407 | |
| Razer Blade (2016) FHD | |
| MSI GL62M 7RD-077 | |
| 32 Bit Multi-Core Score | |
| Schenker XMG P407 | |
| MSI GL62M 7RD-077 | |
| Razer Blade (2016) FHD | |
| Geekbench 4.0 | |
| 64 Bit Single-Core Score | |
| Razer Blade (2016) FHD | |
| Schenker XMG P407 | |
| MSI GL62M 7RD-077 | |
| 64 Bit Multi-Core Score | |
| Schenker XMG P407 | |
| Razer Blade (2016) FHD | |
| MSI GL62M 7RD-077 | |
| JetStream 1.1 - 1.1 Total | |
| MSI GL62M 7RD-077 | |
| Razer Blade (2016) FHD | |
| Schenker XMG P407 | |
| PCMark 7 Score | 6266 puntos | |
| PCMark 8 Home Score Accelerated v2 | 4069 puntos | |
| PCMark 8 Creative Score Accelerated v2 | 5146 puntos | |
| PCMark 8 Work Score Accelerated v2 | 5234 puntos | |
ayuda | ||
| PCMark 8 | |
| Home Score Accelerated v2 | |
| Schenker XMG P407 | |
| Razer Blade (2016) FHD | |
| MSI GL62M 7RD-077 | |
| Gigabyte P34W v5 | |
| Schenker XMG P406 | |
| Work Score Accelerated v2 | |
| Schenker XMG P407 | |
| Schenker XMG P406 | |
| Razer Blade (2016) FHD | |
| MSI GL62M 7RD-077 | |
| Gigabyte P34W v5 | |
| PCMark 7 - Score | |
| Schenker XMG P407 | |
| Gigabyte P34W v5 | |
| Schenker XMG P406 | |
| Razer Blade (2016) FHD | |
| MSI GL62M 7RD-077 | |

| Schenker XMG P407 Samsung SM961 MZVPW256 m.2 PCI-e | Schenker XMG P406 Samsung SM951 MZHPV256HDGL m.2 PCI-e | Razer Blade (2016) FHD | Gigabyte P34W v5 Samsung SSD 950 Pro 512GB m.2 NVMe | MSI GL62M 7RD-077 HGST Travelstar 7K1000 HTS721010A9E630 | |
|---|---|---|---|---|---|
| CrystalDiskMark 3.0 | 14% | 20% | 31% | -96% | |
| Read Seq (MB/s) | 1345 | 1634 21% | 1977 47% | 2269 69% | 112.4 -92% |
| Write Seq (MB/s) | 1502 | 1290 -14% | 1668 11% | 1524 1% | 107.3 -93% |
| Read 512 (MB/s) | 320.3 | 1149 259% | 800 150% | 937 193% | 43.19 -87% |
| Write 512 (MB/s) | 1276 | 1285 1% | 1030 -19% | 1483 16% | 57 -96% |
| Read 4k (MB/s) | 58.9 | 43.82 -26% | 58.1 -1% | 53.8 -9% | 0.494 -99% |
| Write 4k (MB/s) | 171 | 110.3 -35% | 145.6 -15% | 167.3 -2% | 1.122 -99% |
| Read 4k QD32 (MB/s) | 625 | 320.5 -49% | 592 -5% | 622 0% | 1.088 -100% |
| Write 4k QD32 (MB/s) | 539 | 287.3 -47% | 508 -6% | 418.9 -22% | 1.234 -100% |
| 3DMark 06 Standard Score | 26084 puntos | |
| 3DMark 11 Performance | 9921 puntos | |
| 3DMark Ice Storm Standard Score | 83626 puntos | |
| 3DMark Cloud Gate Standard Score | 22393 puntos | |
| 3DMark Fire Strike Score | 7194 puntos | |
| 3DMark Fire Strike Extreme Score | 3766 puntos | |
| 3DMark Time Spy Score | 2659 puntos | |
ayuda | ||
| 3DMark | |
| 1280x720 Cloud Gate Standard Graphics | |
| Asus Strix GL502VM-FY039T | |
| Razer Blade (2016) FHD | |
| Schenker XMG P407 | |
| Schenker XMG P406 | |
| Gigabyte P34W v5 | |
| Dell Inspiron 15 7000 7567 | |
| MSI GL62M 7RD-077 | |
| 1920x1080 Fire Strike Graphics | |
| Asus Strix GL502VM-FY039T | |
| Razer Blade (2016) FHD | |
| Schenker XMG P407 | |
| Dell Inspiron 15 7000 7567 | |
| Gigabyte P34W v5 | |
| Schenker XMG P406 | |
| MSI GL62M 7RD-077 | |
| 3DMark 11 - 1280x720 Performance GPU | |
| Asus Strix GL502VM-FY039T | |
| Razer Blade (2016) FHD | |
| Schenker XMG P407 | |
| Dell Inspiron 15 7000 7567 | |
| Gigabyte P34W v5 | |
| Schenker XMG P406 | |
| MSI GL62M 7RD-077 | |
| bajo | medio | alto | ultra | |
|---|---|---|---|---|
| Tomb Raider (2013) | 360.1 | 258.1 | 199.2 | 98.9 |
| BioShock Infinite (2013) | 168.9 | 159.2 | 152.2 | 76.4 |
| Battlefield 4 (2013) | 178.6 | 174.9 | 145.7 | 71 |
| Ashes of the Singularity (2016) | 63.2 | 45.6 | 40.4 | |
| Deus Ex Mankind Divided (2016) | 99 | 74.7 | 39.8 | 20.3 |
| Battlefield 1 (2016) | 142.1 | 122.1 | 62.4 | 56.3 |
| Civilization 6 (2016) | 70.2 | 50.1 | 41.8 | 42.4 |
| Titanfall 2 (2016) | 143.7 | 136.5 | 68.5 | 58.6 |
| BioShock Infinite - 1920x1080 Ultra Preset, DX11 (DDOF) | |
| Asus Strix GL502VM-FY039T | |
| Razer Blade (2016) FHD | |
| Schenker XMG P407 | |
| Dell Inspiron 15 7000 7567 | |
| Gigabyte P34W v5 | |
| MSI GL62M 7RD-077 | |
| Tomb Raider - 1920x1080 Ultra Preset AA:FX AF:16x | |
| Asus Strix GL502VM-FY039T | |
| Razer Blade (2016) FHD | |
| Schenker XMG P407 | |
| Gigabyte P34W v5 | |
| MSI GL62M 7RD-077 | |
| Battlefield 4 - 1920x1080 Ultra Preset AA:4x MS | |
| Asus Strix GL502VM-FY039T | |
| Razer Blade (2016) FHD | |
| Schenker XMG P407 | |
| Schenker XMG P406 | |
| MSI GL62M 7RD-077 | |
| Battlefield 1 - 1920x1080 Ultra Preset AA:T | |
| Schenker XMG P407 | |
| Dell Inspiron 15 7000 7567 | |
| MSI GL62M 7RD-077 | |
| Ashes of the Singularity - 1920x1080 high | |
| Asus Strix GL502VM-FY039T | |
| Razer Blade (2016) FHD | |
| Schenker XMG P407 | |
| MSI GL62M 7RD-077 | |
| Titanfall 2 - 1920x1080 Very High (Insane Texture Quality) / Enabled AA:TS AF:16x | |
| Asus Strix GL502VM-FY039T | |
| Dell Inspiron 15 7000 7567 | |
| Schenker XMG P407 | |
| MSI GL62M 7RD-077 | |
| Civilization 6 - 1920x1080 Ultra Preset AA:4xMS | |
| Schenker XMG P407 | |
| MSI GL62M 7RD-077 | |
| Deus Ex Mankind Divided - 1920x1080 High Preset AF:4x | |
| Razer Blade (2016) FHD | |
| Schenker XMG P407 | |
| MSI GL62M 7RD-077 | |
Ruido
| Ocioso |
| 31 / 32 / 36 dB(A) |
| HDD |
| 32 dB(A) |
| Carga |
| 43 / 48 dB(A) |
 | ||
30 dB silencioso 40 dB(A) audible 50 dB(A) ruidosamente alto |
||
min: | ||
| Schenker XMG P407 i7-7700HQ, GeForce GTX 1050 Ti Mobile | Schenker XMG P406 6700HQ, GeForce GTX 970M | Razer Blade (2016) FHD 6700HQ, GeForce GTX 1060 Mobile | Gigabyte P34W v5 6700HQ, GeForce GTX 970M | MSI GL62M 7RD-077 i7-7700HQ, GeForce GTX 1050 Mobile | |
|---|---|---|---|---|---|
| Noise | -5% | -9% | -2% | 1% | |
| apagado / medio ambiente * (dB) | 29 | 31 -7% | 30.6 -6% | ||
| Idle Minimum * (dB) | 31 | 30 3% | 35 -13% | 31.6 -2% | 32.5 -5% |
| Idle Average * (dB) | 32 | 32 -0% | 36 -13% | 31.6 1% | 32.5 -2% |
| Idle Maximum * (dB) | 36 | 40 -11% | 37 -3% | 32.5 10% | 32.5 10% |
| Load Average * (dB) | 43 | 47 -9% | 43 -0% | 46.5 -8% | 36.4 15% |
| Load Maximum * (dB) | 48 | 51 -6% | 57 -19% | 52.5 -9% | 52.4 -9% |
* ... más pequeño es mejor
(-) La temperatura máxima en la parte superior es de 49 °C / 120 F, frente a la media de 40.4 °C / 105 F, que oscila entre 21.2 y 68.8 °C para la clase Gaming.
(-) El fondo se calienta hasta un máximo de 50.8 °C / 123 F, frente a la media de 43.2 °C / 110 F
(+) En reposo, la temperatura media de la parte superior es de 23.5 °C / 74# F, frente a la media del dispositivo de 33.9 °C / 93 F.
(±) El reposamanos y el touchpad pueden calentarse mucho al tacto con un máximo de 36.4 °C / 97.5 F.
(-) La temperatura media de la zona del reposamanos de dispositivos similares fue de 28.8 °C / 83.8 F (-7.6 °C / -13.7 F).
| Schenker XMG P407 i7-7700HQ, GeForce GTX 1050 Ti Mobile | Schenker XMG P406 6700HQ, GeForce GTX 970M | Razer Blade (2016) FHD 6700HQ, GeForce GTX 1060 Mobile | Gigabyte P34W v5 6700HQ, GeForce GTX 970M | MSI GL62M 7RD-077 i7-7700HQ, GeForce GTX 1050 Mobile | |
|---|---|---|---|---|---|
| Heat | -35% | -6% | -18% | 2% | |
| Maximum Upper Side * (°C) | 49 | 55 -12% | 54 -10% | 59.3 -21% | 44.9 8% |
| Maximum Bottom * (°C) | 50.8 | 58.7 -16% | 49.4 3% | 56.5 -11% | 38.2 25% |
| Idle Upper Side * (°C) | 26.3 | 36.9 -40% | 28 -6% | 27.8 -6% | 27.4 -4% |
| Idle Bottom * (°C) | 24.1 | 41.7 -73% | 26.8 -11% | 31.8 -32% | 29 -20% |
* ... más pequeño es mejor
Speakers
Schenker XMG P407 análisis de audio
(±) | la sonoridad del altavoz es media pero buena (78 dB)
Graves 100 - 315 Hz
(-) | casi sin bajos - de media 19.2% inferior a la mediana
(±) | la linealidad de los graves es media (11% delta a frecuencia anterior)
Medios 400 - 2000 Hz
(+) | medios equilibrados - a sólo 4.4% de la mediana
(±) | la linealidad de los medios es media (9.6% delta respecto a la frecuencia anterior)
Altos 2 - 16 kHz
(+) | máximos equilibrados - a sólo 3.7% de la mediana
(+) | los máximos son lineales (5.5% delta a la frecuencia anterior)
Total 100 - 16.000 Hz
(±) | la linealidad del sonido global es media (20.5% de diferencia con la mediana)
En comparación con la misma clase
» 73% de todos los dispositivos probados de esta clase eran mejores, 5% similares, 22% peores
» El mejor tuvo un delta de 6%, la media fue 18%, el peor fue ###max##%
En comparación con todos los dispositivos probados
» 54% de todos los dispositivos probados eran mejores, 8% similares, 38% peores
» El mejor tuvo un delta de 4%, la media fue 23%, el peor fue ###max##%
Razer Blade (2016) FHD análisis de audio
(±) | la sonoridad del altavoz es media pero buena (79 dB)
Graves 100 - 315 Hz
(±) | lubina reducida - en promedio 10.6% inferior a la mediana
(±) | la linealidad de los graves es media (12.4% delta a frecuencia anterior)
Medios 400 - 2000 Hz
(+) | medios equilibrados - a sólo 4.3% de la mediana
(+) | los medios son lineales (3.9% delta a la frecuencia anterior)
Altos 2 - 16 kHz
(+) | máximos equilibrados - a sólo 3.4% de la mediana
(+) | los máximos son lineales (5.7% delta a la frecuencia anterior)
Total 100 - 16.000 Hz
(±) | la linealidad del sonido global es media (17.3% de diferencia con la mediana)
En comparación con la misma clase
» 47% de todos los dispositivos probados de esta clase eran mejores, 12% similares, 41% peores
» El mejor tuvo un delta de 6%, la media fue 18%, el peor fue ###max##%
En comparación con todos los dispositivos probados
» 33% de todos los dispositivos probados eran mejores, 8% similares, 59% peores
» El mejor tuvo un delta de 4%, la media fue 23%, el peor fue ###max##%
| Off / Standby | |
| Ocioso | |
| Carga |
|
Clave:
min: | |
| Schenker XMG P407 i7-7700HQ, GeForce GTX 1050 Ti Mobile | Schenker XMG P406 6700HQ, GeForce GTX 970M | Razer Blade (2016) FHD 6700HQ, GeForce GTX 1060 Mobile | MSI GL62M 7RD-077 i7-7700HQ, GeForce GTX 1050 Mobile | |
|---|---|---|---|---|
| Power Consumption | -13% | -10% | 3% | |
| Idle Minimum * (Watt) | 10 | 12 -20% | 14 -40% | 10.6 -6% |
| Idle Average * (Watt) | 15 | 16 -7% | 18 -20% | 14.5 3% |
| Idle Maximum * (Watt) | 24 | 22 8% | 21 12% | 15 37% |
| Load Average * (Watt) | 82 | 90 -10% | 70 15% | 90 -10% |
| Load Maximum * (Watt) | 124 | 170 -37% | 146 -18% | 135 -9% |
* ... más pequeño es mejor
| Schenker XMG P407 i7-7700HQ, GeForce GTX 1050 Ti Mobile, 45 Wh | Schenker XMG P406 6700HQ, GeForce GTX 970M, 45 Wh | Razer Blade (2016) FHD 6700HQ, GeForce GTX 1060 Mobile, 70 Wh | Gigabyte P34W v5 6700HQ, GeForce GTX 970M, 61 Wh | MSI GL62M 7RD-077 i7-7700HQ, GeForce GTX 1050 Mobile, 41 Wh | |
|---|---|---|---|---|---|
| Duración de Batería | -25% | 40% | -20% | -18% | |
| Reader / Idle (h) | 7.4 | 4.6 -38% | 12.7 72% | 6.5 -12% | 6.5 -12% |
| H.264 (h) | 3.6 | 5.2 44% | 3.6 0% | ||
| WiFi v1.3 (h) | 4 | 3.3 -17% | 7.1 78% | 3.9 -2% | 3.8 -5% |
| Load (h) | 1.5 | 1.2 -20% | 1 -33% | 0.8 -47% | 0.7 -53% |
Pro
Contra
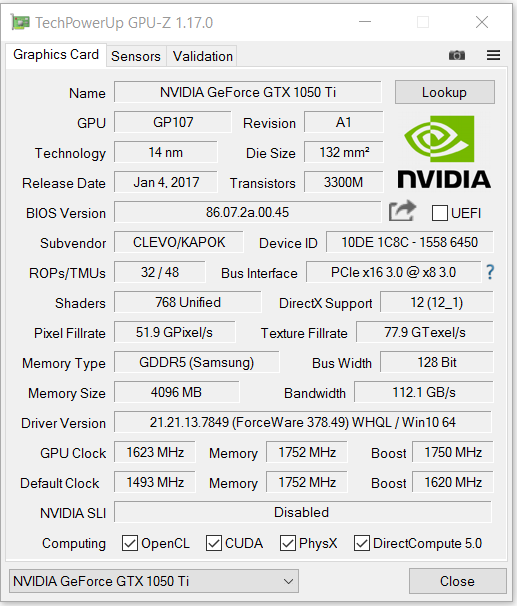
On the outside, the XMG P407 is not different from its predecessor. That is why we shall focus on the new features, which are found primarily on the inside. The new Kaby Lake processor provides a slight performance increase. The fresh CPU also has a good, though modest, impact on battery life. The built-in GeForce GTX 1050 Ti core is in the upper middle range of Nvidia's current line-up, but it offers more performance than many top-range models of the previous generation. In other words: The GeForce GTX 970M chip built into the XMG P406 loses in 3DMark benchmarks as well as in real-world gaming.
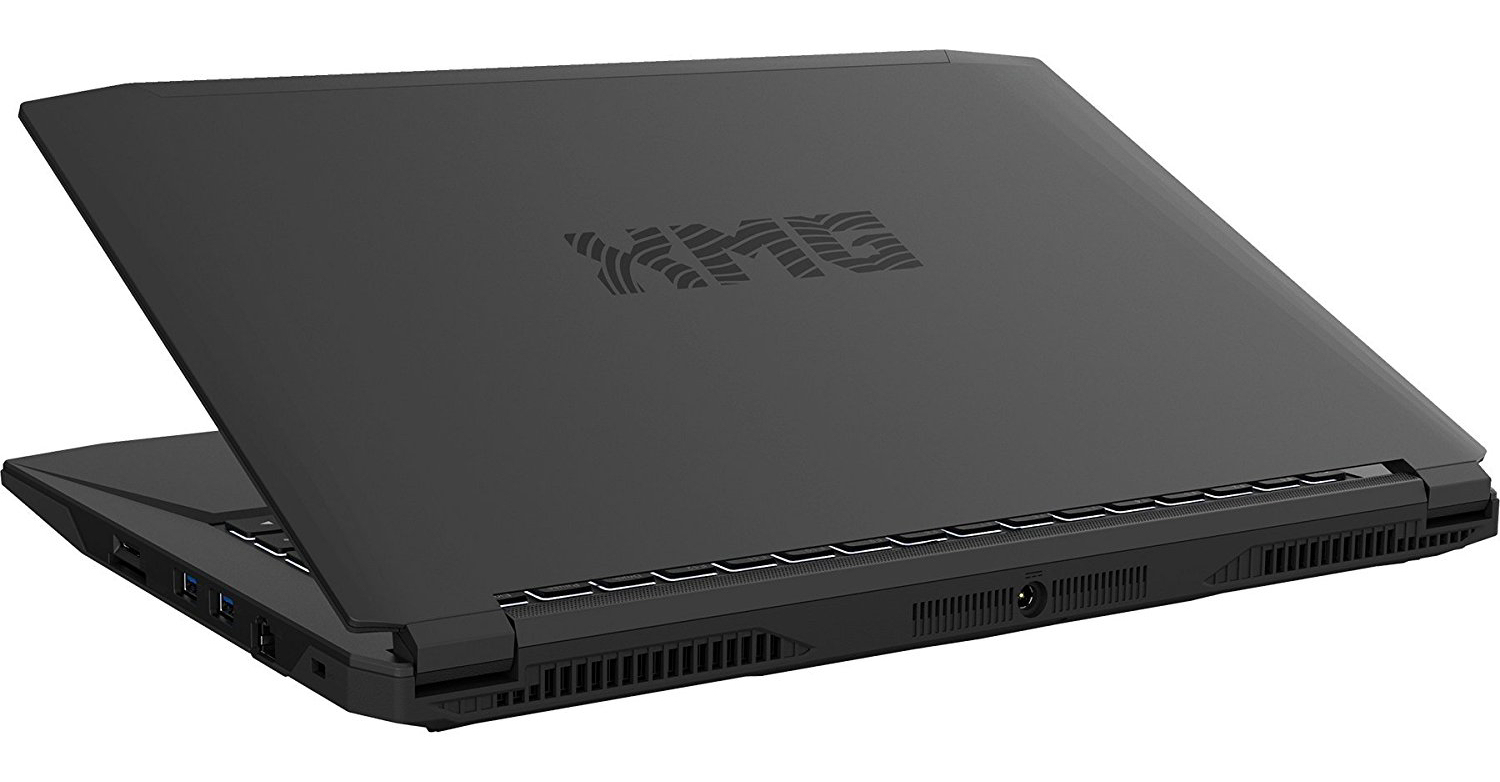
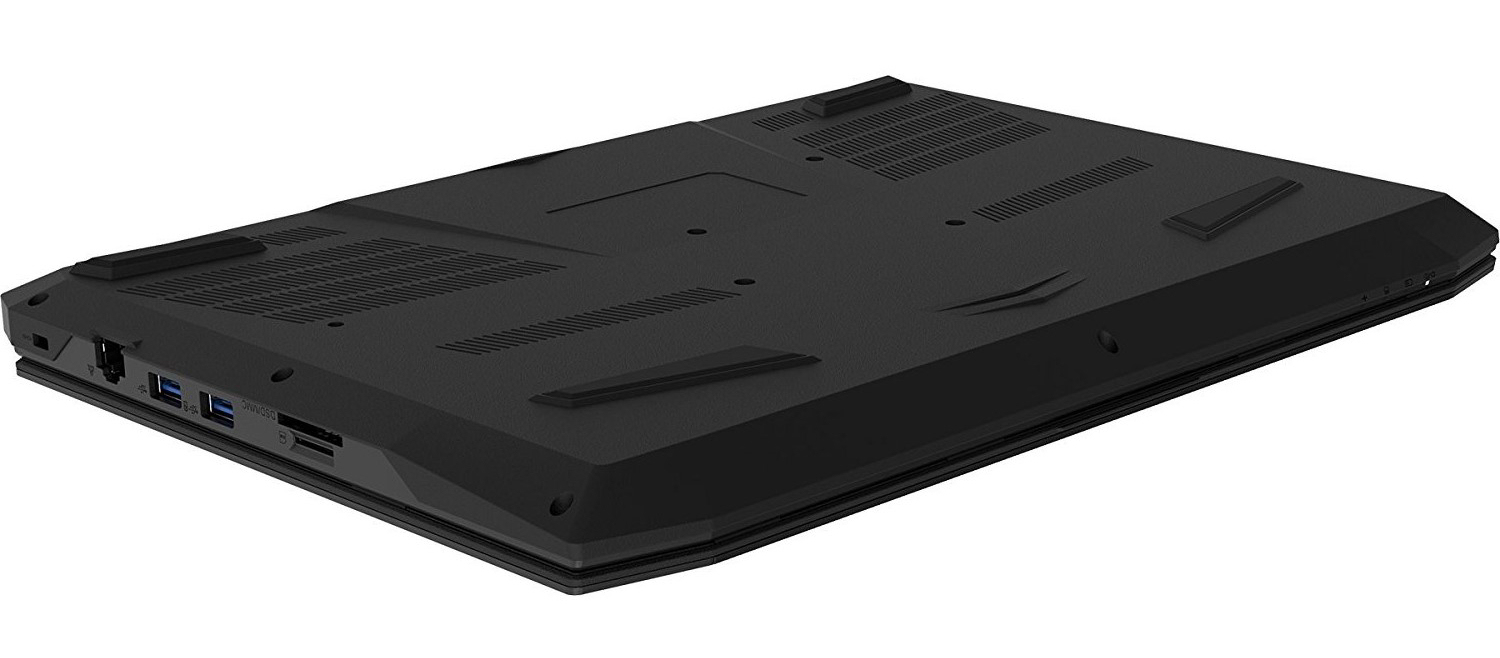
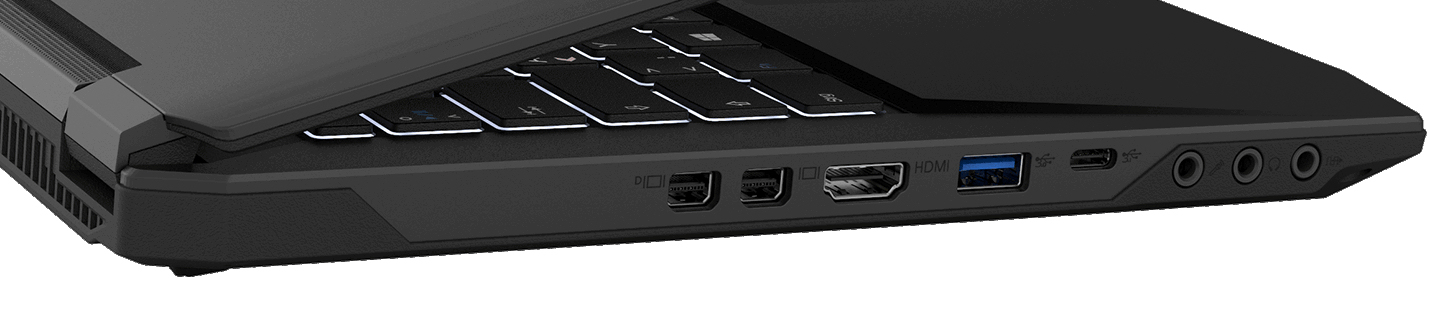
The heat development under load can be described as moderate: The XMG P407 does not become as warm as its predecessor. The differences between the P406 and the P407 in terms of system noise are small. However, we notice some improvement: The CPU fan in the P406 likes to speed up unexpectedly and is then clearly perceptible. This behavior is apparently not present in the P407. The ports bear further updates: One of the four USB 3.1 Type-A Gen-1 ports makes way for a USB 3.1 Type-C Gen-2 port. In addition, one of the two Mini DisplayPorts is now equipped with the 1.4 standard.
With the XMG P407, Schenker delivers a well-rounded 14-inch gaming notebook.
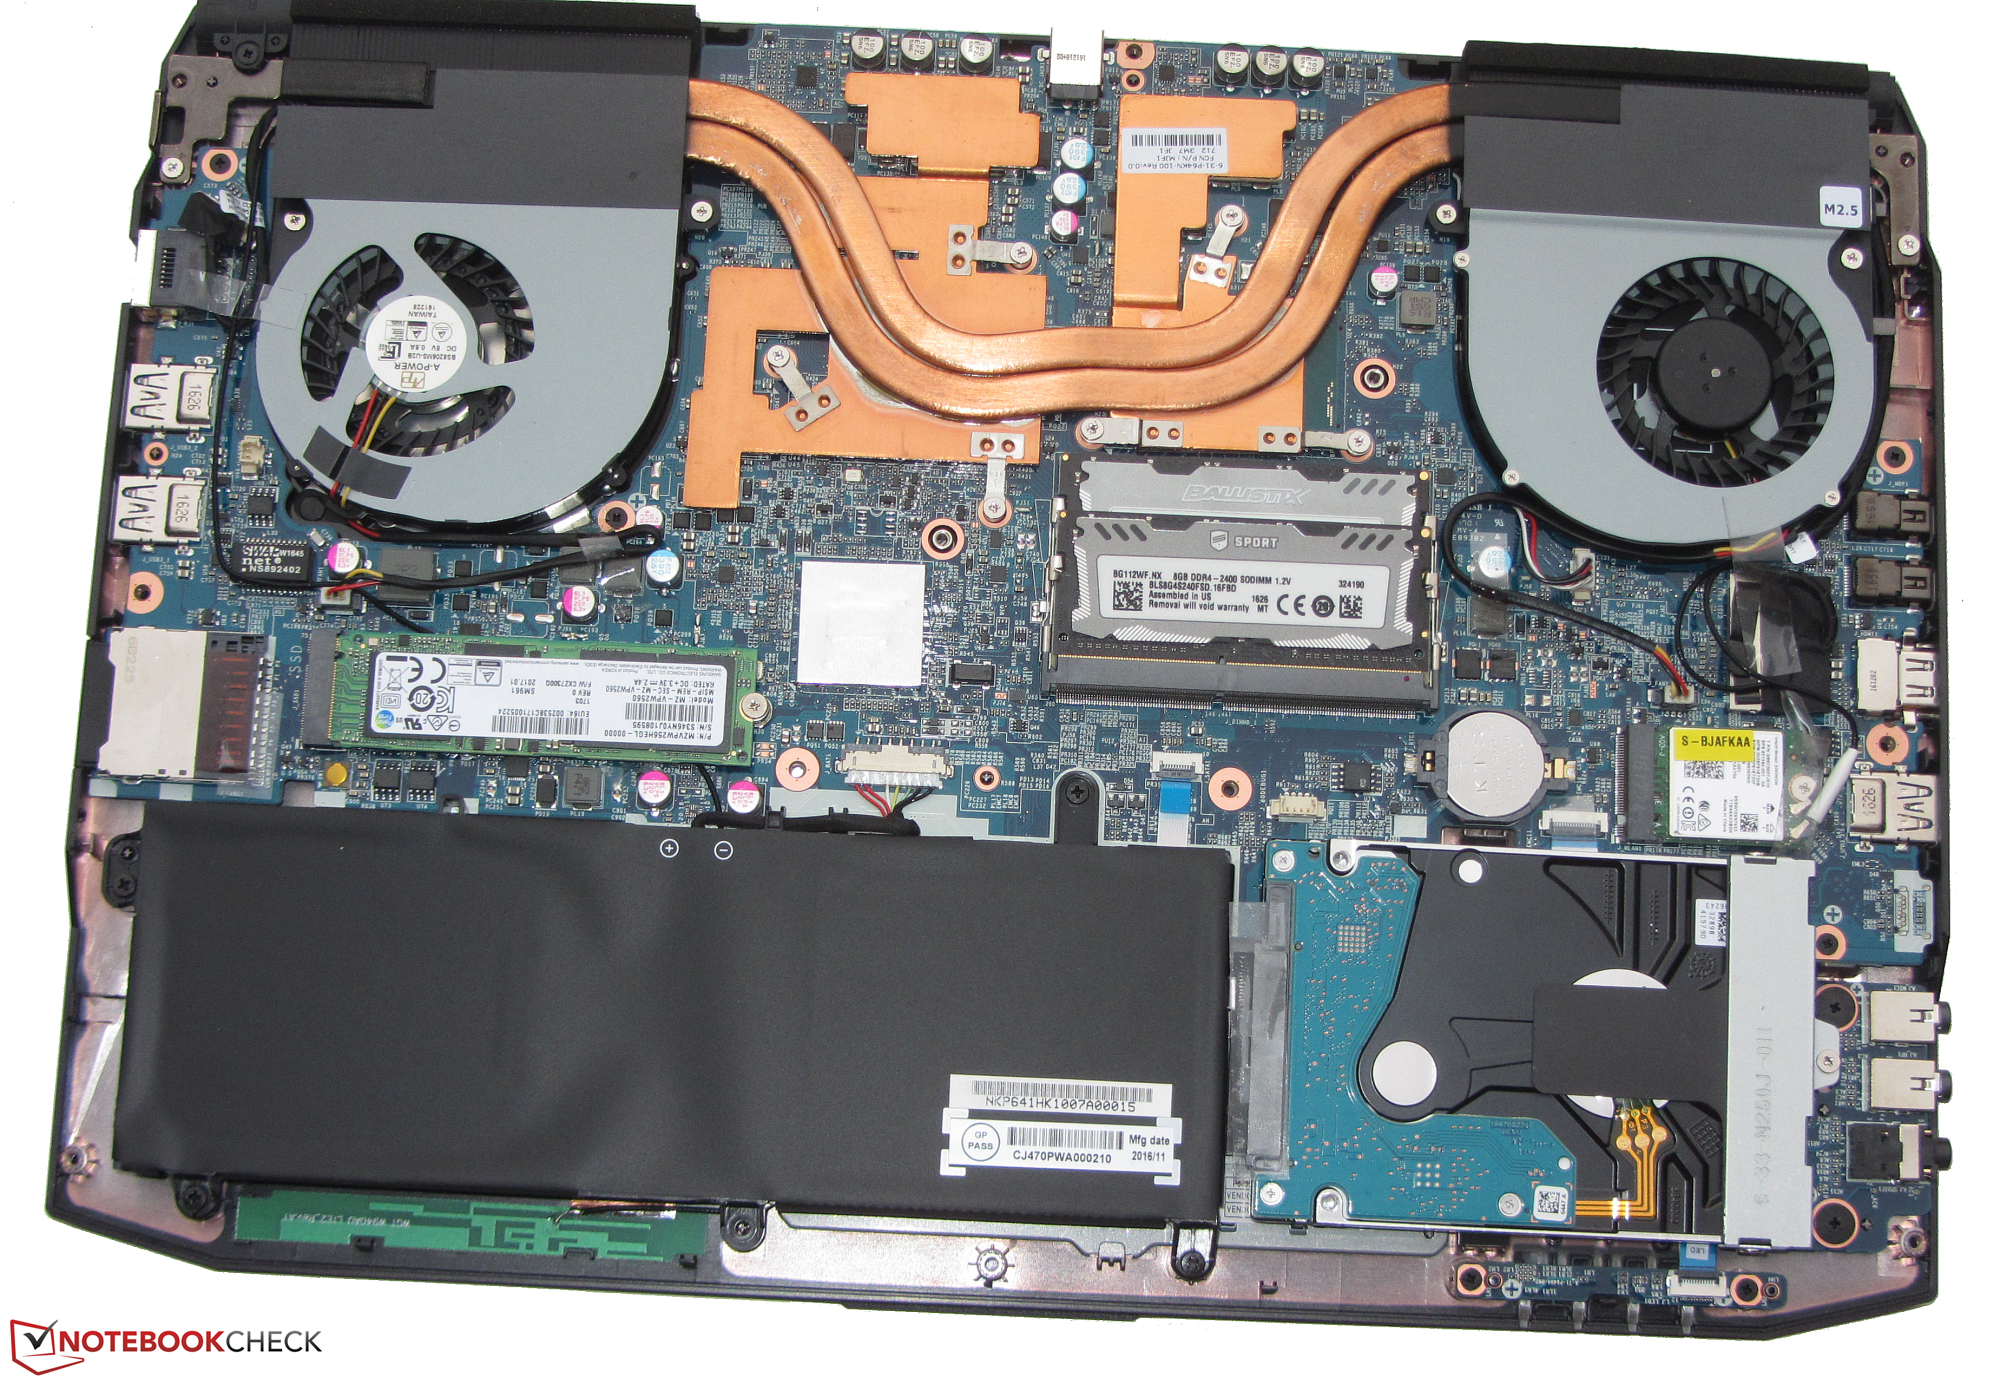
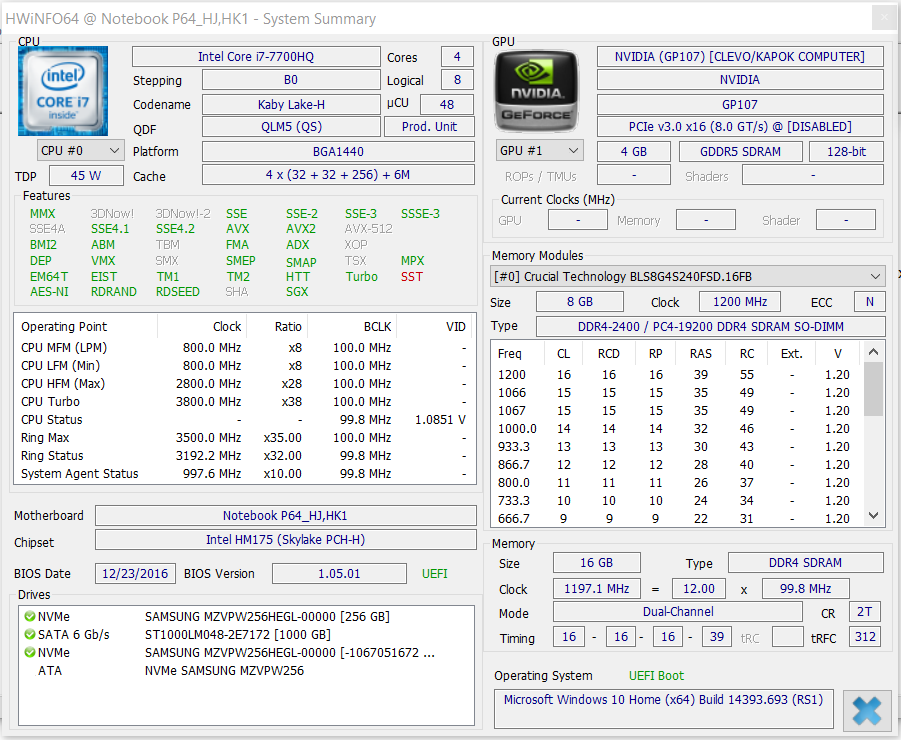
A lightning-quick NVMe SSD ensures a snappy system. The required storage space is provided by a 2.5-inch hard drive. Both drives can be exchanged, since the bottom plate of the base unit can be removed effortlessly. A good keyboard is also in the package. The matte IPS display has pleasantly wide viewing angles and good contrast. However, the display could offer more in terms of brightness. The switching times of the built-in display are only slightly better than those of the XMG P406.
Schenker XMG P407
- 03/06/2017 v6 (old)
Sascha Mölck