Breve análisis del Razer Blade (2016) FHD
| Networking | |
| iperf3 transmit AX12 | |
| Razer Blade (2016) | |
| Razer Blade (2016) FHD | |
| Asus Strix GL502VM-FY039T | |
| iperf3 receive AX12 | |
| Asus Strix GL502VM-FY039T | |
| Razer Blade (2016) | |
| Razer Blade (2016) FHD | |
| |||||||||||||||||||||||||
iluminación: 84 %
Brillo con batería: 272 cd/m²
Contraste: 1046:1 (Negro: 0.26 cd/m²)
ΔE ColorChecker Calman: 4.59 | ∀{0.5-29.43 Ø4.71}
ΔE Greyscale Calman: 4.28 | ∀{0.09-98 Ø4.96}
83% sRGB (Argyll 1.6.3 3D)
55% AdobeRGB 1998 (Argyll 1.6.3 3D)
60.9% AdobeRGB 1998 (Argyll 3D)
83.4% sRGB (Argyll 3D)
65.2% Display P3 (Argyll 3D)
Gamma: 2.23
CCT: 6848 K
| Razer Blade (2016) FHD LG Philips LP140WF3-SPD1 (LGD046D), 1920x1080 | Razer Blade (2016) Sharp LQ140Z1JW01 (SHP1401), 3200x1800 | MSI GS43VR 6RE-006US Name: LG Philips LP140WF3-SPD1, ID: LGD046D, 1920x1080 | Gigabyte P34W v5 2560x1440 | Schenker XMG P406 LG Philips 140WF1 (LGD040A), 1920x1080 | Asus Strix GL502VM-FY039T LG Philips LP156WF6-SPB6 (LGD046F), 1920x1080 | |
|---|---|---|---|---|---|---|
| Display | 10% | 3% | -14% | 0% | -0% | |
| Display P3 Coverage (%) | 65.2 | 66.9 3% | 65.5 0% | 51.4 -21% | 66.2 2% | 64.5 -1% |
| sRGB Coverage (%) | 83.4 | 96.8 16% | 86.4 4% | 76.6 -8% | 82.8 -1% | 83.4 0% |
| AdobeRGB 1998 Coverage (%) | 60.9 | 68.2 12% | 63.1 4% | 52.8 -13% | 60.5 -1% | 60.9 0% |
| Response Times | -15% | 20% | 7% | -17% | 10% | |
| Response Time Grey 50% / Grey 80% * (ms) | 47 ? | 41 ? 13% | 31.6 ? 33% | 41.2 ? 12% | 56 ? -19% | 40 ? 15% |
| Response Time Black / White * (ms) | 26 ? | 37 ? -42% | 24.4 ? 6% | 25.4 ? 2% | 30 ? -15% | 25 ? 4% |
| PWM Frequency (Hz) | 200 ? | |||||
| Screen | 29% | 9% | 3% | 1% | 1% | |
| Brightness middle (cd/m²) | 272 | 328 21% | 288.4 6% | 277.8 2% | 282 4% | 321 18% |
| Brightness (cd/m²) | 277 | 328 18% | 282 2% | 270 -3% | 266 -4% | 296 7% |
| Brightness Distribution (%) | 84 | 69 -18% | 83 -1% | 83 -1% | 81 -4% | 88 5% |
| Black Level * (cd/m²) | 0.26 | 0.22 15% | 0.35 -35% | 0.38 -46% | 0.22 15% | 0.33 -27% |
| Contrast (:1) | 1046 | 1491 43% | 824 -21% | 731 -30% | 1282 23% | 973 -7% |
| Colorchecker dE 2000 * | 4.59 | 1.91 58% | 2.61 43% | 2.71 41% | 4.98 -8% | 4.42 4% |
| Colorchecker dE 2000 max. * | 8.49 | 3.23 62% | 7.34 14% | 5.47 36% | 10.2 -20% | 9.78 -15% |
| Greyscale dE 2000 * | 4.28 | 1.69 61% | 1.18 72% | 2.11 51% | 4.08 5% | 3.34 22% |
| Gamma | 2.23 99% | 2.3 96% | 2.24 98% | 2.19 100% | 2.51 88% | 2.4 92% |
| CCT | 6848 95% | 6418 101% | 6506 100% | 6314 103% | 5877 111% | 6213 105% |
| Color Space (Percent of AdobeRGB 1998) (%) | 55 | 63 15% | 56.4 3% | 48.5 -12% | 54 -2% | 55 0% |
| Color Space (Percent of sRGB) (%) | 83 | 97 17% | 86.4 4% | 76.9 -7% | 83 0% | 83 0% |
| Media total (Programa/Opciones) | 8% /
20% | 11% /
9% | -1% /
0% | -5% /
-2% | 4% /
2% |
* ... más pequeño es mejor
Parpadeo de Pantalla / PWM (Pulse-Width Modulation)
| Parpadeo de Pantalla / PWM no detectado | 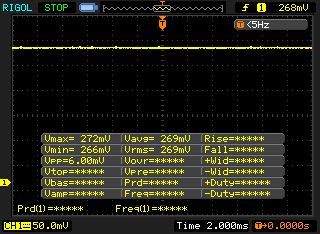 | ||
Comparación: 52 % de todos los dispositivos testados no usaron PWM para atenuar el display. Si se usó, medimos una media de 7741 (mínimo: 5 - máxmo: 343500) Hz. | |||
Tiempos de respuesta del display
| ↔ Tiempo de respuesta de Negro a Blanco | ||
|---|---|---|
| 26 ms ... subida ↗ y bajada ↘ combinada | ↗ 6 ms subida | 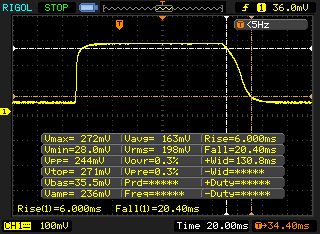 |
| ↘ 20 ms bajada | ||
| La pantalla mostró tiempos de respuesta relativamente lentos en nuestros tests pero podría ser demasiado lenta para los jugones. En comparación, todos los dispositivos de prueba van de ##min### (mínimo) a 240 (máximo) ms. » 63 % de todos los dispositivos son mejores. Eso quiere decir que el tiempo de respuesta es peor que la media (19.8 ms) de todos los dispositivos testados. | ||
| ↔ Tiempo de respuesta 50% Gris a 80% Gris | ||
| 47 ms ... subida ↗ y bajada ↘ combinada | ↗ 14 ms subida | 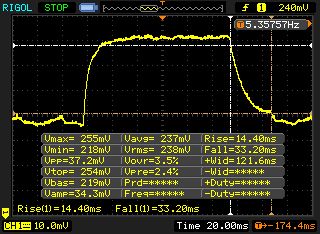 |
| ↘ 33 ms bajada | ||
| La pantalla mostró tiempos de respuesta lentos en nuestros tests y podría ser demasiado lenta para los jugones. En comparación, todos los dispositivos de prueba van de ##min### (mínimo) a 636 (máximo) ms. » 81 % de todos los dispositivos son mejores. Eso quiere decir que el tiempo de respuesta es peor que la media (30.9 ms) de todos los dispositivos testados. | ||
| Cinebench R10 | |
| Rendering Multiple CPUs 32Bit | |
| Razer Blade (2016) FHD | |
| Asus Strix GL502VM-FY039T | |
| Schenker XMG P406 | |
| Gigabyte P34W v5 | |
| MSI GS43VR 6RE-006US | |
| Rendering Single 32Bit | |
| Razer Blade (2016) FHD | |
| Asus Strix GL502VM-FY039T | |
| Gigabyte P34W v5 | |
| Schenker XMG P406 | |
| MSI GS43VR 6RE-006US | |
| Geekbench 3 | |
| 32 Bit Single-Core Score | |
| Razer Blade (2016) FHD | |
| Asus Strix GL502VM-FY039T | |
| 32 Bit Multi-Core Score | |
| Razer Blade (2016) FHD | |
| Asus Strix GL502VM-FY039T | |
| Geekbench 4.0 | |
| 64 Bit Single-Core Score | |
| Razer Blade (2016) FHD | |
| Asus Strix GL502VM-FY039T | |
| 64 Bit Multi-Core Score | |
| Razer Blade (2016) FHD | |
| Asus Strix GL502VM-FY039T | |
| JetStream 1.1 - 1.1 Total | |
| Asus Strix GL502VM-FY039T | |
| Razer Blade (2016) FHD | |
| MSI GS43VR 6RE-006US | |
| PCMark 7 Score | 5874 puntos | |
| PCMark 8 Home Score Accelerated v2 | 4010 puntos | |
| PCMark 8 Creative Score Accelerated v2 | 4942 puntos | |
| PCMark 8 Work Score Accelerated v2 | 4920 puntos | |
ayuda | ||
| PCMark 8 | |
| Home Score Accelerated v2 | |
| Asus Strix GL502VM-FY039T | |
| MSI GS43VR 6RE-006US | |
| Razer Blade (2016) FHD | |
| Gigabyte P34W v5 | |
| Razer Blade (2016) | |
| Schenker XMG P406 | |
| Work Score Accelerated v2 | |
| Asus Strix GL502VM-FY039T | |
| Schenker XMG P406 | |
| Razer Blade (2016) FHD | |
| MSI GS43VR 6RE-006US | |
| Gigabyte P34W v5 | |
| Razer Blade (2016) | |

| Razer Blade (2016) FHD | Razer Blade (2016) Samsung PM951 NVMe MZVLV512 | MSI GS43VR 6RE-006US SanDisk SD8SN8U1T001122 | Gigabyte P34W v5 Samsung SSD 950 Pro 512GB m.2 NVMe | Schenker XMG P406 Samsung SM951 MZHPV256HDGL m.2 PCI-e | Asus Strix GL502VM-FY039T Micron SSD 1100 (MTFDDAV256TBN) | |
|---|---|---|---|---|---|---|
| CrystalDiskMark 3.0 | -25% | -73% | 8% | -14% | -58% | |
| Read Seq (MB/s) | 1977 | 1296 -34% | 335.3 -83% | 2269 15% | 1634 -17% | 462.5 -77% |
| Write Seq (MB/s) | 1668 | 603 -64% | 299 -82% | 1524 -9% | 1290 -23% | 462.7 -72% |
| Read 512 (MB/s) | 800 | 655 -18% | 223 -72% | 937 17% | 1149 44% | 335 -58% |
| Write 512 (MB/s) | 1030 | 604 -41% | 246.7 -76% | 1483 44% | 1285 25% | 407.1 -60% |
| Read 4k (MB/s) | 58.1 | 42.22 -27% | 17.68 -70% | 53.8 -7% | 43.82 -25% | 25.61 -56% |
| Write 4k (MB/s) | 145.6 | 139.6 -4% | 35.31 -76% | 167.3 15% | 110.3 -24% | 86.3 -41% |
| Read 4k QD32 (MB/s) | 592 | 573 -3% | 247.4 -58% | 622 5% | 320.5 -46% | 246.7 -58% |
| Write 4k QD32 (MB/s) | 508 | 480 -6% | 156.3 -69% | 418.9 -18% | 287.3 -43% | 301.5 -41% |
| 3DMark 06 Standard Score | 25367 puntos | |
| 3DMark 11 Performance | 11616 puntos | |
| 3DMark Ice Storm Standard Score | 78946 puntos | |
| 3DMark Cloud Gate Standard Score | 21402 puntos | |
| 3DMark Fire Strike Score | 9117 puntos | |
| 3DMark Fire Strike Extreme Score | 4873 puntos | |
| 3DMark Time Spy Score | 3443 puntos | |
ayuda | ||
| 3DMark | |
| 2560x1440 Time Spy Graphics | |
| Asus Strix GL502VM-FY039T | |
| Razer Blade (2016) FHD | |
| 1920x1080 Fire Strike Graphics | |
| MSI GS43VR 6RE-006US | |
| Asus Strix GL502VM-FY039T | |
| Razer Blade (2016) | |
| Razer Blade (2016) FHD | |
| Gigabyte P34W v5 | |
| Schenker XMG P406 | |
| 3DMark 11 - 1280x720 Performance GPU | |
| Asus Strix GL502VM-FY039T | |
| MSI GS43VR 6RE-006US | |
| Razer Blade (2016) | |
| Razer Blade (2016) FHD | |
| Gigabyte P34W v5 | |
| Schenker XMG P406 | |
| BioShock Infinite - 1920x1080 Ultra Preset, DX11 (DDOF) | |
| Asus Strix GL502VM-FY039T | |
| MSI GS43VR 6RE-006US | |
| Razer Blade (2016) FHD | |
| Gigabyte P34W v5 | |
| Battlefield 4 - 1920x1080 Ultra Preset AA:4x MS | |
| Asus Strix GL502VM-FY039T | |
| Razer Blade (2016) FHD | |
| Schenker XMG P406 | |
| bajo | medio | alto | ultra | |
|---|---|---|---|---|
| Tomb Raider (2013) | 347.4 | 312.1 | 261.9 | 131.7 |
| BioShock Infinite (2013) | 184.5 | 164.6 | 148.3 | 94 |
| Battlefield 4 (2013) | 168.1 | 167.8 | 154.1 | 94 |
| Anno 2205 (2015) | 110.4 | 103.3 | 79.2 | 28.6 |
| XCOM 2 (2016) | 85.5 | 62.8 | 52.8 | 27.8 |
| The Division (2016) | 184.6 | 120.7 | 61.2 | 48.2 |
| Ashes of the Singularity (2016) | 67.9 | 54.8 | 49.4 | |
| Deus Ex Mankind Divided (2016) | 114.4 | 93.8 | 52.4 | 28.1 |
Ruido
| Ocioso |
| 35 / 36 / 37 dB(A) |
| Carga |
| 43 / 57 dB(A) |
 | ||
30 dB silencioso 40 dB(A) audible 50 dB(A) ruidosamente alto |
||
min: | ||
| Razer Blade (2016) FHD 6700HQ, GeForce GTX 1060 Mobile | Razer Blade (2016) 6700HQ, GeForce GTX 1060 Mobile | MSI GS43VR 6RE-006US 6700HQ, GeForce GTX 1060 Mobile | Gigabyte P34W v5 6700HQ, GeForce GTX 970M | Schenker XMG P406 6700HQ, GeForce GTX 970M | Asus Strix GL502VM-FY039T 6700HQ, GeForce GTX 1060 Mobile | |
|---|---|---|---|---|---|---|
| Noise | 8% | 5% | 7% | 4% | 5% | |
| apagado / medio ambiente * (dB) | 31 | 30 3% | 29.1 6% | 31 -0% | ||
| Idle Minimum * (dB) | 35 | 31 11% | 32 9% | 31.6 10% | 30 14% | 32 9% |
| Idle Average * (dB) | 36 | 33 8% | 32 11% | 31.6 12% | 32 11% | 33 8% |
| Idle Maximum * (dB) | 37 | 35 5% | 33.5 9% | 32.5 12% | 40 -8% | 34 8% |
| Load Average * (dB) | 43 | 39 9% | 50 -16% | 46.5 -8% | 47 -9% | 44 -2% |
| Load Maximum * (dB) | 57 | 51 11% | 51.5 10% | 52.5 8% | 51 11% | 53 7% |
* ... más pequeño es mejor
(-) La temperatura máxima en la parte superior es de 54 °C / 129 F, frente a la media de 40.4 °C / 105 F, que oscila entre 21.2 y 68.8 °C para la clase Gaming.
(-) El fondo se calienta hasta un máximo de 49.4 °C / 121 F, frente a la media de 43.2 °C / 110 F
(+) En reposo, la temperatura media de la parte superior es de 26.3 °C / 79# F, frente a la media del dispositivo de 33.9 °C / 93 F.
(±) El reposamanos y el touchpad pueden calentarse mucho al tacto con un máximo de 39.9 °C / 103.8 F.
(-) La temperatura media de la zona del reposamanos de dispositivos similares fue de 28.8 °C / 83.8 F (-11.1 °C / -20 F).
| Razer Blade (2016) FHD 6700HQ, GeForce GTX 1060 Mobile | Razer Blade (2016) 6700HQ, GeForce GTX 1060 Mobile | MSI GS43VR 6RE-006US 6700HQ, GeForce GTX 1060 Mobile | Gigabyte P34W v5 6700HQ, GeForce GTX 970M | Schenker XMG P406 6700HQ, GeForce GTX 970M | Asus Strix GL502VM-FY039T 6700HQ, GeForce GTX 1060 Mobile | |
|---|---|---|---|---|---|---|
| Heat | -2% | -22% | -11% | -27% | -24% | |
| Maximum Upper Side * (°C) | 54 | 52.7 2% | 55.6 -3% | 59.3 -10% | 55 -2% | 65.3 -21% |
| Maximum Bottom * (°C) | 49.4 | 48.4 2% | 62.4 -26% | 56.5 -14% | 58.7 -19% | 64.4 -30% |
| Idle Upper Side * (°C) | 28 | 29.3 -5% | 33.2 -19% | 27.8 1% | 36.9 -32% | 35.4 -26% |
| Idle Bottom * (°C) | 26.8 | 28.4 -6% | 37.2 -39% | 31.8 -19% | 41.7 -56% | 31.6 -18% |
* ... más pequeño es mejor
Razer Blade (2016) FHD análisis de audio
(±) | la sonoridad del altavoz es media pero buena (79 dB)
Graves 100 - 315 Hz
(±) | lubina reducida - en promedio 10.6% inferior a la mediana
(±) | la linealidad de los graves es media (12.4% delta a frecuencia anterior)
Medios 400 - 2000 Hz
(+) | medios equilibrados - a sólo 4.3% de la mediana
(+) | los medios son lineales (3.9% delta a la frecuencia anterior)
Altos 2 - 16 kHz
(+) | máximos equilibrados - a sólo 3.4% de la mediana
(+) | los máximos son lineales (5.7% delta a la frecuencia anterior)
Total 100 - 16.000 Hz
(±) | la linealidad del sonido global es media (17.3% de diferencia con la mediana)
En comparación con la misma clase
» 47% de todos los dispositivos probados de esta clase eran mejores, 12% similares, 41% peores
» El mejor tuvo un delta de 6%, la media fue 18%, el peor fue ###max##%
En comparación con todos los dispositivos probados
» 33% de todos los dispositivos probados eran mejores, 8% similares, 59% peores
» El mejor tuvo un delta de 4%, la media fue 23%, el peor fue ###max##%
MSI GS43VR 6RE-006US análisis de audio
(±) | la sonoridad del altavoz es media pero buena (76.7 dB)
Graves 100 - 315 Hz
(-) | casi sin bajos - de media 17.5% inferior a la mediana
(±) | la linealidad de los graves es media (12% delta a frecuencia anterior)
Medios 400 - 2000 Hz
(+) | medios equilibrados - a sólo 3.9% de la mediana
(±) | la linealidad de los medios es media (9.5% delta respecto a la frecuencia anterior)
Altos 2 - 16 kHz
(±) | máximos más altos - de media 6.4% más altos que la mediana
(±) | la linealidad de los máximos es media (8.5% delta a frecuencia anterior)
Total 100 - 16.000 Hz
(±) | la linealidad del sonido global es media (28.9% de diferencia con la mediana)
En comparación con la misma clase
» 95% de todos los dispositivos probados de esta clase eran mejores, 2% similares, 4% peores
» El mejor tuvo un delta de 6%, la media fue 18%, el peor fue ###max##%
En comparación con todos los dispositivos probados
» 87% de todos los dispositivos probados eran mejores, 2% similares, 11% peores
» El mejor tuvo un delta de 4%, la media fue 23%, el peor fue ###max##%
| Off / Standby | |
| Ocioso | |
| Carga |
|
Clave:
min: | |
| Razer Blade (2016) FHD 6700HQ, GeForce GTX 1060 Mobile | Razer Blade (2016) 6700HQ, GeForce GTX 1060 Mobile | MSI GS43VR 6RE-006US 6700HQ, GeForce GTX 1060 Mobile | Schenker XMG P406 6700HQ, GeForce GTX 970M | Asus Strix GL502VM-FY039T 6700HQ, GeForce GTX 1060 Mobile | |
|---|---|---|---|---|---|
| Power Consumption | 13% | -9% | -5% | -7% | |
| Idle Minimum * (Watt) | 14 | 9 36% | 12.1 14% | 12 14% | 16 -14% |
| Idle Average * (Watt) | 18 | 14 22% | 19 -6% | 16 11% | 19 -6% |
| Idle Maximum * (Watt) | 21 | 22 -5% | 19.5 7% | 22 -5% | 23 -10% |
| Load Average * (Watt) | 70 | 72 -3% | 106.7 -52% | 90 -29% | 68 3% |
| Load Maximum * (Watt) | 146 | 124 15% | 159 -9% | 170 -16% | 157 -8% |
* ... más pequeño es mejor
| Razer Blade (2016) FHD 6700HQ, GeForce GTX 1060 Mobile, 70 Wh | Razer Blade (2016) 6700HQ, GeForce GTX 1060 Mobile, 70 Wh | MSI GS43VR 6RE-006US 6700HQ, GeForce GTX 1060 Mobile, 61 Wh | Gigabyte P34W v5 6700HQ, GeForce GTX 970M, 61 Wh | Schenker XMG P406 6700HQ, GeForce GTX 970M, 45 Wh | Asus Strix GL502VM-FY039T 6700HQ, GeForce GTX 1060 Mobile, 64 Wh | |
|---|---|---|---|---|---|---|
| Duración de Batería | -42% | -11% | -38% | -33% | -20% | |
| Reader / Idle (h) | 12.7 | 9.6 -24% | 6.5 -49% | 4.6 -64% | 5.3 -58% | |
| H.264 (h) | 5.2 | 3.9 -25% | ||||
| WiFi v1.3 (h) | 7.1 | 4.1 -42% | 4.4 -38% | 3.9 -45% | 3.3 -54% | 3.7 -48% |
| Load (h) | 1 | 1.3 30% | 0.8 -20% | 1.2 20% | 1.5 50% |
Pro
Contra
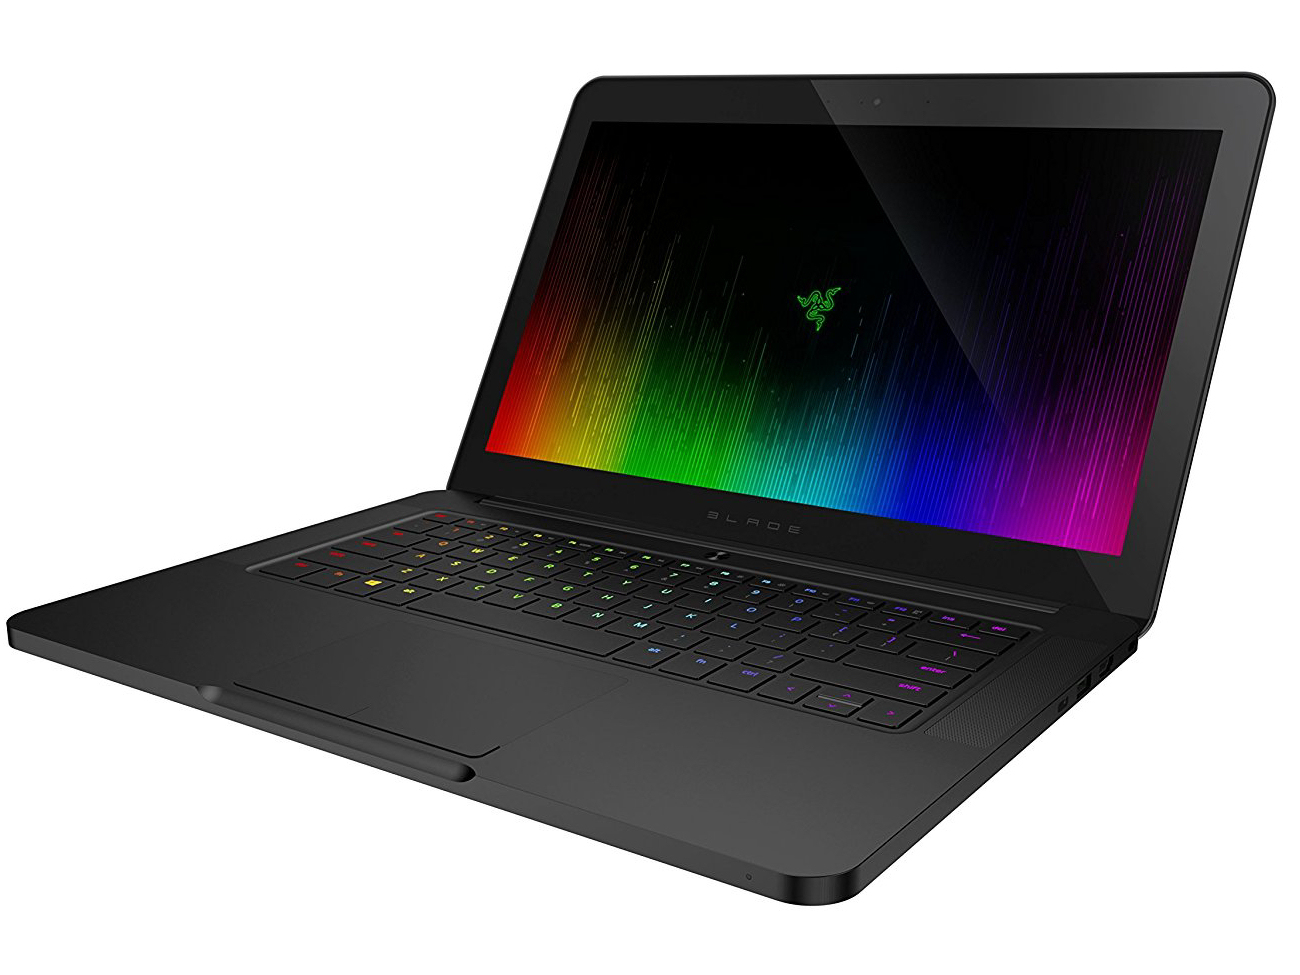
Razer mete mucho rendimiento en un chasis delgado y muy atractivo. El sistema puede con todos los juegos modernos, pero los frame rates son algo inferiores a los de los rivales más grandes. El rendimiento de la ventilación está limitado debido al pequeño volumen del chasis, por lo que las frecuencias GPU sufren a resultas. Nunca resulta muy silencioso – pero tampoco lo esperábamos. Se puede tolerar el ruido en inactivo. Un velocísimo SSD asegura un sistema rápido. No da problemas quitar el panel inferior, y el portátil tiene puertos que lo preparan de cara al futuro. Sólo falta el puerto Gigabit-Ethernet, al que se puede acceder por adaptador USB si hace falta.
El Full HD Blade es el mejor paquete general.
La mayor diferencia respecto al modelo anteriormente analizado del Blade es el display. La pantalla FHD IPS de gran ángulo de visión logra unos decentes resultados en brillo y contraste. Positivo: comparado con el display QHD+ del hermano no podemos medir parpadeo PWM alguno en el display Full HD. Este último también es más eficiente que la pantalla táctil QHD+ y logra un mejor aguante de batería por ello.
Ésta es una versión acortada del análisis original. Puedes leer el análisis completo en inglés aquí.
Razer Blade (2016) FHD
- 12/25/2016 v6 (old)
Sascha Mölck
Price comparison
