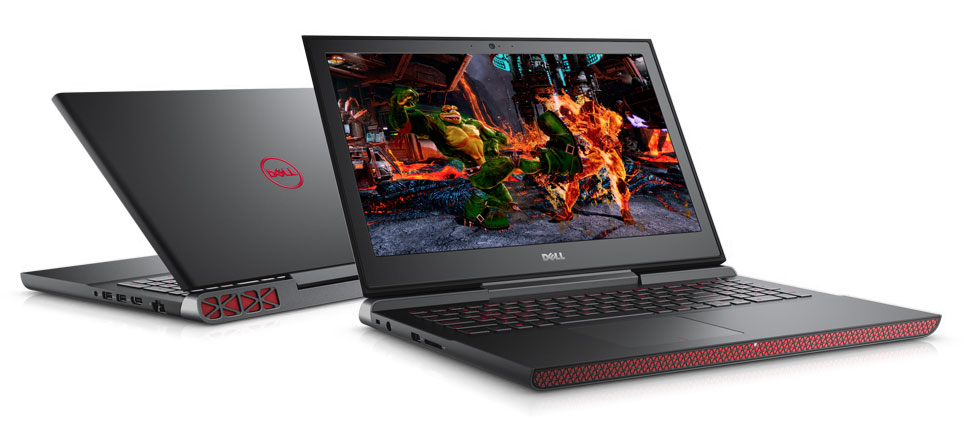
Breve análisis del portátil Gaming Dell Inspiron 15 7000 7567

| SD Card Reader | |
| average JPG Copy Test (av. of 3 runs) | |
| Asus Strix GL502VM-DS74 | |
| Dell Inspiron 15 7559 | |
| MSI GE72 7RE-046 | |
| Acer Aspire VX5-591G-D0DD | |
| Dell Inspiron 15 7000 7567 | |
| maximum AS SSD Seq Read Test (1GB) | |
| Asus Strix GL502VM-DS74 | |
| Dell Inspiron 15 7559 | |
| Acer Aspire VX5-591G-D0DD | |
| MSI GE72 7RE-046 | |
| Dell Inspiron 15 7000 7567 | |
| Networking | |
| iperf3 transmit AX12 | |
| Acer Aspire VX5-591G-D0DD | |
| Asus Strix GL502VM-DS74 | |
| Dell Inspiron 15 7000 7567 (jseb) | |
| MSI GE72 7RE-046 | |
| iperf3 receive AX12 | |
| Acer Aspire VX5-591G-D0DD | |
| MSI GE72 7RE-046 | |
| Asus Strix GL502VM-DS74 | |
| Dell Inspiron 15 7000 7567 (jseb) | |
| |||||||||||||||||||||||||
iluminación: 75 %
Brillo con batería: 286 cd/m²
Contraste: 447:1 (Negro: 0.55 cd/m²)
ΔE ColorChecker Calman: 10.97 | ∀{0.5-29.43 Ø4.71}
ΔE Greyscale Calman: 14.25 | ∀{0.09-98 Ø4.96}
55% sRGB (Argyll 1.6.3 3D)
35% AdobeRGB 1998 (Argyll 1.6.3 3D)
37.62% AdobeRGB 1998 (Argyll 3D)
54.9% sRGB (Argyll 3D)
36.42% Display P3 (Argyll 3D)
Gamma: 1.83
CCT: 11200 K
| Dell Inspiron 15 7000 7567 AU Optronics AUO38ED B156HTN 28H80, , 1920x1080, 15.6" | MSI GE72 7RE-046 N173HHE-G32 (CMN1747), , 1920x1080, 17.3" | Dell Inspiron 15 7559 LG Philips LGD04D9 / 156UD2 / Dell P/N: 53FC4, , 3840x2160, 15.6" | Asus Strix GL502VM-DS74 1920x1080, 15.6" | |
|---|---|---|---|---|
| Display | 119% | 70% | 66% | |
| Display P3 Coverage (%) | 36.42 | 90.7 149% | 63.4 74% | 64.8 78% |
| sRGB Coverage (%) | 54.9 | 99.9 82% | 90 64% | 84.9 55% |
| AdobeRGB 1998 Coverage (%) | 37.62 | 85.2 126% | 64.6 72% | 62 65% |
| Response Times | 50% | 20% | -4% | |
| Response Time Grey 50% / Grey 80% * (ms) | 36 ? | 27 ? 25% | 32 ? 11% | 42 ? -17% |
| Response Time Black / White * (ms) | 36 ? | 9 ? 75% | 26 ? 28% | 32.8 ? 9% |
| PWM Frequency (Hz) | ||||
| Screen | 57% | 26% | 52% | |
| Brightness middle (cd/m²) | 246 | 253 3% | 276 12% | 307.8 25% |
| Brightness (cd/m²) | 235 | 230 -2% | 273 16% | 301 28% |
| Brightness Distribution (%) | 75 | 86 15% | 85 13% | 88 17% |
| Black Level * (cd/m²) | 0.55 | 0.24 56% | 0.78 -42% | 0.33 40% |
| Contrast (:1) | 447 | 1054 136% | 354 -21% | 933 109% |
| Colorchecker dE 2000 * | 10.97 | 5.01 54% | 4.05 63% | 4.5 59% |
| Greyscale dE 2000 * | 14.25 | 7.26 49% | 4.68 67% | 2.9 80% |
| Gamma | 1.83 120% | 2.09 105% | 2.55 86% | 2.22 99% |
| CCT | 11200 58% | 6329 103% | 6871 95% | 1136 572% |
| Color Space (Percent of AdobeRGB 1998) (%) | 35 | 76 117% | 58 66% | 55.4 58% |
| Color Space (Percent of sRGB) (%) | 55 | 100 82% | 90 64% | 84.8 54% |
| Colorchecker dE 2000 max. * | 10.4 | 10 | ||
| Media total (Programa/Opciones) | 75% /
69% | 39% /
35% | 38% /
47% |
* ... más pequeño es mejor
Tiempos de respuesta del display
| ↔ Tiempo de respuesta de Negro a Blanco | ||
|---|---|---|
| 36 ms ... subida ↗ y bajada ↘ combinada | ↗ 19 ms subida | 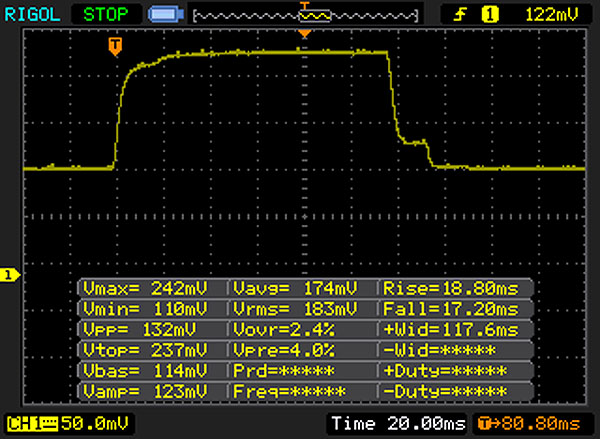 |
| ↘ 17 ms bajada | ||
| La pantalla mostró tiempos de respuesta lentos en nuestros tests y podría ser demasiado lenta para los jugones. En comparación, todos los dispositivos de prueba van de ##min### (mínimo) a 240 (máximo) ms. » 94 % de todos los dispositivos son mejores. Eso quiere decir que el tiempo de respuesta es peor que la media (19.8 ms) de todos los dispositivos testados. | ||
| ↔ Tiempo de respuesta 50% Gris a 80% Gris | ||
| 36 ms ... subida ↗ y bajada ↘ combinada | ↗ 17 ms subida |  |
| ↘ 19 ms bajada | ||
| La pantalla mostró tiempos de respuesta lentos en nuestros tests y podría ser demasiado lenta para los jugones. En comparación, todos los dispositivos de prueba van de ##min### (mínimo) a 636 (máximo) ms. » 51 % de todos los dispositivos son mejores. Eso quiere decir que el tiempo de respuesta es peor que la media (31 ms) de todos los dispositivos testados. | ||
Parpadeo de Pantalla / PWM (Pulse-Width Modulation)
| Parpadeo de Pantalla / PWM no detectado | ||
Comparación: 52 % de todos los dispositivos testados no usaron PWM para atenuar el display. Si se usó, medimos una media de 7757 (mínimo: 5 - máxmo: 343500) Hz. | ||
| PCMark 8 Home Score Accelerated v2 | 3850 puntos | |
| PCMark 8 Work Score Accelerated v2 | 5068 puntos | |
ayuda | ||
| Dell Inspiron 15 7000 7567 Intel SSDSCKKF256H6 | MSI GE72 7RE-046 Toshiba HG6 THNSNJ256G8NY | Dell Inspiron 15 7559 SK hynix SC300 M.2 | Asus Strix GL502VM-DS74 Samsung SSD 960 Evo 250GB m.2 NVMe | Acer Aspire VX5-591G-D0DD SK Hynix Canvas SC300 512GB M.2 (HFS512G39MND) | |
|---|---|---|---|---|---|
| CrystalDiskMark 3.0 | 19% | -11% | 171% | 3% | |
| Read Seq (MB/s) | 485.8 | 540 11% | 489.9 1% | 1747 260% | 494.2 2% |
| Write Seq (MB/s) | 422.8 | 495.7 17% | 205.1 -51% | 1477 249% | 449.6 6% |
| Read 512 (MB/s) | 338.9 | 455.1 34% | 354.3 5% | 863 155% | 348.1 3% |
| Write 512 (MB/s) | 304 | 481.4 58% | 211.5 -30% | 1115 267% | 418.2 38% |
| Read 4k (MB/s) | 27.11 | 22.7 -16% | 27.84 3% | 56.8 110% | 16.97 -37% |
| Write 4k (MB/s) | 85.4 | 112.9 32% | 68 -20% | 152.4 78% | 38.36 -55% |
| Read 4k QD32 (MB/s) | 279.6 | 372.5 33% | 348.2 25% | 652 133% | 394.9 41% |
| Write 4k QD32 (MB/s) | 255.1 | 212.9 -17% | 198.4 -22% | 542 112% | 317.4 24% |

| 3DMark 11 Performance | 8992 puntos | |
| 3DMark Cloud Gate Standard Score | 21998 puntos | |
| 3DMark Fire Strike Score | 6709 puntos | |
ayuda | ||
| Rise of the Tomb Raider | |
| 1920x1080 High Preset AA:FX AF:4x | |
| Asus Strix GL502VT-DS74 | |
| MSI GE72 7RE-046 | |
| Acer Aspire VX5-591G-D0DD | |
| Dell Inspiron 15 7000 7567 | |
| MSI GL62M 7RD-077 | |
| Asus Strix GL753VD-GC045T | |
| 1920x1080 Very High Preset AA:FX AF:16x | |
| Asus Strix GL502VM-DS74 | |
| Asus Strix GL502VT-DS74 | |
| MSI GE72 7RE-046 | |
| Acer Aspire VX5-591G-D0DD | |
| Dell Inspiron 15 7000 7567 | |
| MSI GL62M 7RD-077 | |
| Asus Strix GL753VD-GC045T | |
| BioShock Infinite | |
| 1366x768 High Preset | |
| MSI GL62M 7RD-077 | |
| Dell Inspiron 15 7000 7567 | |
| Asus Strix GL502VT-DS74 | |
| Dell Inspiron 15 7559 | |
| Lenovo IdeaPad Z50-75 | |
| 1920x1080 Ultra Preset, DX11 (DDOF) | |
| Asus Strix GL502VM-DS74 | |
| Dell Inspiron 15 7000 7567 | |
| Asus Strix GL502VT-DS74 | |
| MSI GL62M 7RD-077 | |
| Dell Inspiron 15 7559 | |
| Lenovo IdeaPad Z50-75 | |
| Titanfall 2 | |
| 1920x1080 High / Enabled AA:TS AF:8x | |
| Dell Inspiron 15 7000 7567 | |
| Acer Aspire VX5-591G-D0DD | |
| MSI GE72 7RE-046 | |
| Asus Strix GL753VD-GC045T | |
| MSI GL62M 7RD-077 | |
| Dell XPS 15 2017 9560 (7300HQ, Full-HD) | |
| 1920x1080 Very High (Insane Texture Quality) / Enabled AA:TS AF:16x | |
| Dell Inspiron 15 7000 7567 | |
| Acer Aspire VX5-591G-D0DD | |
| Asus Strix GL753VD-GC045T | |
| MSI GE72 7RE-046 | |
| Dell XPS 15 2017 9560 (7300HQ, Full-HD) | |
| MSI GL62M 7RD-077 | |
| bajo | medio | alto | ultra | |
|---|---|---|---|---|
| BioShock Infinite (2013) | 182.1 | 154.1 | 147 | 72.8 |
| GTA V (2015) | 135 | 118.8 | 60.3 | 36.1 |
| Metal Gear Solid V (2015) | 60 | 60 | 60 | 60 |
| Rise of the Tomb Raider (2016) | 117.5 | 86.6 | 46.6 | 38.3 |
| Doom (2016) | 117 | 105.3 | 69.1 | 67.5 |
| Mafia 3 (2016) | 61.3 | 44.3 | 28.6 | |
| Battlefield 1 (2016) | 114.7 | 99.7 | 56.9 | 51.2 |
| Farming Simulator 17 (2016) | 169.8 | 148.5 | 124.6 | 116 |
| Titanfall 2 (2016) | 143.4 | 131.9 | 75.8 | 66.7 |
| Call of Duty Infinite Warfare (2016) | 113.8 | 102 | 67.8 | 59 |
| Dishonored 2 (2016) | 87.9 | 72.2 | 46.3 | 39.9 |
| Watch Dogs 2 (2016) | 82.5 | 74.3 | 44.5 | 31.4 |
| Resident Evil 7 (2017) | 245.5 | 126.8 | 68.5 | 25.6 |
Ruido
| Ocioso |
| 30.9 / 30.9 / 31 dB(A) |
| HDD |
| 31.2 dB(A) |
| Carga |
| 46.5 / 46.8 dB(A) |
 | ||
30 dB silencioso 40 dB(A) audible 50 dB(A) ruidosamente alto |
||
min: | ||
(±) La temperatura máxima en la parte superior es de 43.4 °C / 110 F, frente a la media de 40.4 °C / 105 F, que oscila entre 21.2 y 68.8 °C para la clase Gaming.
(+) El fondo se calienta hasta un máximo de 37.7 °C / 100 F, frente a la media de 43.2 °C / 110 F
(+) En reposo, la temperatura media de la parte superior es de 23.1 °C / 74# F, frente a la media del dispositivo de 33.9 °C / 93 F.
(+) El reposamanos y el panel táctil están a una temperatura inferior a la de la piel, con un máximo de 26.6 °C / 79.9 F y, por tanto, son fríos al tacto.
(+) La temperatura media de la zona del reposamanos de dispositivos similares fue de 28.8 °C / 83.8 F (+2.2 °C / 3.9 F).
Dell Inspiron 15 7000 7567 análisis de audio
(±) | la sonoridad del altavoz es media pero buena (74 dB)
Graves 100 - 315 Hz
(±) | lubina reducida - en promedio 12.6% inferior a la mediana
(±) | la linealidad de los graves es media (13.2% delta a frecuencia anterior)
Medios 400 - 2000 Hz
(+) | medios equilibrados - a sólo 1.8% de la mediana
(+) | los medios son lineales (4.3% delta a la frecuencia anterior)
Altos 2 - 16 kHz
(+) | máximos equilibrados - a sólo 4% de la mediana
(+) | los máximos son lineales (3.9% delta a la frecuencia anterior)
Total 100 - 16.000 Hz
(+) | el sonido global es lineal (12% de diferencia con la mediana)
En comparación con la misma clase
» 12% de todos los dispositivos probados de esta clase eran mejores, 4% similares, 84% peores
» El mejor tuvo un delta de 6%, la media fue 18%, el peor fue ###max##%
En comparación con todos los dispositivos probados
» 9% de todos los dispositivos probados eran mejores, 2% similares, 88% peores
» El mejor tuvo un delta de 4%, la media fue 23%, el peor fue ###max##%
Apple MacBook 12 (Early 2016) 1.1 GHz análisis de audio
(+) | los altavoces pueden reproducir a un volumen relativamente alto (#83.6 dB)
Graves 100 - 315 Hz
(±) | lubina reducida - en promedio 11.3% inferior a la mediana
(±) | la linealidad de los graves es media (14.2% delta a frecuencia anterior)
Medios 400 - 2000 Hz
(+) | medios equilibrados - a sólo 2.4% de la mediana
(+) | los medios son lineales (5.5% delta a la frecuencia anterior)
Altos 2 - 16 kHz
(+) | máximos equilibrados - a sólo 2% de la mediana
(+) | los máximos son lineales (4.5% delta a la frecuencia anterior)
Total 100 - 16.000 Hz
(+) | el sonido global es lineal (10.2% de diferencia con la mediana)
En comparación con la misma clase
» 7% de todos los dispositivos probados de esta clase eran mejores, 2% similares, 90% peores
» El mejor tuvo un delta de 5%, la media fue 18%, el peor fue ###max##%
En comparación con todos los dispositivos probados
» 5% de todos los dispositivos probados eran mejores, 1% similares, 94% peores
» El mejor tuvo un delta de 4%, la media fue 23%, el peor fue ###max##%
| Off / Standby | |
| Ocioso | |
| Carga |
|
Clave:
min: | |
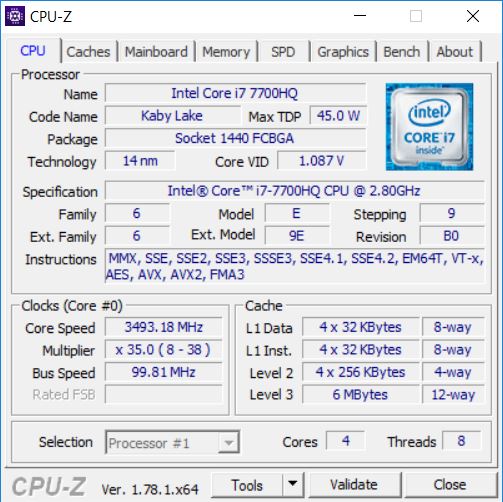
| Dell Inspiron 15 7000 7567 i7-7700HQ, GeForce GTX 1050 Ti Mobile, Intel SSDSCKKF256H6, TN, 1920x1080, 15.6" | MSI GE72 7RE-046 i7-7700HQ, GeForce GTX 1050 Ti Mobile, Toshiba HG6 THNSNJ256G8NY, TN LED, 1920x1080, 17.3" | Dell Inspiron 15 7559 6700HQ, GeForce GTX 960M, SK hynix SC300 M.2, IPS, 3840x2160, 15.6" | Asus Strix GL502VM-DS74 i7-7700HQ, GeForce GTX 1060 Mobile, Samsung SSD 960 Evo 250GB m.2 NVMe, IPS, 1920x1080, 15.6" | |
|---|---|---|---|---|
| Power Consumption | -124% | -65% | -347% | |
| Idle Minimum * (Watt) | 4.4 | 14 -218% | 9.4 -114% | 38.3 -770% |
| Idle Average * (Watt) | 6.8 | 20 -194% | 14.4 -112% | 40.5 -496% |
| Idle Maximum * (Watt) | 8.3 | 25 -201% | 15 -81% | 42.2 -408% |
| Load Average * (Watt) | 81 | 82 -1% | 102 -26% | 110.4 -36% |
| Load Maximum * (Watt) | 127 | 135 -6% | 120 6% | 155.7 -23% |
* ... más pequeño es mejor
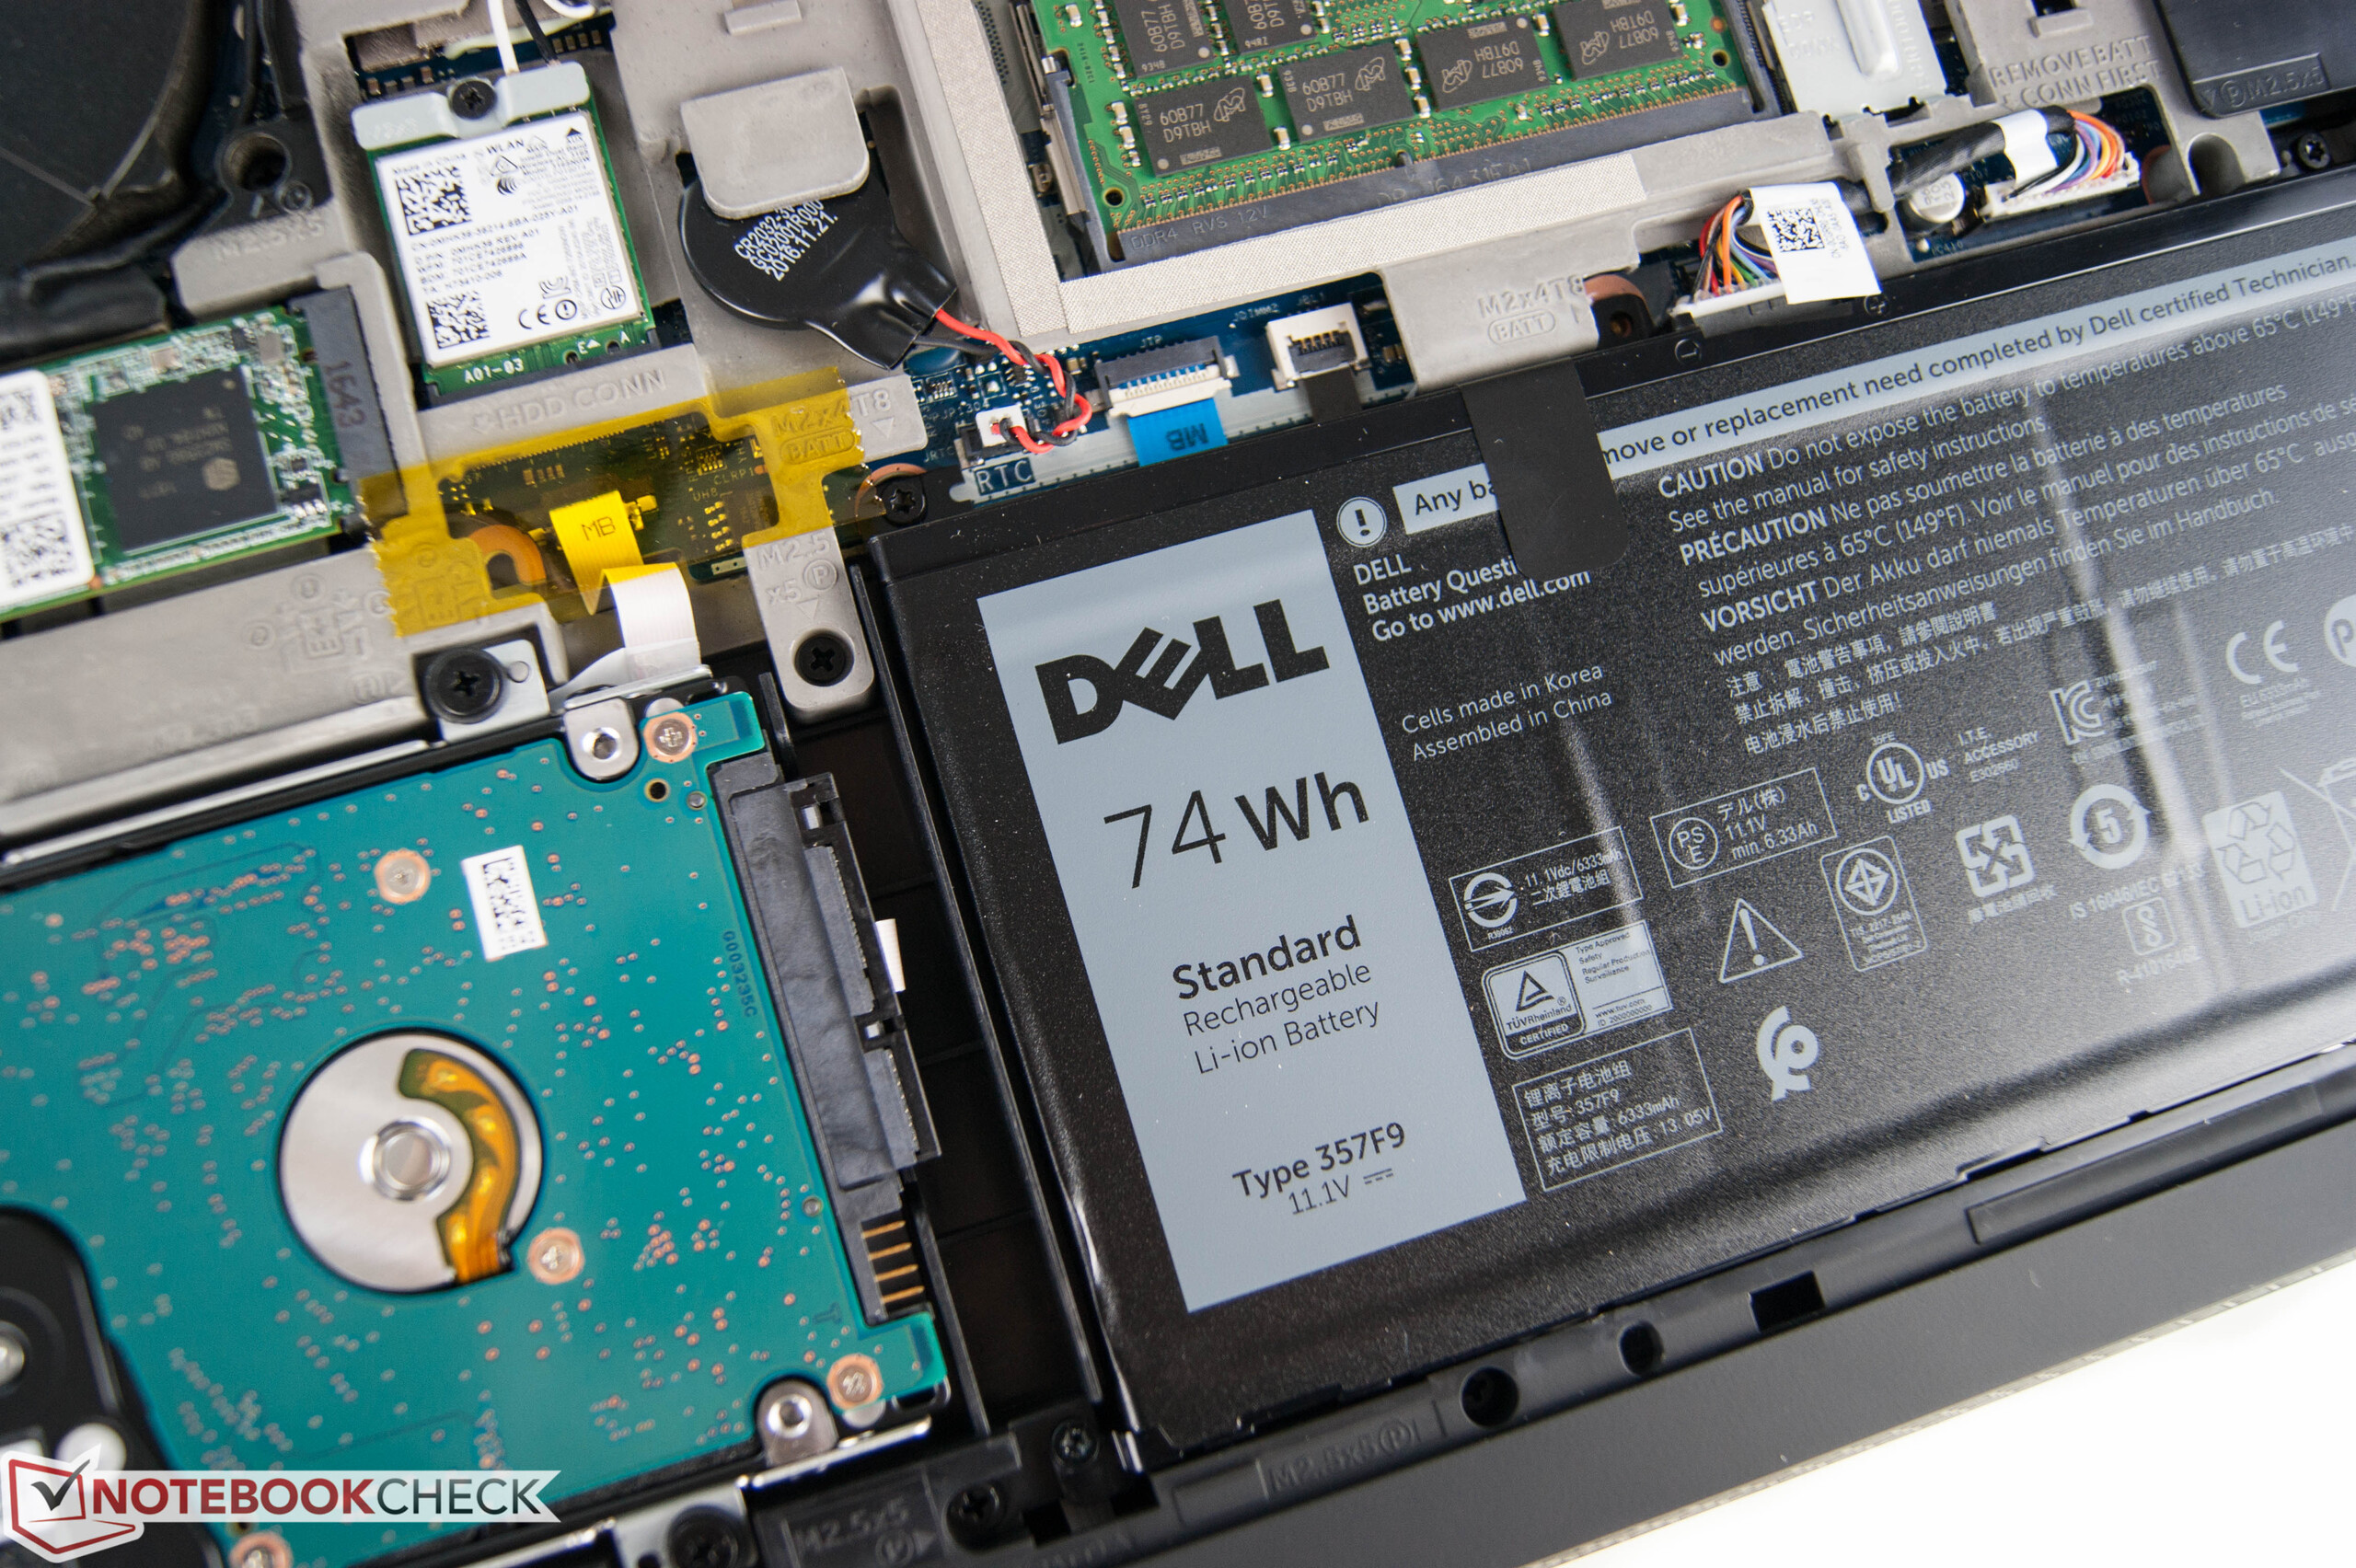
| Dell Inspiron 15 7000 7567 i7-7700HQ, GeForce GTX 1050 Ti Mobile, 74 Wh | MSI GE72 7RE-046 i7-7700HQ, GeForce GTX 1050 Ti Mobile, 51.4 Wh | Dell Inspiron 15 7559 6700HQ, GeForce GTX 960M, 74 Wh | Asus Strix GL502VM-DS74 i7-7700HQ, GeForce GTX 1060 Mobile, 64 Wh | Acer Aspire VX5-591G-D0DD i7-7700HQ, GeForce GTX 1050 Ti Mobile, 52 Wh | |
|---|---|---|---|---|---|
| Duración de Batería | -64% | -36% | -69% | -41% | |
| Reader / Idle (h) | 19.6 | 11.8 -40% | 1.7 -91% | ||
| H.264 (h) | 7.6 | 3.3 -57% | |||
| WiFi v1.3 (h) | 10.4 | 3.1 -70% | 3.9 -62% | 1.5 -86% | 6.1 -41% |
| Load (h) | 1.4 | 1.3 -7% | 1 -29% |
Pro
Contra
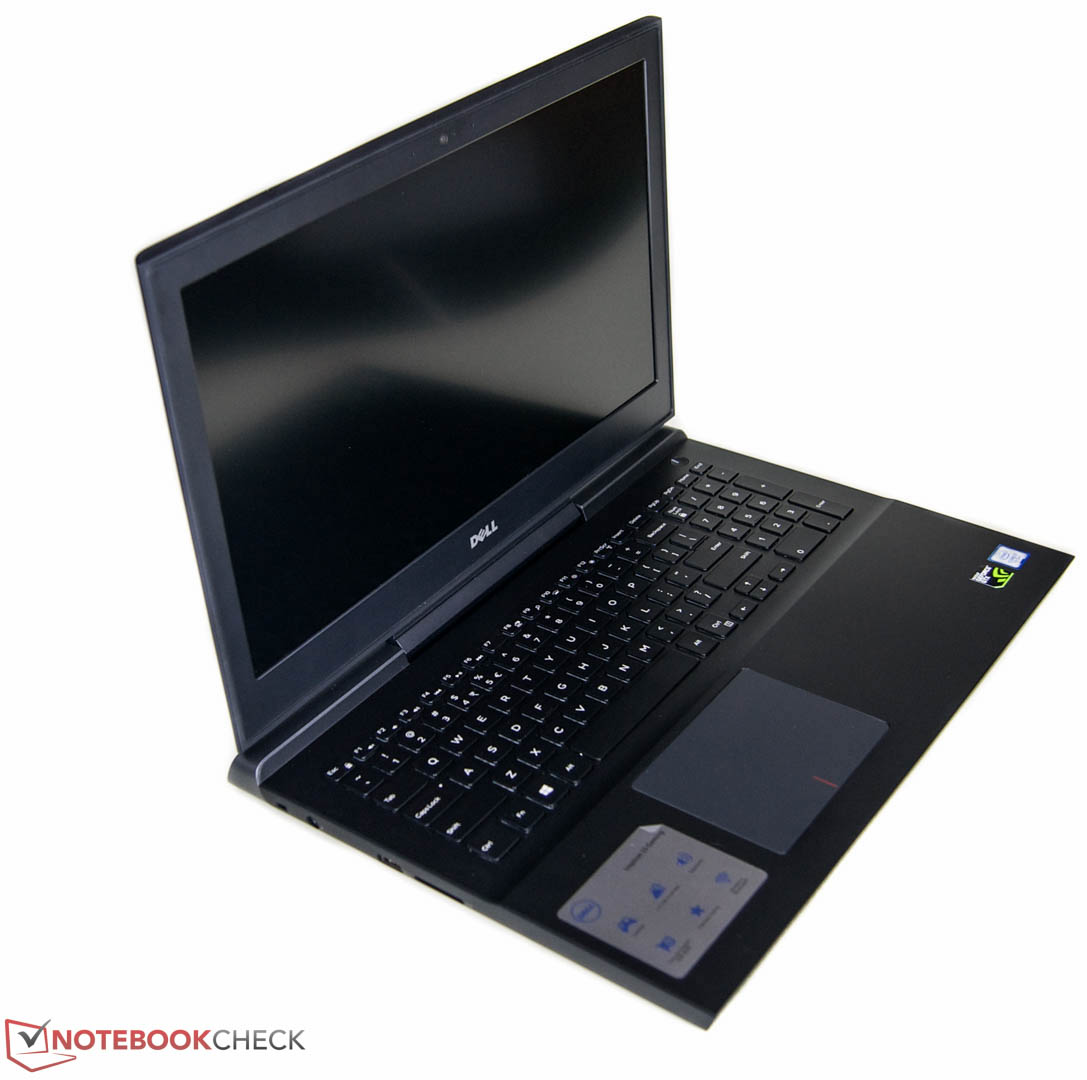
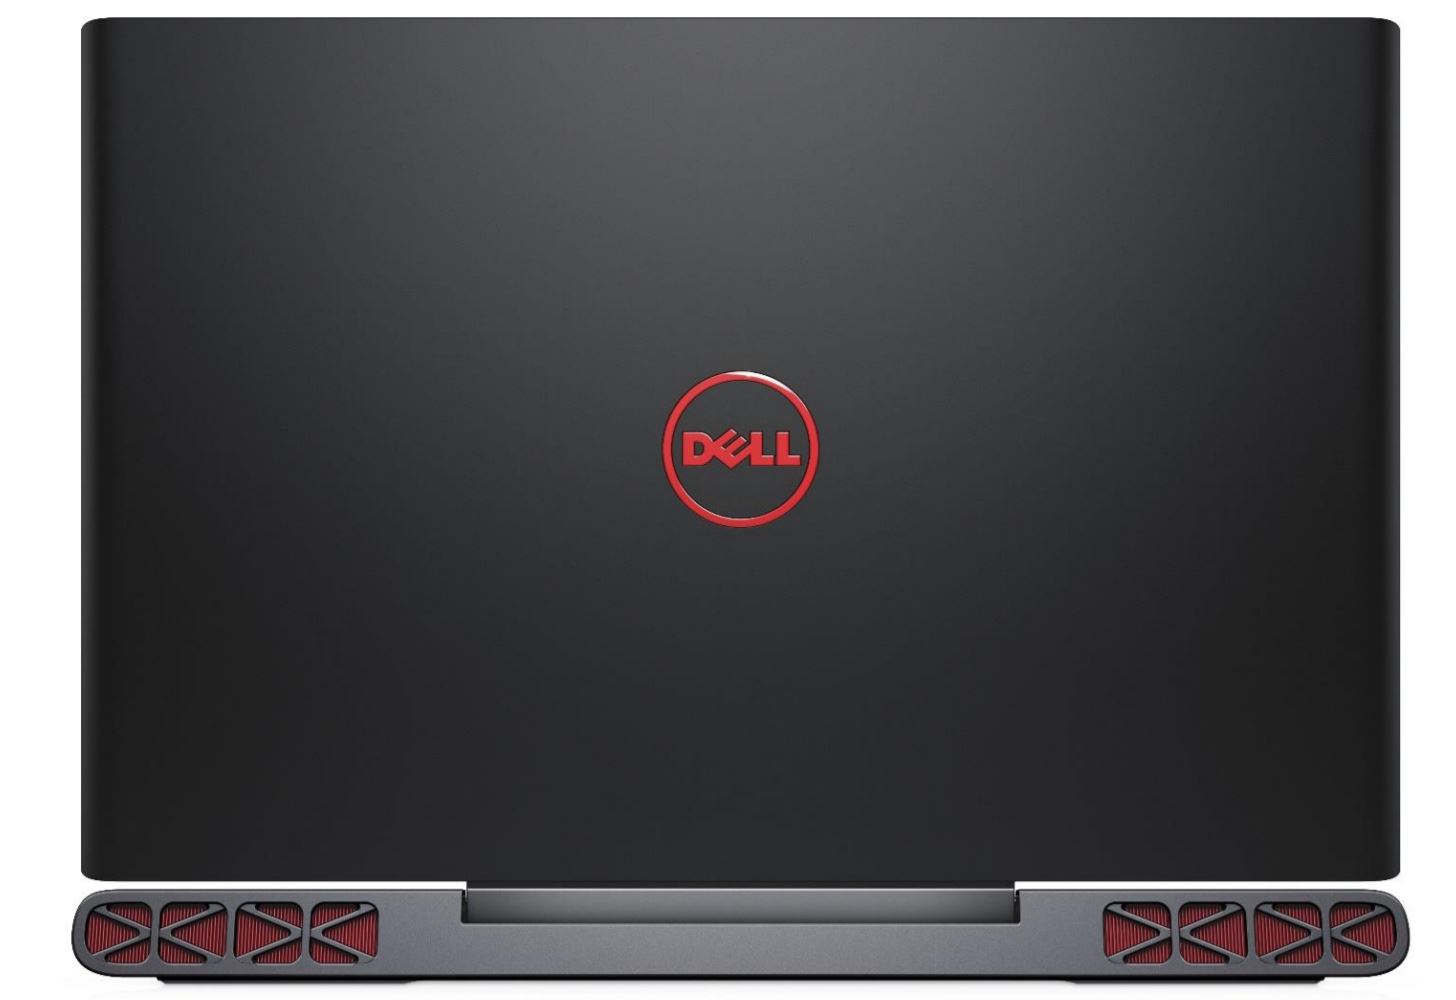
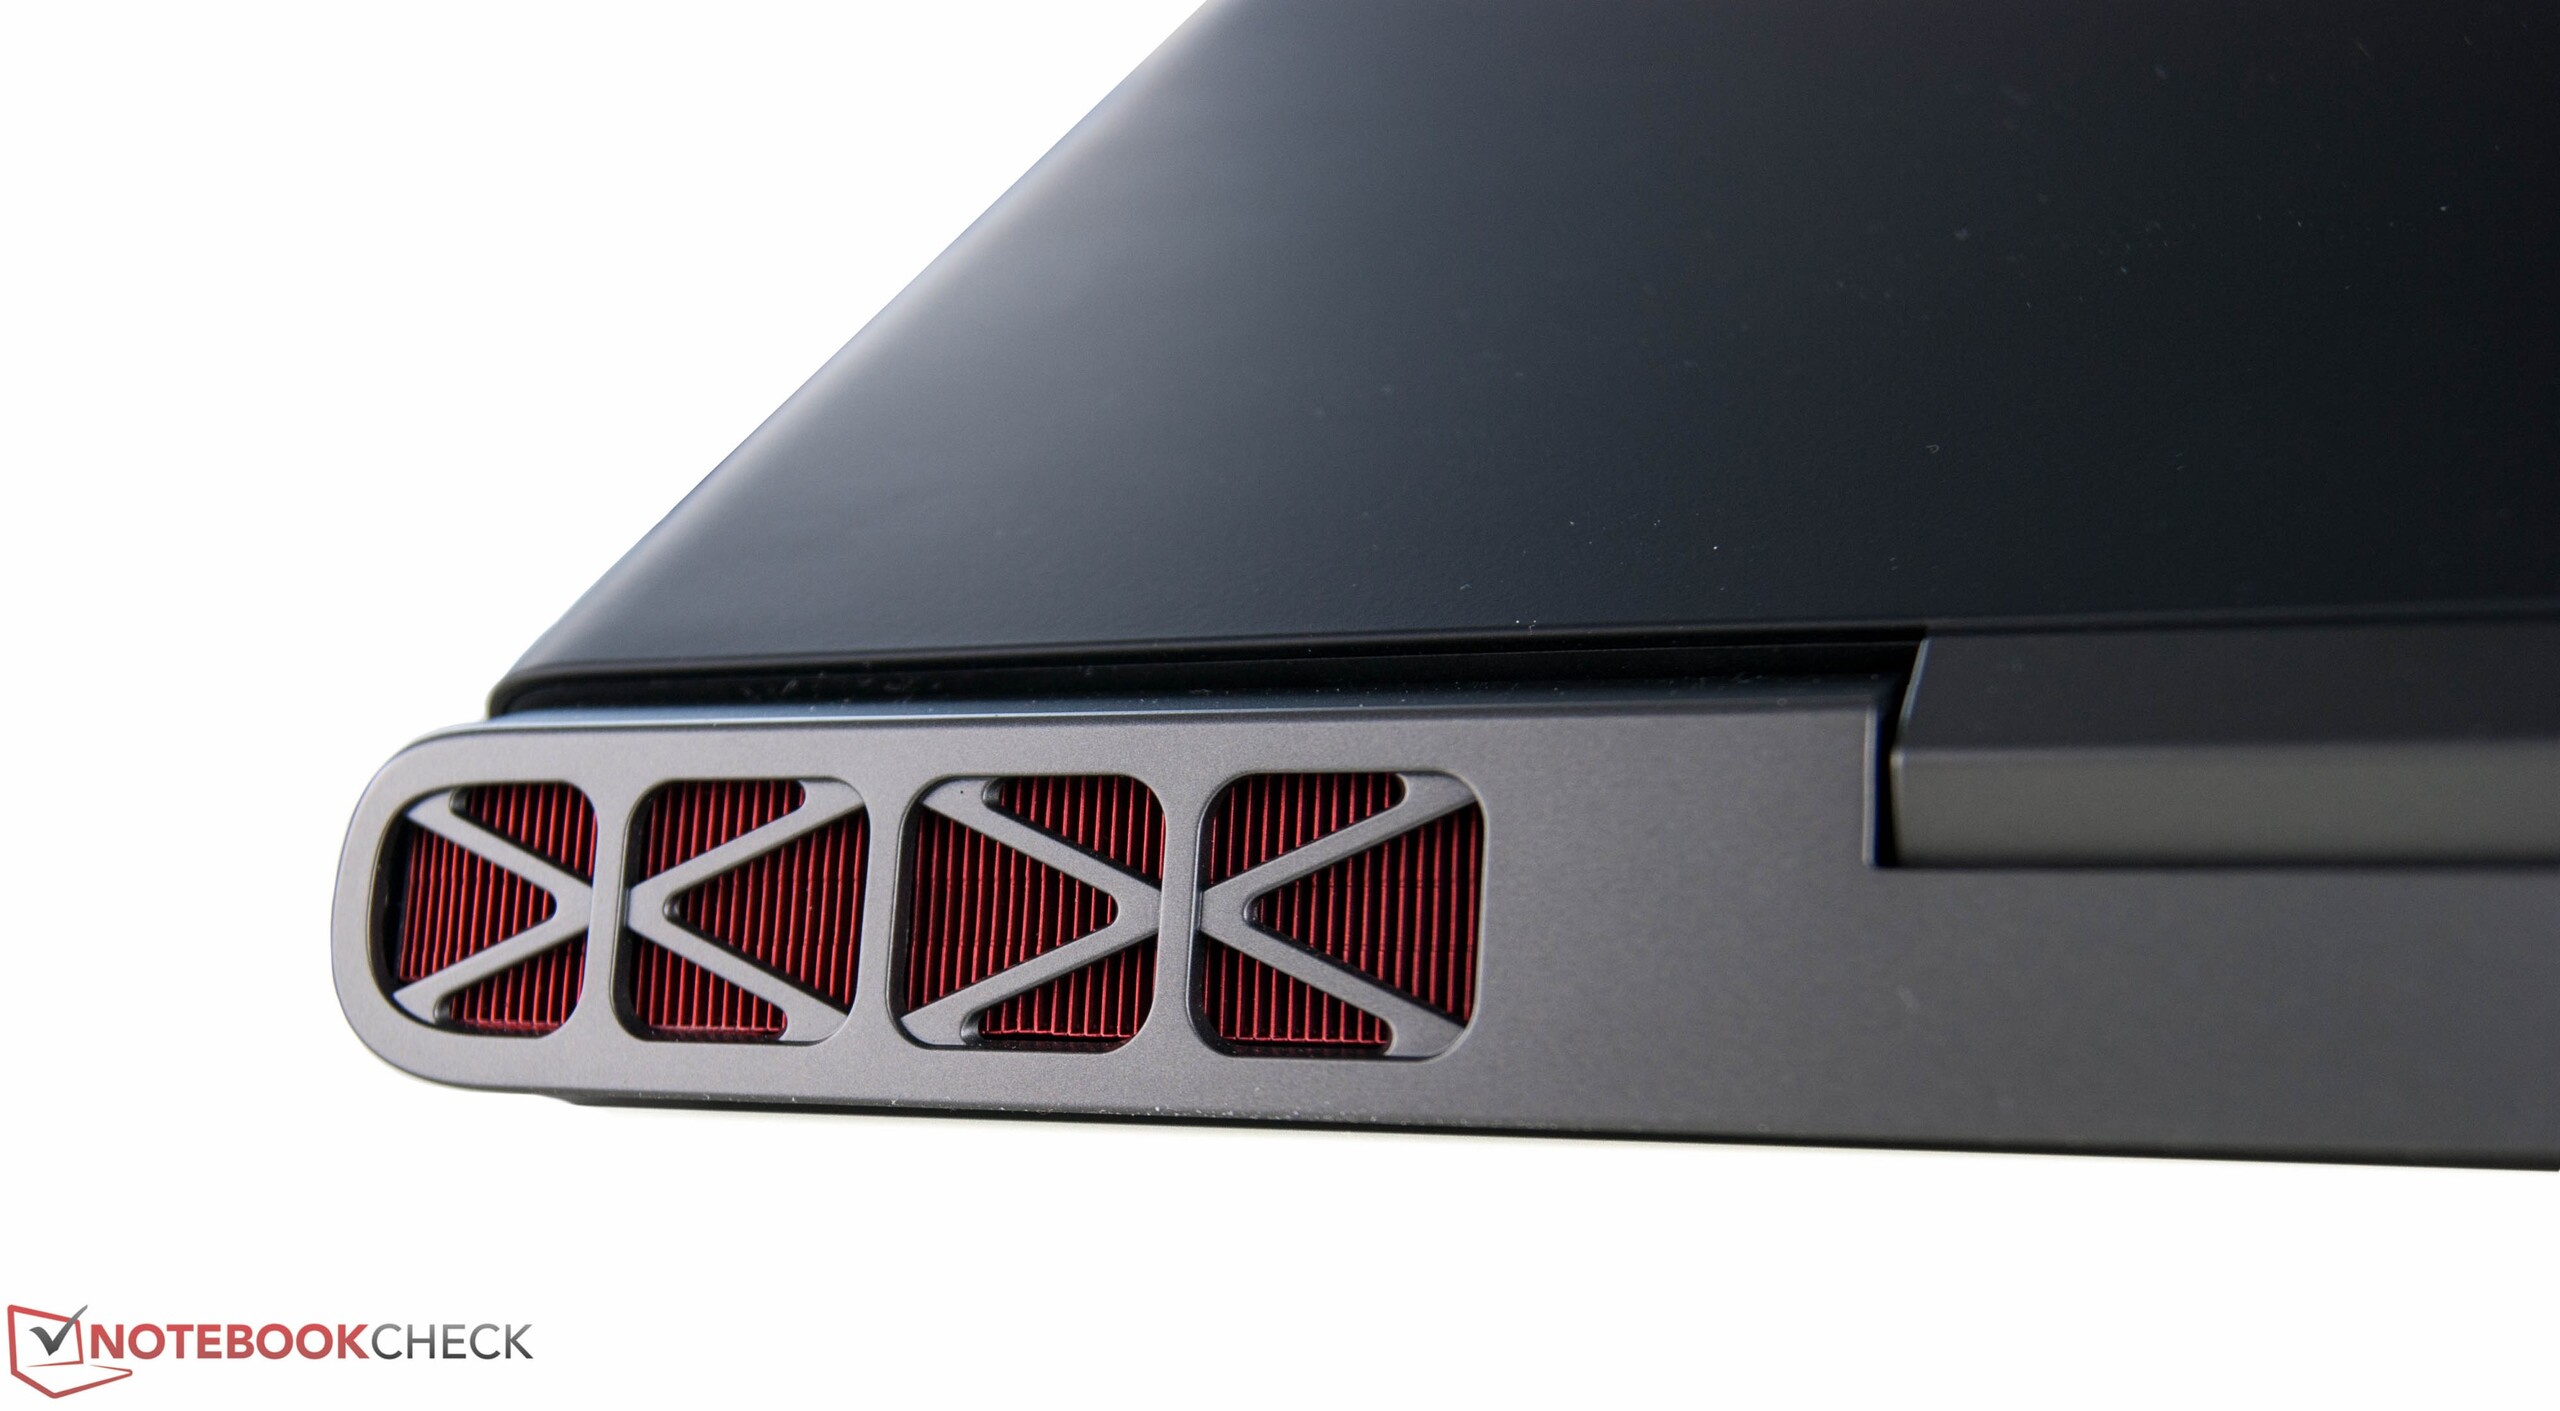
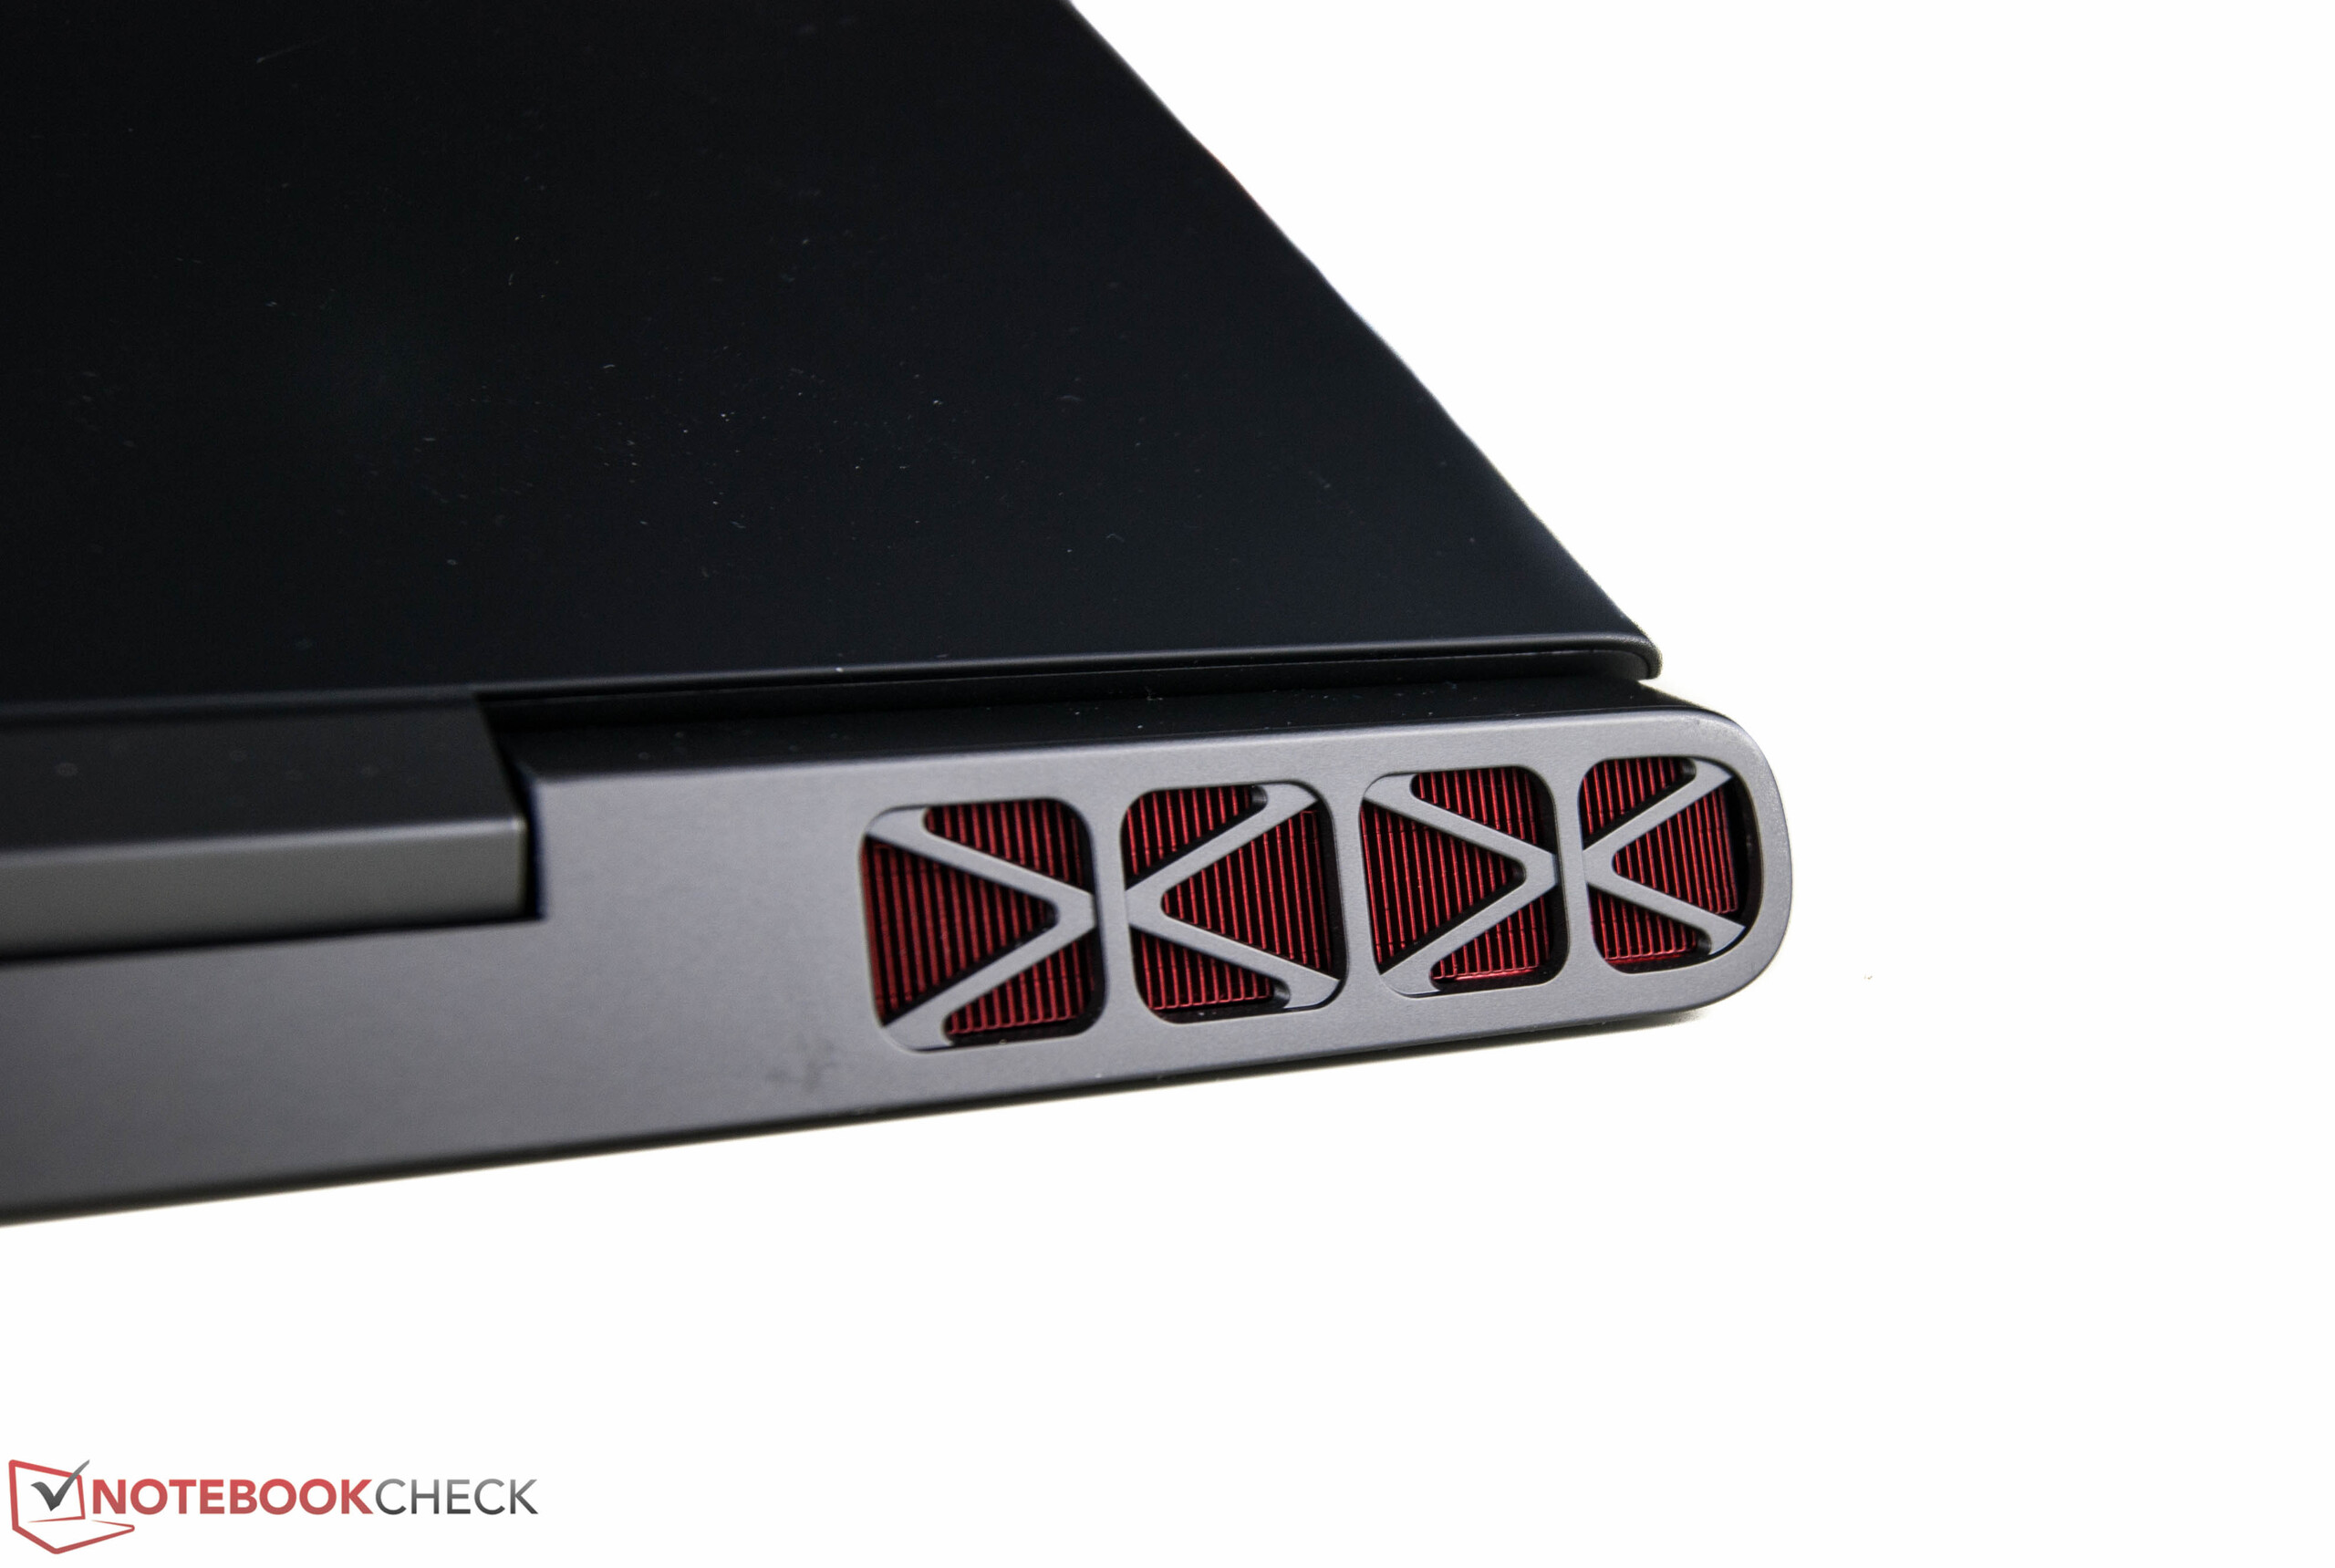
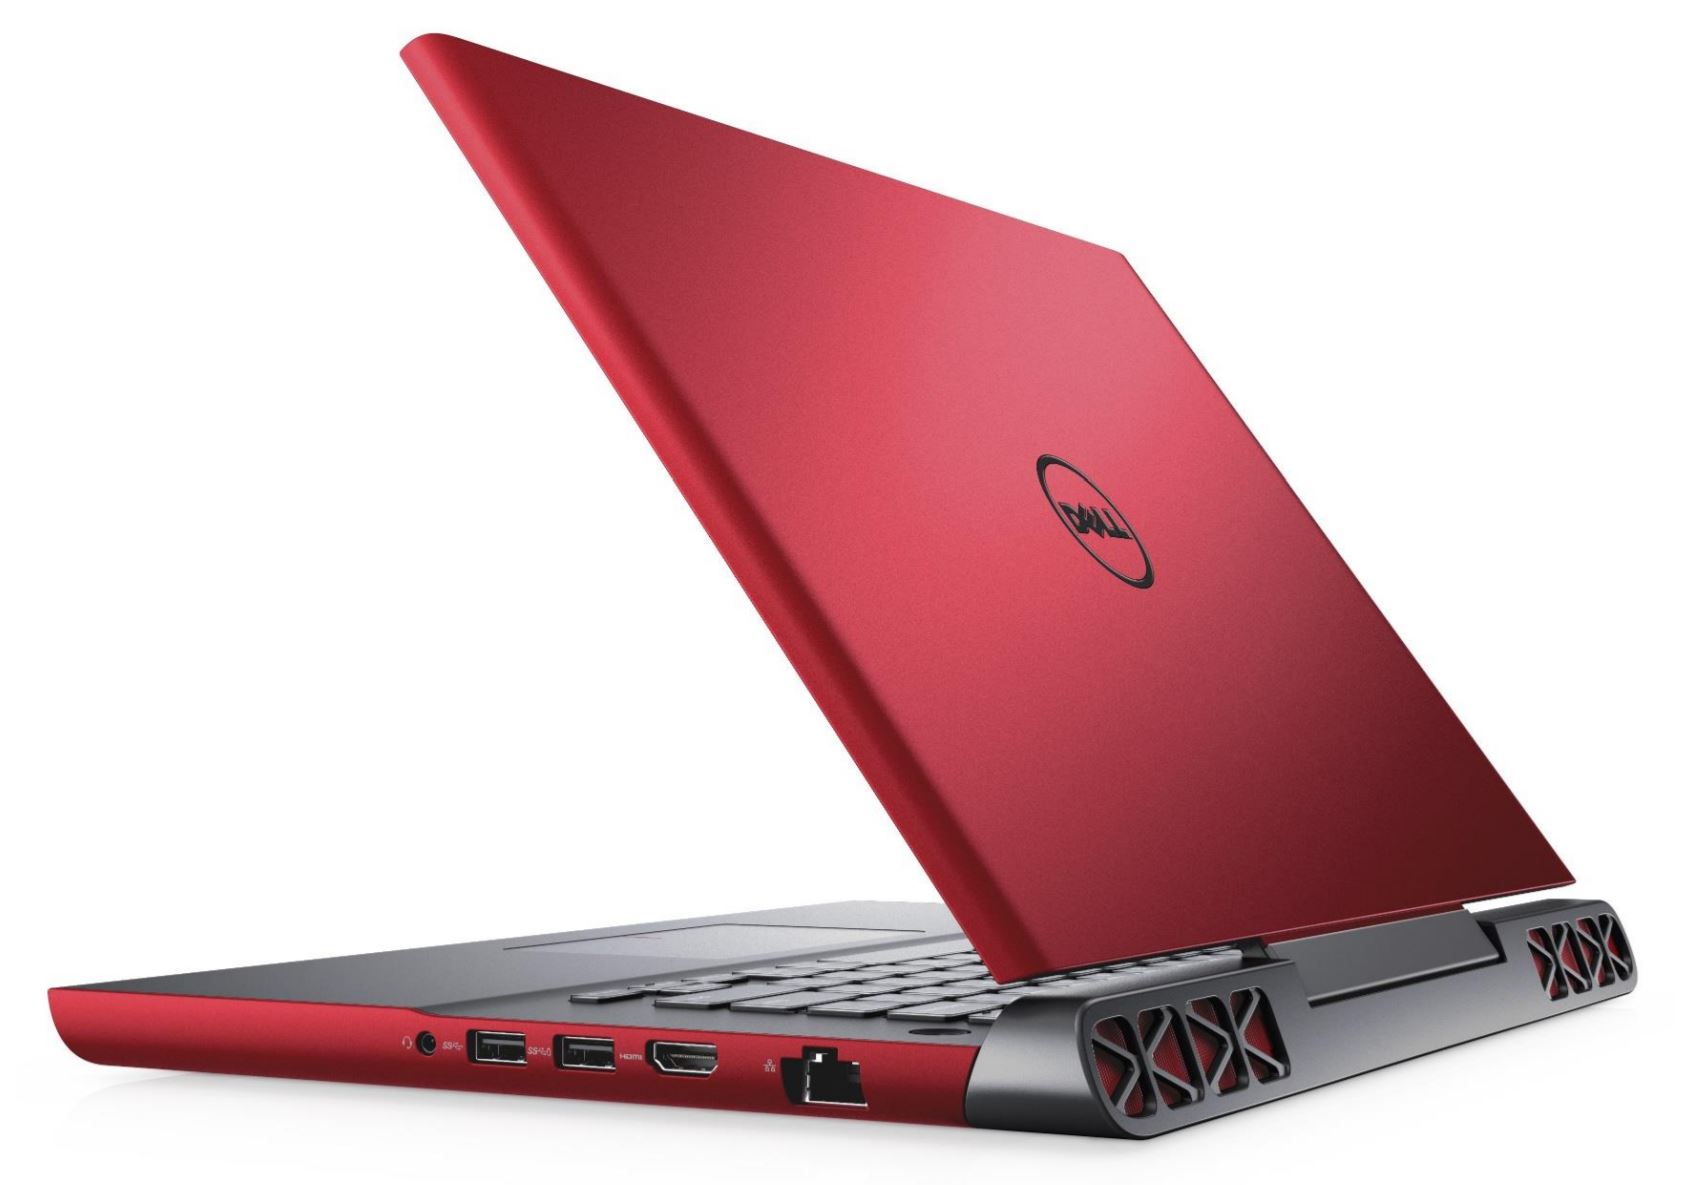
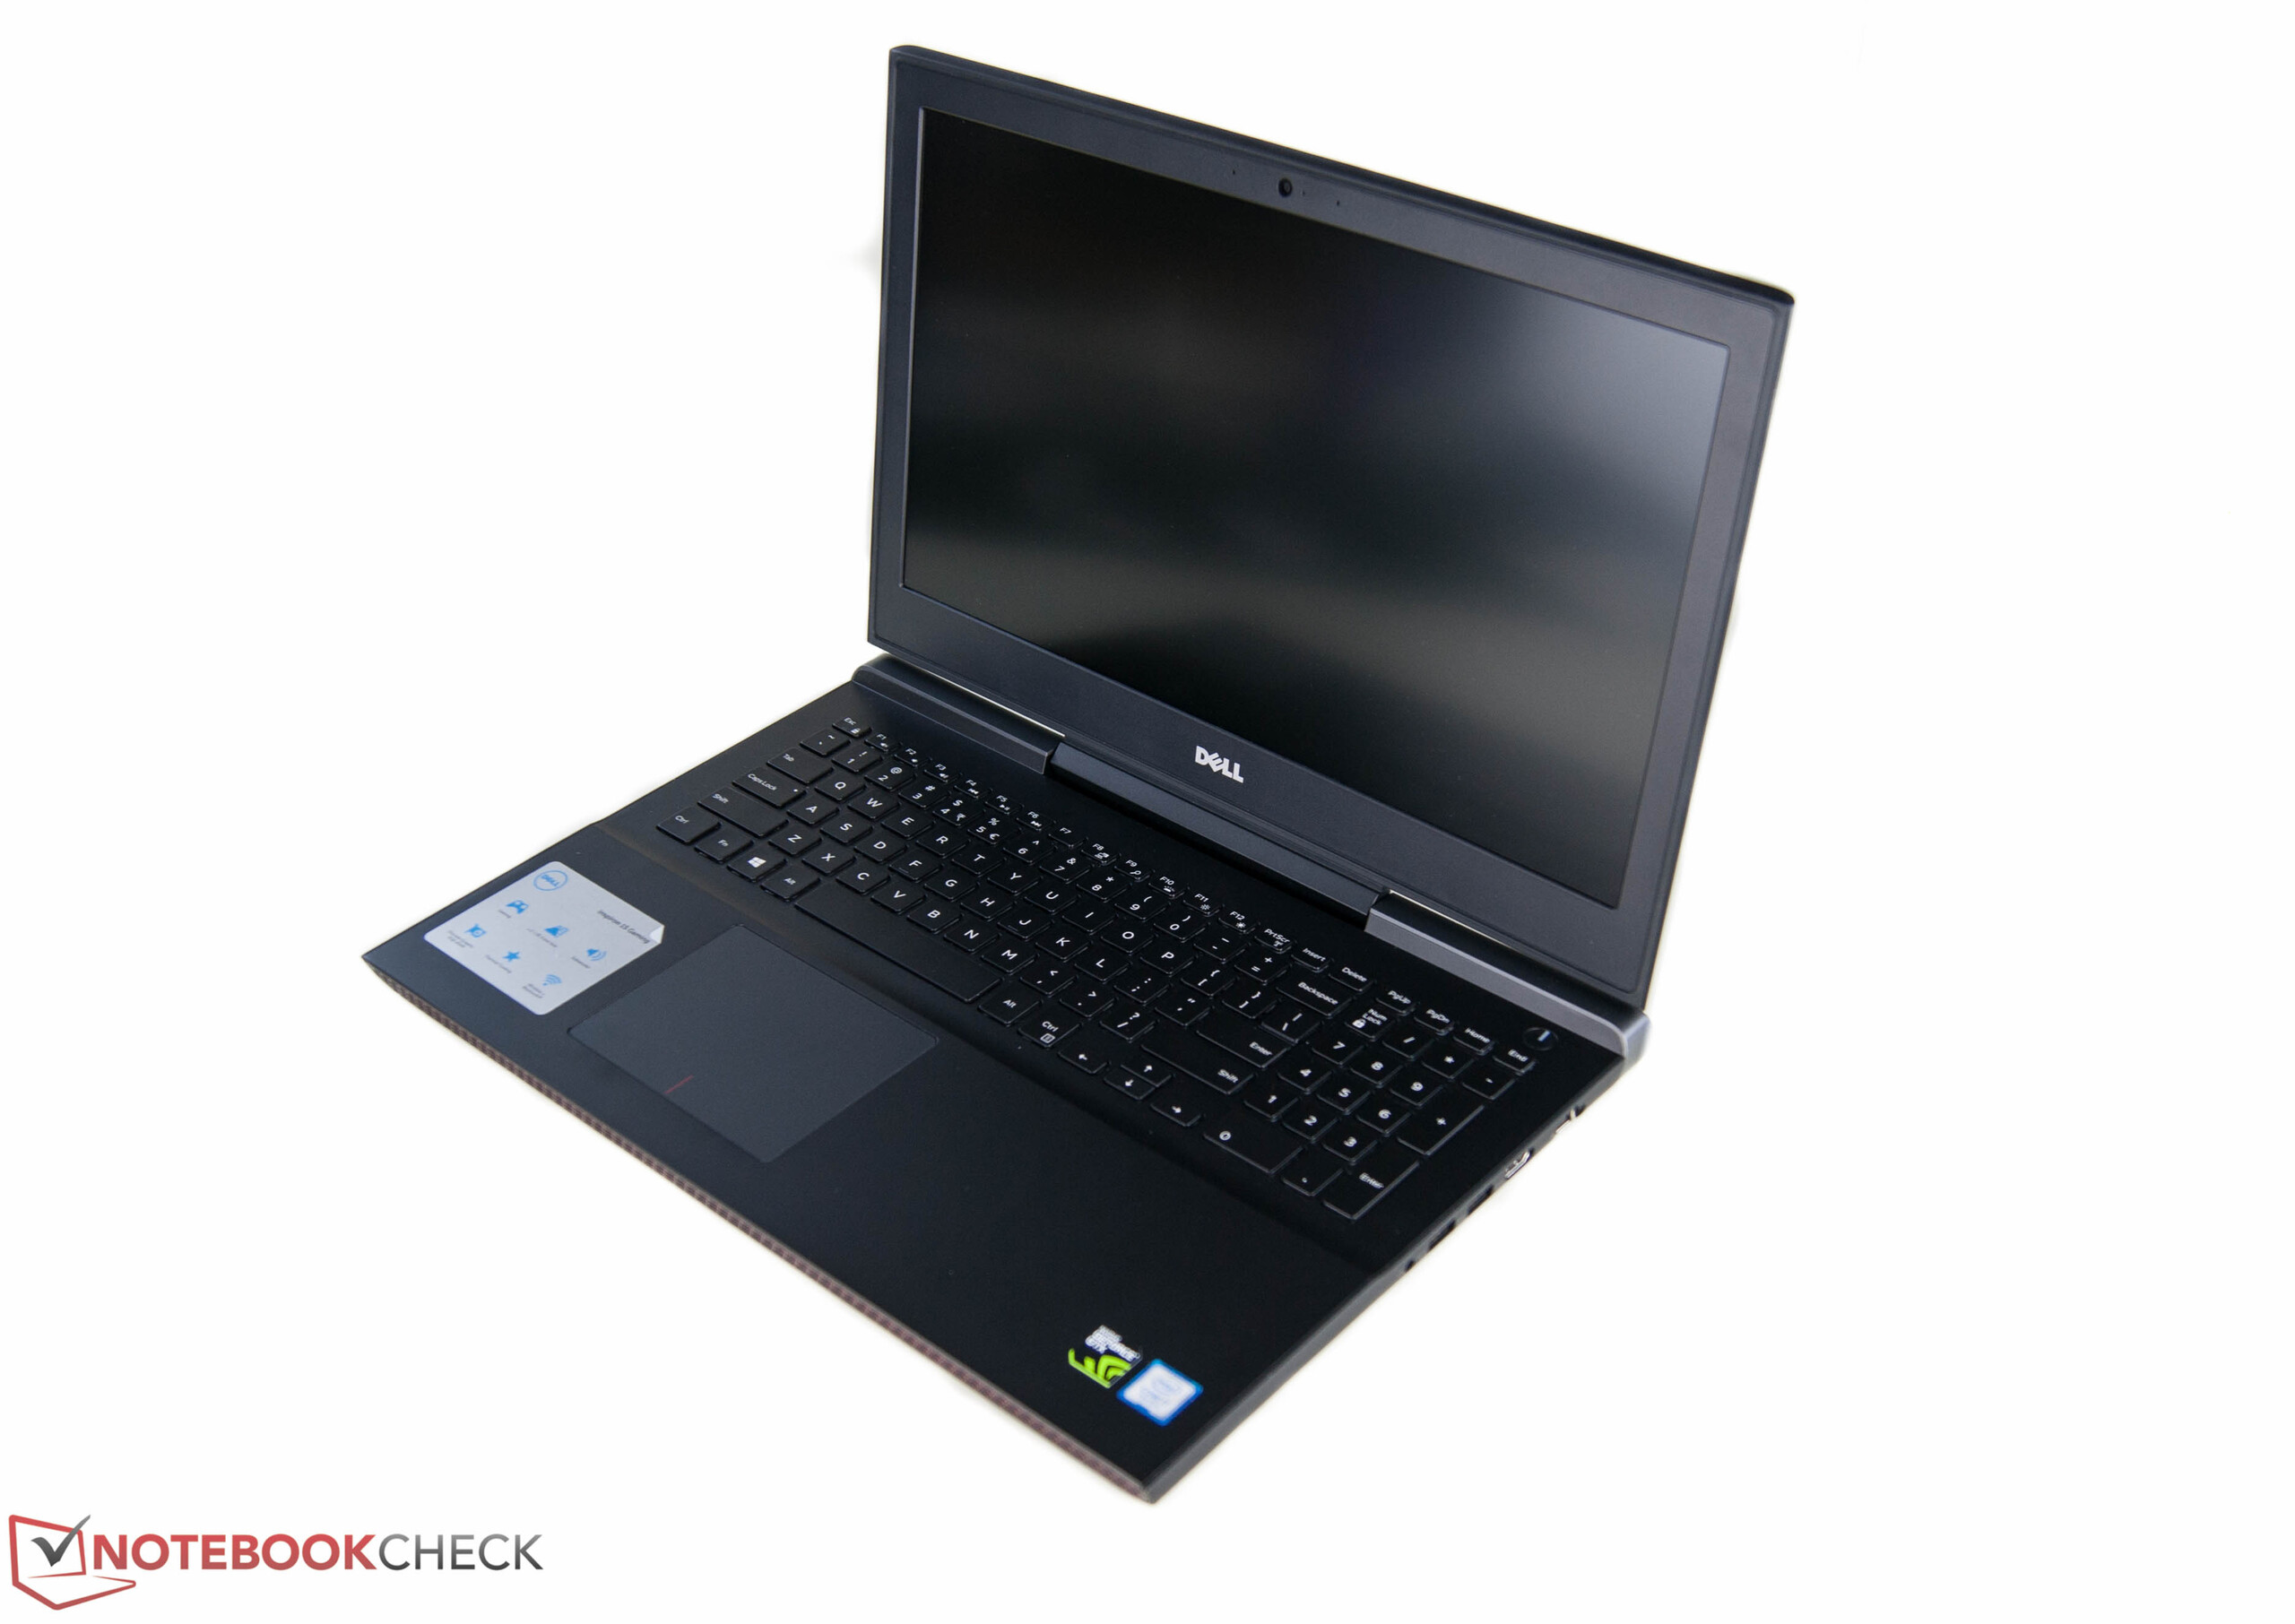
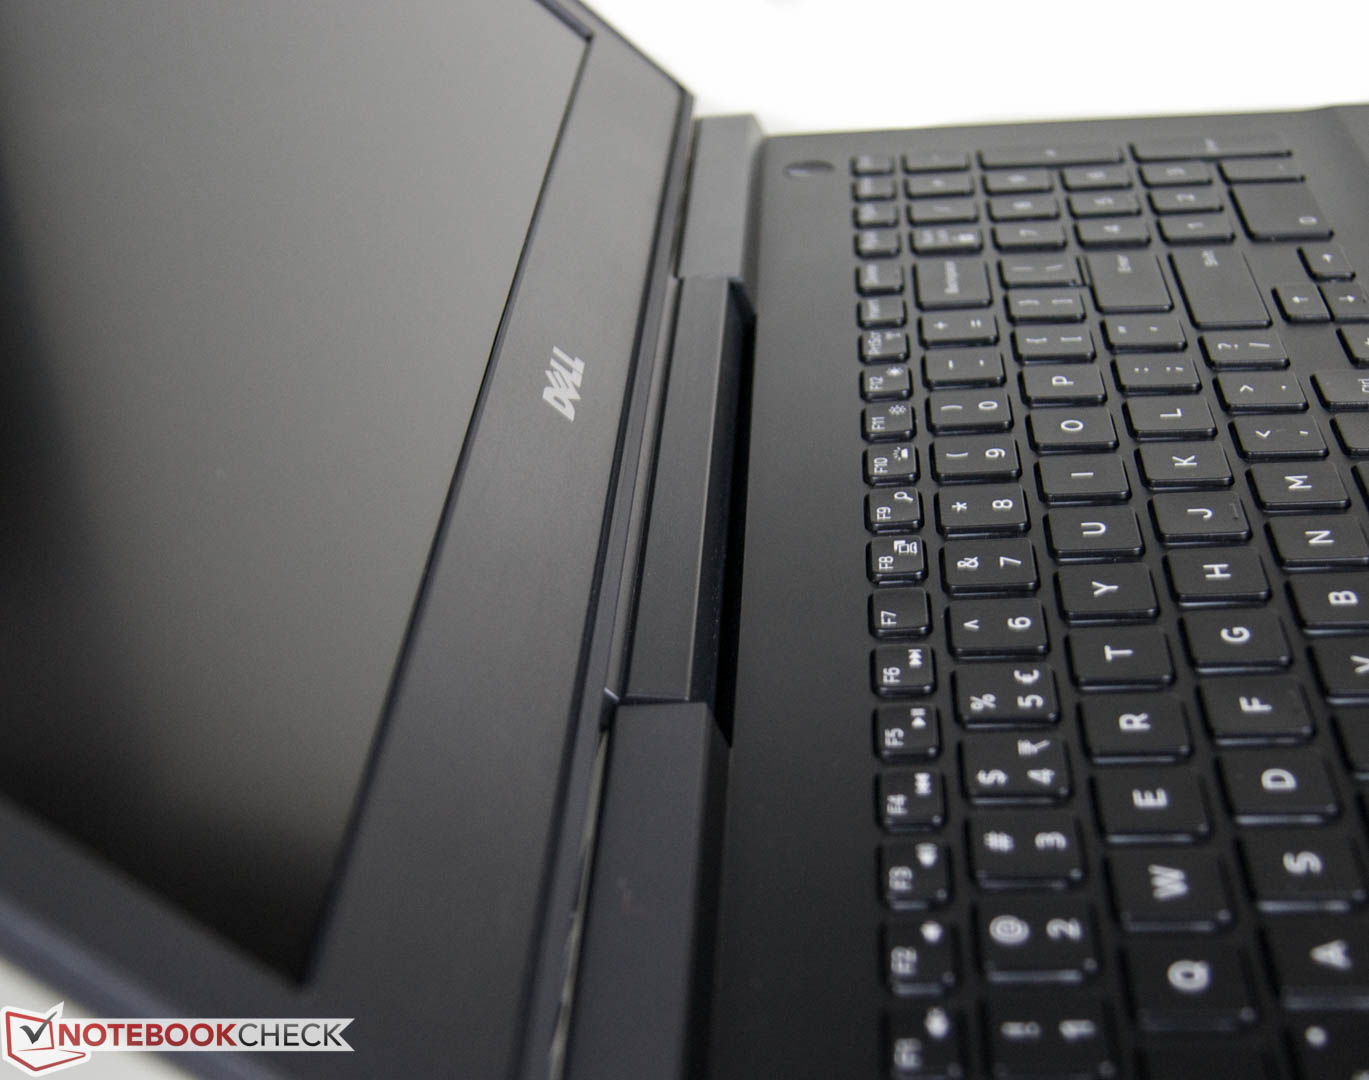
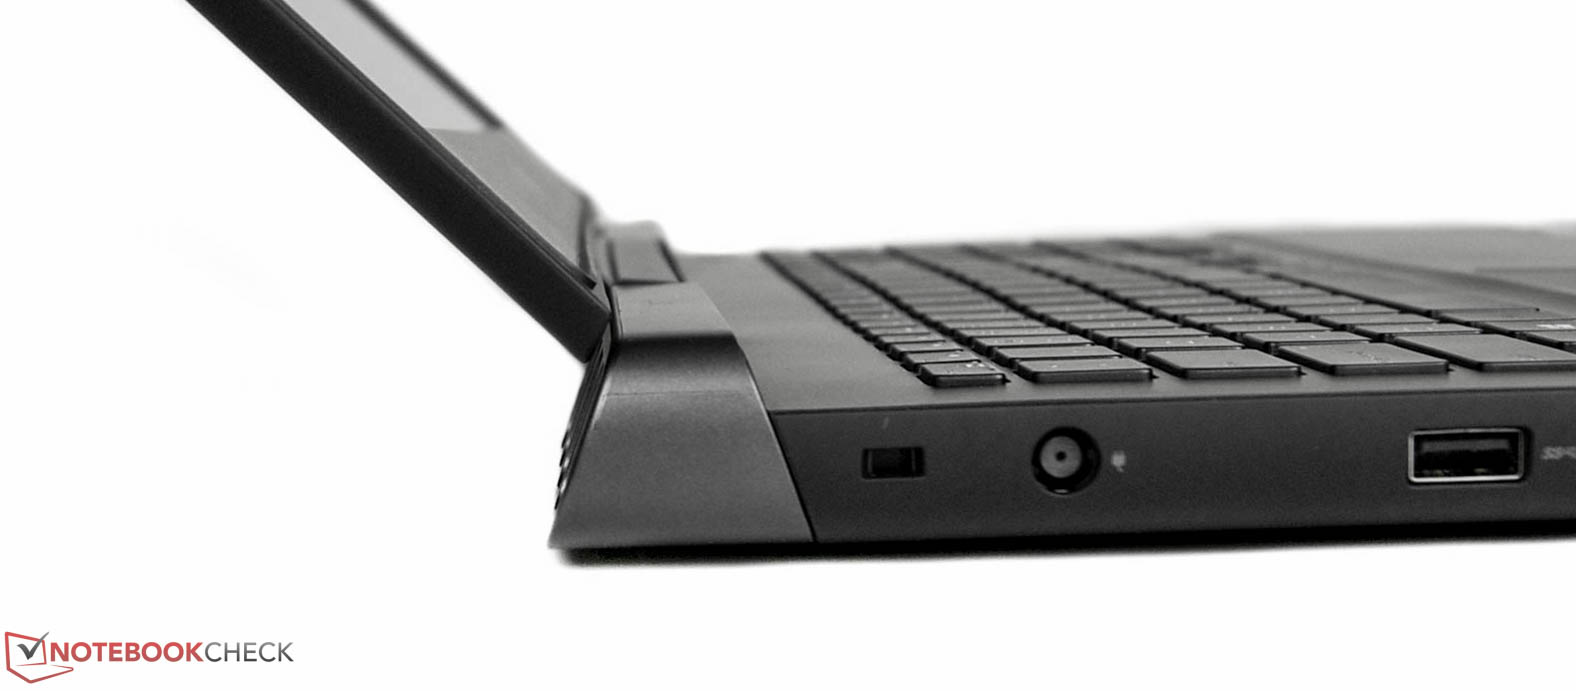
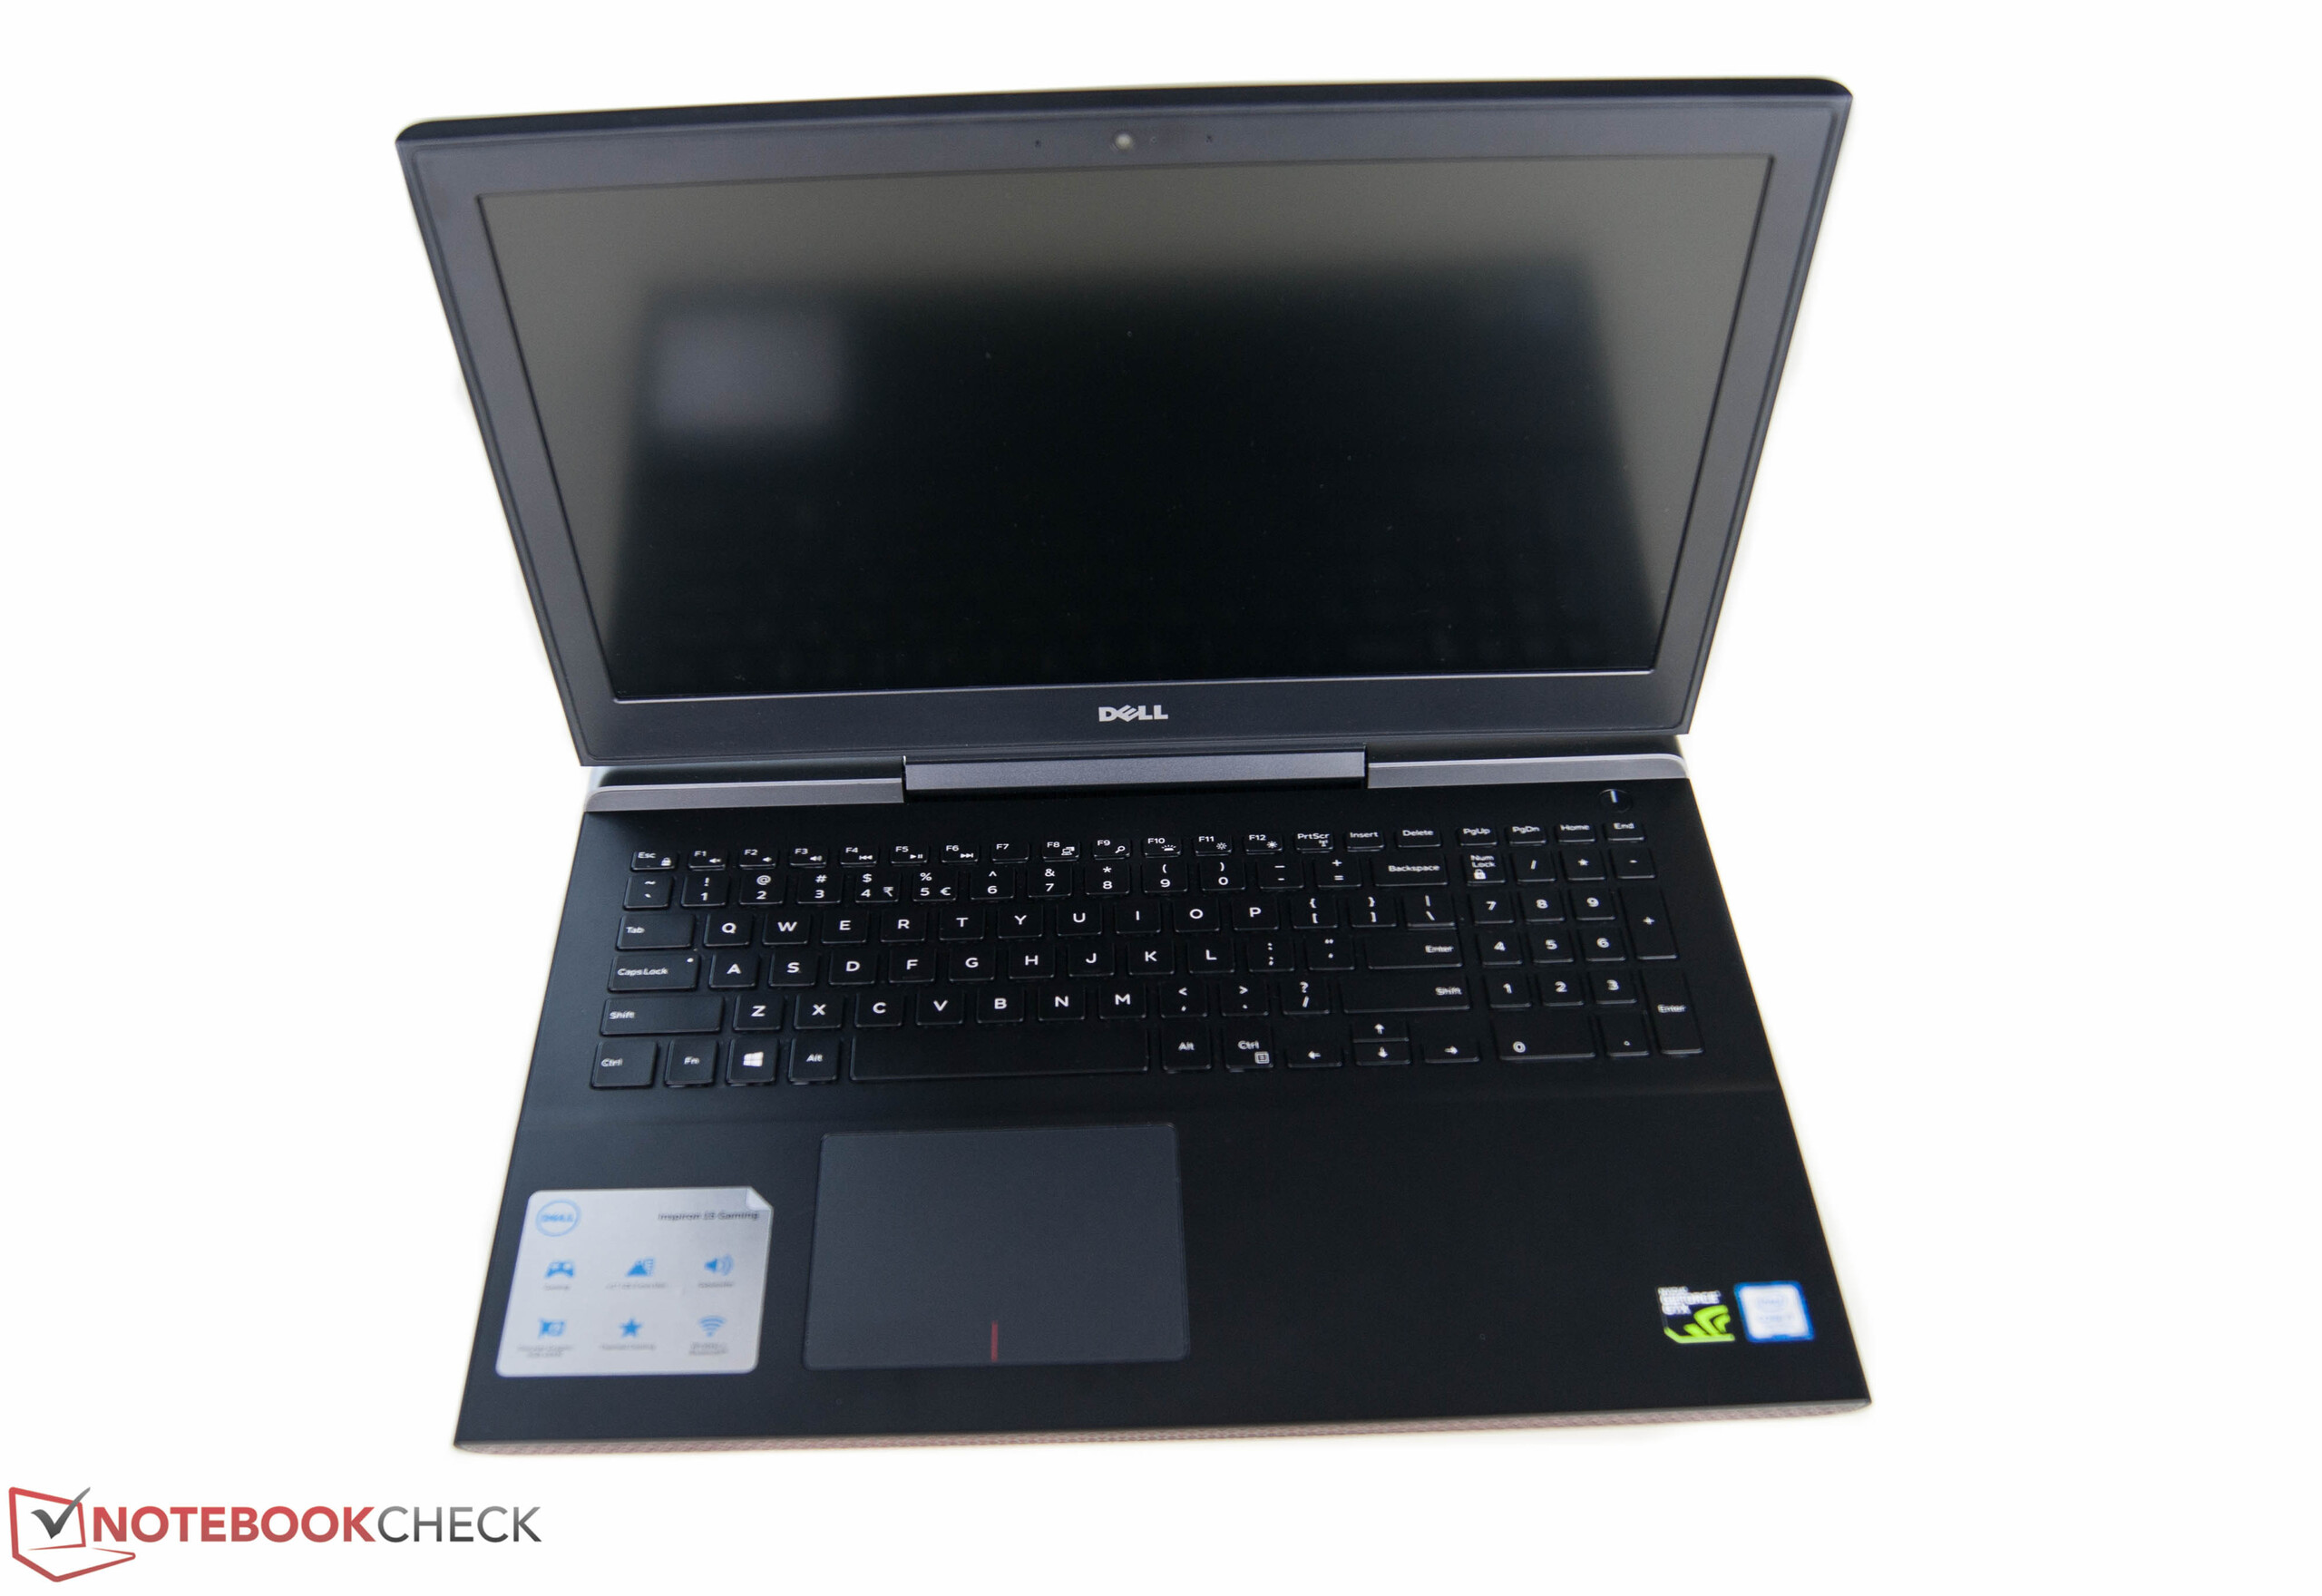
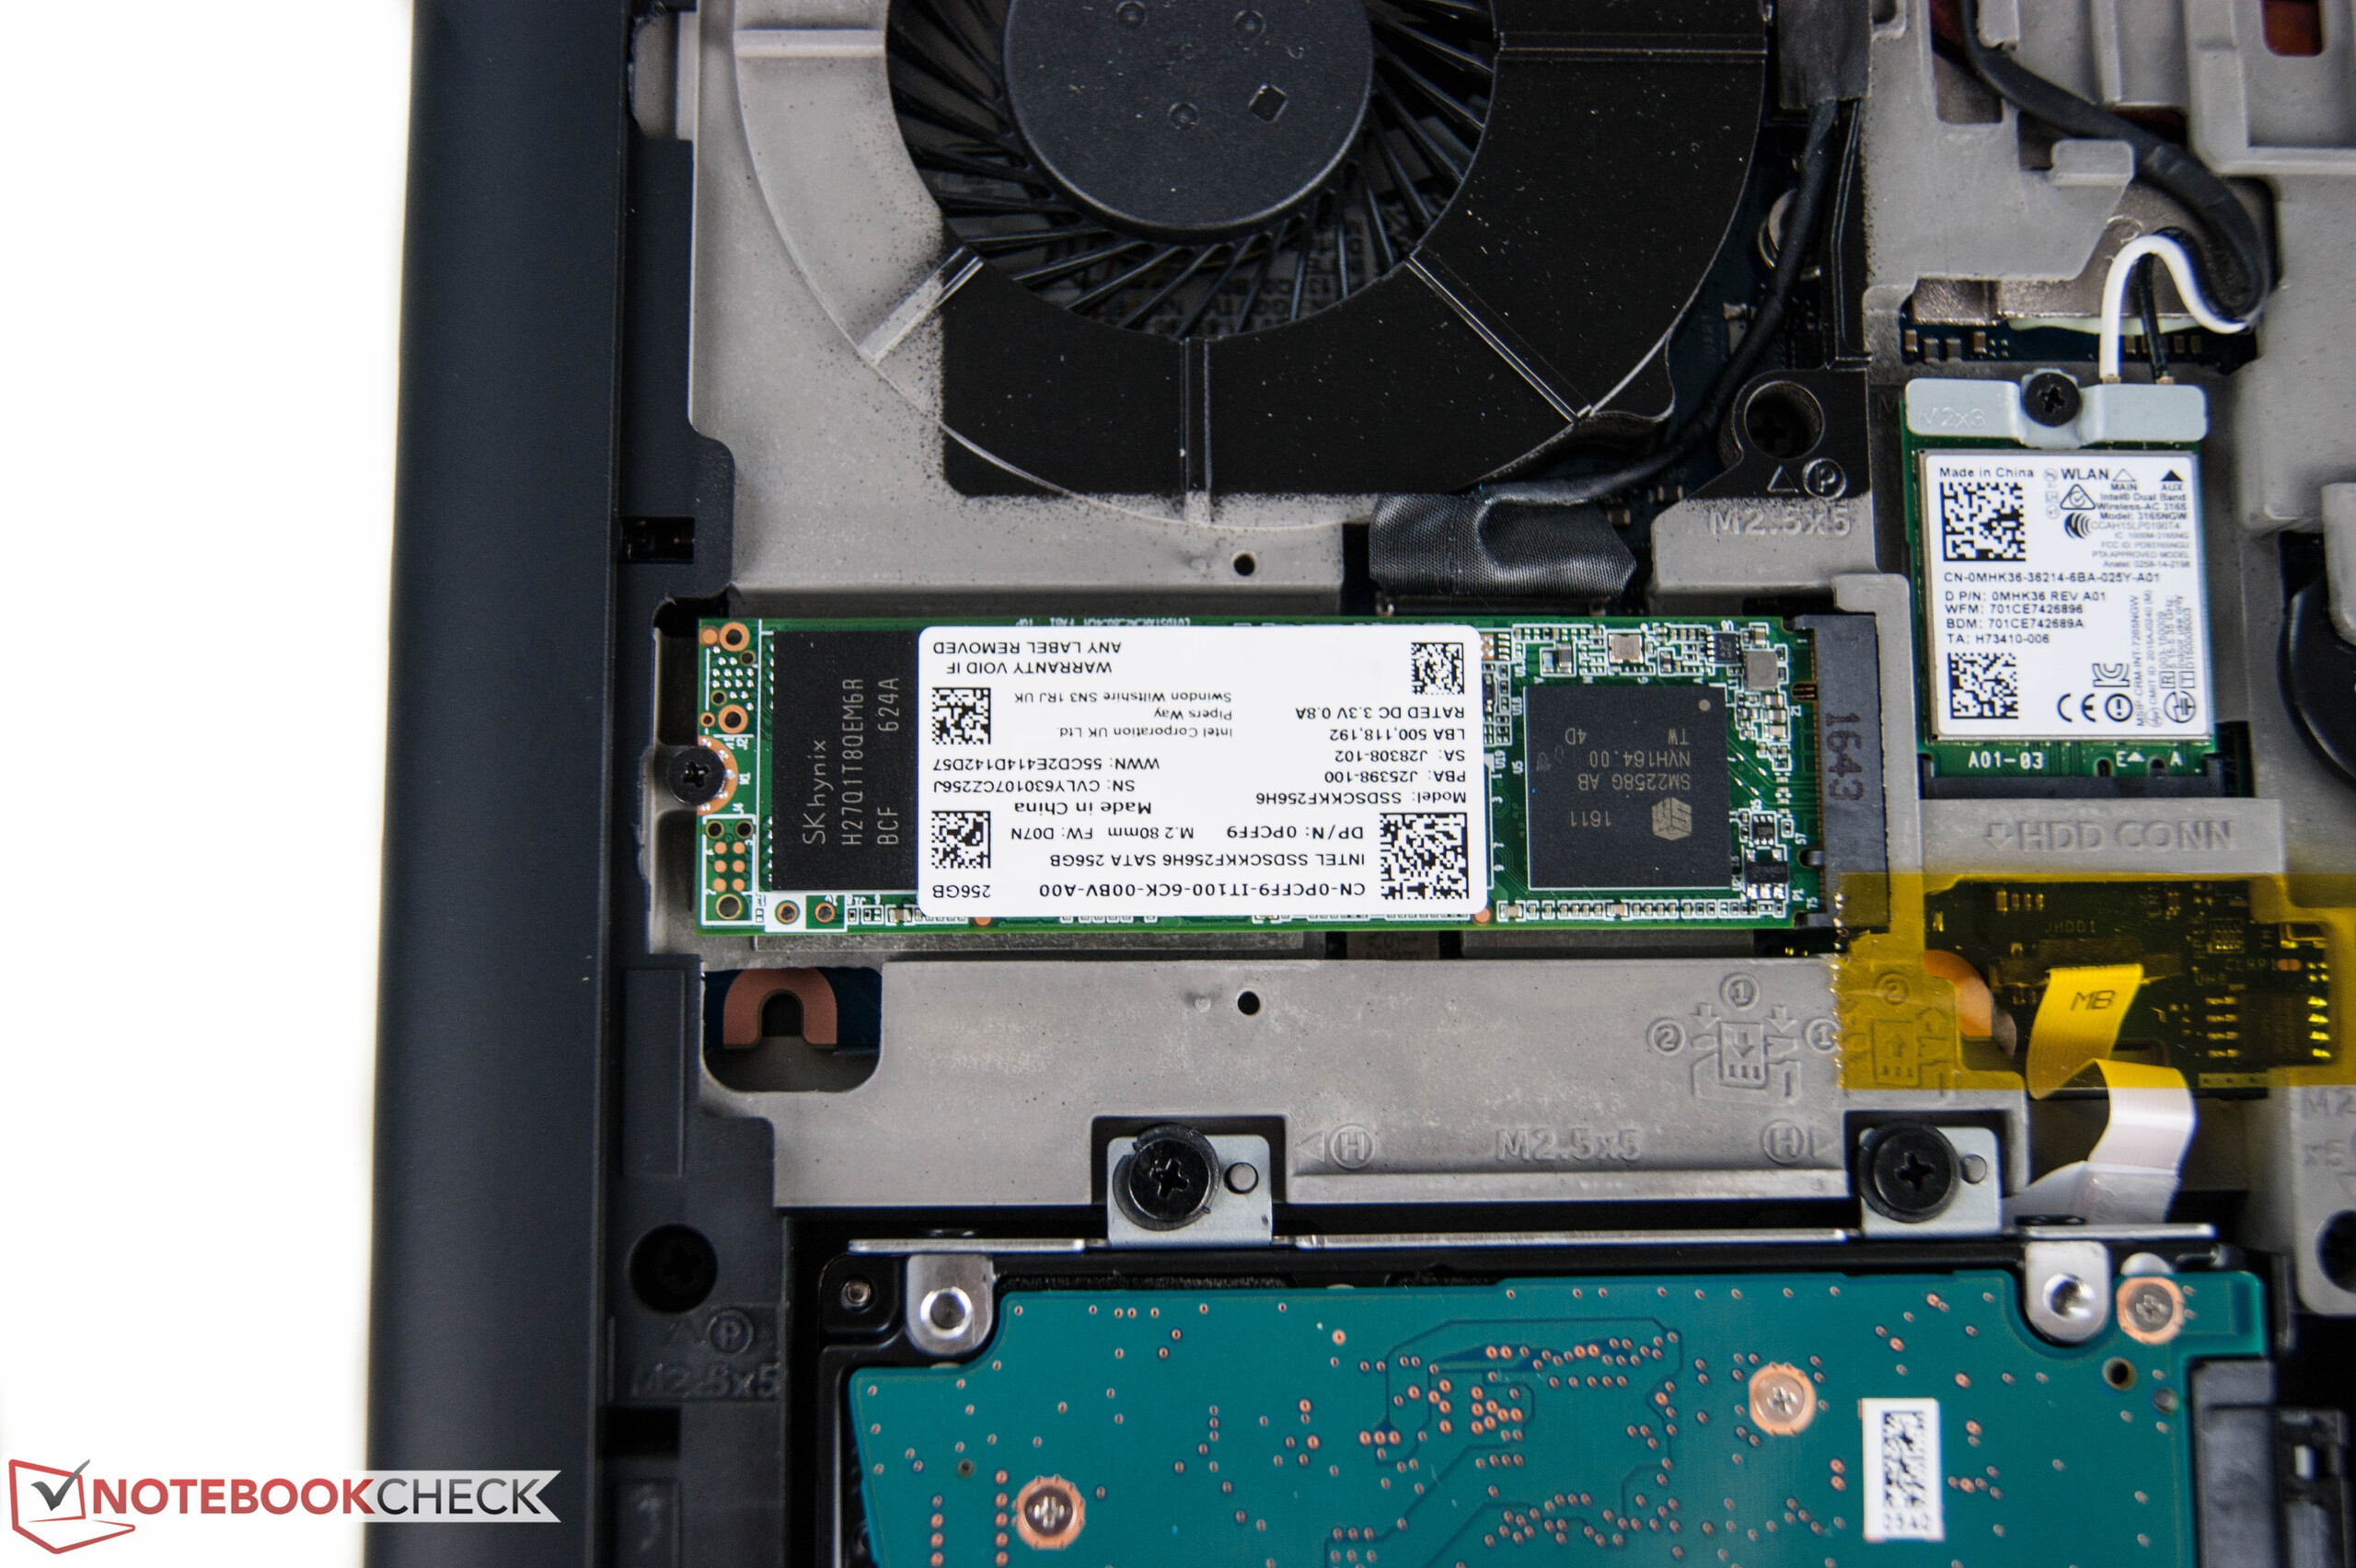
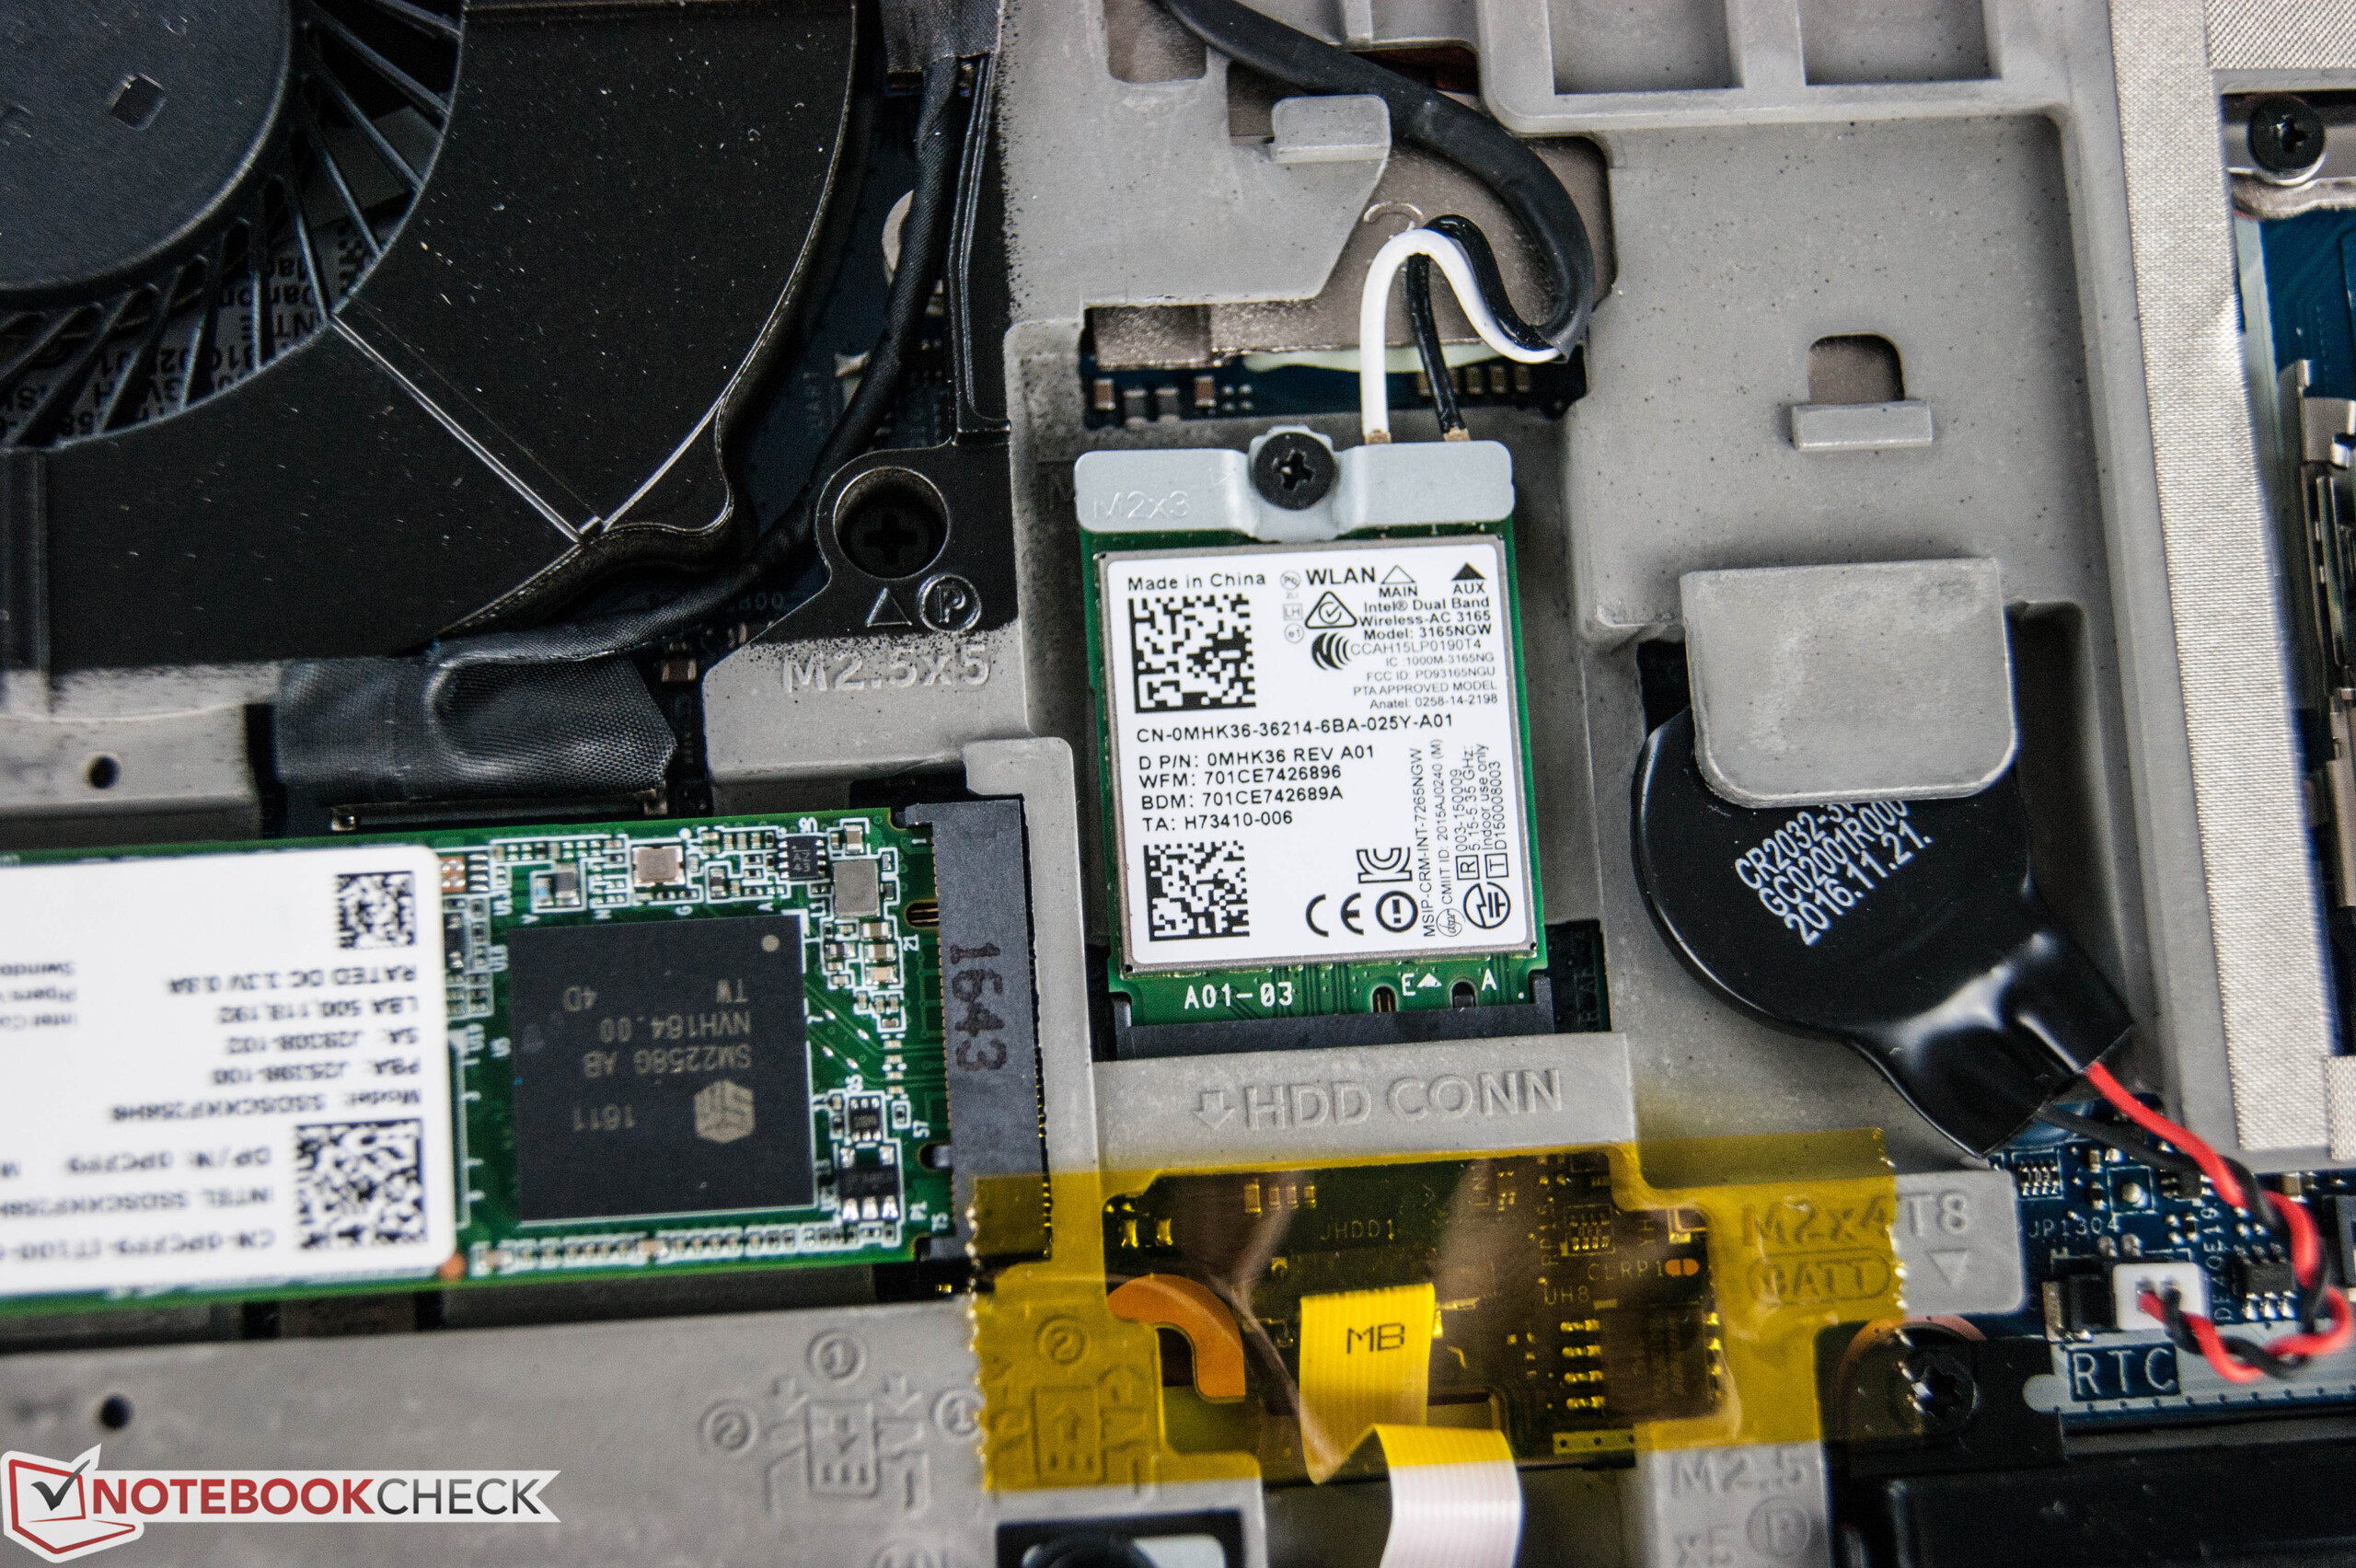
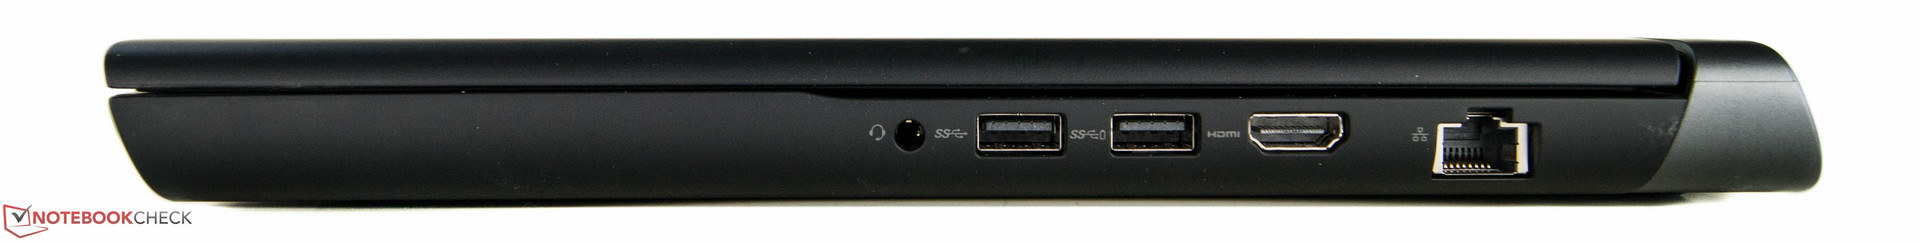
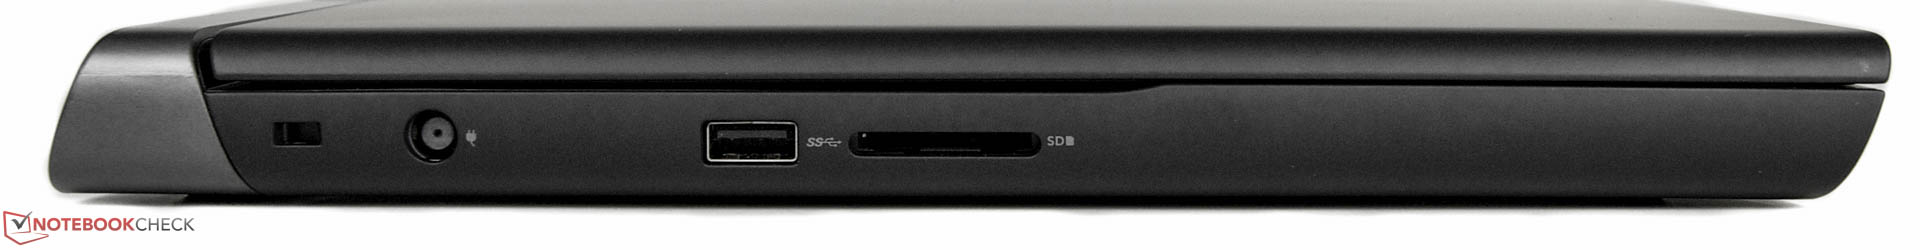
Un portátil gaming para la vida diaria. El nuevo Dell Inspiron 15 de la serie 7000 demostró que tiene derecho a existir en el mundo de portátiles gaming. Lo primero, tiene una carcasa bien hecha, lo que permite al usuario final hacer mantenimiento. Sin embargo, sólo hay unas pocas interfaces para un portátil de 15". Además, el rendimiento del lector SD es malo. A cambio, el fabricante ha incorporado dispositivos de entrada aceptables. El teclado incluso está iluminado, tiene bloque numérico, y es a prueba de salpicaduras. Sin embargo, no nos gustaron las pequeñas teclas de cursor, que son particularmente incómodas en juegos de carreras. La única decepción real del Inspiron 15 es el panel TN Full HD, que no sólo tiene muy poco ángulo de visión, sino que también es muy azulado. Dell debería al menos ofrecer a los clientes una opción de display IPS.
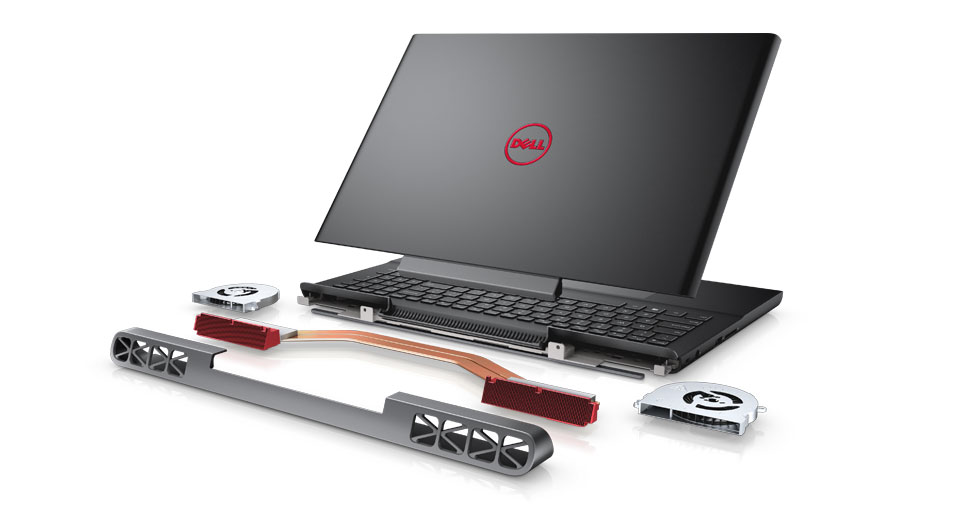
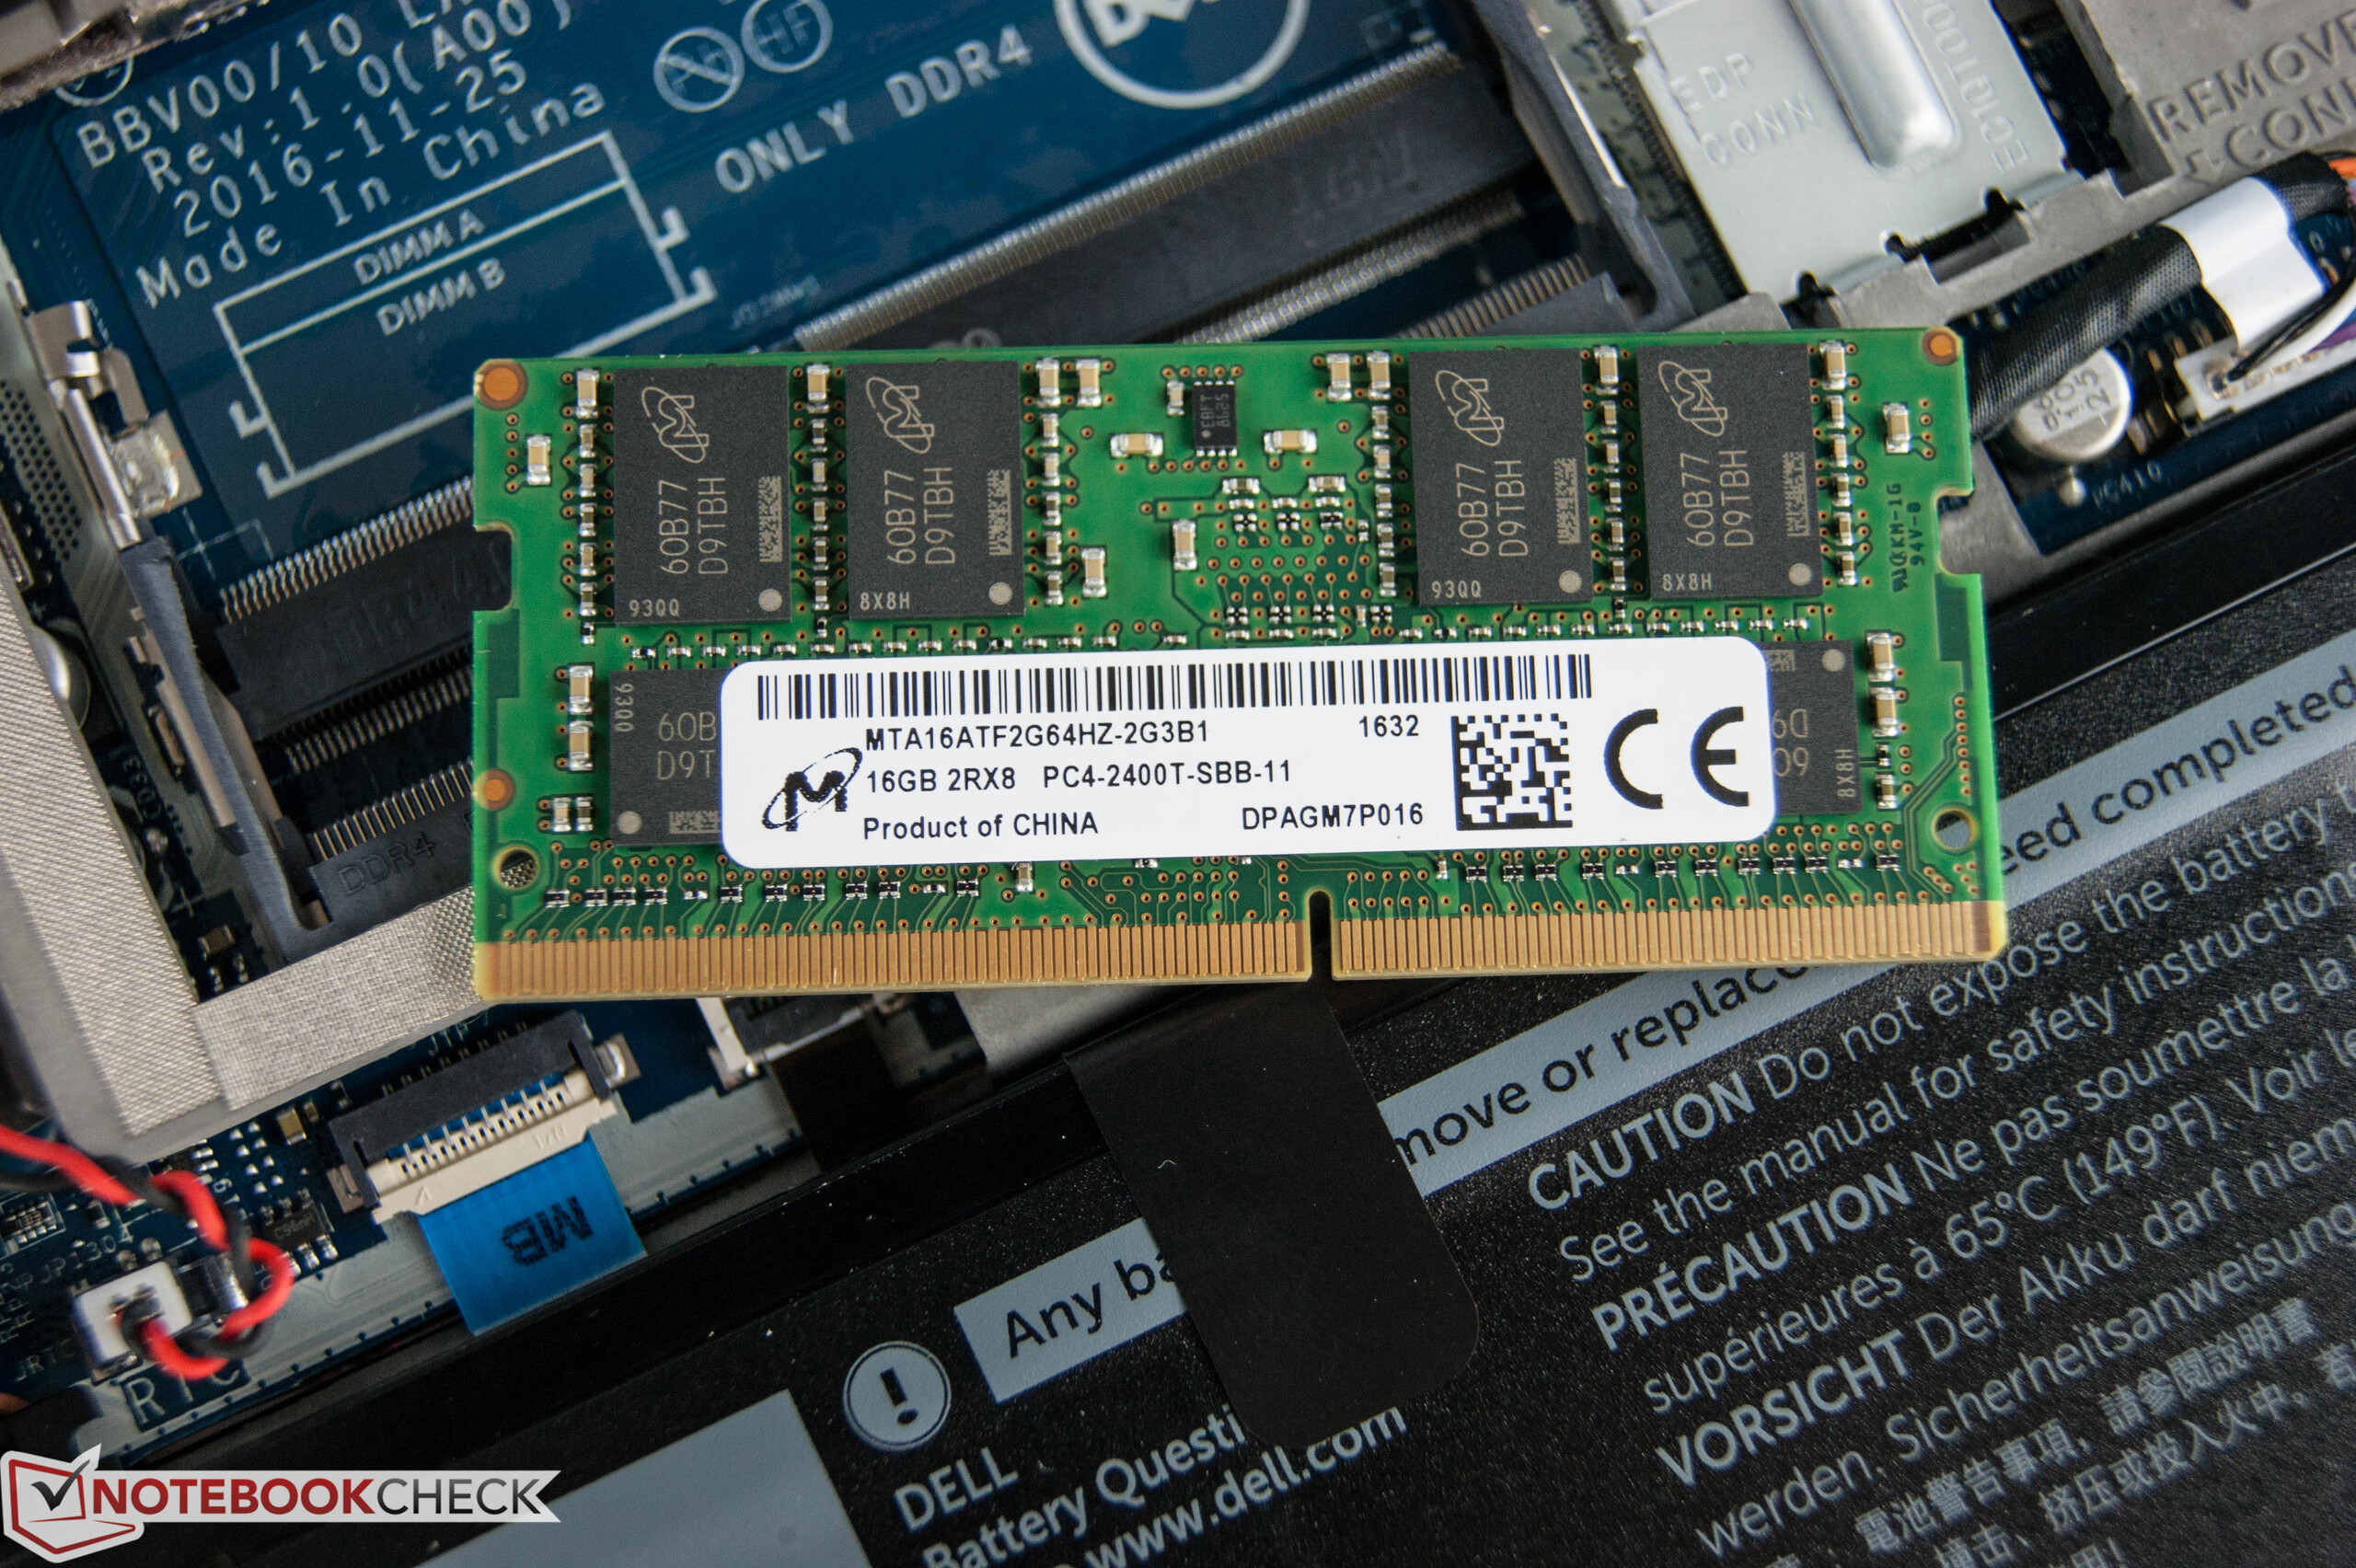
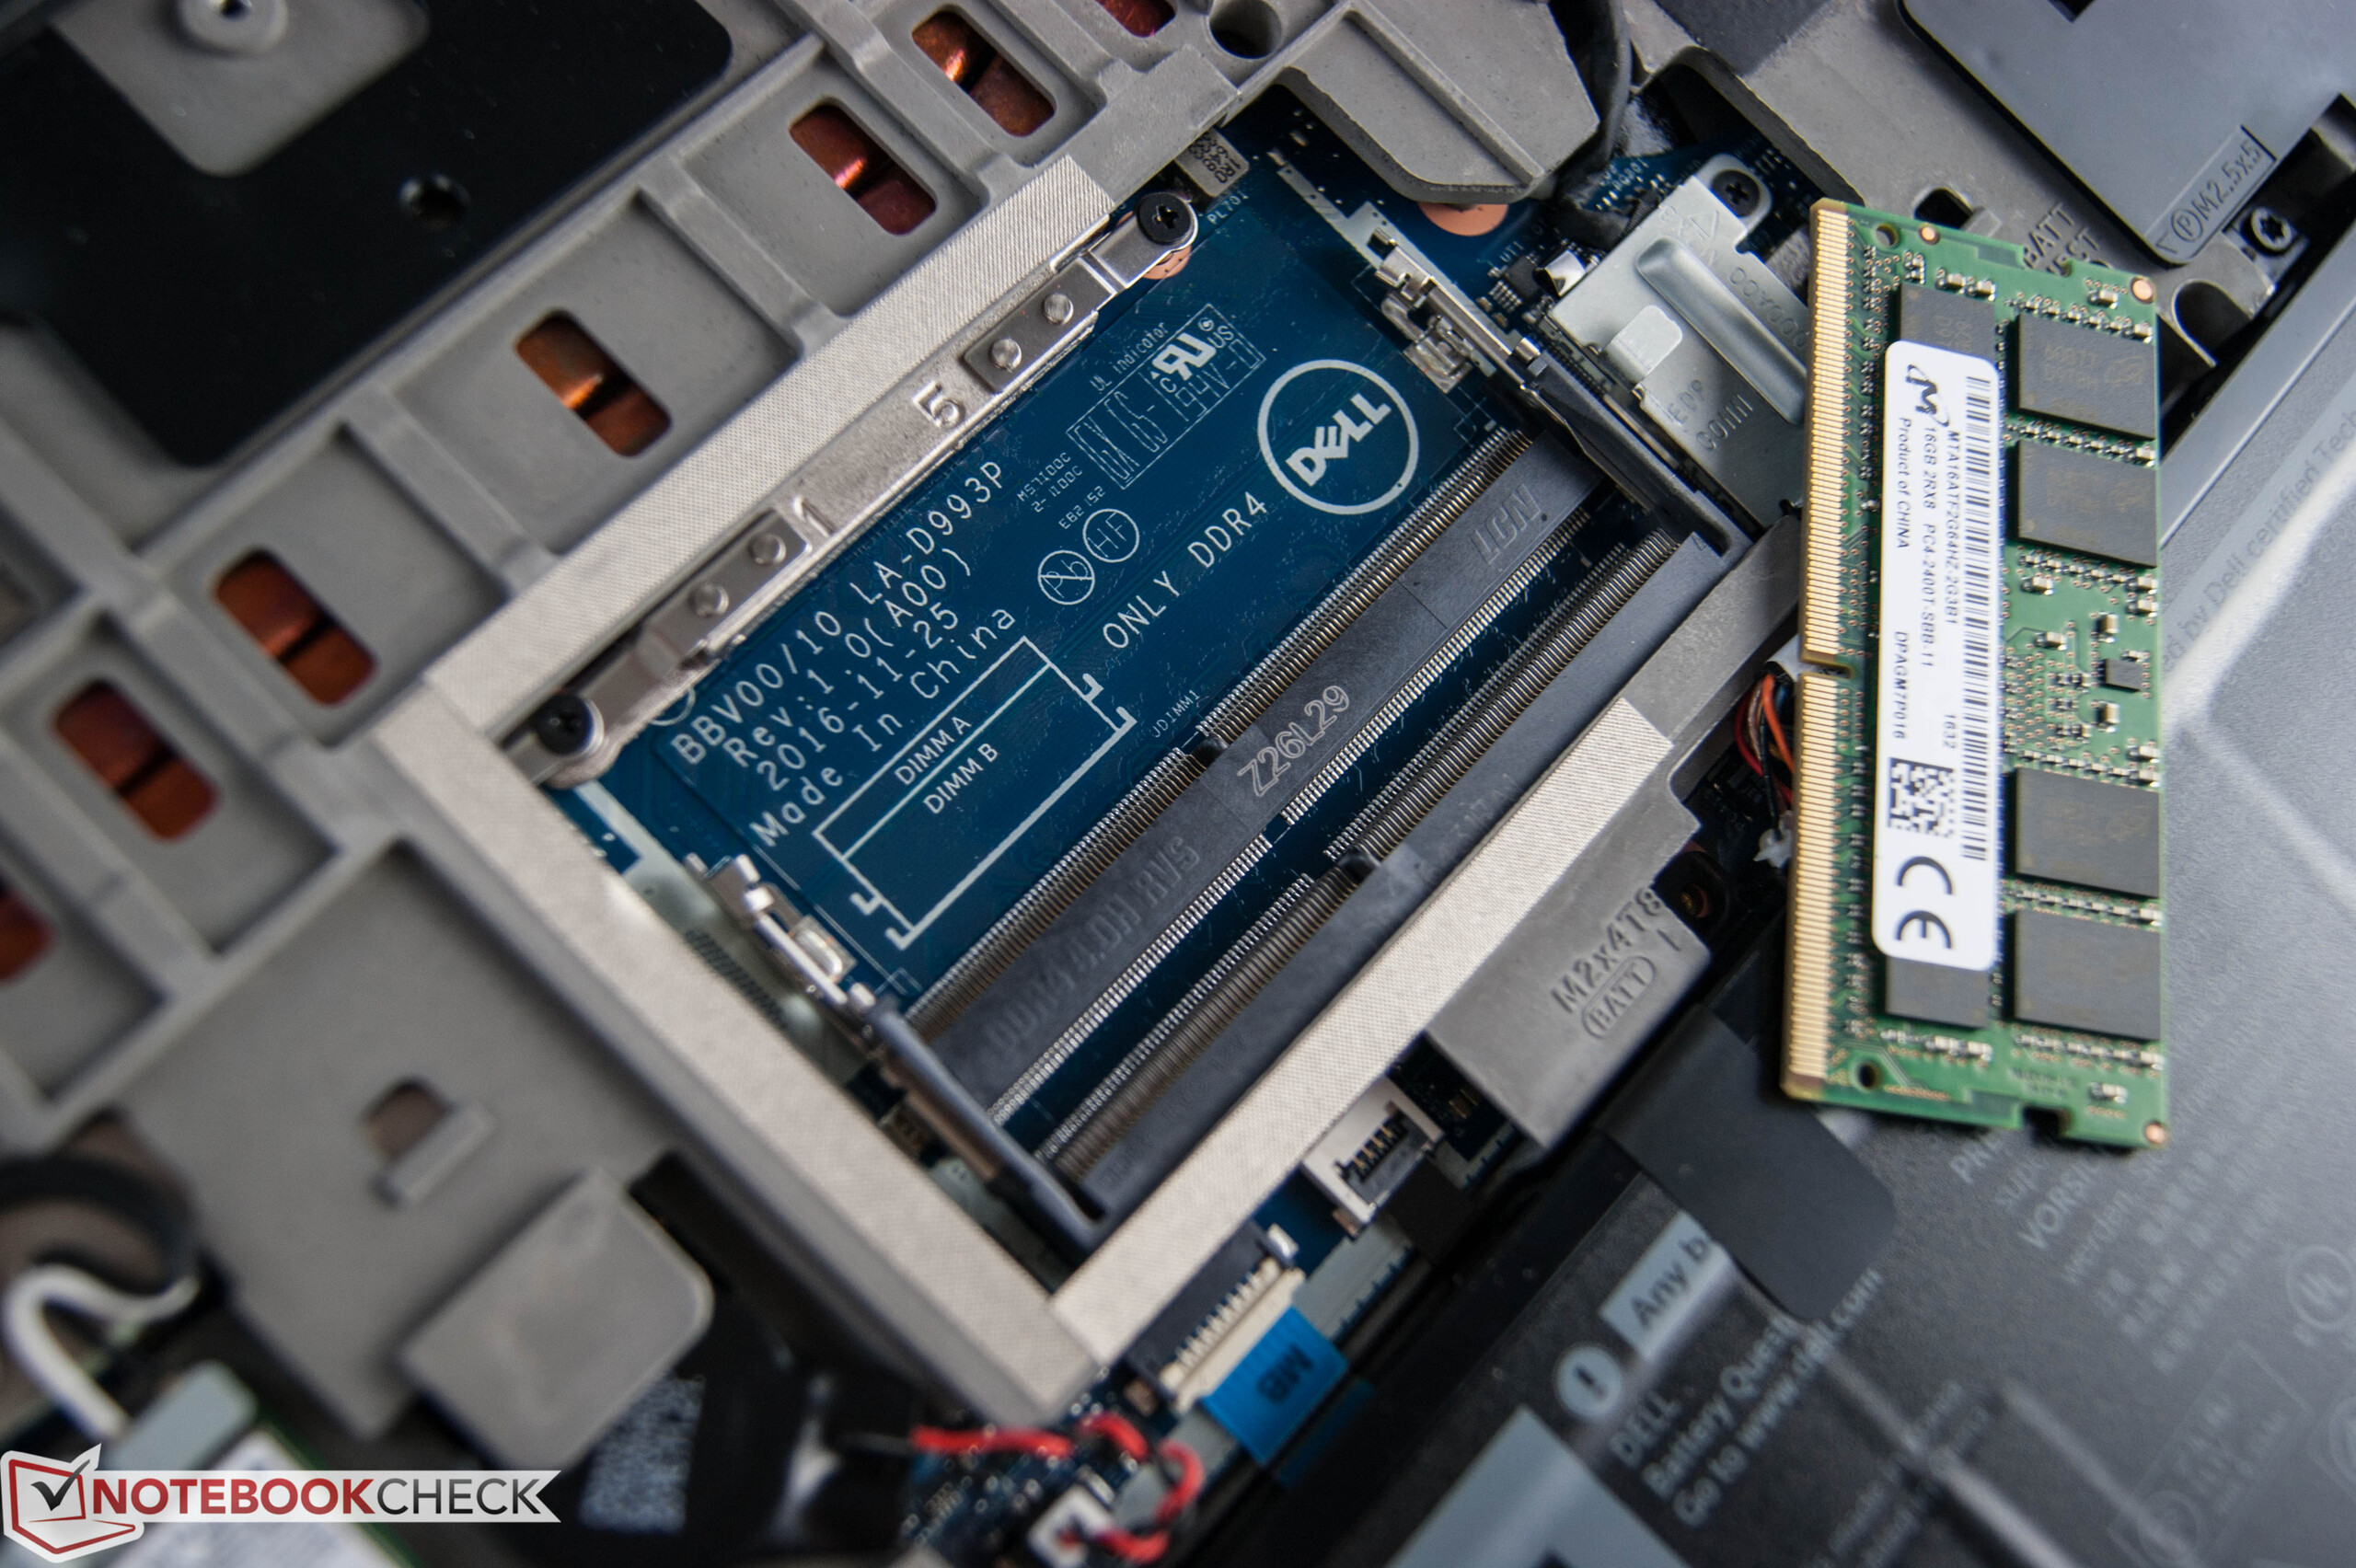
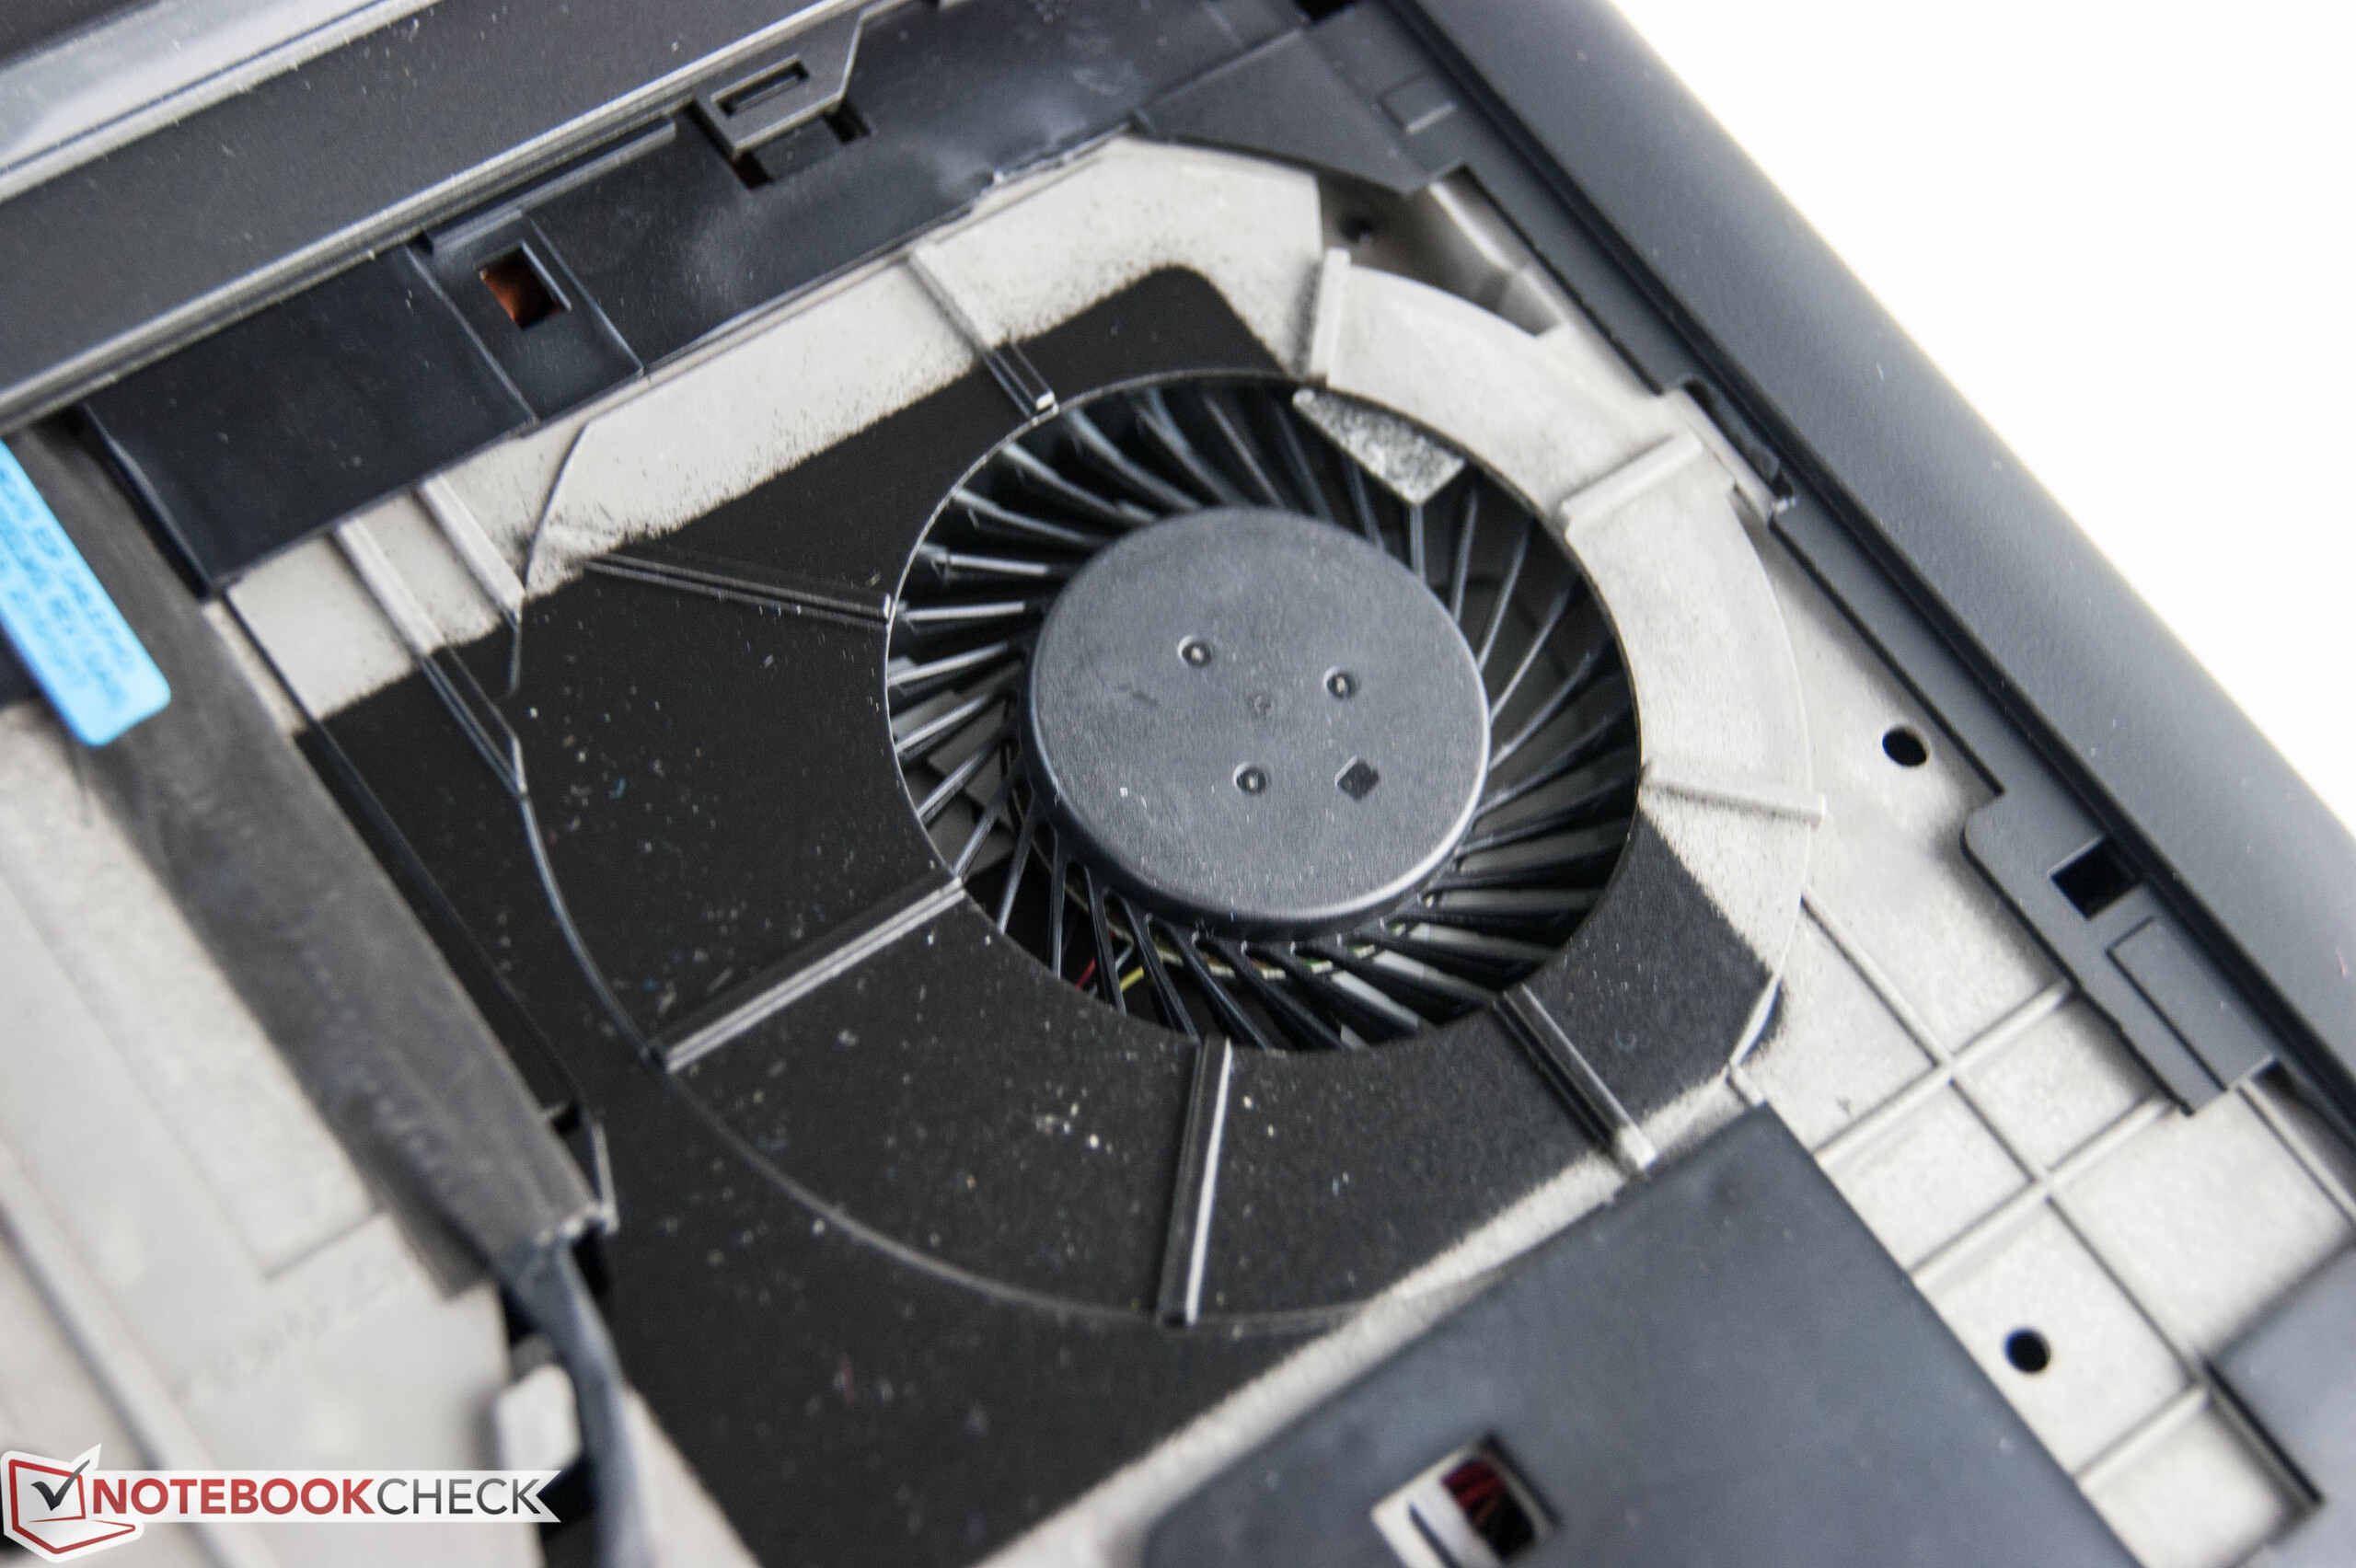
A lo largo de las pruebas, el nuevo jugón de Dell puede mostrar su fuerza: El procesador Intel Core i7 y la Nvidia GeForce GTX 1050 Ti se combinan con un veloz SSD y 16 GB de RAM DDR4. A resultas, los rendimientos de sistema y gaming son excelentes. Sin embargo, el Inspiron 15 también rinde muy bien en otros campos de uso además de los juegos. Durante un uso normal, el ventilador apenas se oye y la temperatura permanece dentro de lo aceptable en todos los escenarios. Aunque un portátil gaming raramente se usará como compañero móvil debido a su altura y peso, su aguante de batería lo hace adecuado para el uso móvil. Nuestro modelo de pruebas muestra más aguante que varios subportátiles móviles.
Dell ofrece un portátil gaming superior por un precio a partir de 1000 Euros, que no tiene que temer ni de competidores más caros.
A los que el display les eche para atrás deberían plantearse la versión UHD más cara. Está por verse si los modelos alemanes del Inspiron 15 usarán paneles IPS. No obstante, los competidores no deben olvidarse. Los que quieran aún más rendimiento gaming y un panel IPS deberían echarle un vistazo al Asus ROG Strix GL502VM.
Ésta es una versión acortada del análisis original. Puedes leer el análisis completo en inglés aquí.
Dell Inspiron 15 7000 7567
- 02/07/2017 v6 (old)
Nino Ricchizzi