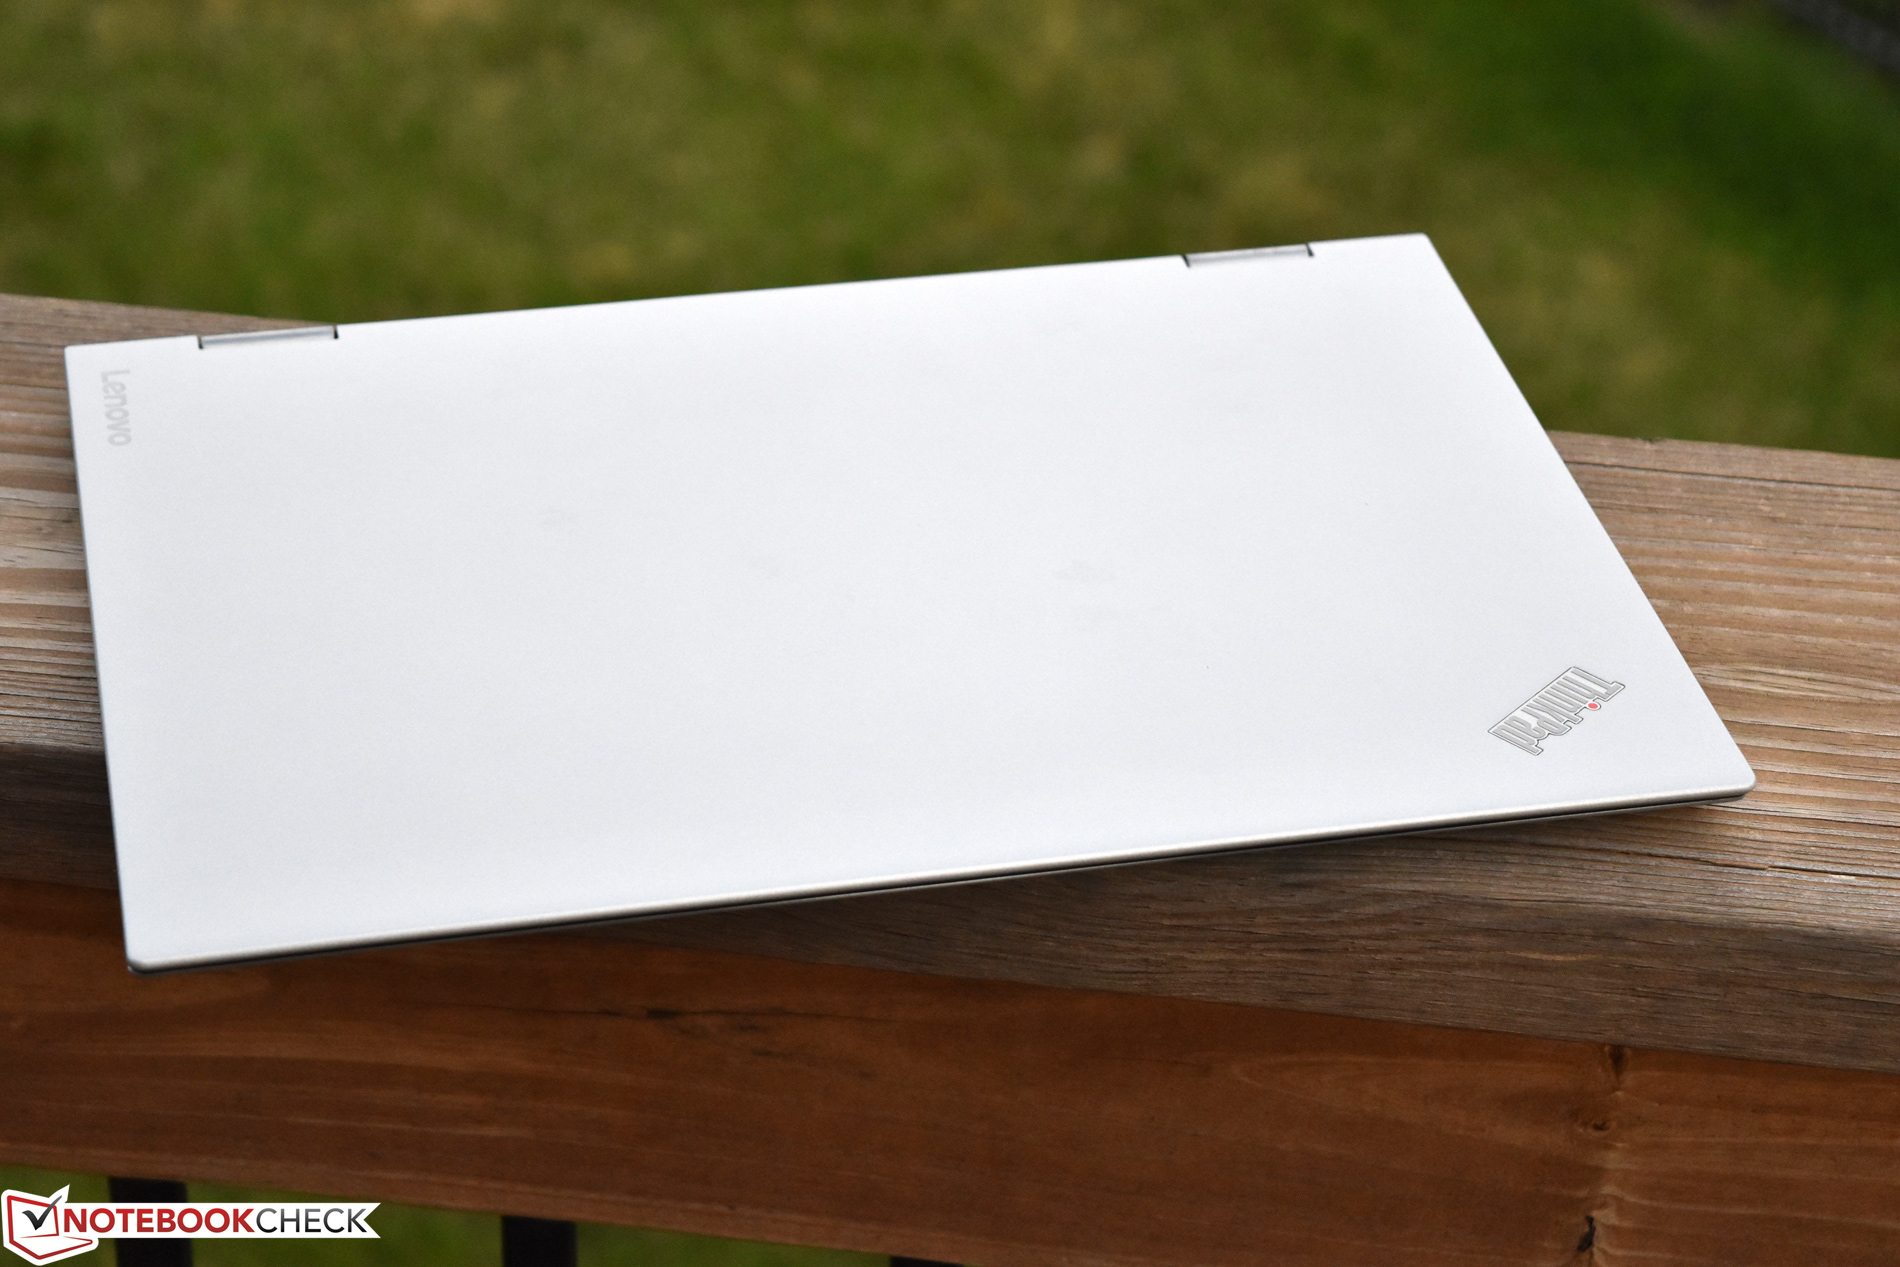
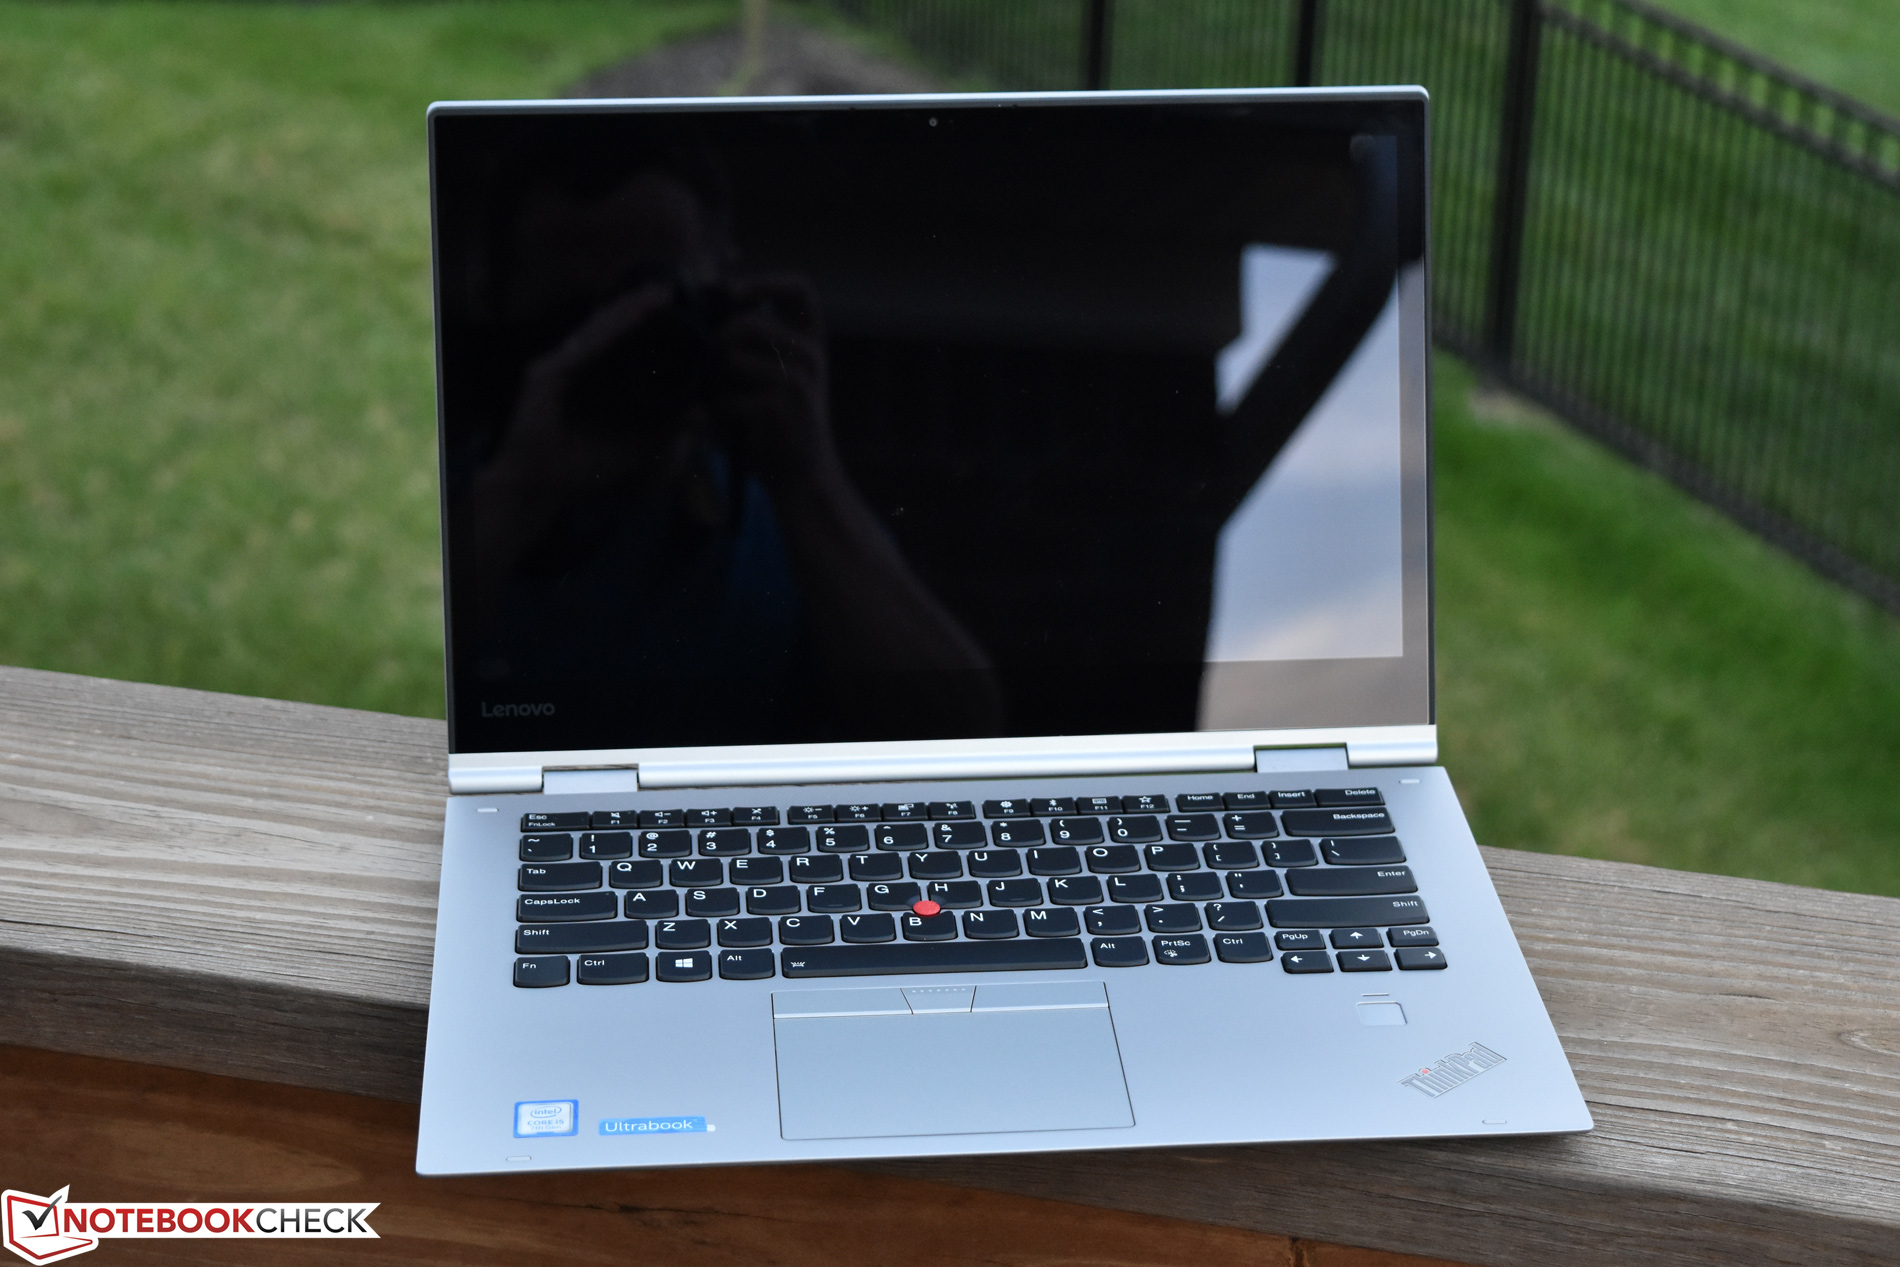
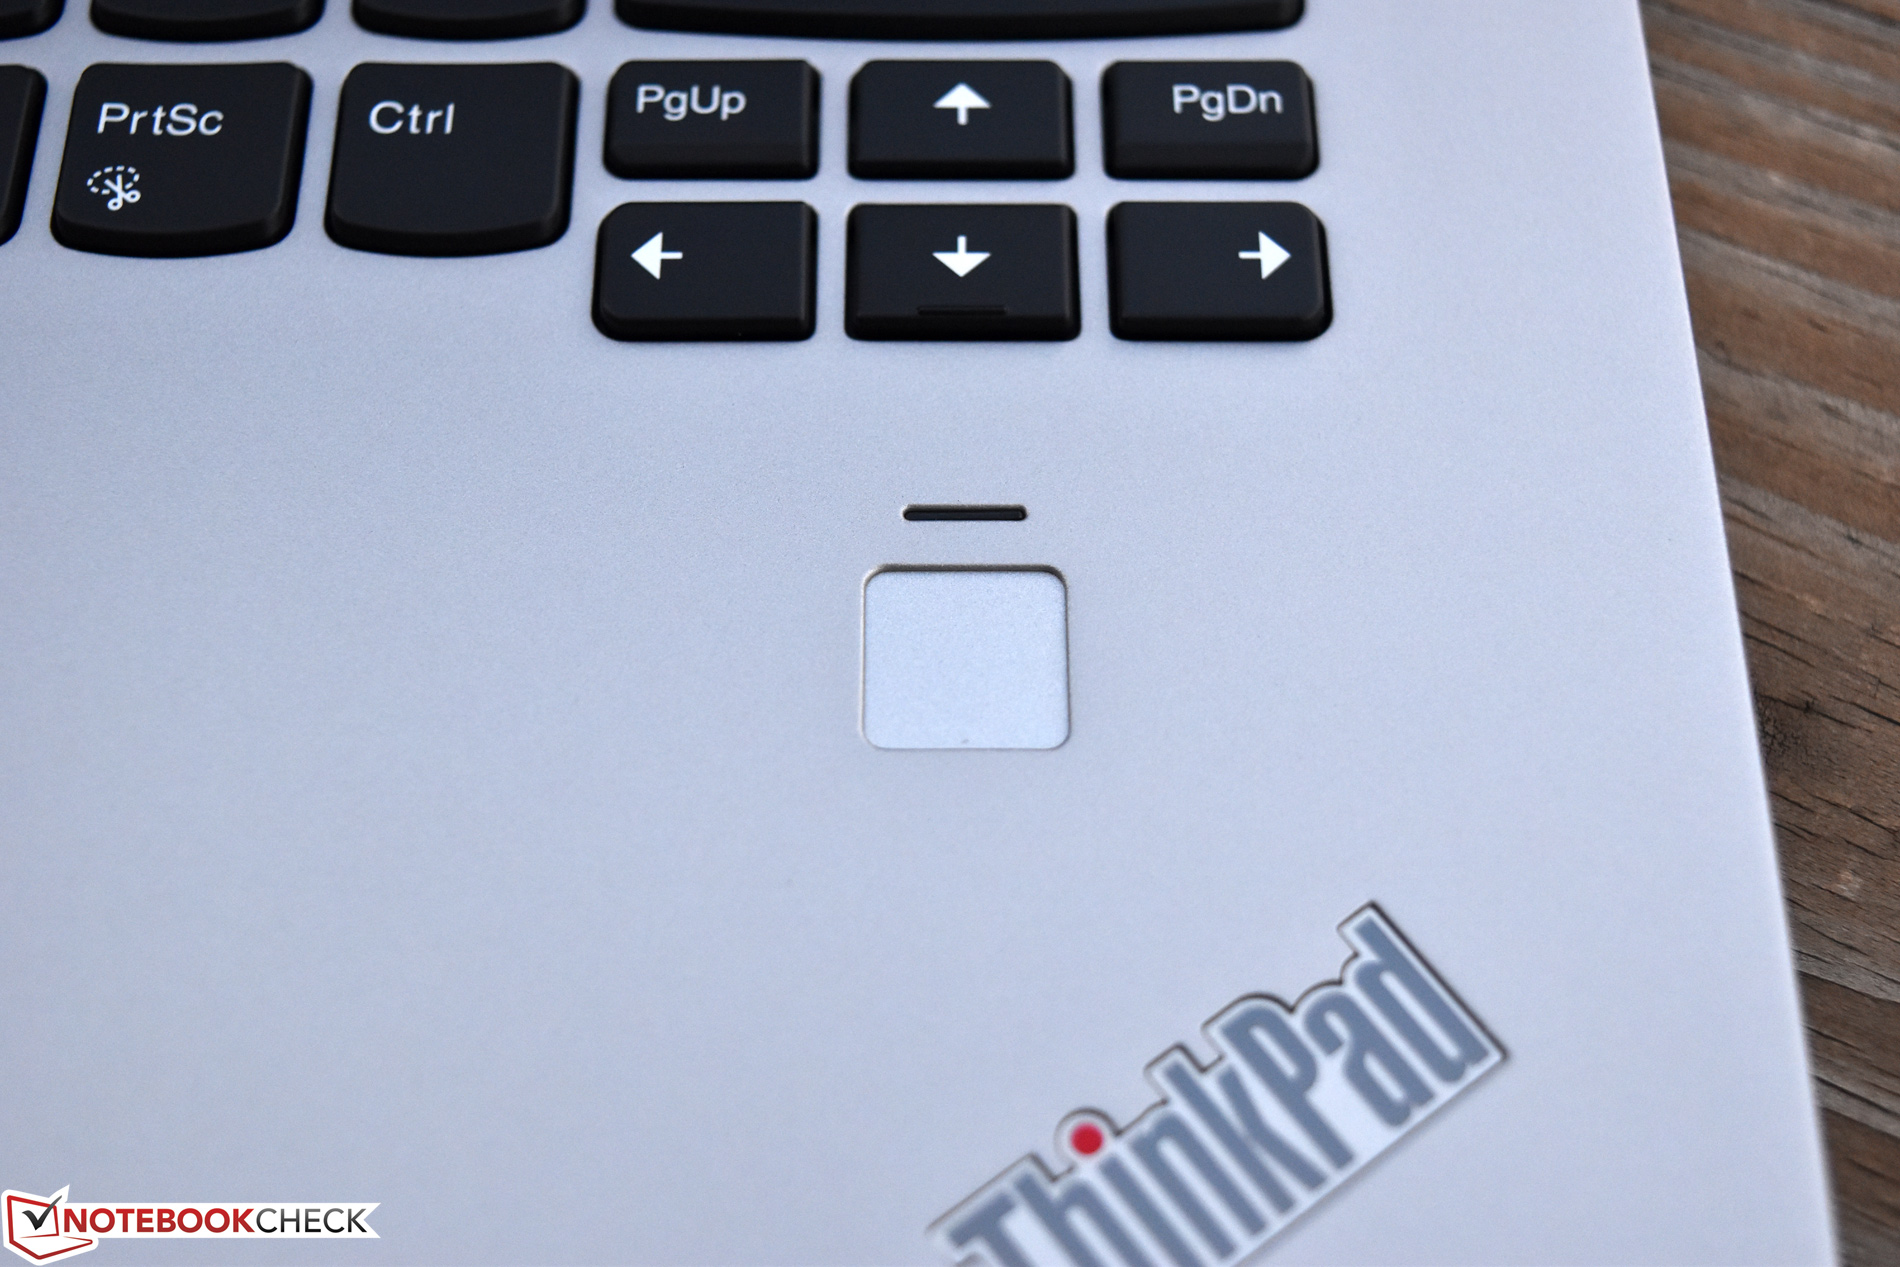
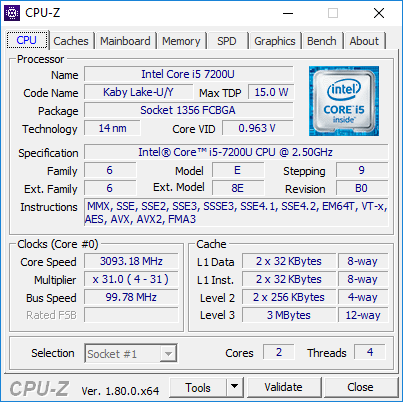
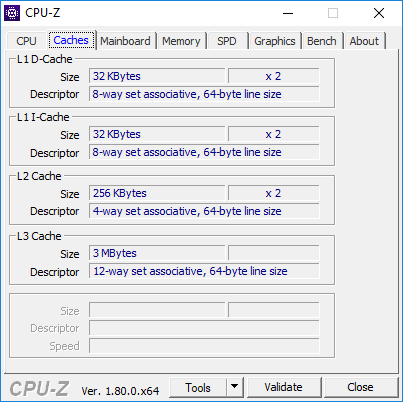
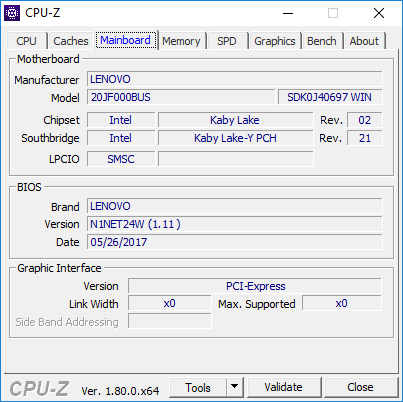
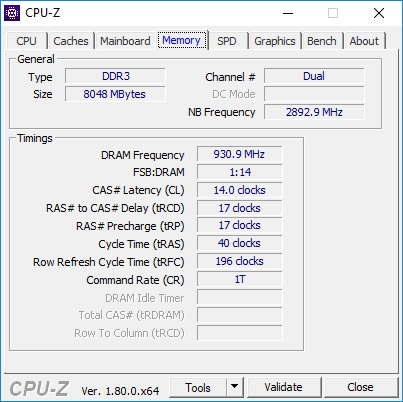
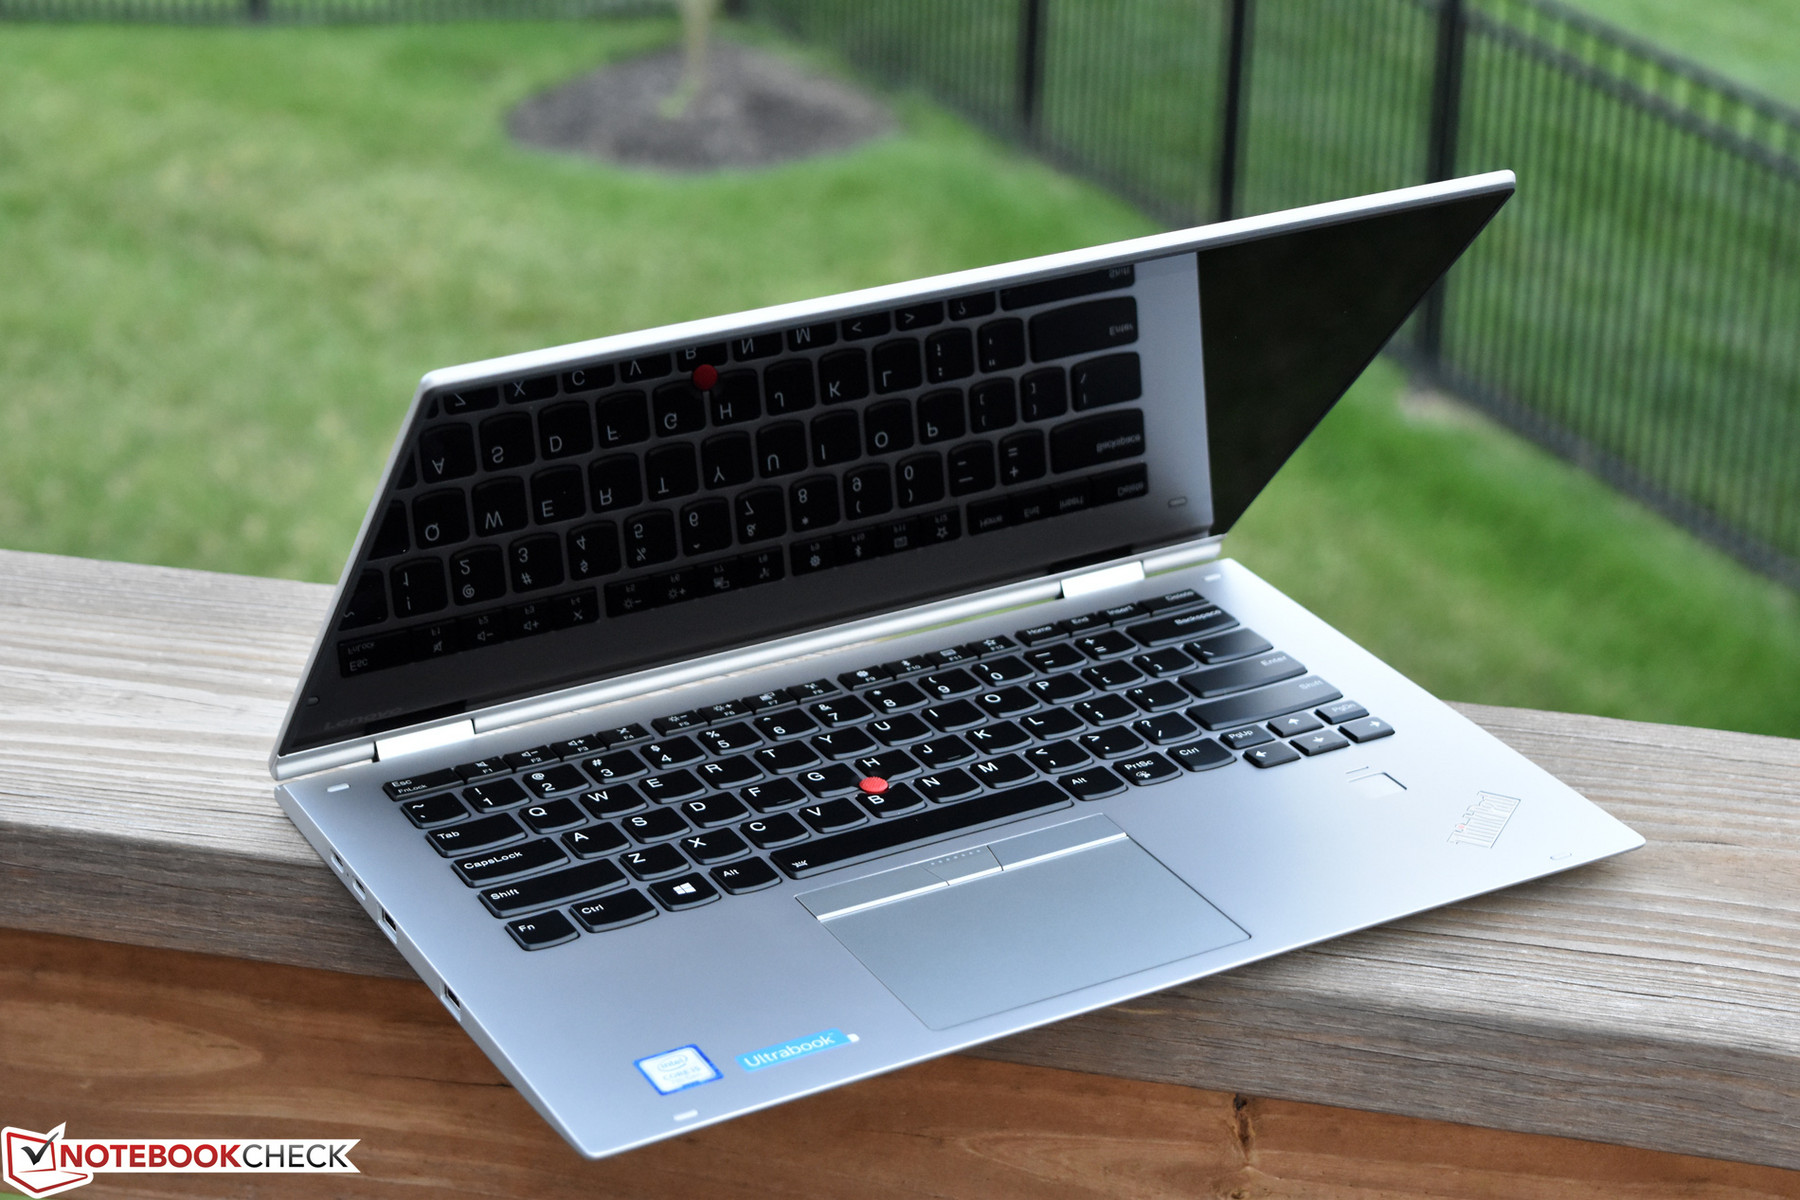
Breve análisis del convertible Lenovo ThinkPad X1 Yoga 2017 20JD0015US (i5-7200U, FHD)


| |||||||||||||||||||||||||
iluminación: 83 %
Brillo con batería: 336.5 cd/m²
Contraste: 1346:1 (Negro: 0.25 cd/m²)
ΔE ColorChecker Calman: 4 | ∀{0.5-29.43 Ø4.72}
ΔE Greyscale Calman: 2.9 | ∀{0.09-98 Ø4.97}
58.8% sRGB (Argyll 1.6.3 3D)
37.4% AdobeRGB 1998 (Argyll 1.6.3 3D)
58.9% AdobeRGB 1998 (Argyll 3D)
84.4% sRGB (Argyll 3D)
57.9% Display P3 (Argyll 3D)
Gamma: 2.22
CCT: 6487 K
| Lenovo ThinkPad X1 Yoga 2017 20JD0015US B140HAN03.6, IPS, 14", 1920x1080 | Lenovo ThinkPad X1 Yoga 2017 20JES03T00 LEN4140, OLED, 14", 2560x1440 | Dell Latitude 12 5285 2-in-1 BOE06DC, IPS, 12.3", 1920x1280 | Toshiba Portege X20W-D-10R Toshiba TOS508F, IPS, 12.5", 1920x1080 | HP EliteBook x360 1030 G2 CMN1374, IPS, 13.3", 1920x1080 | |
|---|---|---|---|---|---|
| Display | 10% | 18% | 9% | ||
| Display P3 Coverage (%) | 57.9 | 62.8 8% | 68.7 19% | 65.5 13% | |
| sRGB Coverage (%) | 84.4 | 94 11% | 96.8 15% | 88.8 5% | |
| AdobeRGB 1998 Coverage (%) | 58.9 | 64.7 10% | 70.4 20% | 64.9 10% | |
| Response Times | 91% | 4% | -36% | -4% | |
| Response Time Grey 50% / Grey 80% * (ms) | 45.6 ? | 3.6 ? 92% | 42.4 ? 7% | 67 ? -47% | 55.2 ? -21% |
| Response Time Black / White * (ms) | 31.2 ? | 3.2 ? 90% | 30.8 ? 1% | 39 ? -25% | 27.2 ? 13% |
| PWM Frequency (Hz) | 240.4 ? | 210.1 ? | |||
| Screen | 8% | 7% | -2% | -14% | |
| Brightness middle (cd/m²) | 336.5 | 243 -28% | 523.2 55% | 442 31% | 262 -22% |
| Brightness (cd/m²) | 305 | 240 -21% | 522 71% | 410 34% | 256 -16% |
| Brightness Distribution (%) | 83 | 95 14% | 88 6% | 86 4% | 83 0% |
| Black Level * (cd/m²) | 0.25 | 0.42 -68% | 0.22 12% | 0.25 -0% | |
| Contrast (:1) | 1346 | 1246 -7% | 2009 49% | 1048 -22% | |
| Colorchecker dE 2000 * | 4 | 5.3 -33% | 4 -0% | 5.22 -31% | 5.13 -28% |
| Colorchecker dE 2000 max. * | 6.5 | 8.9 -37% | 8.6 -32% | 11.84 -82% | 9.46 -46% |
| Greyscale dE 2000 * | 2.9 | 3.7 -28% | 5.5 -90% | 7.88 -172% | 6.23 -115% |
| Gamma | 2.22 99% | 1.78 124% | 2.16 102% | 2.51 88% | 2.45 90% |
| CCT | 6487 100% | 6202 105% | 7546 86% | 6756 96% | 6413 101% |
| Color Space (Percent of AdobeRGB 1998) (%) | 37.4 | 84.8 127% | 64.86 73% | 64 71% | 57.84 55% |
| Color Space (Percent of sRGB) (%) | 58.8 | 100 70% | 93.97 60% | 97 65% | 88.57 51% |
| Media total (Programa/Opciones) | 50% /
25% | 7% /
7% | -7% /
-2% | -3% /
-8% |
* ... más pequeño es mejor
Tiempos de respuesta del display
| ↔ Tiempo de respuesta de Negro a Blanco | ||
|---|---|---|
| 31.2 ms ... subida ↗ y bajada ↘ combinada | ↗ 18 ms subida | 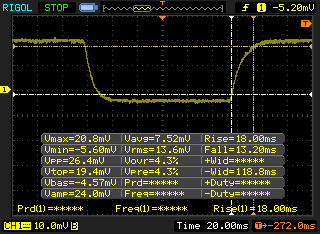 |
| ↘ 13.2 ms bajada | ||
| La pantalla mostró tiempos de respuesta lentos en nuestros tests y podría ser demasiado lenta para los jugones. En comparación, todos los dispositivos de prueba van de ##min### (mínimo) a 240 (máximo) ms. » 84 % de todos los dispositivos son mejores. Eso quiere decir que el tiempo de respuesta es peor que la media (19.8 ms) de todos los dispositivos testados. | ||
| ↔ Tiempo de respuesta 50% Gris a 80% Gris | ||
| 45.6 ms ... subida ↗ y bajada ↘ combinada | ↗ 22.4 ms subida | 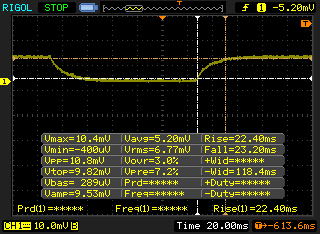 |
| ↘ 23.2 ms bajada | ||
| La pantalla mostró tiempos de respuesta lentos en nuestros tests y podría ser demasiado lenta para los jugones. En comparación, todos los dispositivos de prueba van de ##min### (mínimo) a 636 (máximo) ms. » 78 % de todos los dispositivos son mejores. Eso quiere decir que el tiempo de respuesta es peor que la media (31 ms) de todos los dispositivos testados. | ||
Parpadeo de Pantalla / PWM (Pulse-Width Modulation)
| Parpadeo de Pantalla / PWM no detectado | 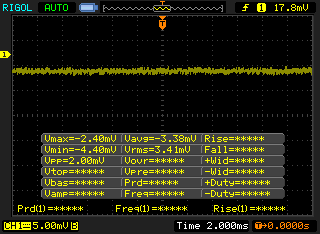 | ||
Comparación: 52 % de todos los dispositivos testados no usaron PWM para atenuar el display. Si se usó, medimos una media de 7763 (mínimo: 5 - máxmo: 343500) Hz. | |||
| wPrime 2.10 - 1024m | |
| Dell Latitude 12 5285 2-in-1 | |
| Lenovo ThinkPad X1 Yoga 2017 20JD0015US | |
* ... más pequeño es mejor
| PCMark 8 Home Score Accelerated v2 | 3817 puntos | |
| PCMark 8 Creative Score Accelerated v2 | 4599 puntos | |
| PCMark 8 Work Score Accelerated v2 | 4687 puntos | |
| PCMark 10 Score | 3311 puntos | |
ayuda | ||
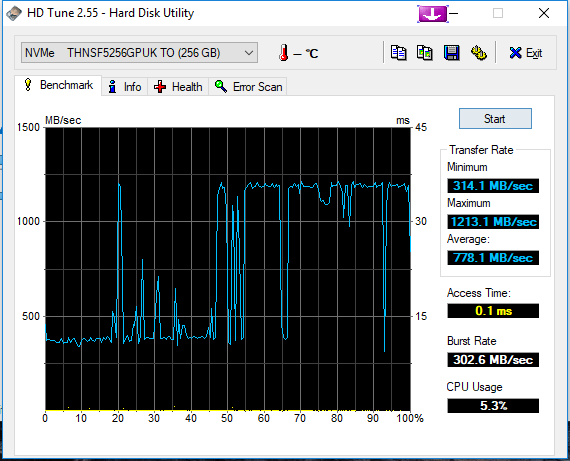
| Lenovo ThinkPad X1 Yoga 2017 20JD0015US Toshiba THNSF5256GPUK | Lenovo ThinkPad X1 Yoga 2017 20JES03T00 Samsung SSD PM961 1TB M.2 PCIe 3.0 x4 NVMe (MZVLW1T0) | Dell Latitude 12 5285 2-in-1 Samsung PM961 MZVLW256HEHP | Toshiba Portege X20W-D-10R Toshiba SG5 THNSNK512GVN8 | HP EliteBook x360 1030 G2 Sandisk SD8TN8U-256G-1006 | |
|---|---|---|---|---|---|
| AS SSD | 221% | 16% | -38% | -47% | |
| Seq Read (MB/s) | 1493 | 2783 86% | 1328 -11% | 485.8 -67% | 486.9 -67% |
| Seq Write (MB/s) | 286.2 | 1734 506% | 223.1 -22% | 243.6 -15% | 201.9 -29% |
| 4K Read (MB/s) | 31.96 | 56.4 76% | 27.6 -14% | 23.06 -28% | 27.37 -14% |
| 4K Write (MB/s) | 91.9 | 158.1 72% | 1.23 -99% | 76.7 -17% | 52.6 -43% |
| 4K-64 Read (MB/s) | 551 | 2140 288% | 1607 192% | 358 -35% | 286.2 -48% |
| 4K-64 Write (MB/s) | 340.4 | 1196 251% | 126.1 -63% | 160.9 -53% | 120.9 -64% |
| Score Read (Points) | 732 | 2475 238% | 1768 142% | 430 -41% | 362 -51% |
| Score Write (Points) | 461 | 1527 231% | 150 -67% | 262 -43% | 194 -58% |
| Score Total (Points) | 1515 | 5215 244% | 2760 82% | 906 -40% | 736 -51% |

| 3DMark | |
| 1280x720 Cloud Gate Standard Graphics | |
| Dell Latitude 12 5285 2-in-1 | |
| Lenovo ThinkPad X1 Yoga 2017 20JD0015US | |
| HP EliteBook x360 1030 G2 | |
| Lenovo ThinkPad X1 Yoga 2017 20JES03T00 | |
| Toshiba Portege X20W-D-10R | |
| 1920x1080 Fire Strike Graphics | |
| Dell Latitude 12 5285 2-in-1 | |
| Lenovo ThinkPad X1 Yoga 2017 20JD0015US | |
| Lenovo ThinkPad X1 Yoga 2017 20JES03T00 | |
| HP EliteBook x360 1030 G2 | |
| 1920x1080 Ice Storm Extreme Graphics | |
| Lenovo ThinkPad X1 Yoga 2017 20JD0015US | |
| HP EliteBook x360 1030 G2 | |
| Dell Latitude 12 5285 2-in-1 | |
| 3DMark 06 Standard Score | 10136 puntos | |
| 3DMark 11 Performance | 1732 puntos | |
| 3DMark Ice Storm Standard Score | 49899 puntos | |
| 3DMark Cloud Gate Standard Score | 6530 puntos | |
| 3DMark Fire Strike Score | 933 puntos | |
| 3DMark Time Spy Score | 374 puntos | |
ayuda | ||
| bajo | medio | alto | ultra | |
|---|---|---|---|---|
| BioShock Infinite (2013) | 61 | 33 | 27 | 8 |
Ruido
| Ocioso |
| 27.9 / 27.9 / 27.9 dB(A) |
| Carga |
| 33.6 / 33.6 dB(A) |
 | ||
30 dB silencioso 40 dB(A) audible 50 dB(A) ruidosamente alto |
||
min: | ||
| Lenovo ThinkPad X1 Yoga 2017 20JD0015US HD Graphics 620, i5-7200U, Toshiba THNSF5256GPUK | Lenovo ThinkPad X1 Yoga 2017 20JES03T00 HD Graphics 620, i7-7600U, Samsung SSD PM961 1TB M.2 PCIe 3.0 x4 NVMe (MZVLW1T0) | Dell Latitude 12 5285 2-in-1 HD Graphics 620, i7-7600U, Samsung PM961 MZVLW256HEHP | Toshiba Portege X20W-D-10R HD Graphics 620, i7-7600U, Toshiba SG5 THNSNK512GVN8 | HP EliteBook x360 1030 G2 HD Graphics 620, i5-7300U, Sandisk SD8TN8U-256G-1006 | |
|---|---|---|---|---|---|
| Noise | -9% | 1% | -4% | -4% | |
| apagado / medio ambiente * (dB) | 27.9 | 29.3 -5% | 28.2 -1% | 30.4 -9% | 29 -4% |
| Idle Minimum * (dB) | 27.9 | 29.3 -5% | 28.2 -1% | 30.5 -9% | 29 -4% |
| Idle Average * (dB) | 27.9 | 31.1 -11% | 28.2 -1% | 30.5 -9% | 29 -4% |
| Idle Maximum * (dB) | 27.9 | 33.3 -19% | 28.2 -1% | 30.5 -9% | 29 -4% |
| Load Average * (dB) | 33.6 | 33.3 1% | 30.4 10% | 31.2 7% | 33.6 -0% |
| Load Maximum * (dB) | 33.6 | 38.9 -16% | 34 -1% | 31.3 7% | 35.8 -7% |
* ... más pequeño es mejor
(-) La temperatura máxima en la parte superior es de 45.4 °C / 114 F, frente a la media de 35.4 °C / 96 F, que oscila entre 19.6 y 60 °C para la clase Convertible.
(±) El fondo se calienta hasta un máximo de 40 °C / 104 F, frente a la media de 36.9 °C / 98 F
(+) En reposo, la temperatura media de la parte superior es de 27.2 °C / 81# F, frente a la media del dispositivo de 30.3 °C / 87 F.
(+) El reposamanos y el panel táctil están a una temperatura inferior a la de la piel, con un máximo de 26.8 °C / 80.2 F y, por tanto, son fríos al tacto.
(±) La temperatura media de la zona del reposamanos de dispositivos similares fue de 28 °C / 82.4 F (+1.2 °C / 2.2 F).
Lenovo ThinkPad X1 Yoga 2017 20JD0015US análisis de audio
(±) | la sonoridad del altavoz es media pero buena (73.2 dB)
Graves 100 - 315 Hz
(-) | casi sin bajos - de media 16.8% inferior a la mediana
(±) | la linealidad de los graves es media (11.5% delta a frecuencia anterior)
Medios 400 - 2000 Hz
(+) | medios equilibrados - a sólo 2.6% de la mediana
(±) | la linealidad de los medios es media (11.6% delta respecto a la frecuencia anterior)
Altos 2 - 16 kHz
(+) | máximos equilibrados - a sólo 4.1% de la mediana
(-) | los máximos no son lineales (15.1% delta a la frecuencia anterior)
Total 100 - 16.000 Hz
(±) | la linealidad del sonido global es media (25.5% de diferencia con la mediana)
En comparación con la misma clase
» 78% de todos los dispositivos probados de esta clase eran mejores, 5% similares, 17% peores
» El mejor tuvo un delta de 6%, la media fue 20%, el peor fue ###max##%
En comparación con todos los dispositivos probados
» 78% de todos los dispositivos probados eran mejores, 4% similares, 17% peores
» El mejor tuvo un delta de 4%, la media fue 24%, el peor fue ###max##%
Toshiba Portege X20W-D-10R análisis de audio
(-) | altavoces no muy altos (#64 dB)
Graves 100 - 315 Hz
(-) | casi sin bajos - de media 24.3% inferior a la mediana
(±) | la linealidad de los graves es media (11.3% delta a frecuencia anterior)
Medios 400 - 2000 Hz
(+) | medios equilibrados - a sólo 3.5% de la mediana
(±) | la linealidad de los medios es media (7.9% delta respecto a la frecuencia anterior)
Altos 2 - 16 kHz
(+) | máximos equilibrados - a sólo 4.8% de la mediana
(+) | los máximos son lineales (6.2% delta a la frecuencia anterior)
Total 100 - 16.000 Hz
(±) | la linealidad del sonido global es media (27% de diferencia con la mediana)
En comparación con la misma clase
» 83% de todos los dispositivos probados de esta clase eran mejores, 3% similares, 14% peores
» El mejor tuvo un delta de 6%, la media fue 20%, el peor fue ###max##%
En comparación con todos los dispositivos probados
» 83% de todos los dispositivos probados eran mejores, 4% similares, 14% peores
» El mejor tuvo un delta de 4%, la media fue 24%, el peor fue ###max##%
| Off / Standby | |
| Ocioso | |
| Carga |
|
Clave:
min: | |
| Lenovo ThinkPad X1 Yoga 2017 20JD0015US i5-7200U, HD Graphics 620, Toshiba THNSF5256GPUK, IPS, 1920x1080, 14" | Lenovo ThinkPad X1 Yoga 2017 20JES03T00 i7-7600U, HD Graphics 620, Samsung SSD PM961 1TB M.2 PCIe 3.0 x4 NVMe (MZVLW1T0), OLED, 2560x1440, 14" | Dell Latitude 12 5285 2-in-1 i7-7600U, HD Graphics 620, Samsung PM961 MZVLW256HEHP, IPS, 1920x1280, 12.3" | Toshiba Portege X20W-D-10R i7-7600U, HD Graphics 620, Toshiba SG5 THNSNK512GVN8, IPS, 1920x1080, 12.5" | HP EliteBook x360 1030 G2 i5-7300U, HD Graphics 620, Sandisk SD8TN8U-256G-1006, IPS, 1920x1080, 13.3" | |
|---|---|---|---|---|---|
| Power Consumption | -28% | 8% | 25% | 10% | |
| Idle Minimum * (Watt) | 4.4 | 4.9 -11% | 2.85 35% | 3.4 23% | 3.2 27% |
| Idle Average * (Watt) | 7.4 | 7.6 -3% | 6.76 9% | 5.8 22% | 5.5 26% |
| Idle Maximum * (Watt) | 7.6 | 13.8 -82% | 6.91 9% | 6.7 12% | 6.5 14% |
| Load Average * (Watt) | 31.3 | 33.4 -7% | 32.88 -5% | 21.4 32% | 29.7 5% |
| Load Maximum * (Watt) | 34.4 | 46.5 -35% | 37.41 -9% | 21.6 37% | 41.3 -20% |
* ... más pequeño es mejor
| Lenovo ThinkPad X1 Yoga 2017 20JD0015US i5-7200U, HD Graphics 620, 56 Wh | Lenovo ThinkPad X1 Yoga 2017 20JES03T00 i7-7600U, HD Graphics 620, 56 Wh | Dell Latitude 12 5285 2-in-1 i7-7600U, HD Graphics 620, 42 Wh | Toshiba Portege X20W-D-10R i7-7600U, HD Graphics 620, 44 Wh | HP EliteBook x360 1030 G2 i5-7300U, HD Graphics 620, 57 Wh | |
|---|---|---|---|---|---|
| Duración de Batería | -18% | -2% | 18% | 53% | |
| Reader / Idle (h) | 12.6 | 13.1 4% | 17.9 42% | 16.7 33% | 23.1 83% |
| WiFi v1.3 (h) | 10.8 | 6.1 -44% | 8.1 -25% | 12 11% | 10.5 -3% |
| Load (h) | 2.3 | 2 -13% | 1.8 -22% | 2.5 9% | 4.1 78% |
Pro
Contra
El ThinkPad X1 Yoga no es una máquina barata, sin importar la equipación, con precios por encima de $ 2.000 para la mayoría de las configuraciones (hoy: $ 2.267). Sin embargo, costando más de $ 1,500 menos que nuestro Core i7/OLED análisis, esta unidad probablemente parece mucho más alcanzable para el usuario medio de business. Y eso no es lo único que lo hace potencialmente más atractivo que su compañero WQHD: tampoco hay reducción de rendimiento sostenida por la CPU, es más silencioso, la duración de la batería es considerablemente más larga en la mayoría de los casos y las térmicas están mucho más en línea. Tampoco hay PWM en juego, a diferencia de lo que descubrimos en nuestra unidad de revisión OLED.
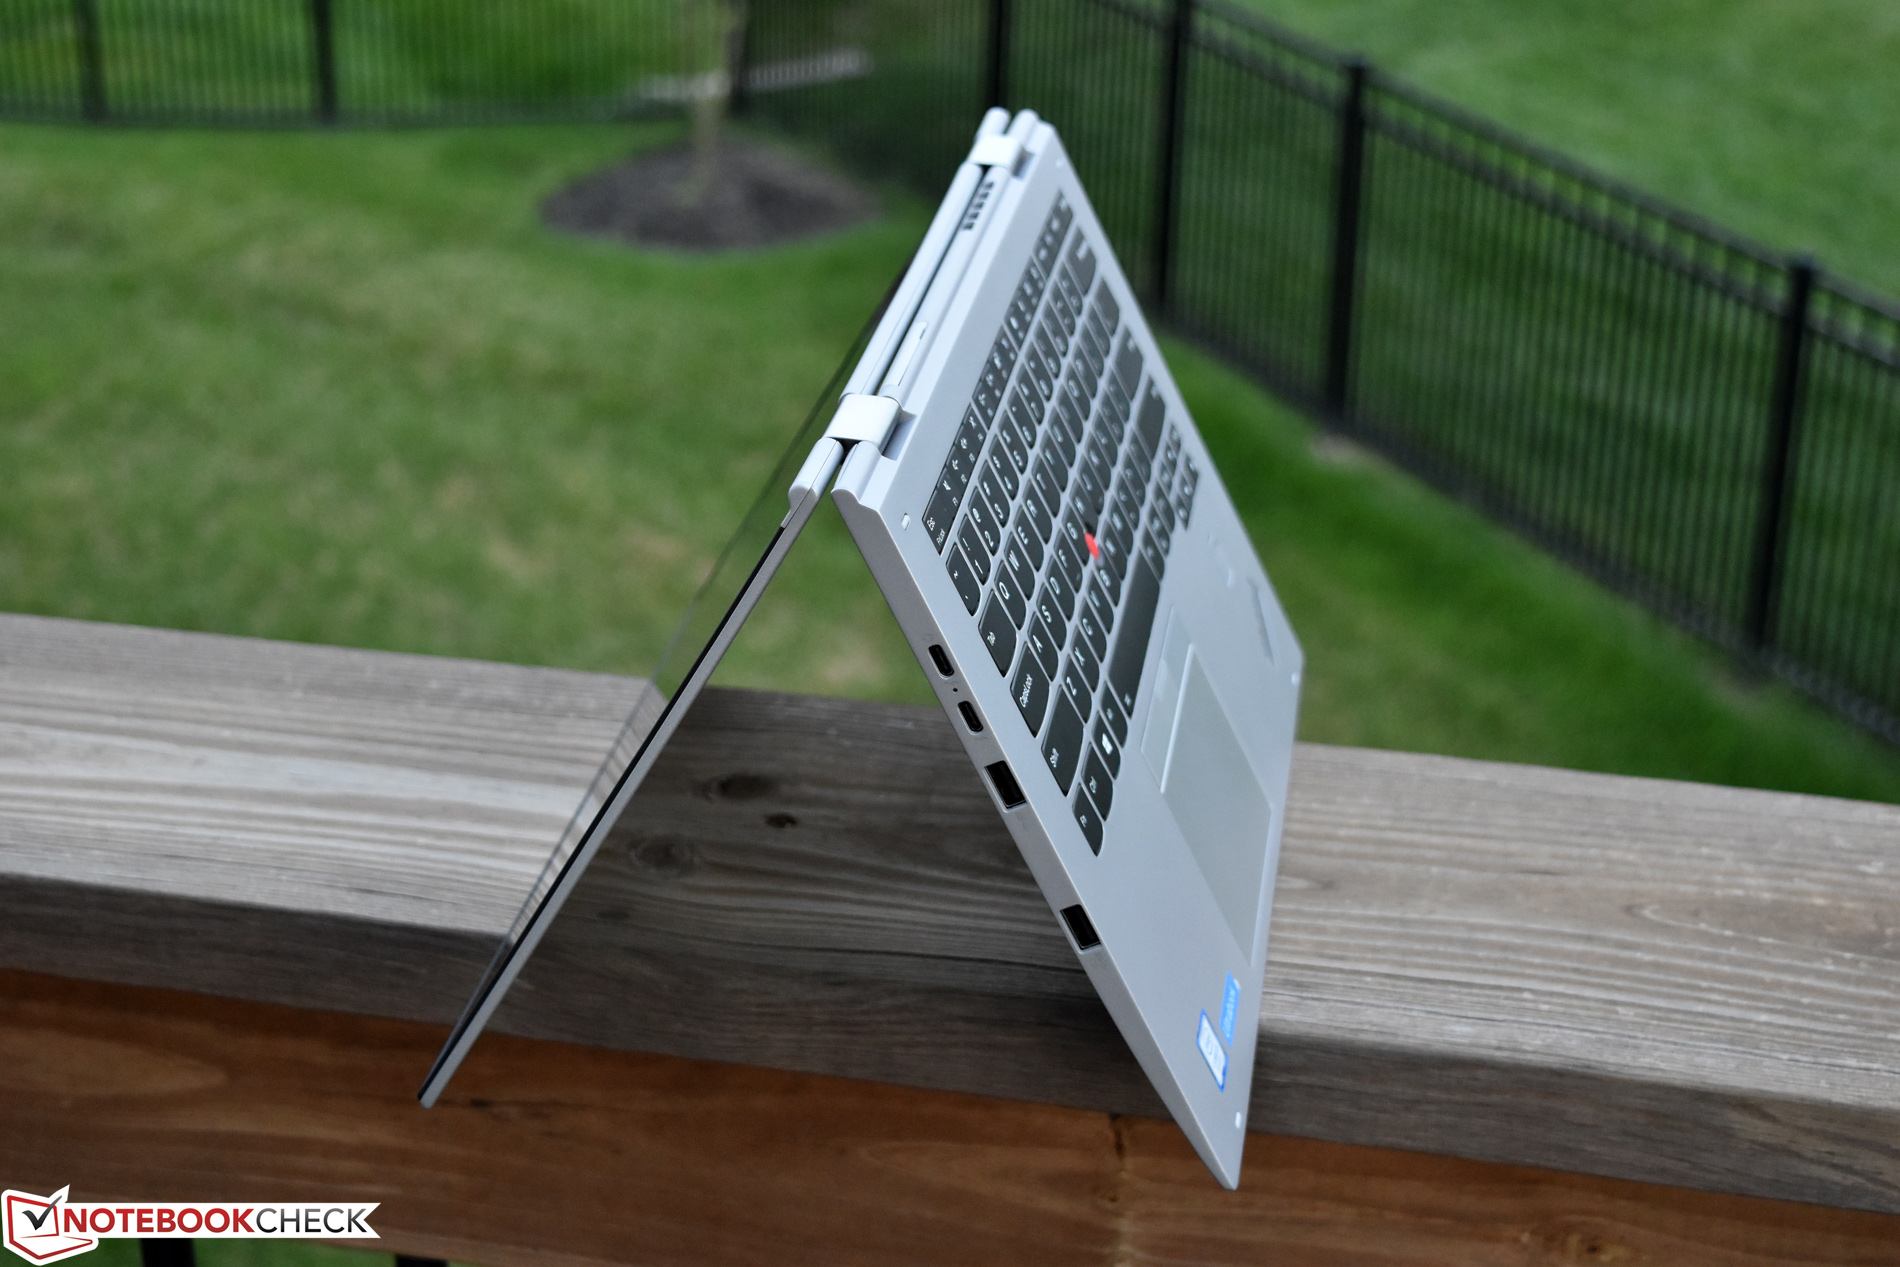
Realmente no hay mucho que esté mal con el ThinkPad X1 Yoga; Si una bisagra de 360 grados convertibles es lo que está buscando, realmente debería estar en su lista.
De hecho, aparte de la falta de resolución OLED y WQHD (esta es Full HD), de CPU ligeramente menos capaz y de SSD más lento, estas son prácticamente la misma máquina. Y debido a eso, no hay realmente tanto mal con el ThinkPad X1 Yoga: es una pieza de tecnología bien hecha, silenciosa, de fría ejecución, ágil, atractiva. Si buscas un convertible con una bisagra de 360 grados, realmente debería estar en su lista.
Ésta es una versión acortada del análisis original. Puedes leer el análisis completo en inglés aquí.
Lenovo ThinkPad X1 Yoga 2017 20JD0015US
- 07/29/2017 v6 (old)
Steve Schardein
Price comparison
