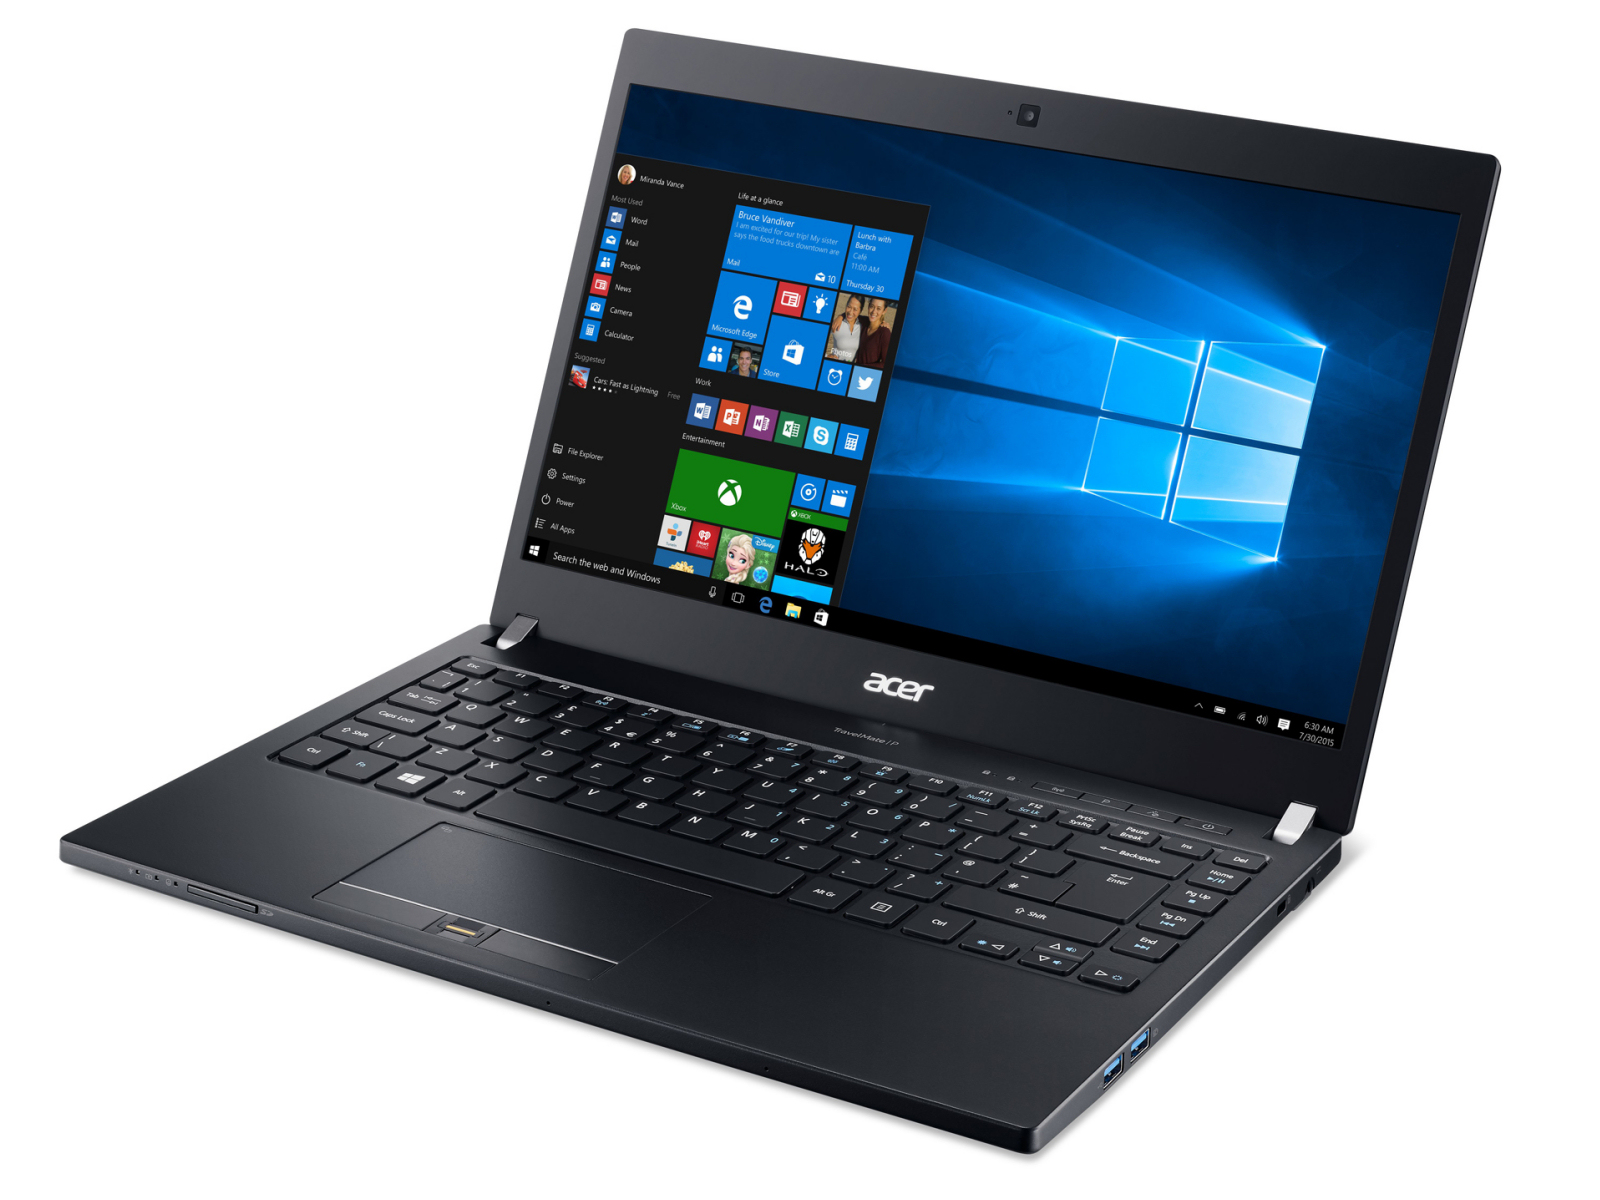
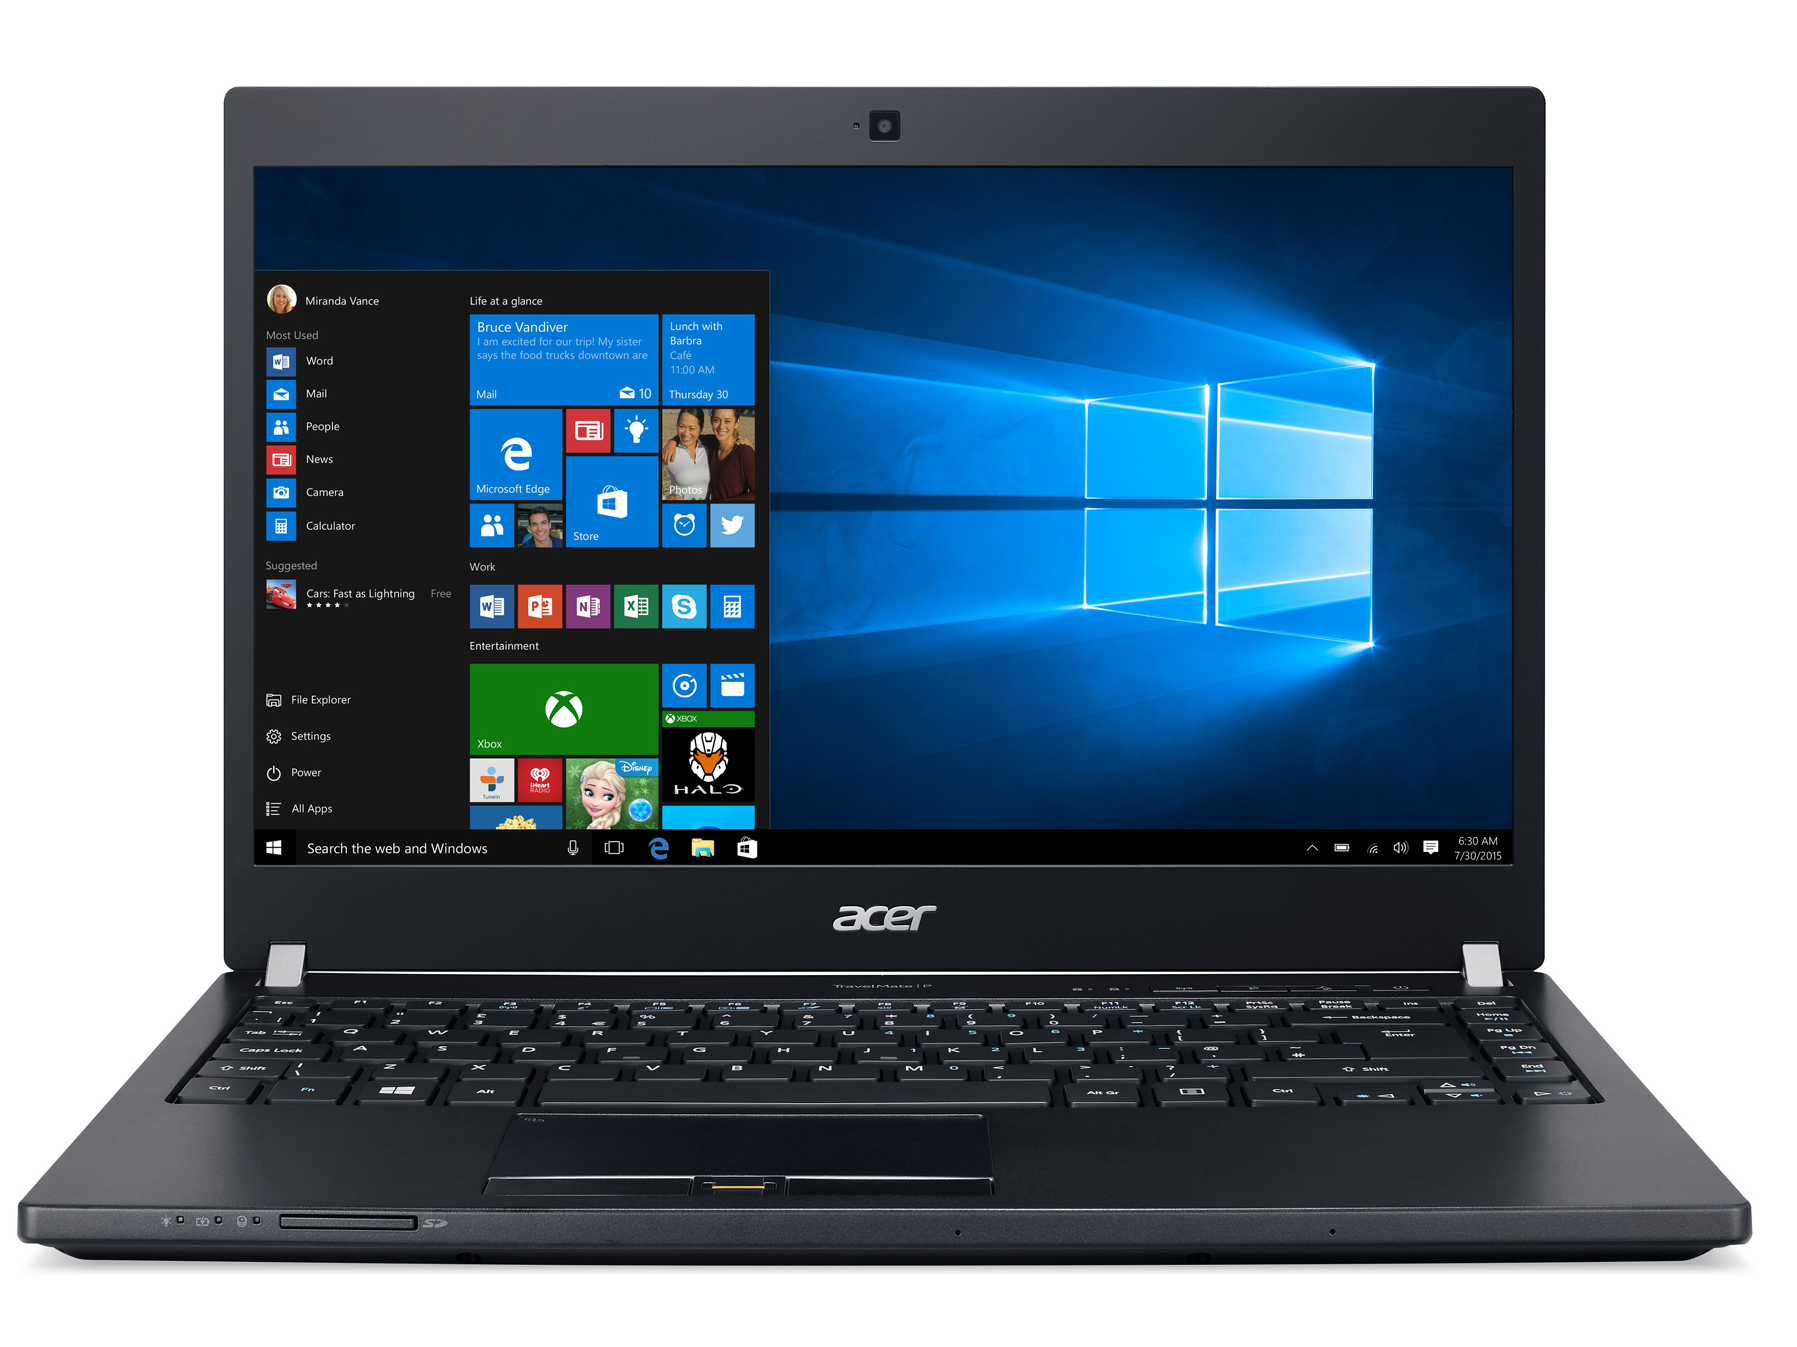
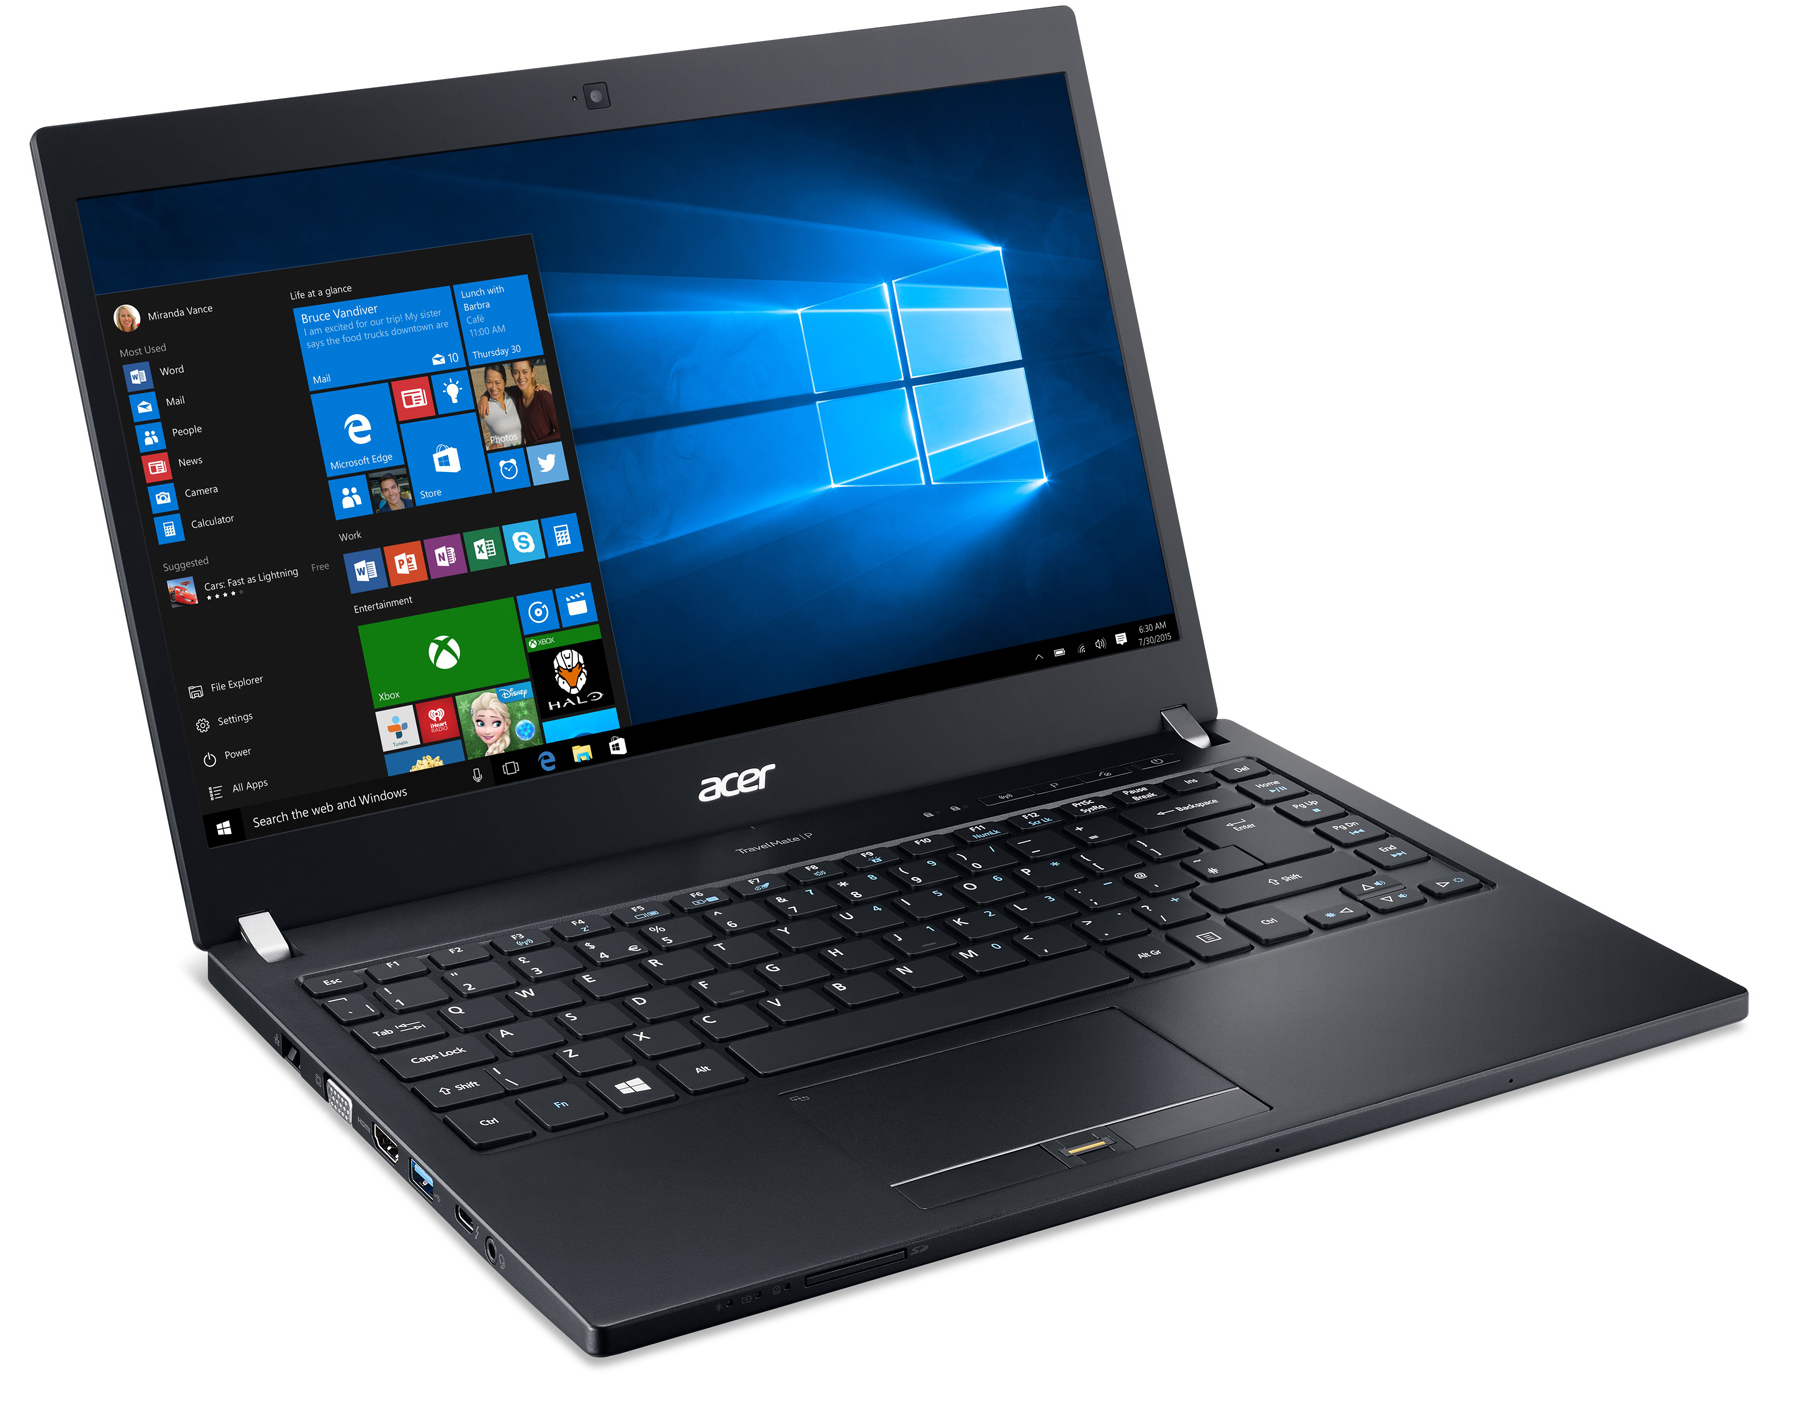
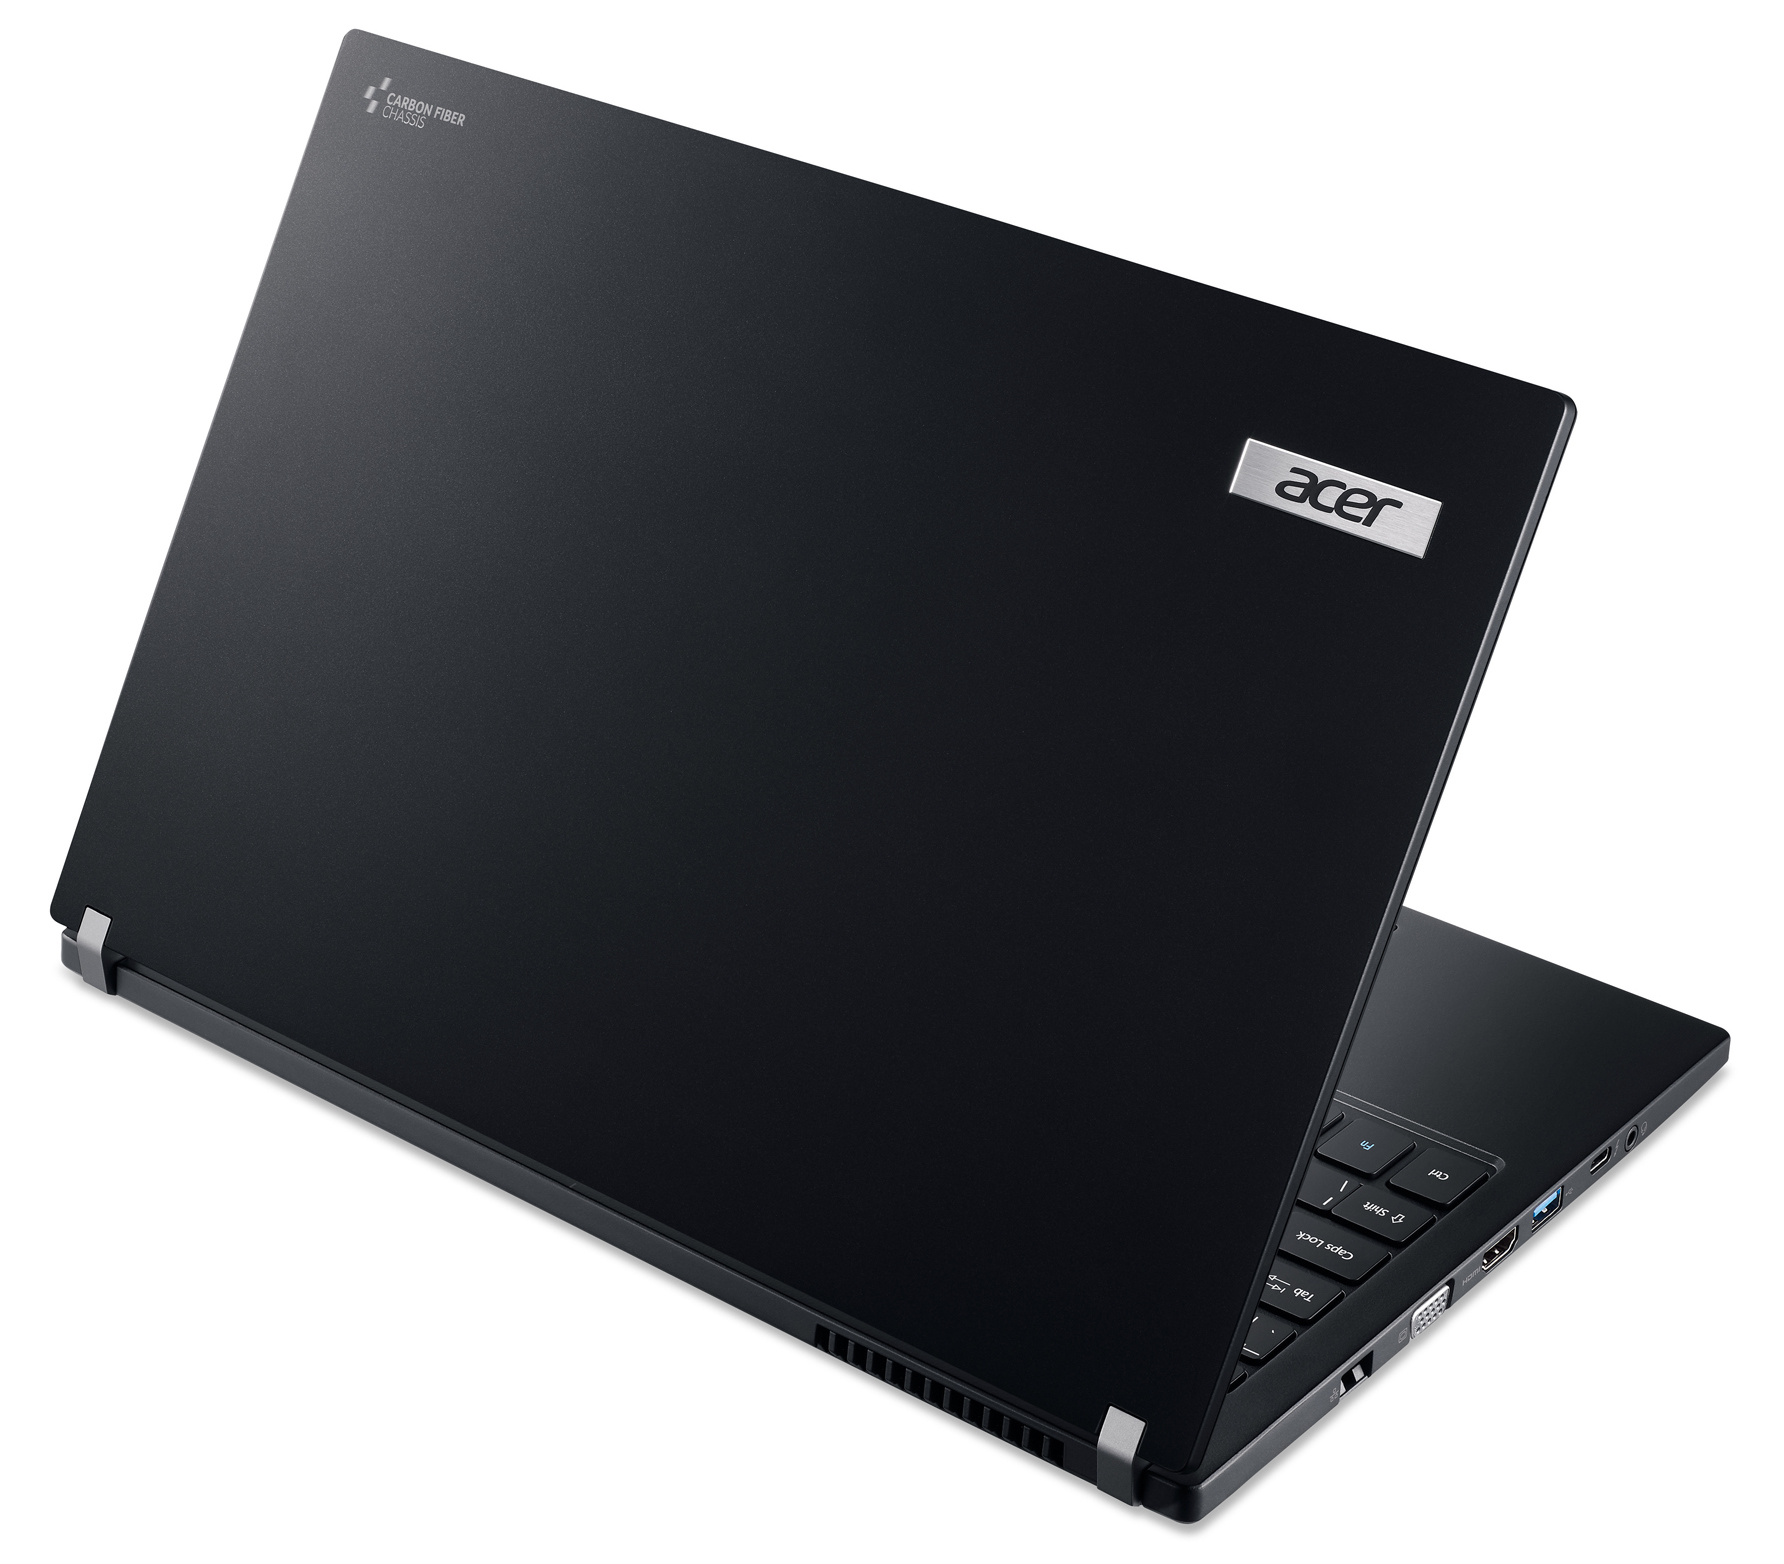
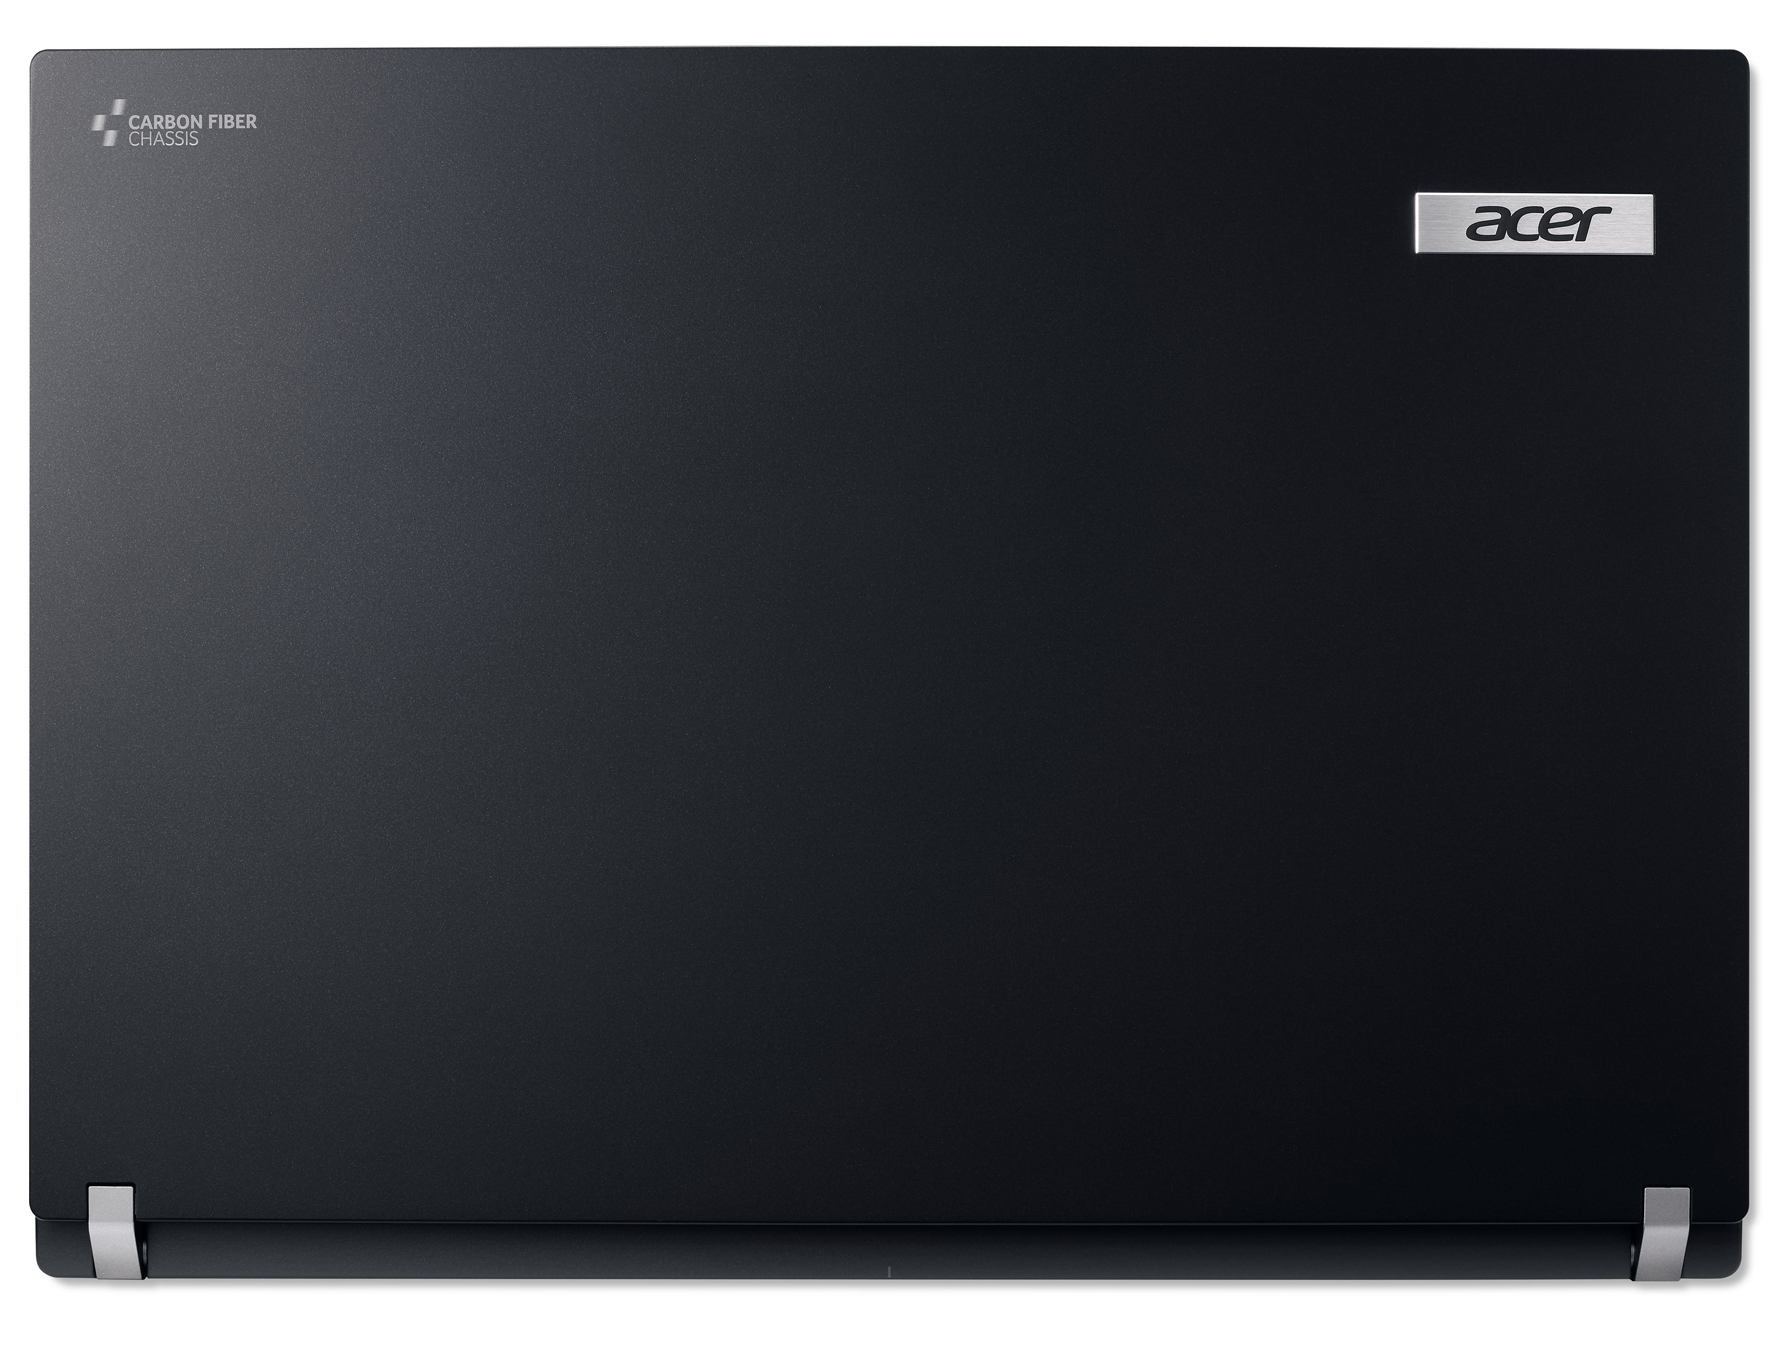
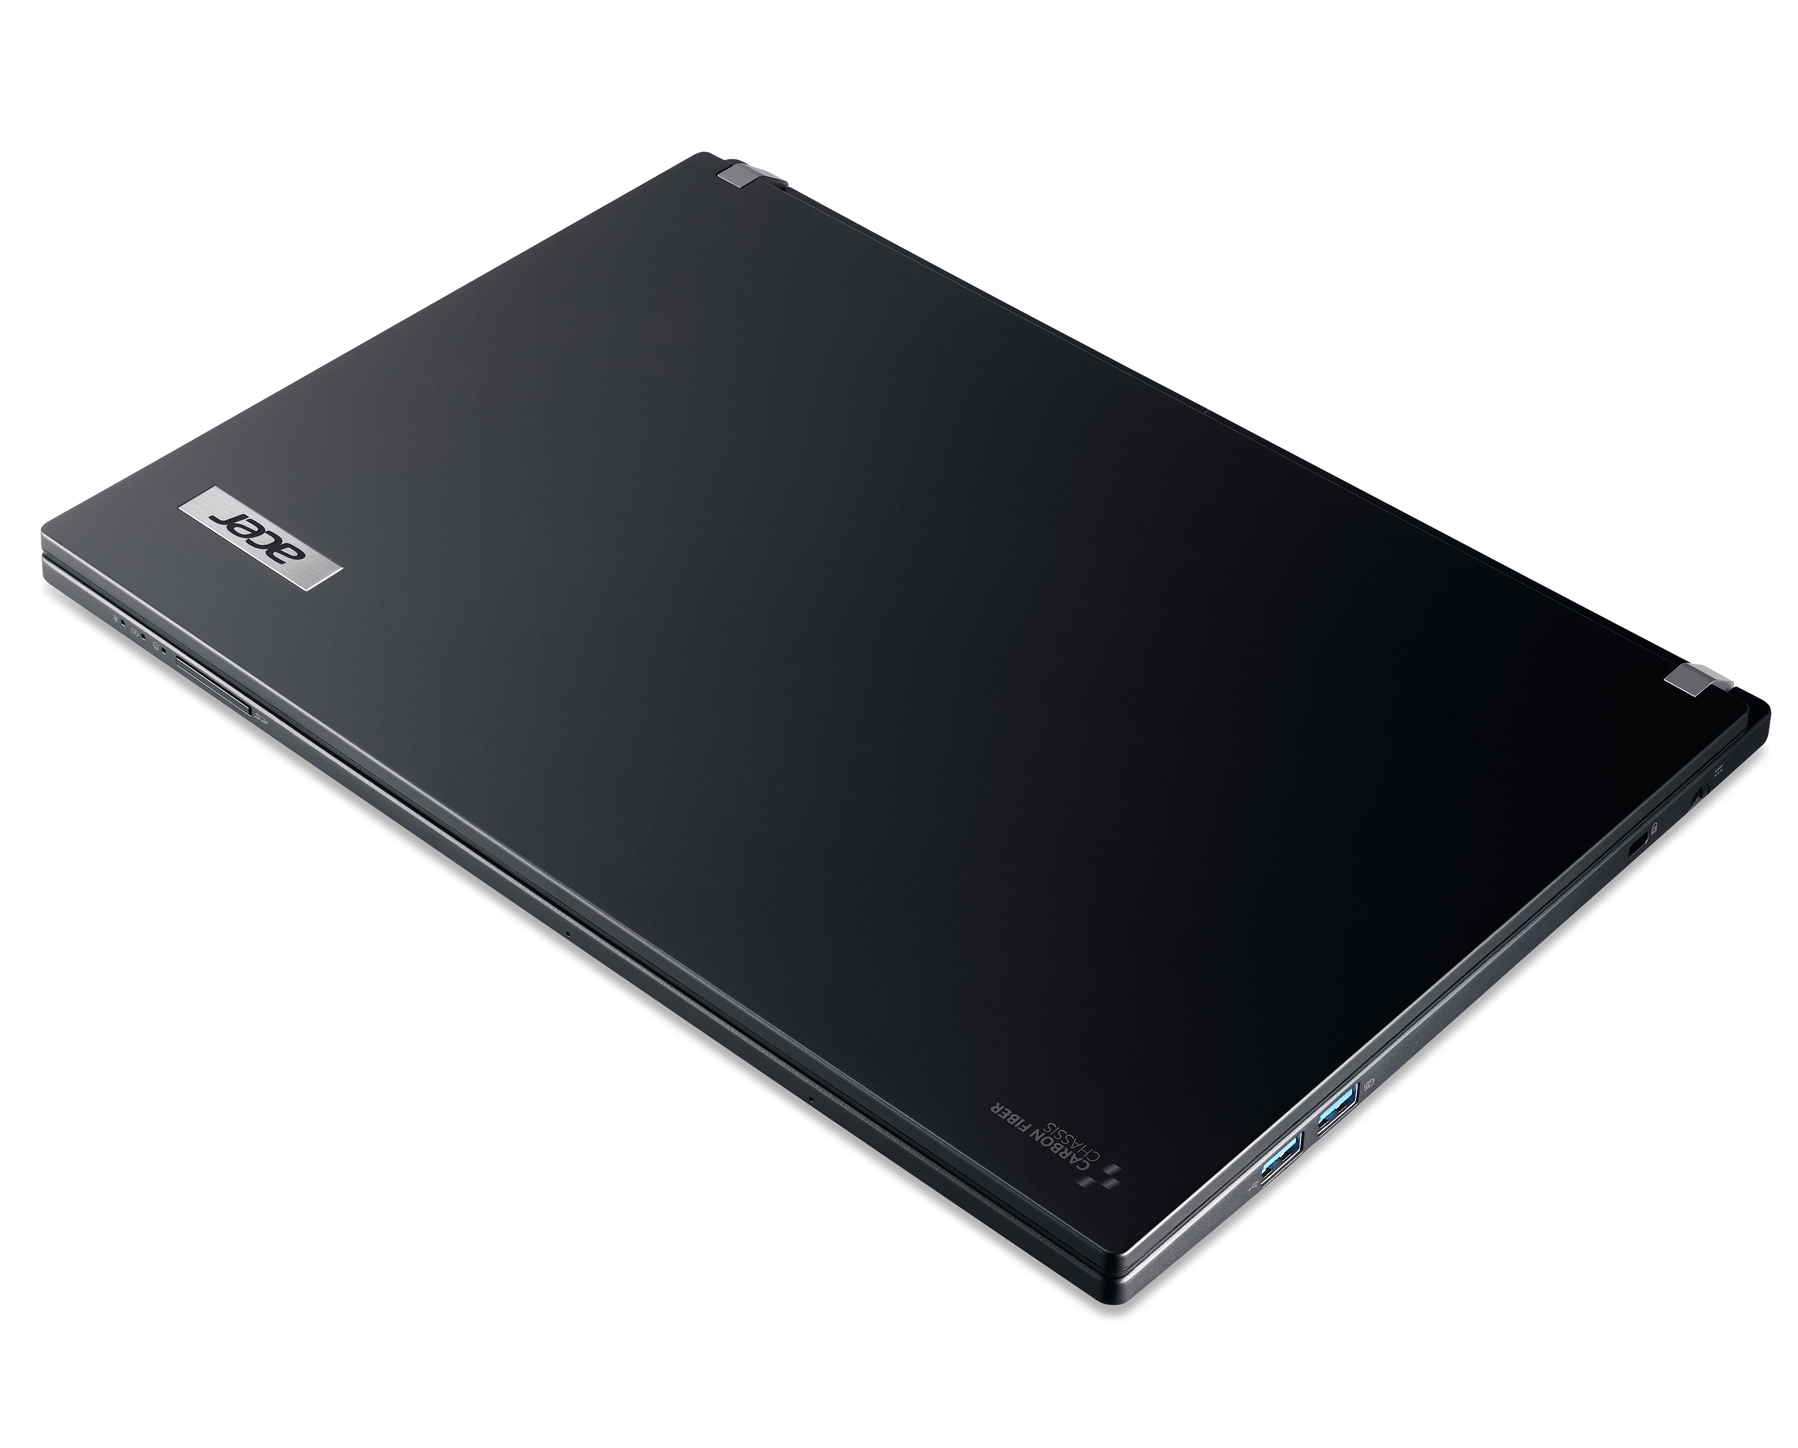
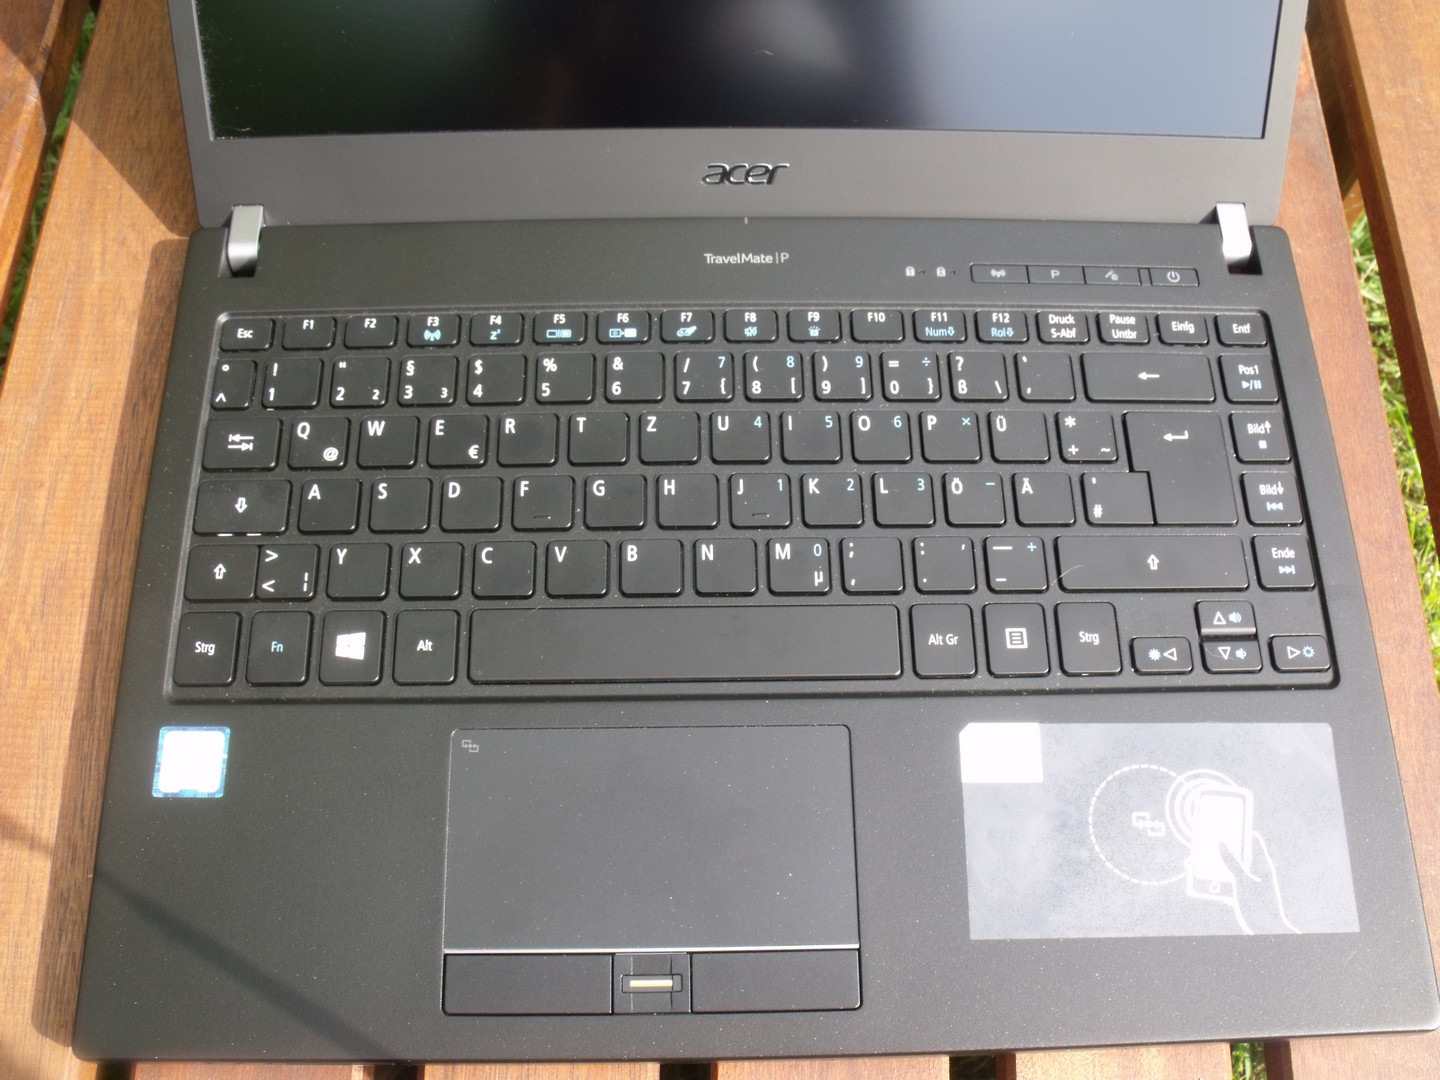
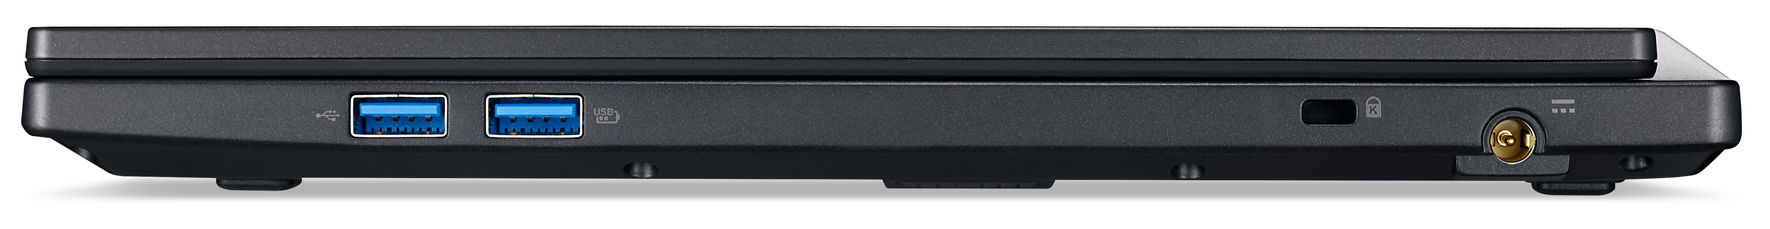
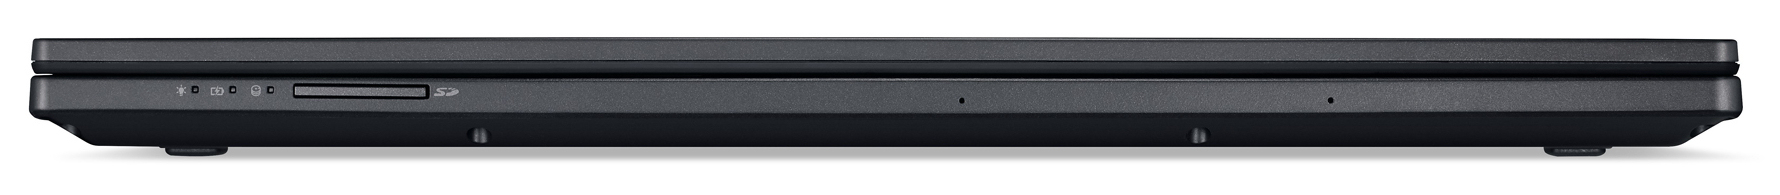
Breve análisis del portátil Acer TravelMate P648-G2 (i7, 256 GB)
| SD Card Reader | |
| average JPG Copy Test (av. of 3 runs) | |
| Dell Latitude 14 E5470 | |
| Acer TravelMate P648-G2-M-73T0 | |
| Lenovo ThinkPad T470-20HD002HGE | |
| Toshiba Tecra Z50-C-10P | |
| maximum AS SSD Seq Read Test (1GB) | |
| Dell Latitude 14 E5470 | |
| Lenovo ThinkPad T470-20HD002HGE | |
| Acer TravelMate P648-G2-M-73T0 | |
| Toshiba Tecra Z50-C-10P | |
| Networking | |
| iperf3 transmit AX12 | |
| Lenovo ThinkPad T470-20HD002HGE | |
| HP EliteBook 840 G4-Z2V49ET ABD (jseb) | |
| Acer TravelMate P648-G2-M-73T0 | |
| Dell Latitude 14 E5470 (jseb) | |
| iperf3 receive AX12 | |
| Acer TravelMate P648-G2-M-73T0 | |
| Lenovo ThinkPad T470-20HD002HGE | |
| Dell Latitude 14 E5470 (jseb) | |
| HP EliteBook 840 G4-Z2V49ET ABD (jseb) | |
| |||||||||||||||||||||||||
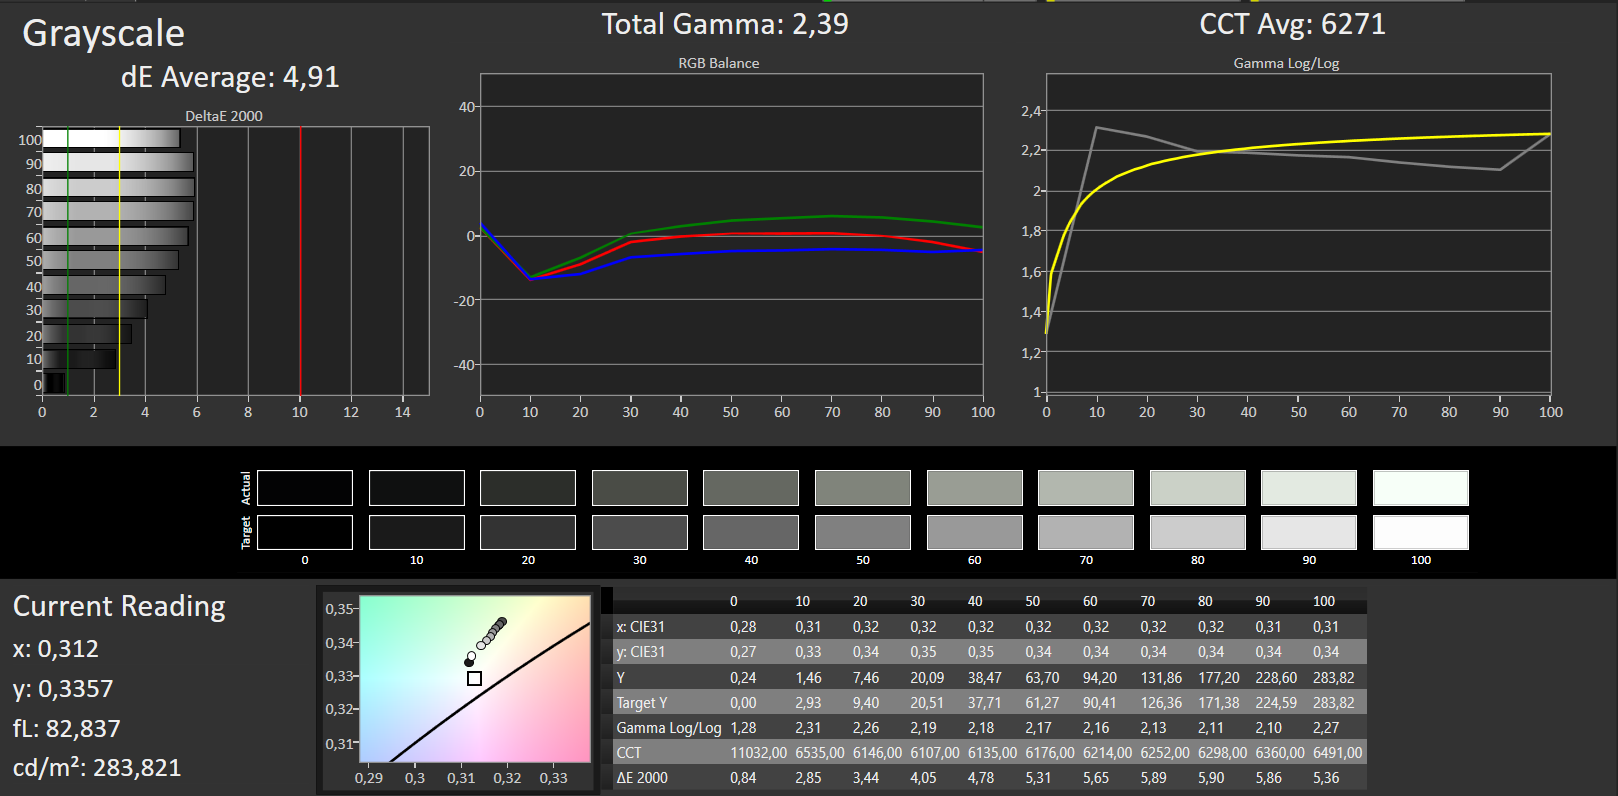
iluminación: 85 %
Brillo con batería: 275 cd/m²
Contraste: 1100:1 (Negro: 0.25 cd/m²)
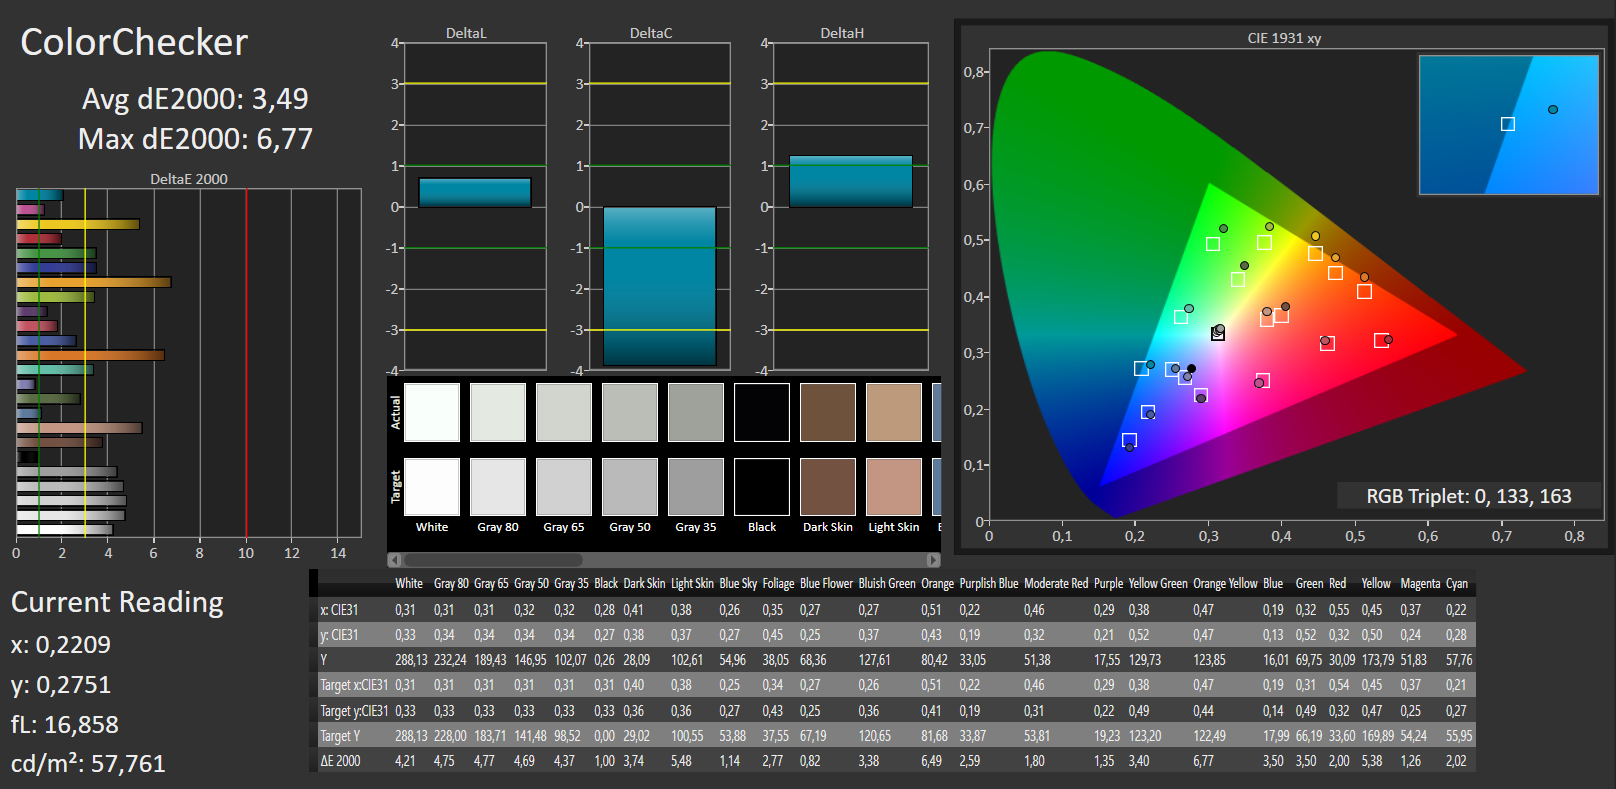
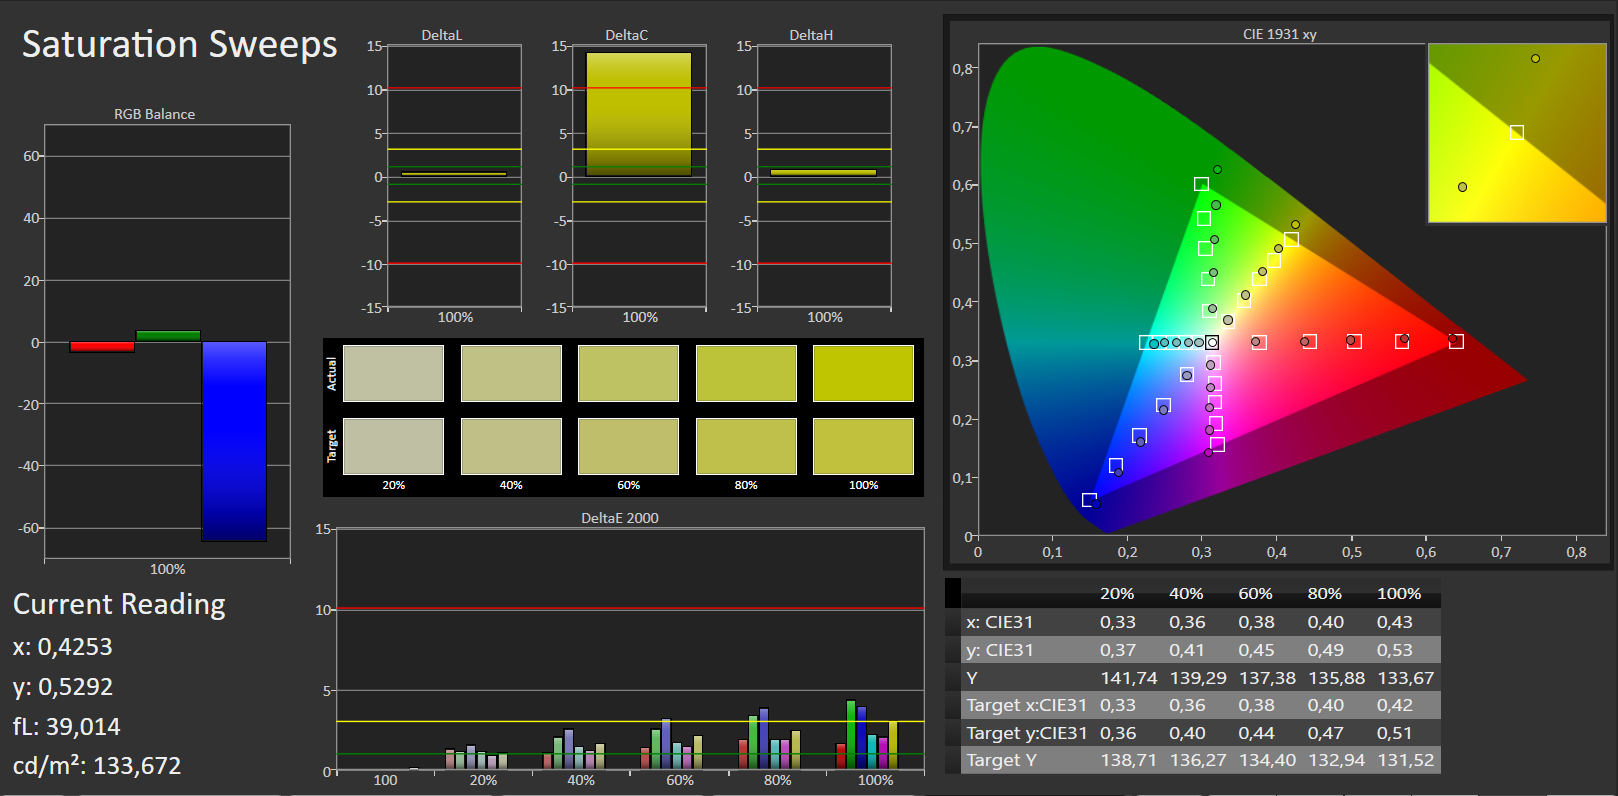
ΔE ColorChecker Calman: 3.49 | ∀{0.5-29.43 Ø4.73}
ΔE Greyscale Calman: 4.91 | ∀{0.09-98 Ø4.97}
91% sRGB (Argyll 1.6.3 3D)
59% AdobeRGB 1998 (Argyll 1.6.3 3D)
66.4% AdobeRGB 1998 (Argyll 3D)
90.8% sRGB (Argyll 3D)
67.2% Display P3 (Argyll 3D)
Gamma: 2.39
CCT: 6271 K
| Acer TravelMate P648-G2-M-73T0 1920x1080, 14" | Lenovo ThinkPad X1 Carbon 2017-20HQS03P00 B140HAN03_1, , 1920x1080, 14" | Dell Latitude 14 E5470 LP140WF3, , 1920x1080, 14" | Toshiba Tecra Z50-C-10P LP156WF6-SPP1, , 1920x1080, 15.6" | Dell Latitude 14 Rugged 5414 AU Optronics B140HAN, , 1920x1080, 14" | |
|---|---|---|---|---|---|
| Display | -7% | -6% | -6% | -42% | |
| Display P3 Coverage (%) | 67.2 | 61.4 -9% | 64.8 -4% | 65.4 -3% | 37.23 -45% |
| sRGB Coverage (%) | 90.8 | 85.9 -5% | 84.8 -7% | 84.6 -7% | 55.2 -39% |
| AdobeRGB 1998 Coverage (%) | 66.4 | 62.4 -6% | 62 -7% | 61.8 -7% | 38.48 -42% |
| Response Times | -18% | -4% | 22% | -37% | |
| Response Time Grey 50% / Grey 80% * (ms) | 38 ? | 41.6 ? -9% | 39 ? -3% | 20 ? 47% | 49 ? -29% |
| Response Time Black / White * (ms) | 25 ? | 31.6 ? -26% | 26 ? -4% | 26 ? -4% | 36 ? -44% |
| PWM Frequency (Hz) | 50 ? | 198 ? | |||
| Screen | -8% | -14% | -7% | -25% | |
| Brightness middle (cd/m²) | 275 | 311 13% | 323 17% | 288 5% | 1152 319% |
| Brightness (cd/m²) | 253 | 288 14% | 316 25% | 277 9% | 1067 322% |
| Brightness Distribution (%) | 85 | 85 0% | 79 -7% | 83 -2% | 86 1% |
| Black Level * (cd/m²) | 0.25 | 0.24 4% | 0.57 -128% | 0.27 -8% | 1.08 -332% |
| Contrast (:1) | 1100 | 1296 18% | 567 -48% | 1067 -3% | 1067 -3% |
| Colorchecker dE 2000 * | 3.49 | 5.5 -58% | 3.68 -5% | 4.7 -35% | 10.04 -188% |
| Colorchecker dE 2000 max. * | 6.77 | 9 -33% | 8.33 -23% | 11.7 -73% | 19.43 -187% |
| Greyscale dE 2000 * | 4.91 | 6.2 -26% | 2.99 39% | 3.1 37% | 10.47 -113% |
| Gamma | 2.39 92% | 2.02 109% | 2.49 88% | 2.7 81% | 2.42 91% |
| CCT | 6271 104% | 5950 109% | 6572 99% | 6603 98% | 5576 117% |
| Color Space (Percent of AdobeRGB 1998) (%) | 59 | 55.96 -5% | 55 -7% | 61.9 5% | 35 -41% |
| Color Space (Percent of sRGB) (%) | 91 | 85.77 -6% | 85 -7% | 90.3 -1% | 63 -31% |
| Media total (Programa/Opciones) | -11% /
-9% | -8% /
-11% | 3% /
-3% | -35% /
-30% |
* ... más pequeño es mejor
Tiempos de respuesta del display
| ↔ Tiempo de respuesta de Negro a Blanco | ||
|---|---|---|
| 25 ms ... subida ↗ y bajada ↘ combinada | ↗ 14 ms subida | 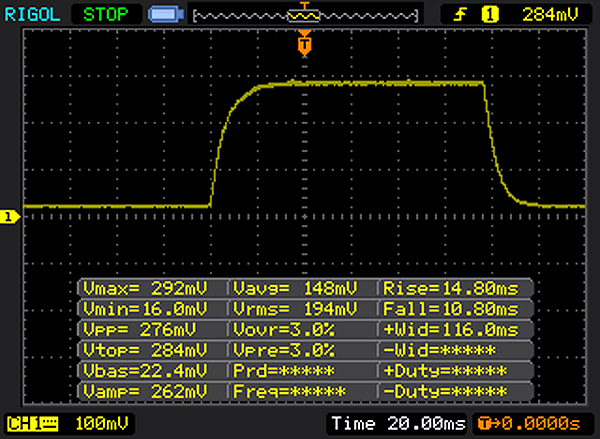 |
| ↘ 11 ms bajada | ||
| La pantalla mostró tiempos de respuesta relativamente lentos en nuestros tests pero podría ser demasiado lenta para los jugones. En comparación, todos los dispositivos de prueba van de ##min### (mínimo) a 240 (máximo) ms. » 59 % de todos los dispositivos son mejores. Eso quiere decir que el tiempo de respuesta es peor que la media (19.9 ms) de todos los dispositivos testados. | ||
| ↔ Tiempo de respuesta 50% Gris a 80% Gris | ||
| 38 ms ... subida ↗ y bajada ↘ combinada | ↗ 20 ms subida | 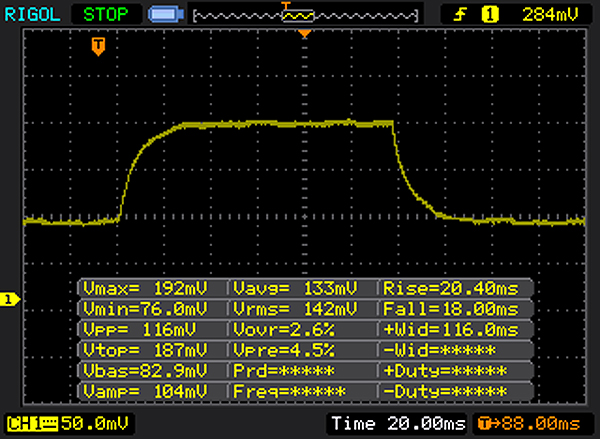 |
| ↘ 18 ms bajada | ||
| La pantalla mostró tiempos de respuesta lentos en nuestros tests y podría ser demasiado lenta para los jugones. En comparación, todos los dispositivos de prueba van de ##min### (mínimo) a 636 (máximo) ms. » 55 % de todos los dispositivos son mejores. Eso quiere decir que el tiempo de respuesta es peor que la media (31.1 ms) de todos los dispositivos testados. | ||
Parpadeo de Pantalla / PWM (Pulse-Width Modulation)
| Parpadeo de Pantalla / PWM no detectado | ||
Comparación: 52 % de todos los dispositivos testados no usaron PWM para atenuar el display. Si se usó, medimos una media de 7798 (mínimo: 5 - máxmo: 343500) Hz. | ||
| PCMark 8 Home Score Accelerated v2 | 3515 puntos | |
| PCMark 8 Work Score Accelerated v2 | 4639 puntos | |
ayuda | ||
| Acer TravelMate P648-G2-M-73T0 SK Hynix HFS256G39TND-N210A | Lenovo ThinkPad X1 Carbon 2017-20HQS03P00 Samsung PM961 NVMe MZVLW512HMJP | Dell Latitude 14 E5470 Micron SSD 1100 (MTFDDAV256TBN) | Toshiba Tecra Z50-C-10P Toshiba HG6 THNSNJ256G8NU | Acer TravelMate P648-M-757N Lite-On CV1-8B256 | |
|---|---|---|---|---|---|
| CrystalDiskMark 3.0 | 172% | -13% | 8% | -2% | |
| Read Seq (MB/s) | 518 | 1827 253% | 465.4 -10% | 512 -1% | 531 3% |
| Write Seq (MB/s) | 267.2 | 1383 418% | 363.1 36% | 415.8 56% | 358.8 34% |
| Read 512 (MB/s) | 562 | 814 45% | 338.4 -40% | 404.4 -28% | 384.8 -32% |
| Write 512 (MB/s) | 263.5 | 1098 317% | 246.1 -7% | 382.2 45% | 363 38% |
| Read 4k (MB/s) | 32.88 | 61 86% | 25.83 -21% | 24.05 -27% | 31.3 -5% |
| Write 4k (MB/s) | 85.6 | 172.2 101% | 80.3 -6% | 87.6 2% | 80.3 -6% |
| Read 4k QD32 (MB/s) | 351.3 | 601 71% | 246.1 -30% | 239.4 -32% | |
| Write 4k QD32 (MB/s) | 265.2 | 495.6 87% | 197.7 -25% | 225.3 -15% |

| 3DMark 11 - 1280x720 Performance GPU | |
| Lenovo ThinkPad X1 Carbon 2017-20HQS03P00 | |
| Acer TravelMate P648-G2-M-73T0 | |
| Dell Latitude 14 E5470 | |
| Acer TravelMate P648-M-757N | |
| Toshiba Tecra Z50-C-10P | |
| 3DMark | |
| 1280x720 Cloud Gate Standard Graphics | |
| Lenovo ThinkPad X1 Carbon 2017-20HQS03P00 | |
| Acer TravelMate P648-G2-M-73T0 | |
| Acer TravelMate P648-M-757N | |
| Dell Latitude 14 E5470 | |
| Toshiba Tecra Z50-C-10P | |
| 1920x1080 Fire Strike Graphics | |
| Lenovo ThinkPad X1 Carbon 2017-20HQS03P00 | |
| Acer TravelMate P648-G2-M-73T0 | |
| Acer TravelMate P648-M-757N | |
| Dell Latitude 14 E5470 | |
| Toshiba Tecra Z50-C-10P | |
| 3DMark 11 Performance | 1591 puntos | |
| 3DMark Cloud Gate Standard Score | 6159 puntos | |
| 3DMark Fire Strike Score | 768 puntos | |
ayuda | ||
| bajo | medio | alto | ultra | |
|---|---|---|---|---|
| BioShock Infinite (2013) | 42.91 | 24.62 | 20.22 | 6.43 |
| Thief (2014) | 19 | 12.3 | 10.2 | 4.9 |
| Rise of the Tomb Raider (2016) | 17.09 | 9.939 | 5.216 | 3.675 |
Ruido
| Ocioso |
| 30.6 / 30.6 / 31 dB(A) |
| Carga |
| 34.5 / 32.4 dB(A) |
 | ||
30 dB silencioso 40 dB(A) audible 50 dB(A) ruidosamente alto |
||
min: | ||
(+) La temperatura máxima en la parte superior es de 39.1 °C / 102 F, frente a la media de 34.3 °C / 94 F, que oscila entre 21.2 y 62.5 °C para la clase Office.
(+) El fondo se calienta hasta un máximo de 35 °C / 95 F, frente a la media de 36.8 °C / 98 F
(+) En reposo, la temperatura media de la parte superior es de 26 °C / 79# F, frente a la media del dispositivo de 29.5 °C / 85 F.
(+) El reposamanos y el panel táctil están a una temperatura inferior a la de la piel, con un máximo de 28.1 °C / 82.6 F y, por tanto, son fríos al tacto.
(±) La temperatura media de la zona del reposamanos de dispositivos similares fue de 27.5 °C / 81.5 F (-0.6 °C / -1.1 F).
Acer TravelMate P648-G2-M-73T0 análisis de audio
(-) | altavoces no muy altos (#68 dB)
Graves 100 - 315 Hz
(-) | casi sin bajos - de media 23.6% inferior a la mediana
(±) | la linealidad de los graves es media (10.7% delta a frecuencia anterior)
Medios 400 - 2000 Hz
(+) | medios equilibrados - a sólo 3.6% de la mediana
(±) | la linealidad de los medios es media (9.3% delta respecto a la frecuencia anterior)
Altos 2 - 16 kHz
(+) | máximos equilibrados - a sólo 4.5% de la mediana
(±) | la linealidad de los máximos es media (7.8% delta a frecuencia anterior)
Total 100 - 16.000 Hz
(±) | la linealidad del sonido global es media (26% de diferencia con la mediana)
En comparación con la misma clase
» 79% de todos los dispositivos probados de esta clase eran mejores, 7% similares, 14% peores
» El mejor tuvo un delta de 7%, la media fue 21%, el peor fue ###max##%
En comparación con todos los dispositivos probados
» 80% de todos los dispositivos probados eran mejores, 4% similares, 16% peores
» El mejor tuvo un delta de 4%, la media fue 24%, el peor fue ###max##%
Apple MacBook 12 (Early 2016) 1.1 GHz análisis de audio
(+) | los altavoces pueden reproducir a un volumen relativamente alto (#83.6 dB)
Graves 100 - 315 Hz
(±) | lubina reducida - en promedio 11.3% inferior a la mediana
(±) | la linealidad de los graves es media (14.2% delta a frecuencia anterior)
Medios 400 - 2000 Hz
(+) | medios equilibrados - a sólo 2.4% de la mediana
(+) | los medios son lineales (5.5% delta a la frecuencia anterior)
Altos 2 - 16 kHz
(+) | máximos equilibrados - a sólo 2% de la mediana
(+) | los máximos son lineales (4.5% delta a la frecuencia anterior)
Total 100 - 16.000 Hz
(+) | el sonido global es lineal (10.2% de diferencia con la mediana)
En comparación con la misma clase
» 7% de todos los dispositivos probados de esta clase eran mejores, 2% similares, 91% peores
» El mejor tuvo un delta de 5%, la media fue 18%, el peor fue ###max##%
En comparación con todos los dispositivos probados
» 5% de todos los dispositivos probados eran mejores, 1% similares, 94% peores
» El mejor tuvo un delta de 4%, la media fue 24%, el peor fue ###max##%
| Off / Standby | |
| Ocioso | |
| Carga |
|
Clave:
min: | |
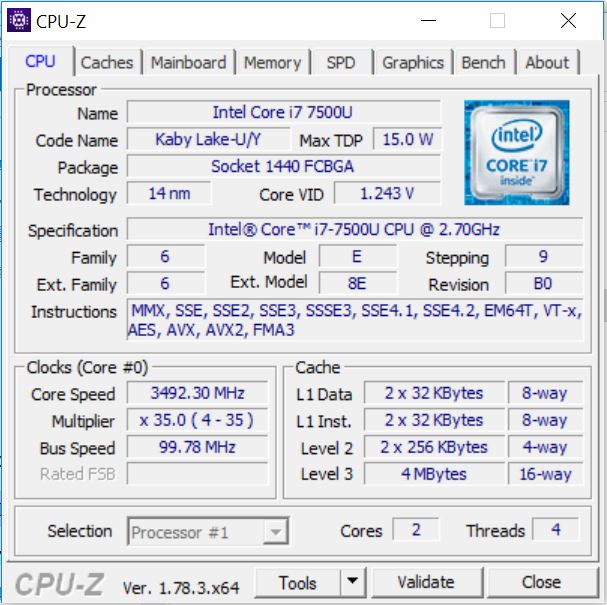
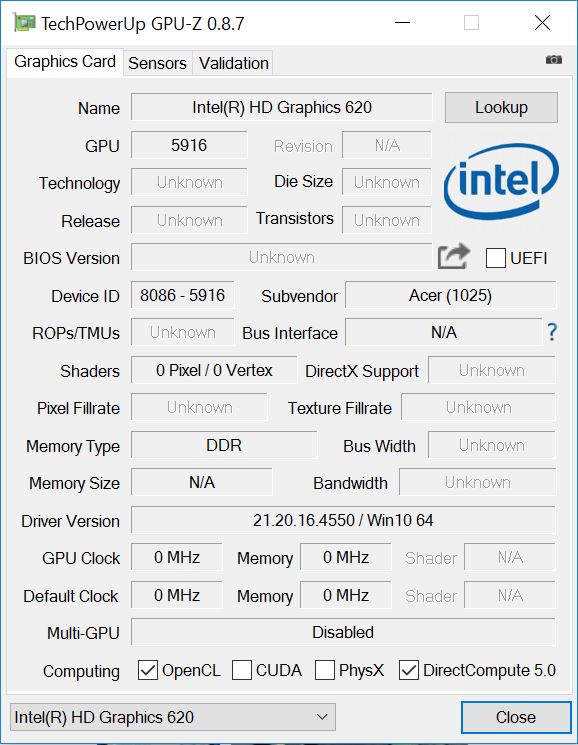
| Acer TravelMate P648-G2-M-73T0 i7-7500U, HD Graphics 620, SK Hynix HFS256G39TND-N210A, IPS, 1920x1080, 14" | Lenovo ThinkPad X1 Carbon 2017-20HQS03P00 i7-7500U, HD Graphics 620, Samsung PM961 NVMe MZVLW512HMJP, IPS, 1920x1080, 14" | Dell Latitude 14 E5470 6440HQ, HD Graphics 530, Micron SSD 1100 (MTFDDAV256TBN), AH-IPS, WLED, 1920x1080, 14" | Toshiba Tecra Z50-C-10P 6200U, HD Graphics 520, Toshiba HG6 THNSNJ256G8NU, IPS-Panel, 1920x1080, 15.6" | Acer TravelMate P648-M-757N 6500U, HD Graphics 520, Lite-On CV1-8B256, IPS, 1920x1080, 14" | |
|---|---|---|---|---|---|
| Power Consumption | -3% | -9% | 4% | -5% | |
| Idle Minimum * (Watt) | 4.8 | 3.84 20% | 4.1 15% | 4.7 2% | 5.3 -10% |
| Idle Average * (Watt) | 7.9 | 6.3 20% | 8.1 -3% | 8 -1% | 9.3 -18% |
| Idle Maximum * (Watt) | 10.7 | 8.6 20% | 11.4 -7% | 9.8 8% | 11.5 -7% |
| Load Average * (Watt) | 35 | 41.9 -20% | 33.5 4% | 29.7 15% | 30.8 12% |
| Load Maximum * (Watt) | 31.6 | 48.7 -54% | 49 -55% | 32.6 -3% | 32 -1% |
* ... más pequeño es mejor
| Acer TravelMate P648-G2-M-73T0 i7-7500U, HD Graphics 620, 54 Wh | Lenovo ThinkPad X1 Carbon 2017-20HQS03P00 i7-7500U, HD Graphics 620, 57 Wh | Dell Latitude 14 E5470 6440HQ, HD Graphics 530, 62 Wh | Toshiba Tecra Z50-C-10P 6200U, HD Graphics 520, 44 Wh | Acer TravelMate P648-M-757N 6500U, HD Graphics 520, 54 Wh | |
|---|---|---|---|---|---|
| Duración de Batería | -5% | -26% | -47% | -8% | |
| Reader / Idle (h) | 18.1 | 20.9 15% | 15.2 -16% | 18.1 0% | |
| WiFi v1.3 (h) | 11.2 | 8.3 -26% | 7.2 -36% | 5.9 -47% | 9.1 -19% |
| Load (h) | 1.9 | 1.8 -5% | 1.4 -26% | 1.8 -5% | |
| H.264 (h) | 11.9 | 6.9 | 9.1 |
Pro
Contra
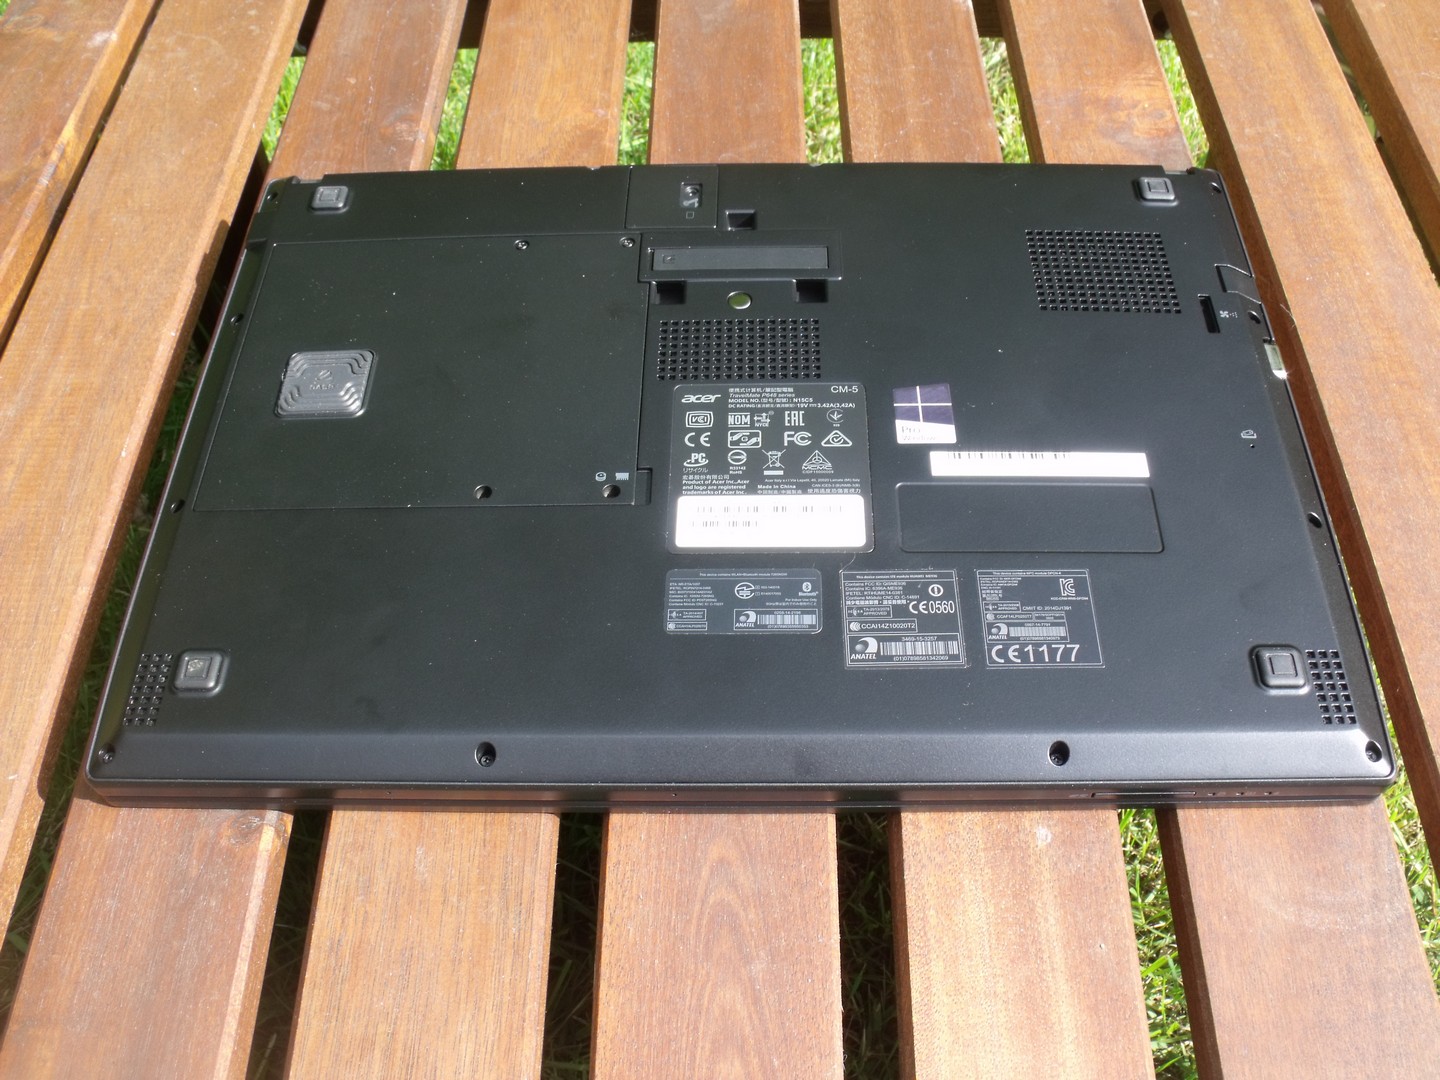
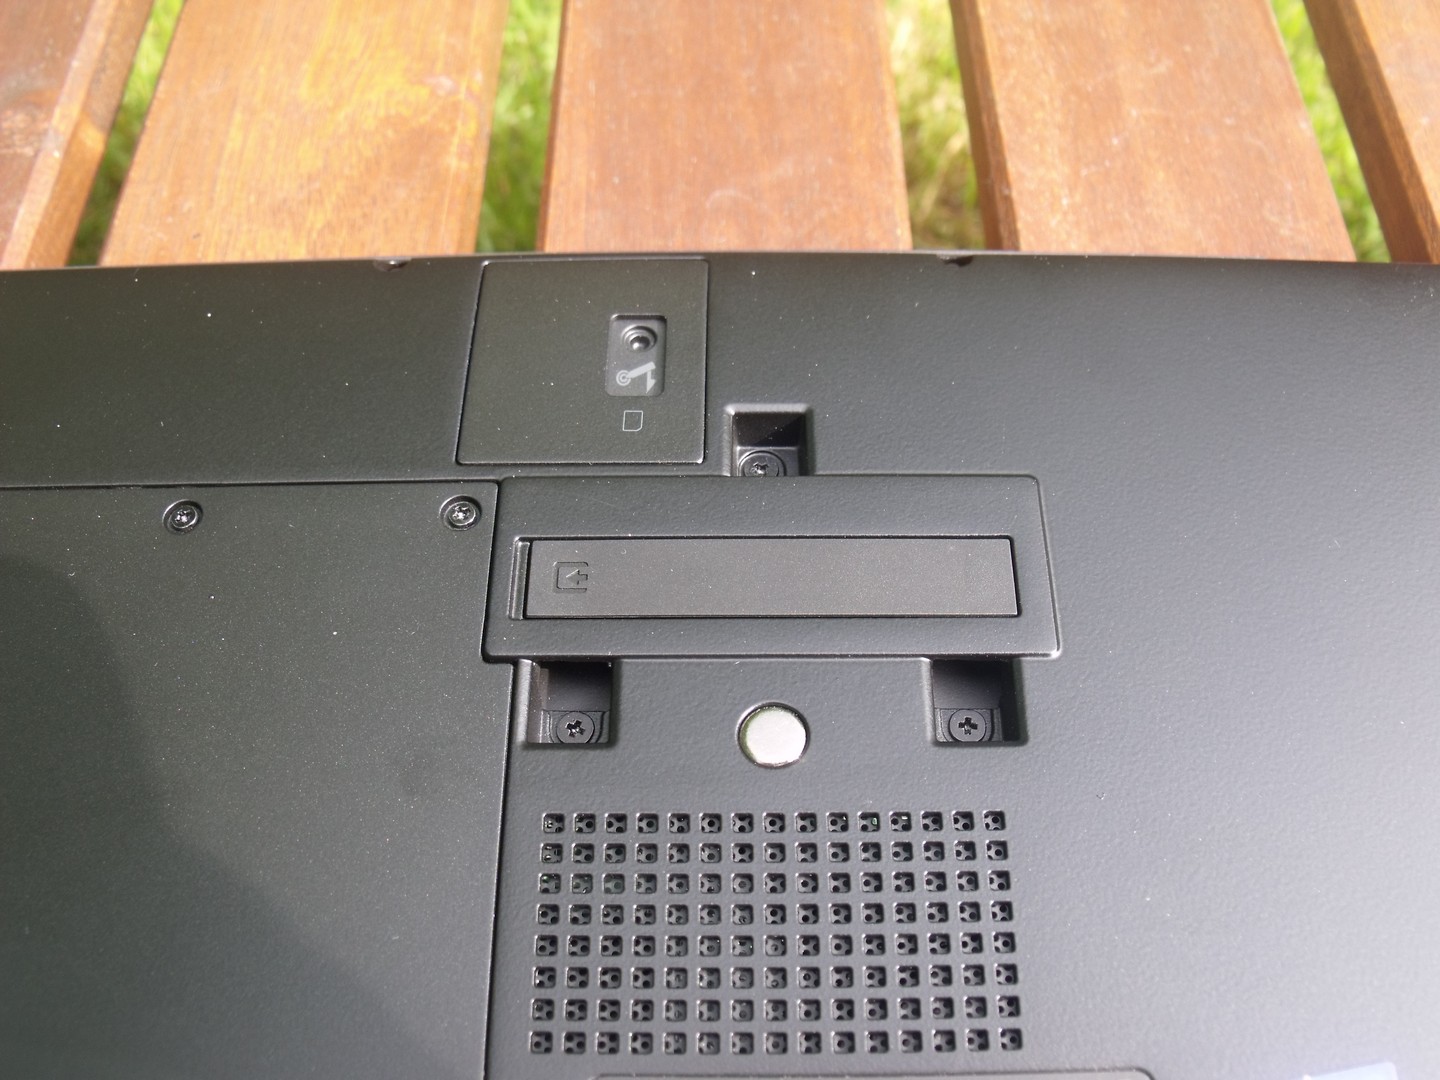
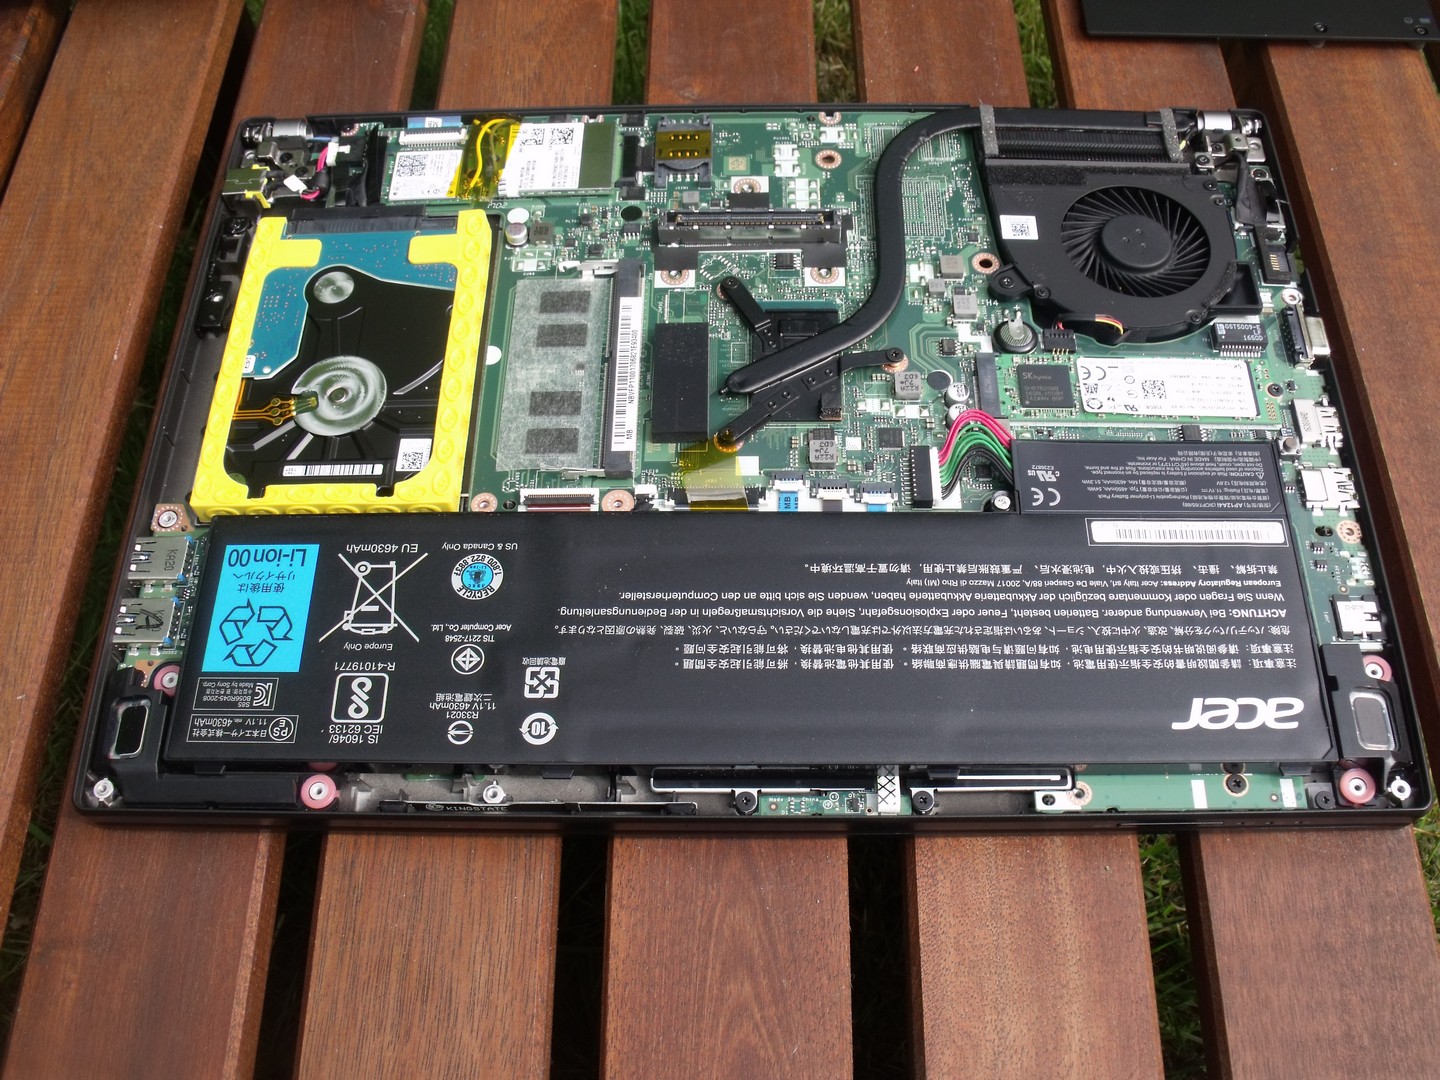
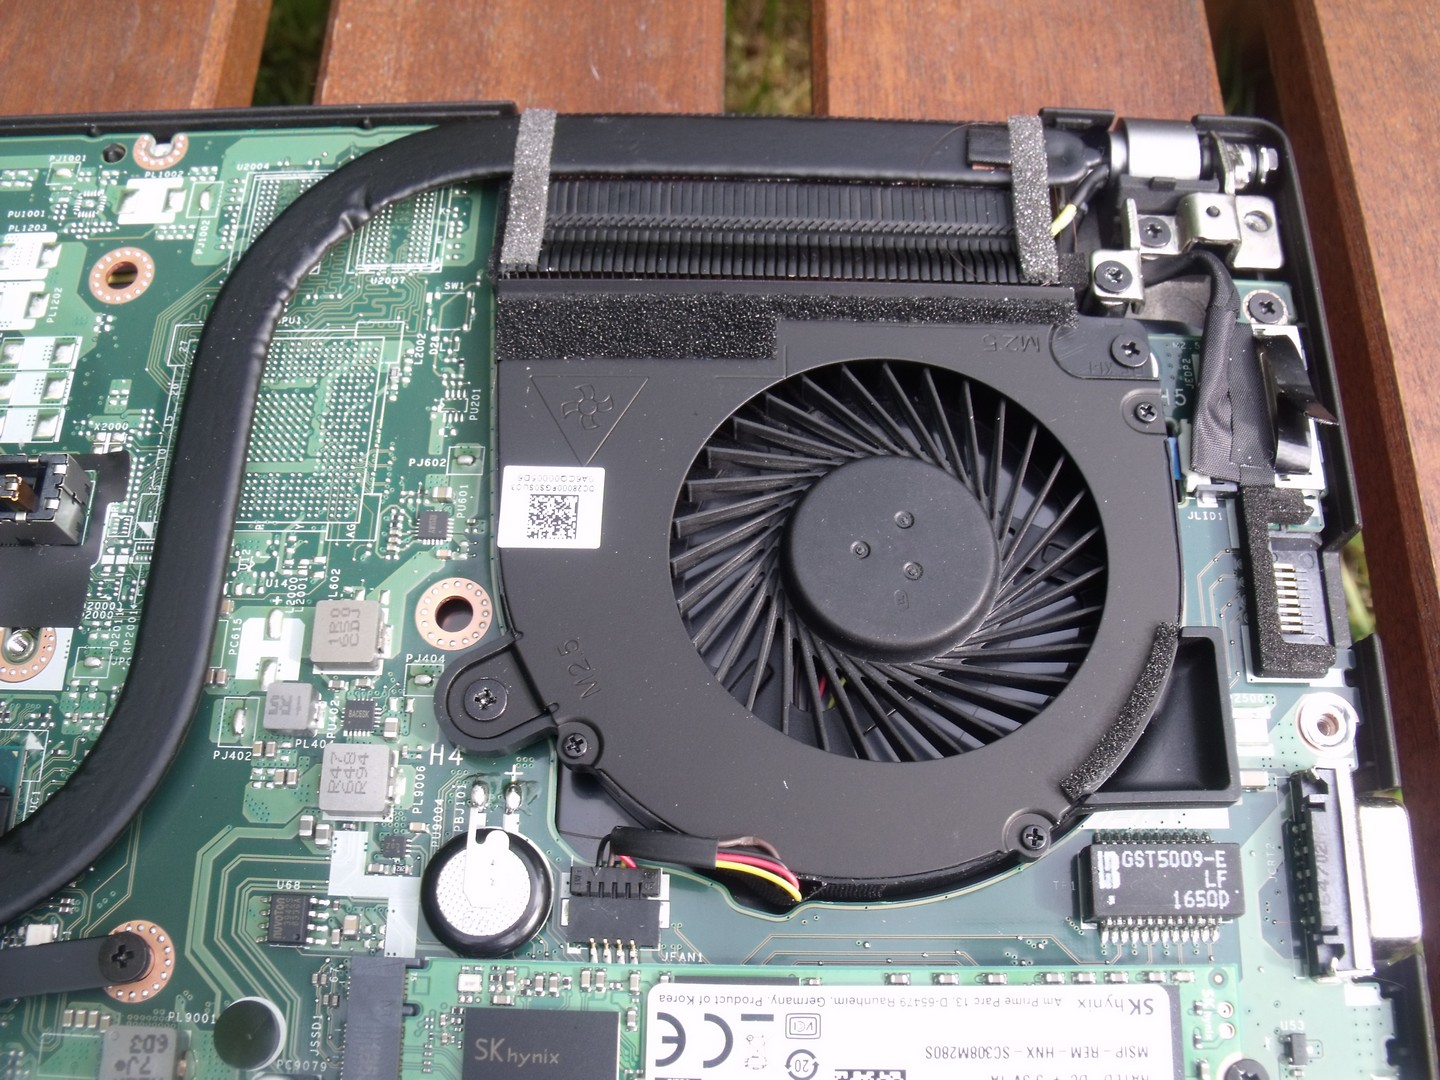
El TravelMate P648 G2 M 7619 es un portátil ligero y robusto. Todas las necesidades cotidianas deberían cubrirse sin problemas gracias a la CPU Kaby Lake, un SSD más rápido y un HDD mayor. La pantalla es suficientemente brillante para trabajar incluso con condiciones de luz poco favorables. Acer ofrece una base de expansión para ampliar la conectividad. El teclado podría ser un poco más rígido y Acer podría haber mejorado la gestión de los ventiladores.
Acer actualiza de nuevo su gama TravelMate P6. Sin embargo, aparte de la CPU Kaby Lake y la ampliación del almacenamiento, no hay demasiados cambios.
El TravelMate P648 G2 M 7619 resulta muy recomendable para usuarios del portátiles de negocios que busquen una alternativa a Lenovo, Dell y HP. Nuestro modelo de prueba está disponible por unos 1500 euros.
Ésta es una versión acortada del análisis original. Puedes leer el análisis completo en inglés aquí.
Acer TravelMate P648-G2-M-73T0
- 06/06/2017 v6 (old)
Mike Wobker