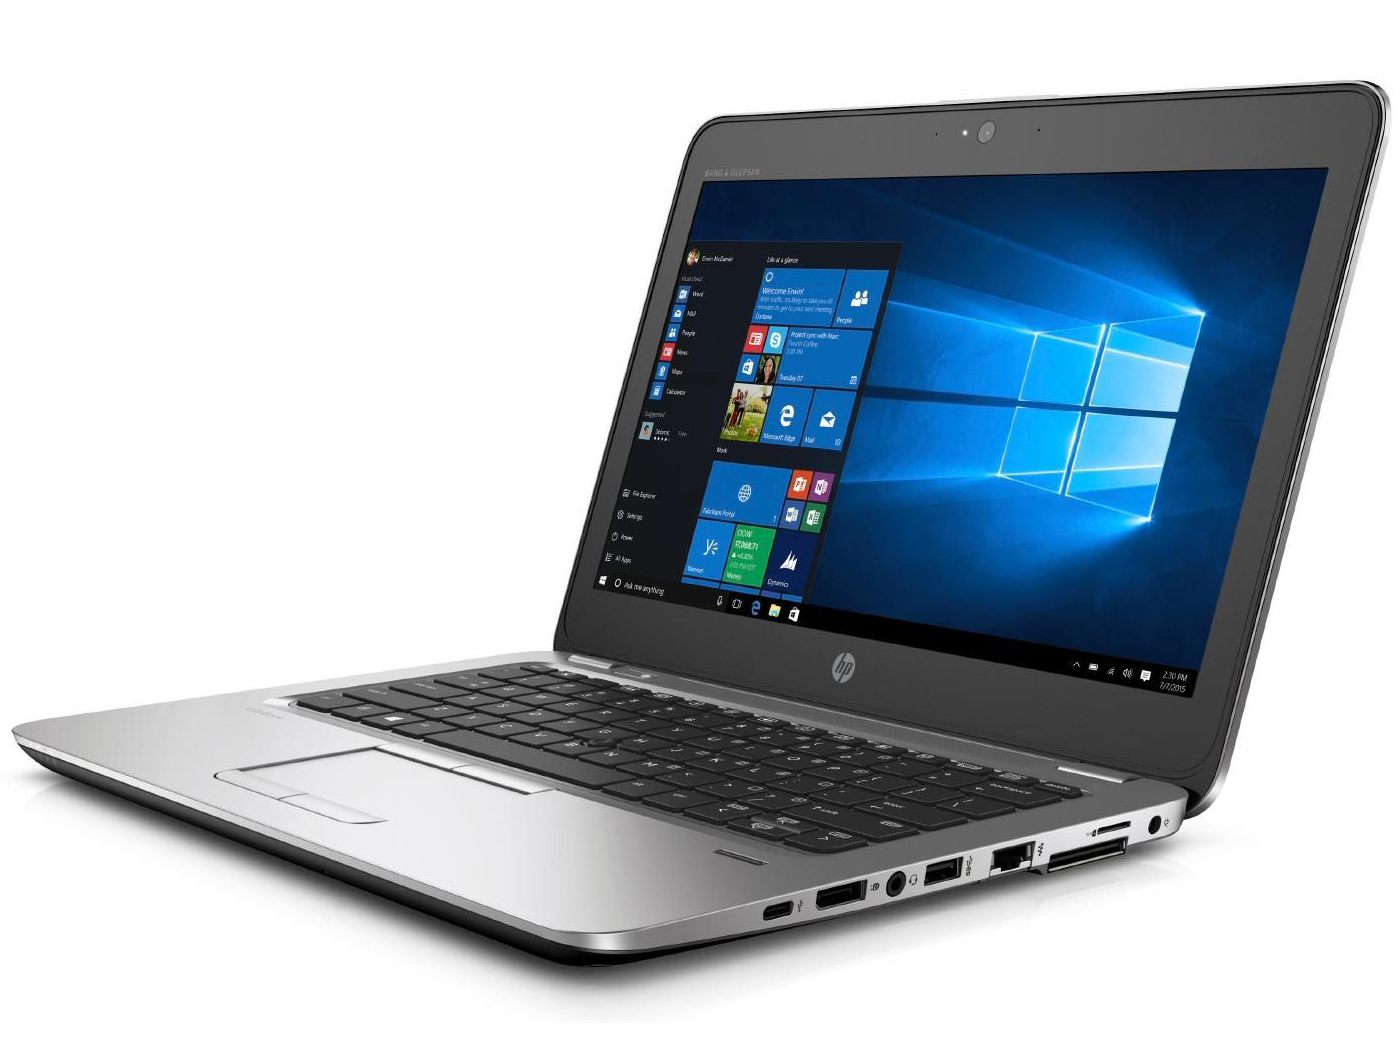
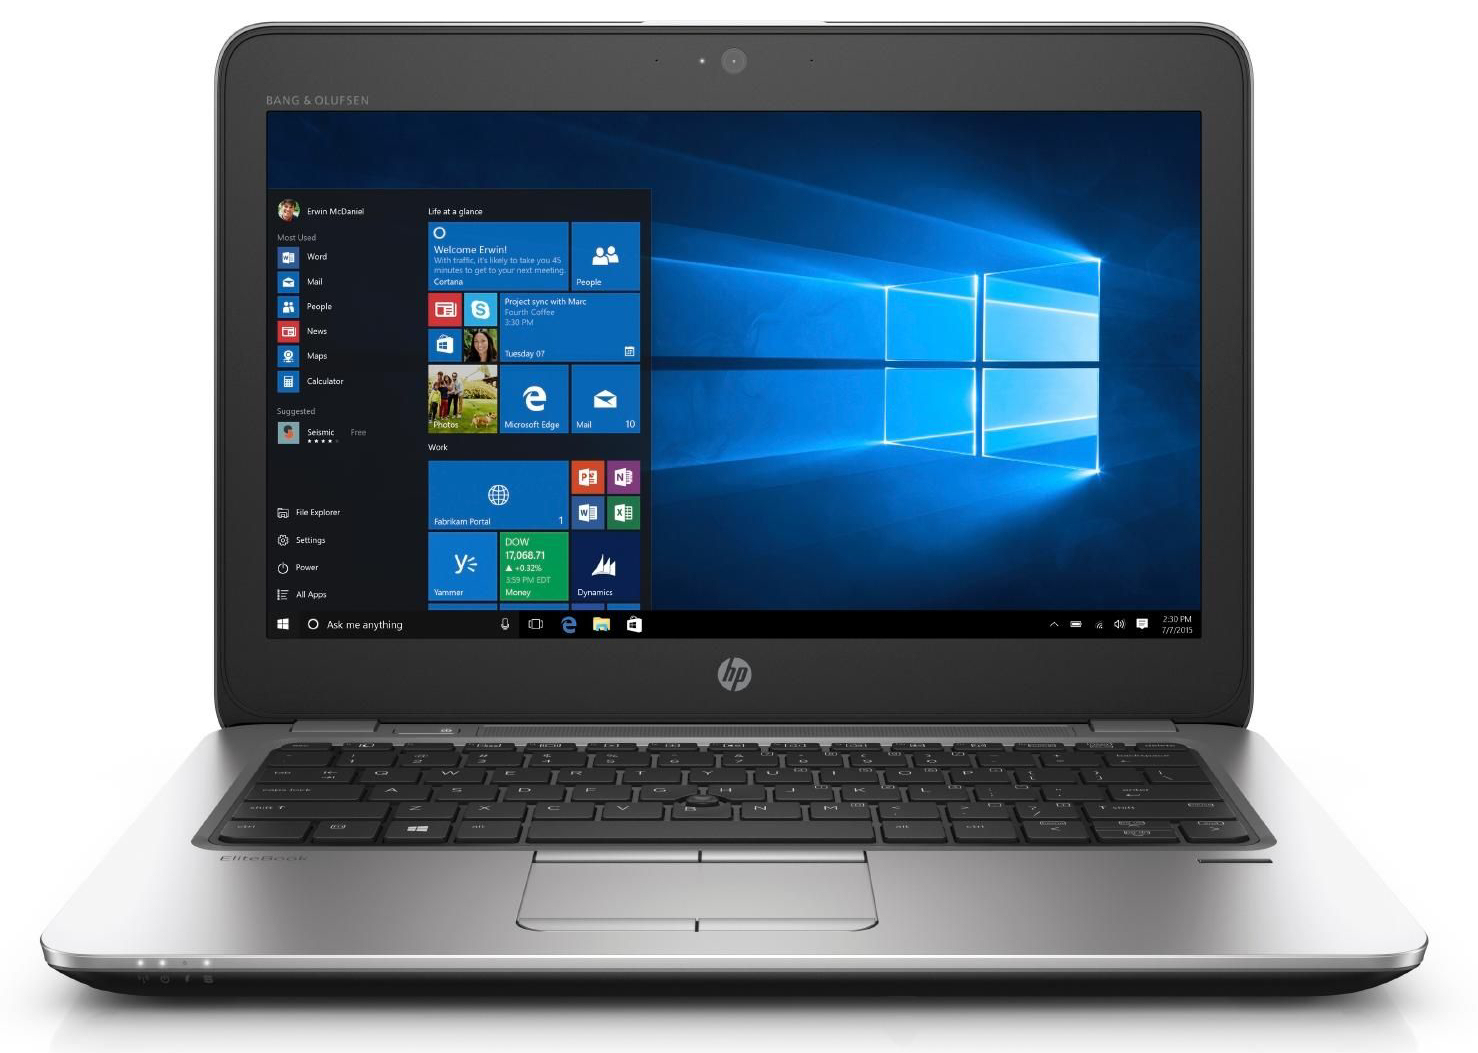
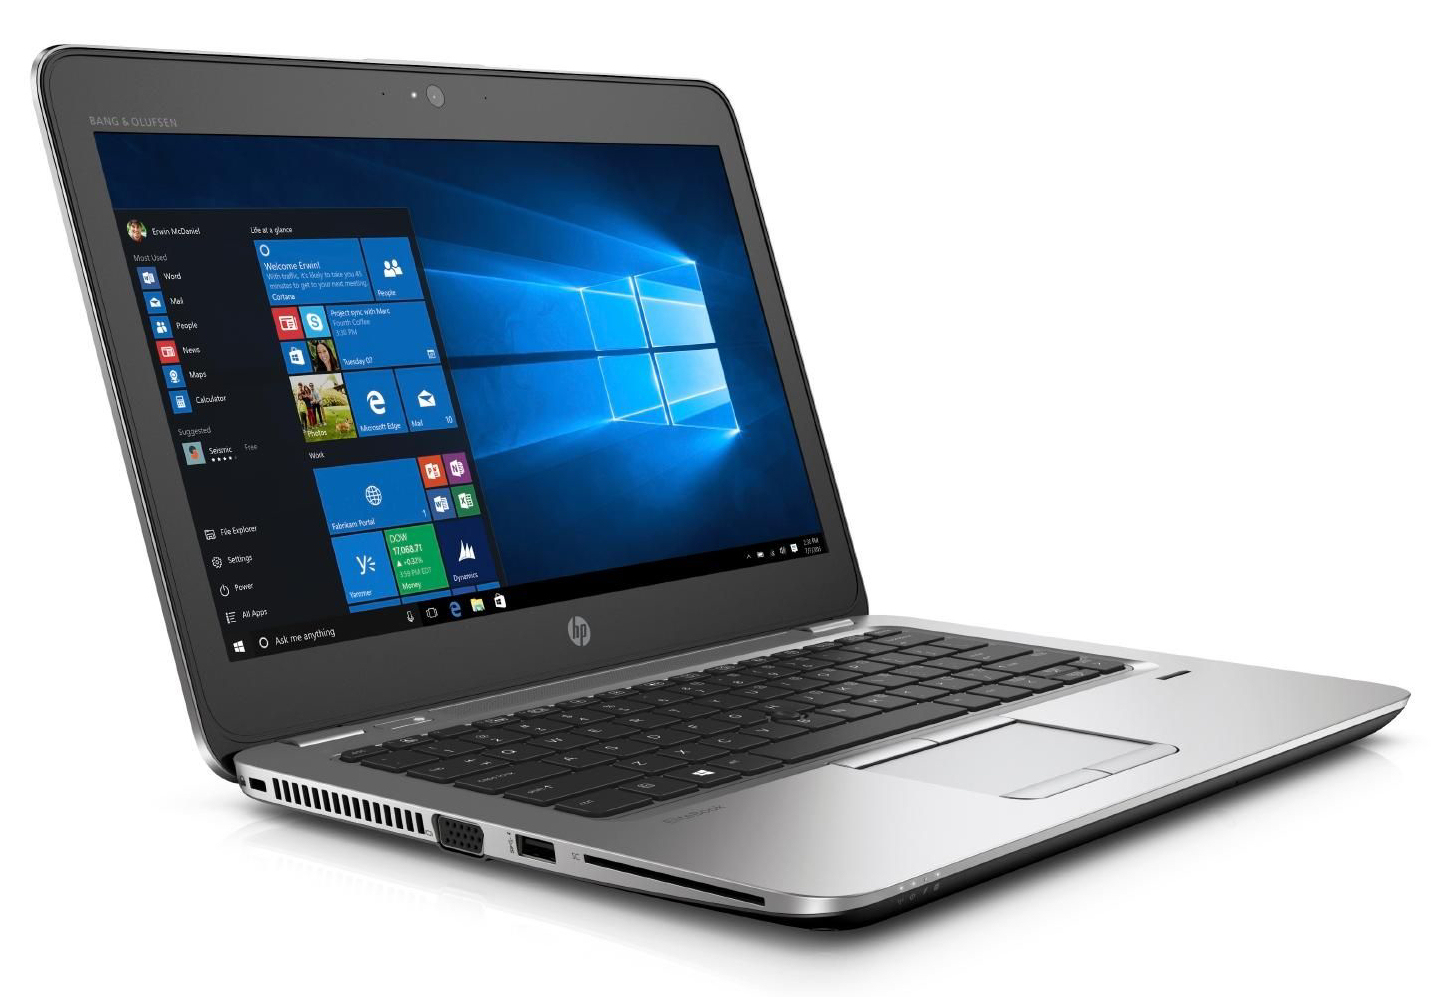
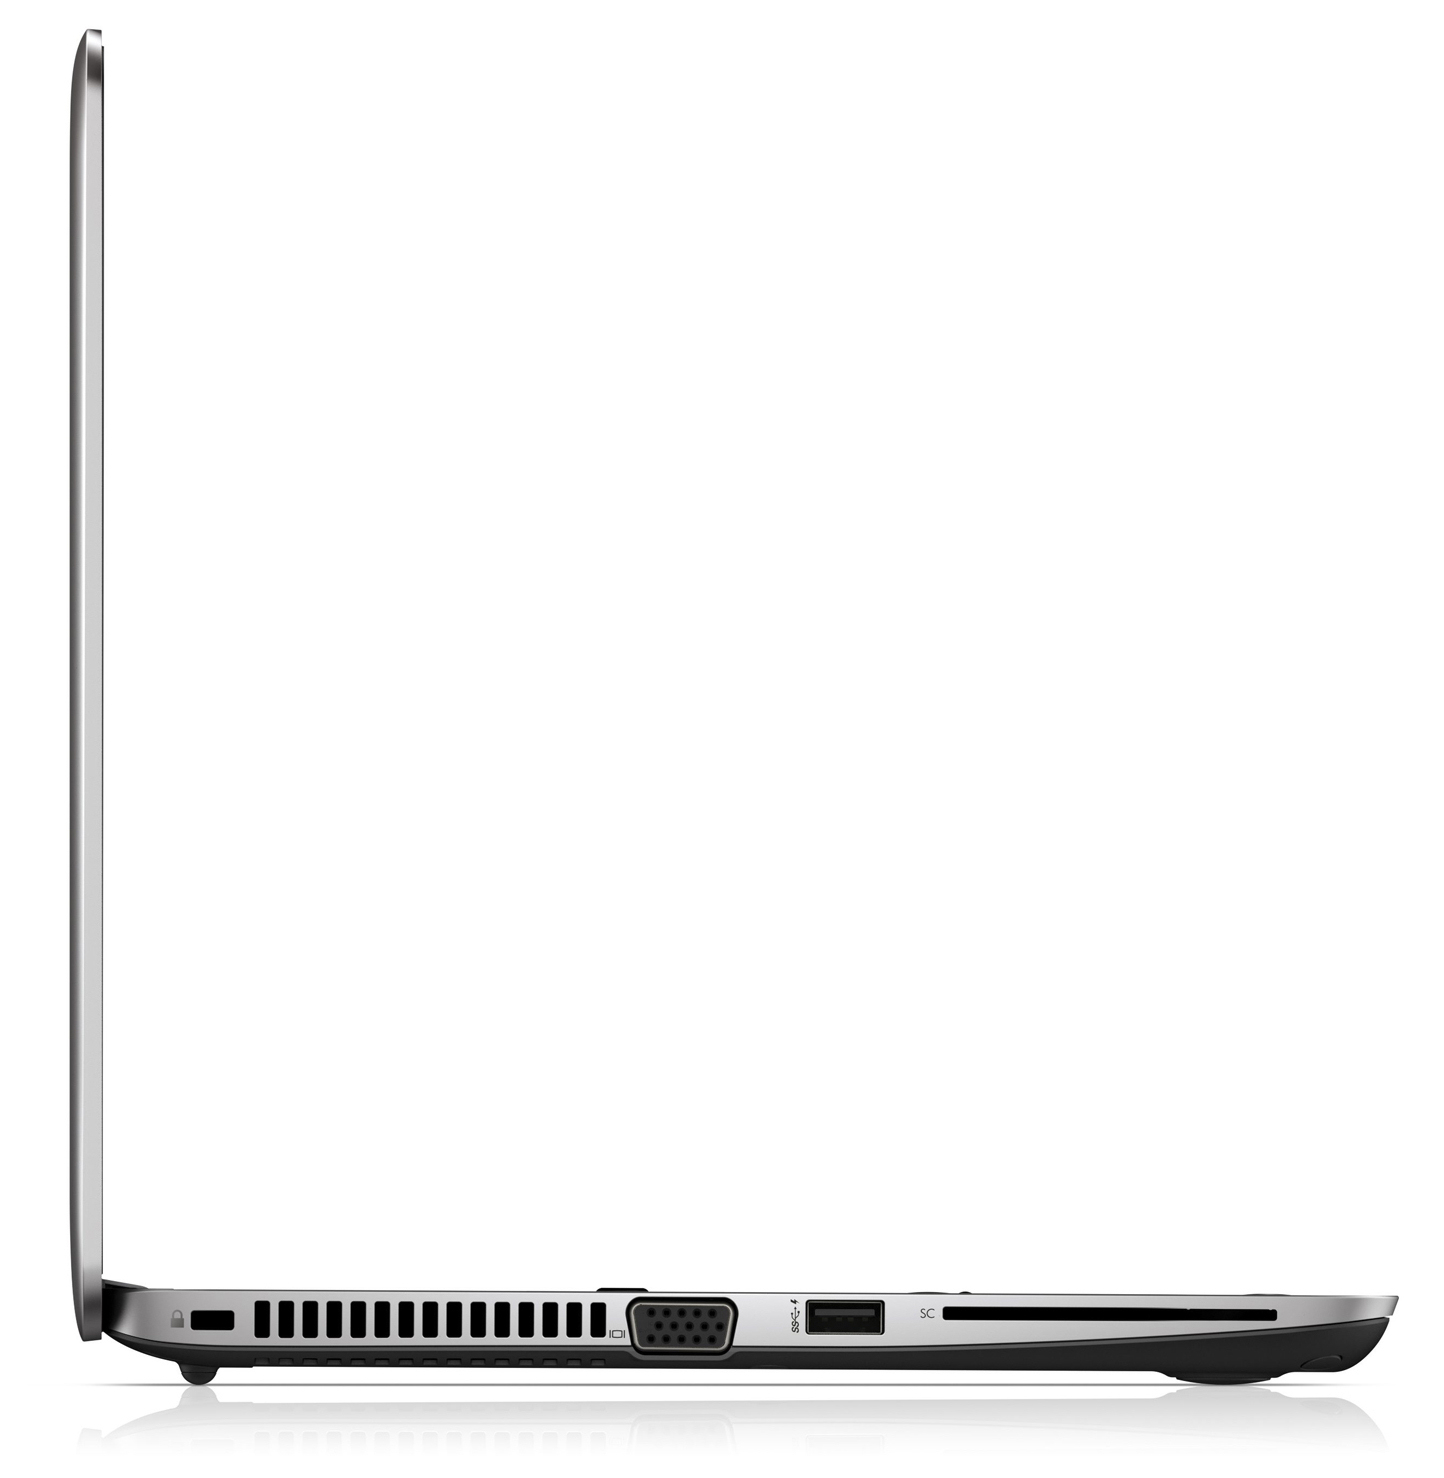
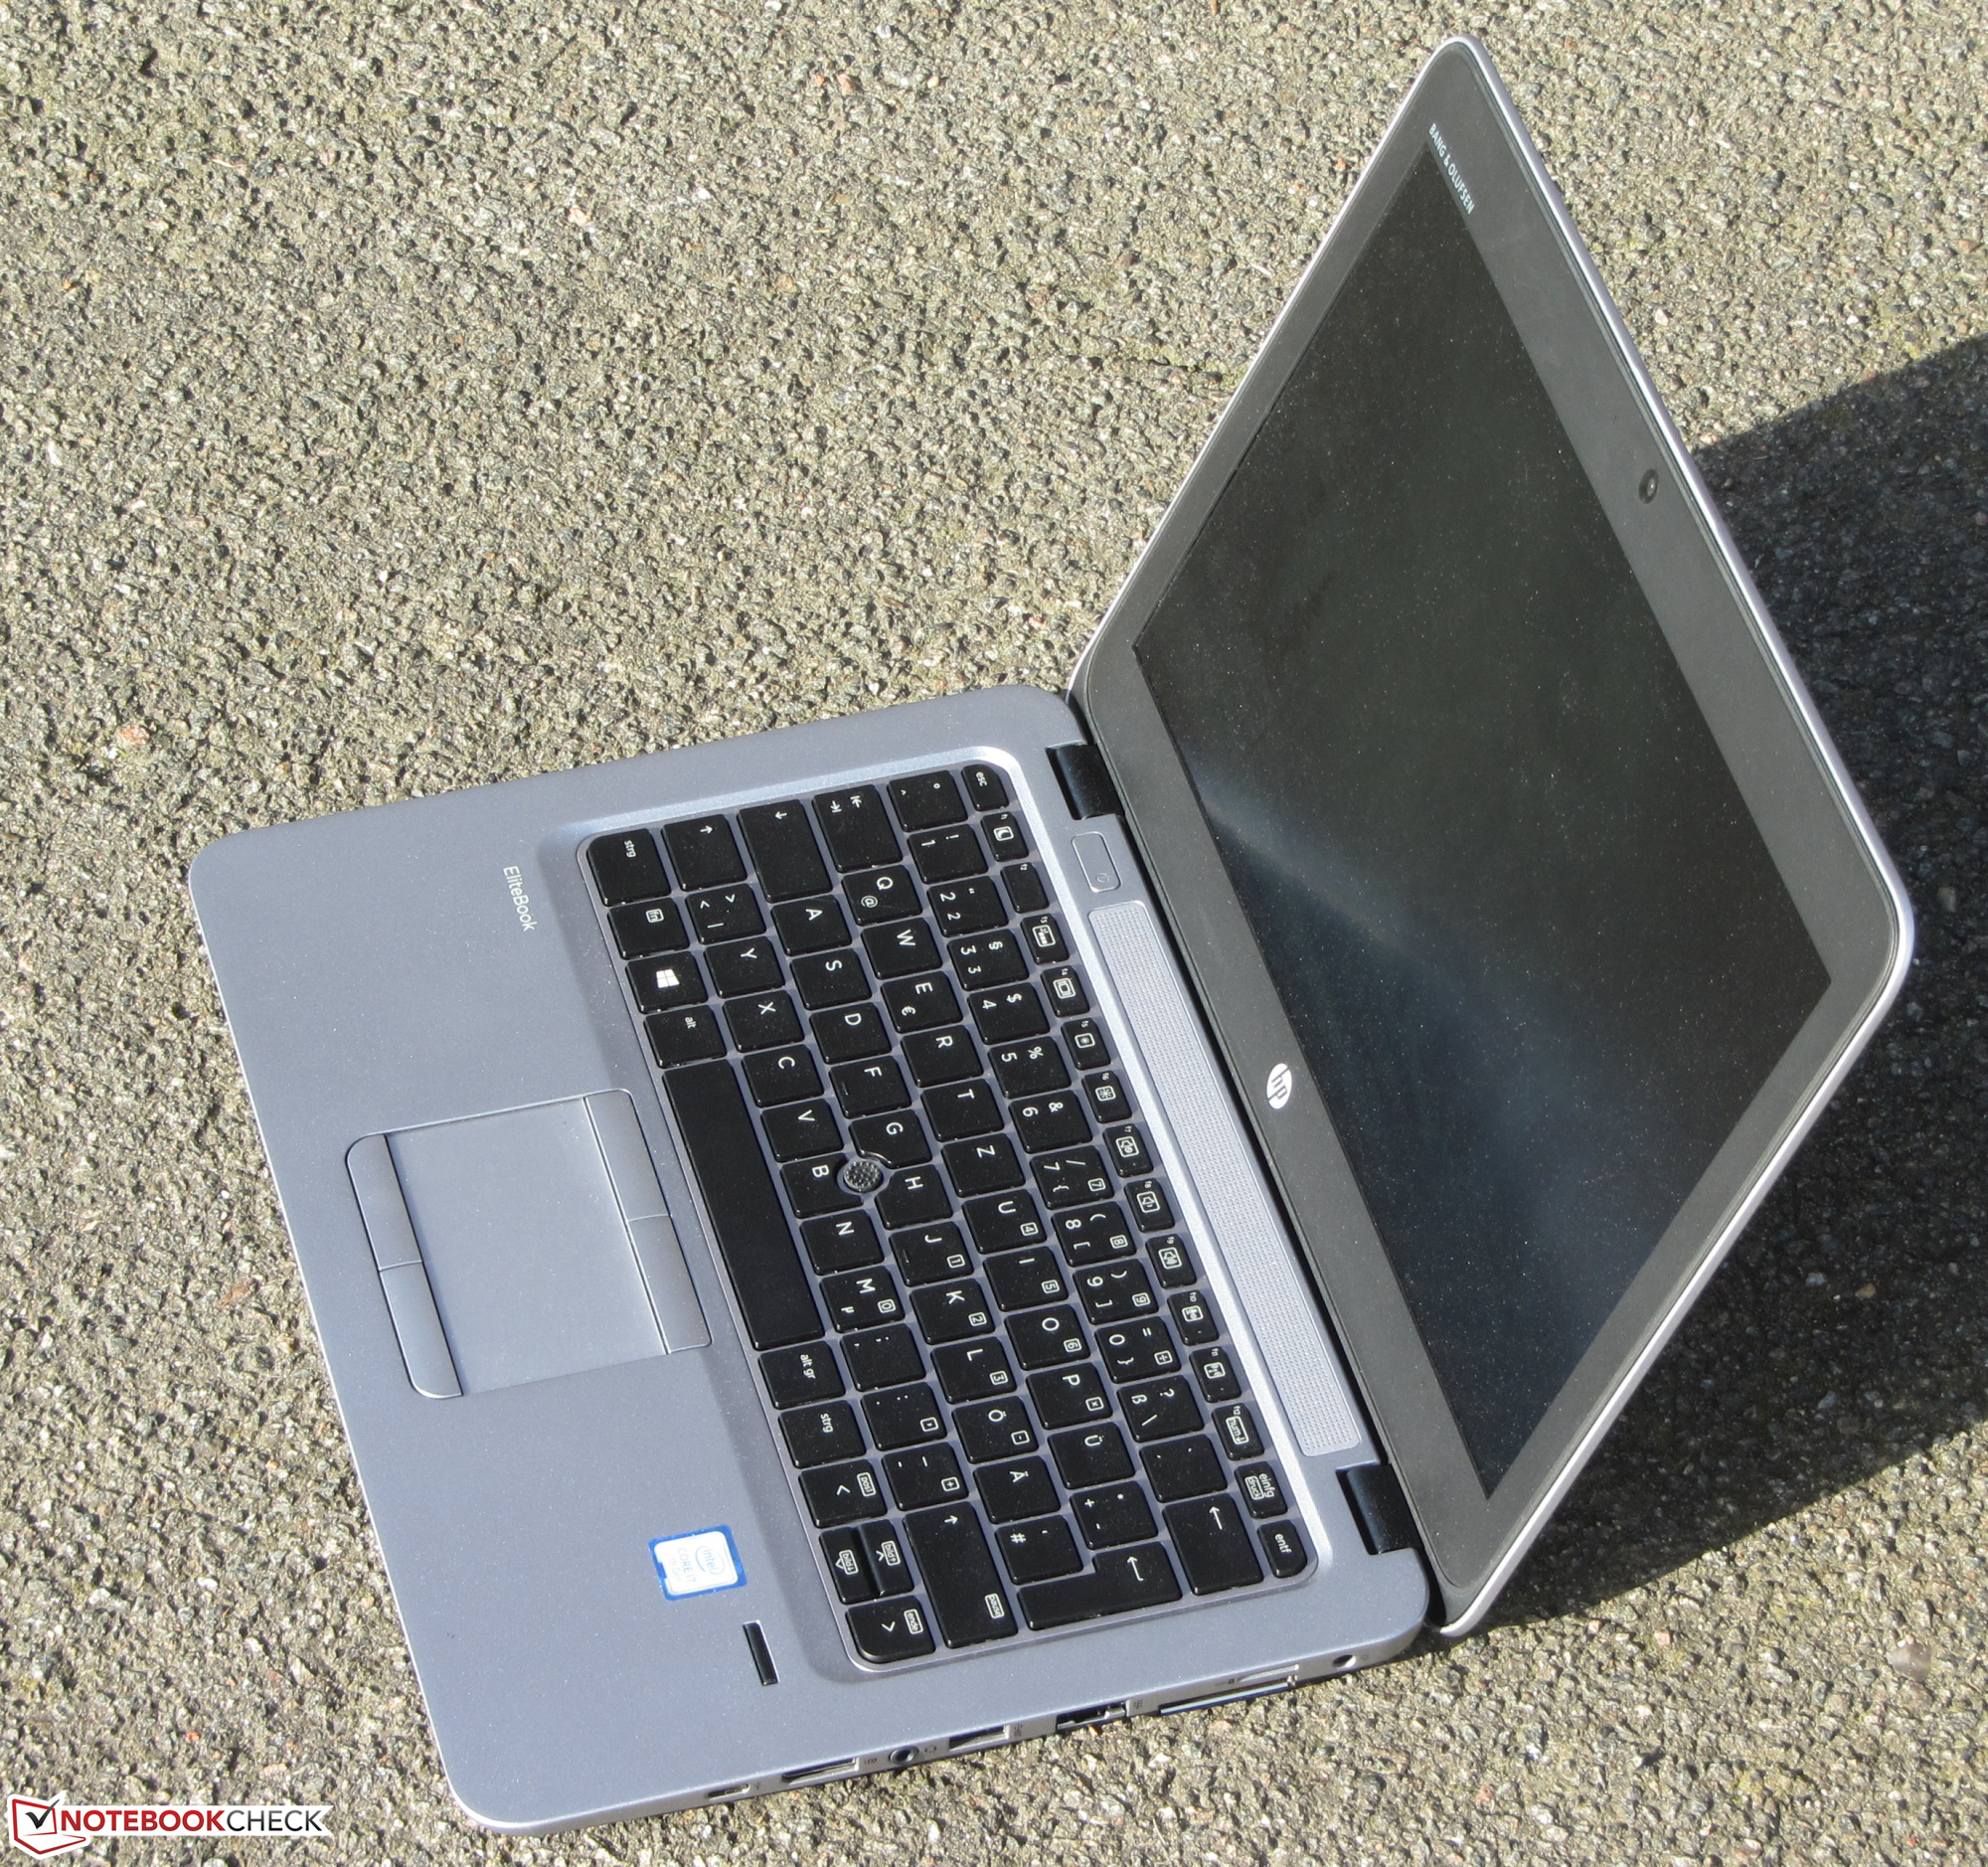
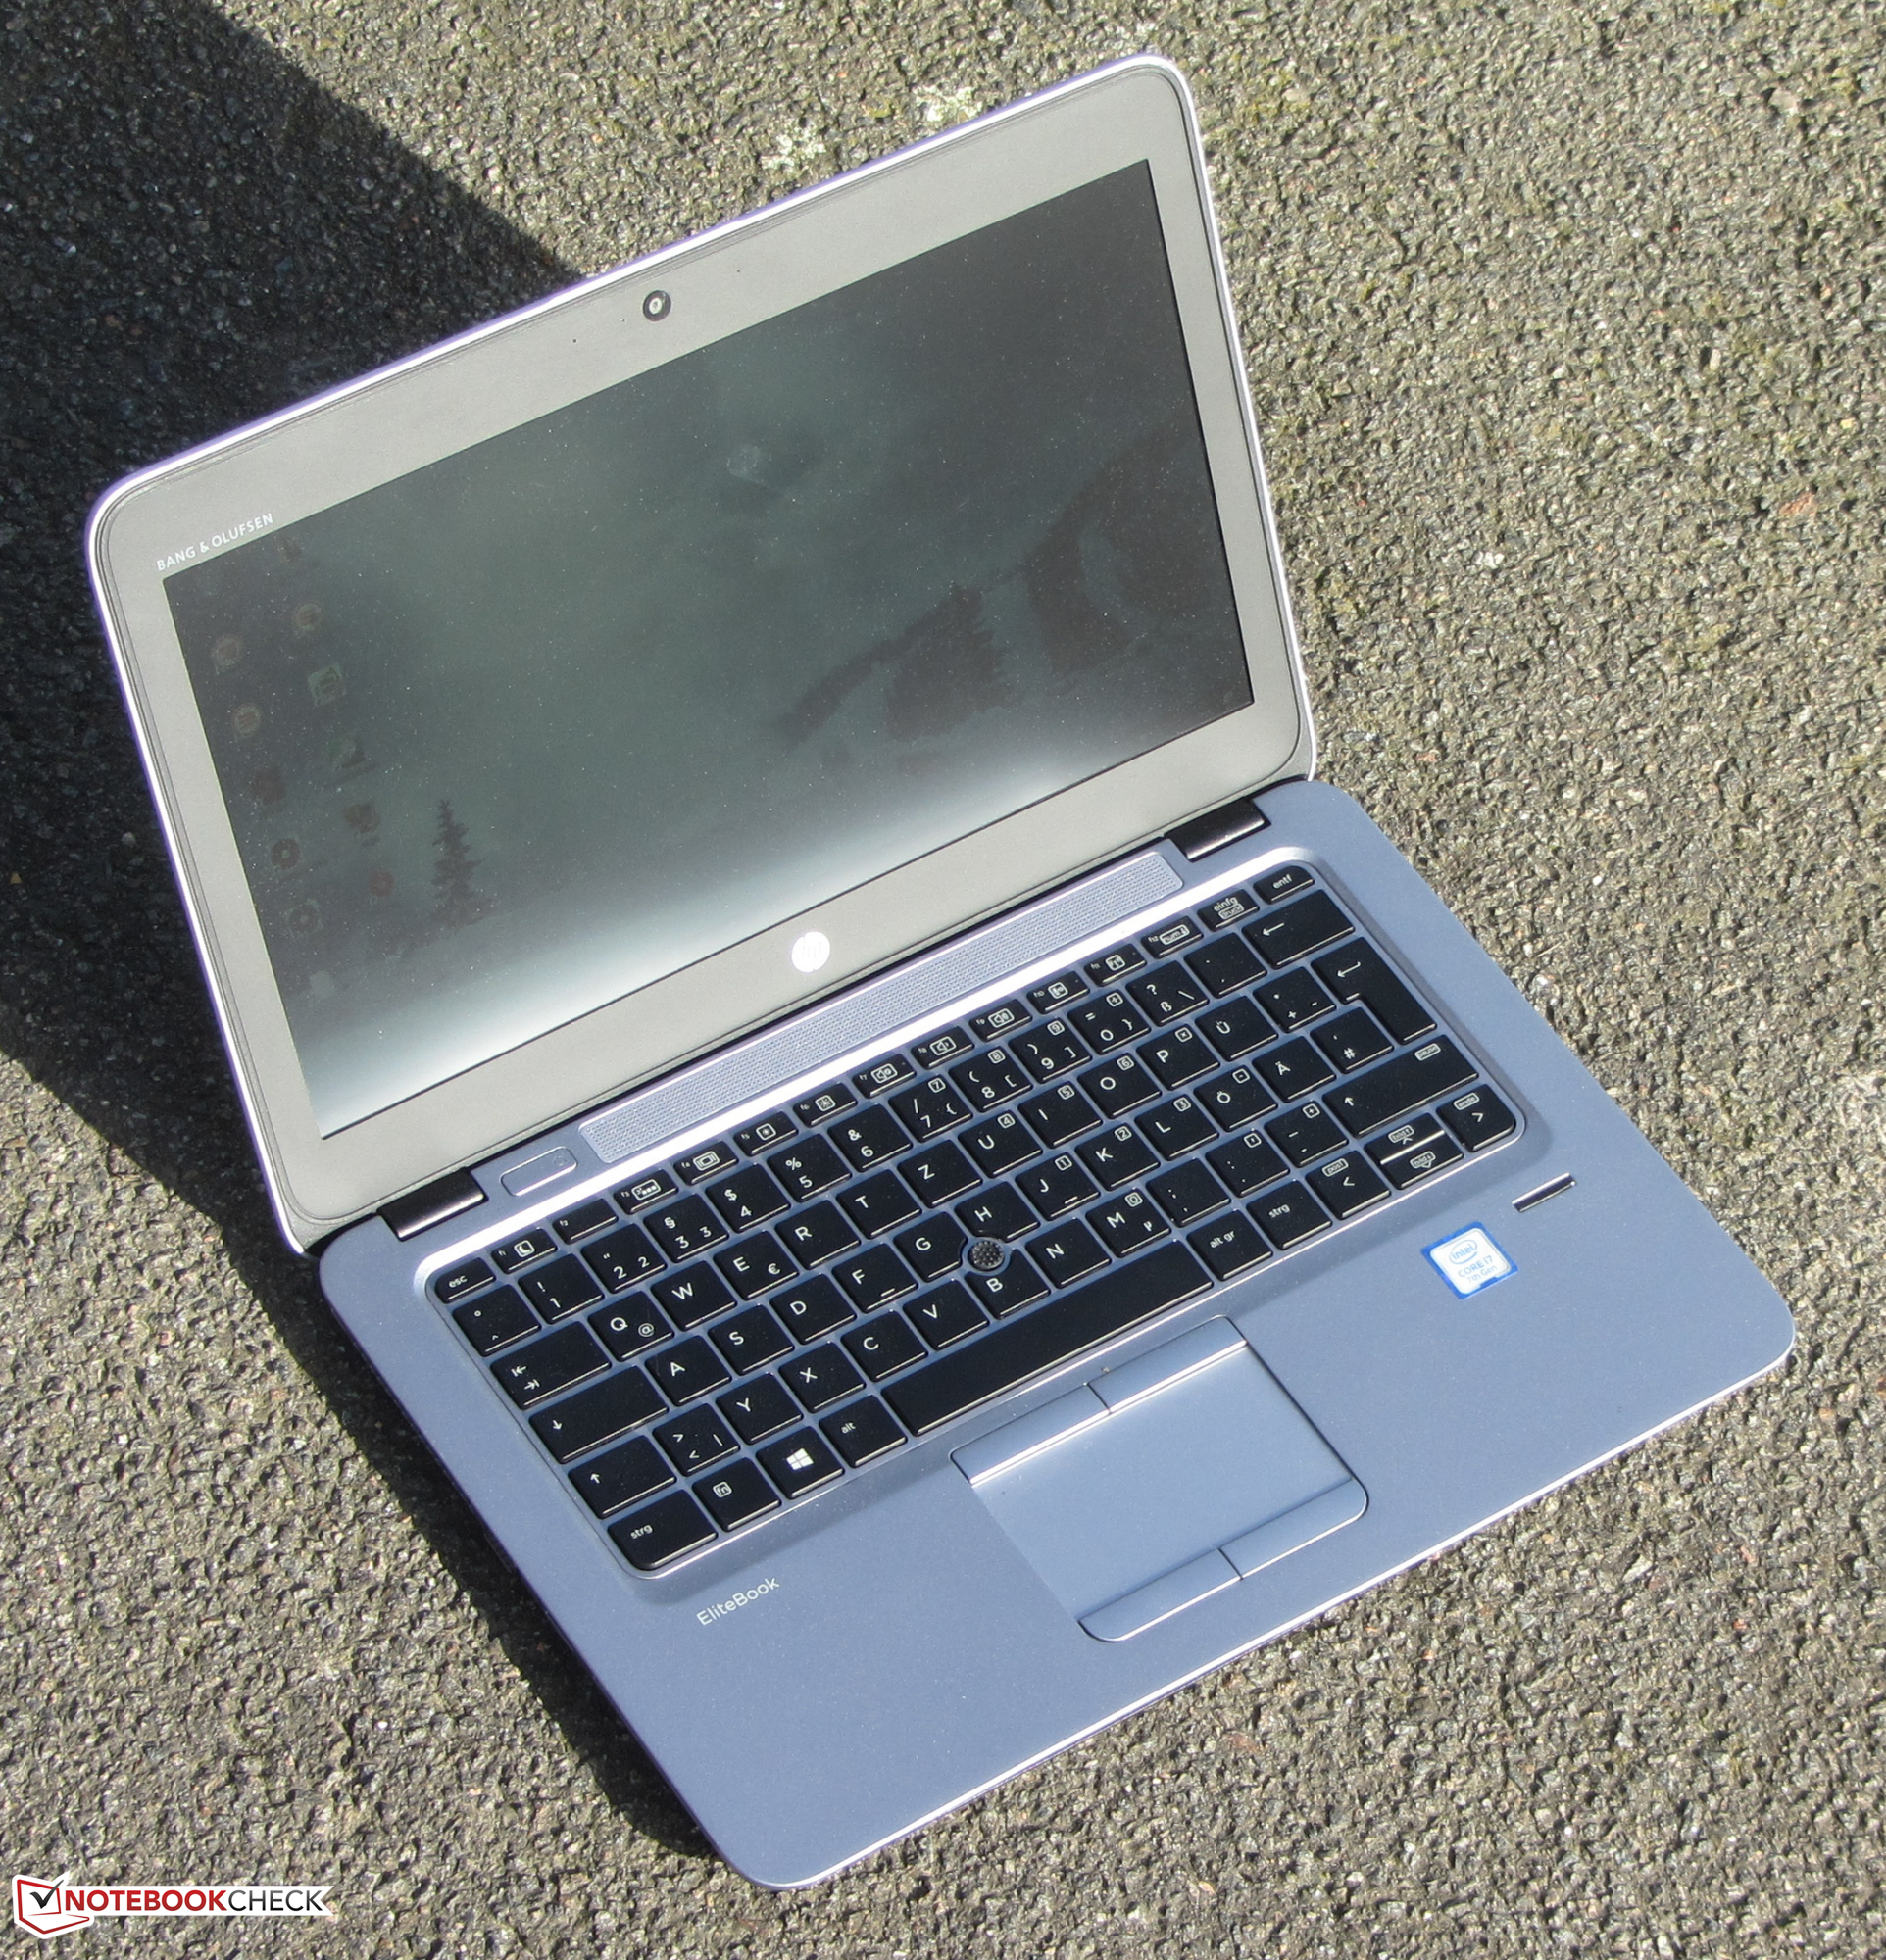
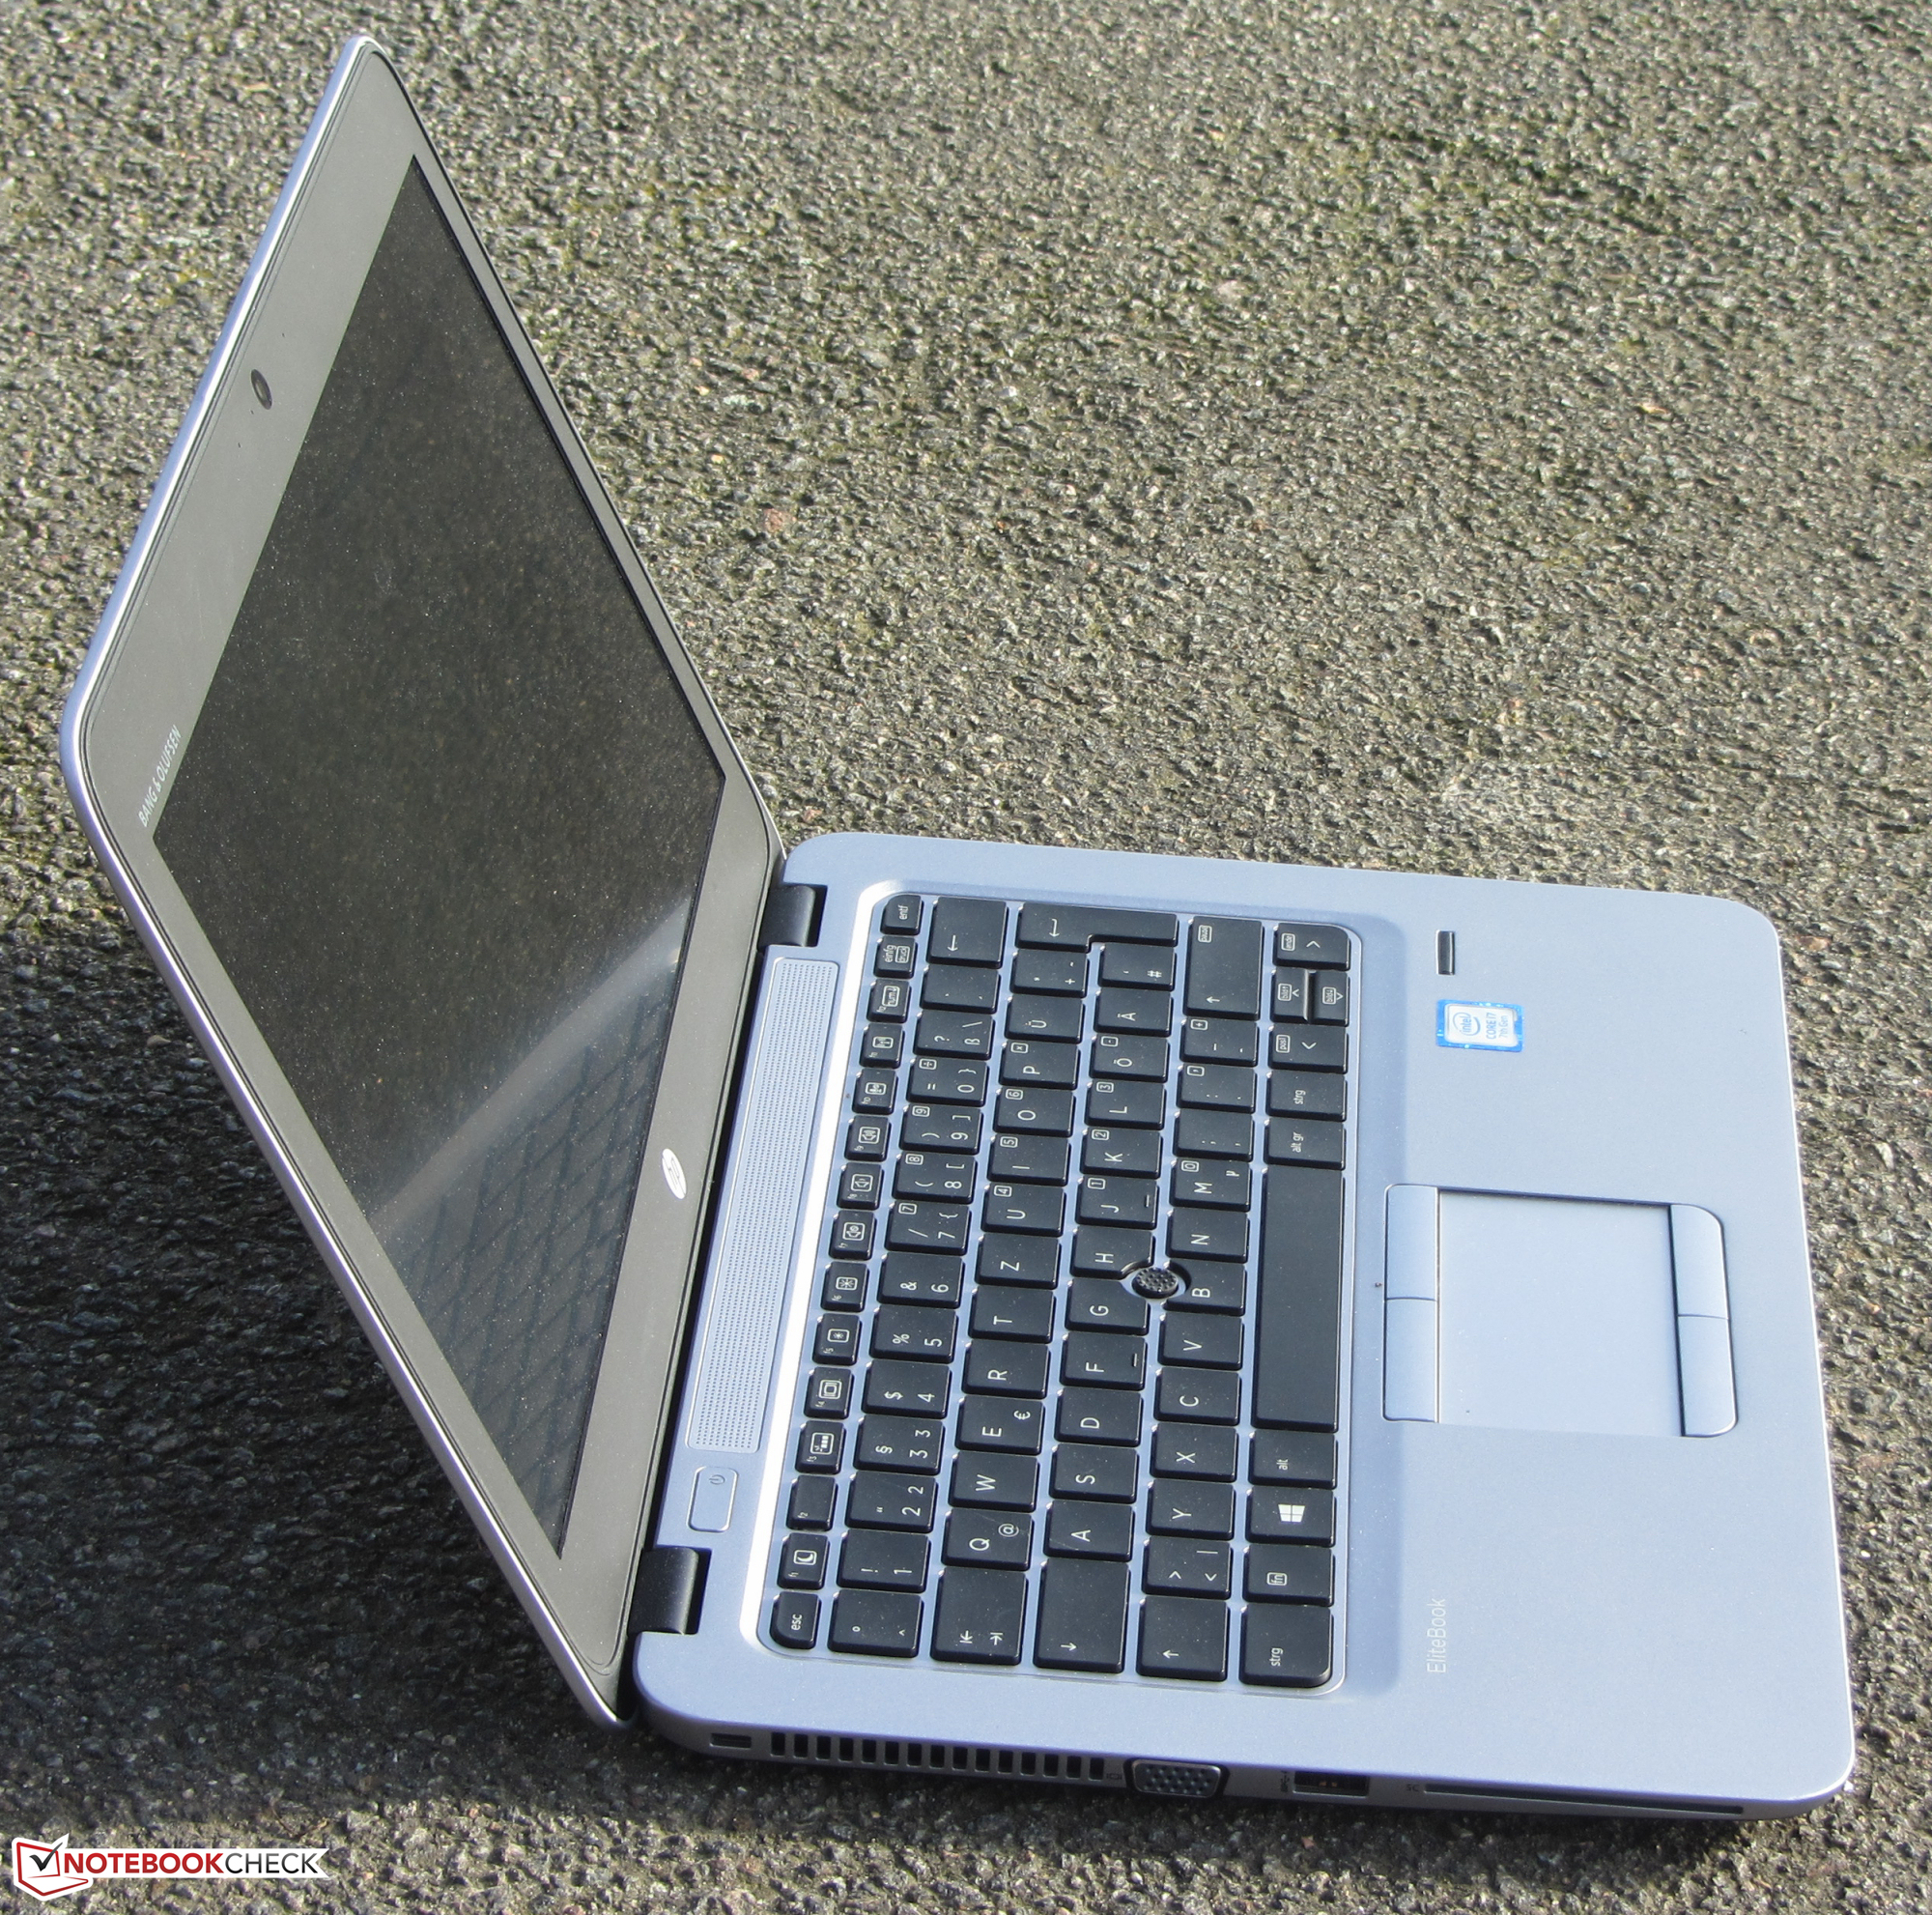
Breve análisis del portátil HP EliteBook 820 G4 (7500U, Full HD)
| SD Card Reader | |
| average JPG Copy Test (av. of 3 runs) | |
| Dell Latitude 12 E7270 | |
| HP EliteBook 820 G4 Z2V72ET | |
| HP EliteBook 820 G3 | |
| Toshiba Portege Z30-C-138 | |
| Lenovo ThinkPad X260-20F6007RGE | |
| HP EliteBook 725 G3-P4T48EA | |
| maximum AS SSD Seq Read Test (1GB) | |
| Dell Latitude 12 E7270 | |
| HP EliteBook 820 G3 | |
| HP EliteBook 820 G4 Z2V72ET | |
| Toshiba Portege Z30-C-138 | |
| Lenovo ThinkPad X260-20F6007RGE | |
| HP EliteBook 725 G3-P4T48EA | |
| Networking | |
| iperf3 transmit AX12 | |
| HP EliteBook 820 G4 Z2V72ET (jseb) | |
| iperf3 receive AX12 | |
| HP EliteBook 820 G4 Z2V72ET (jseb) | |
| iperf Client (transmit) TCP 1 m | |
| Apple MacBook 12 (Early 2016) 1.1 GHz | |
| iperf Server (receive) TCP 1 m | |
| Apple MacBook 12 (Early 2016) 1.1 GHz | |
| |||||||||||||||||||||||||
iluminación: 81 %
Brillo con batería: 328 cd/m²
Contraste: 1124:1 (Negro: 0.29 cd/m²)
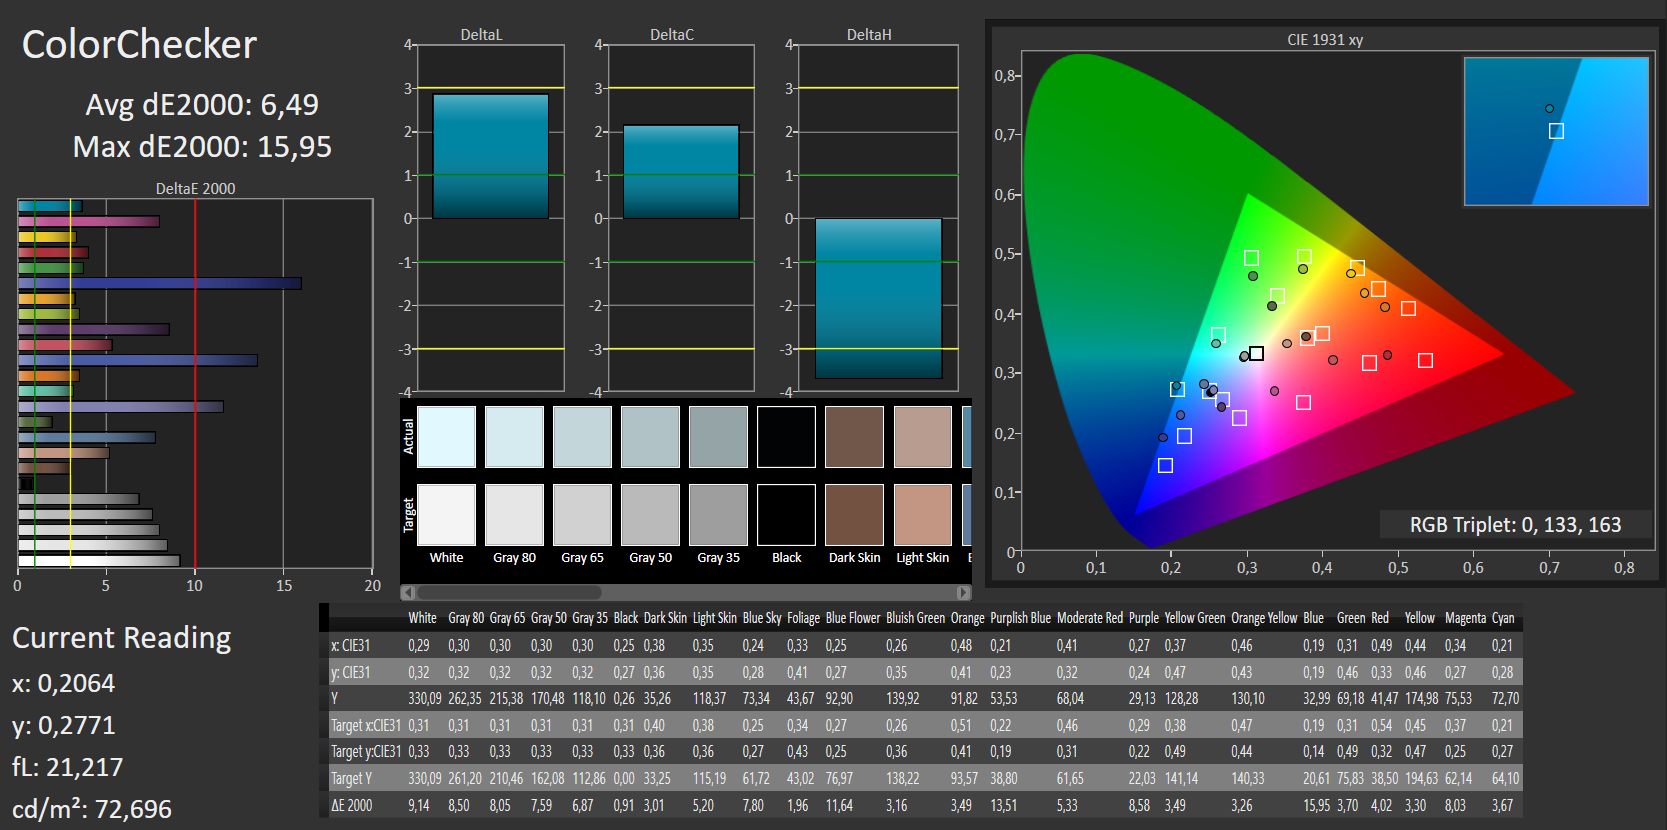
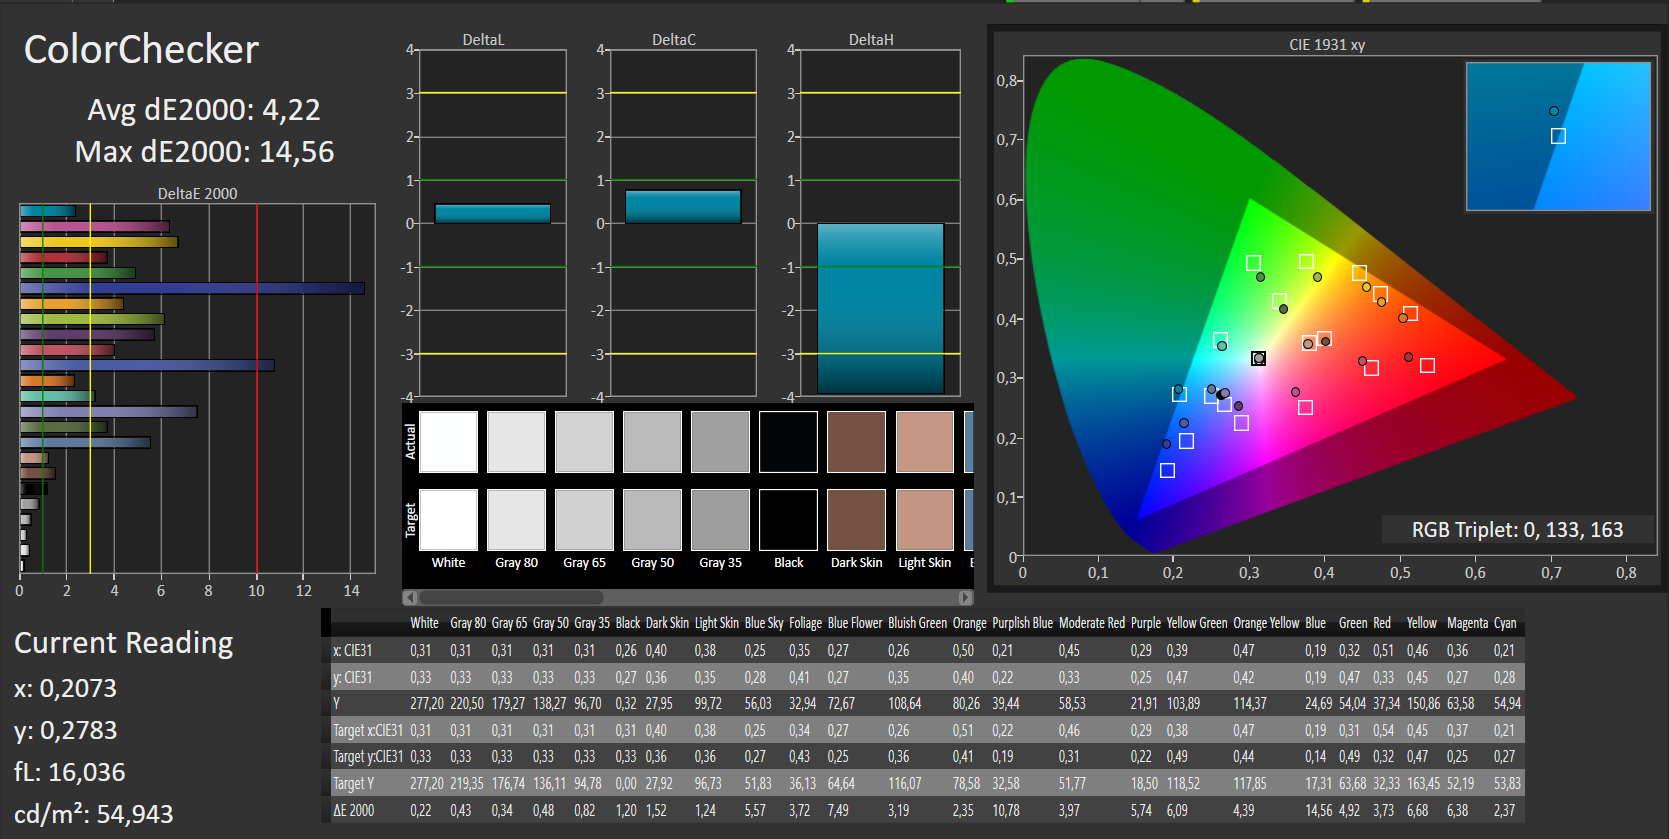
ΔE ColorChecker Calman: 6.49 | ∀{0.5-29.43 Ø4.73}
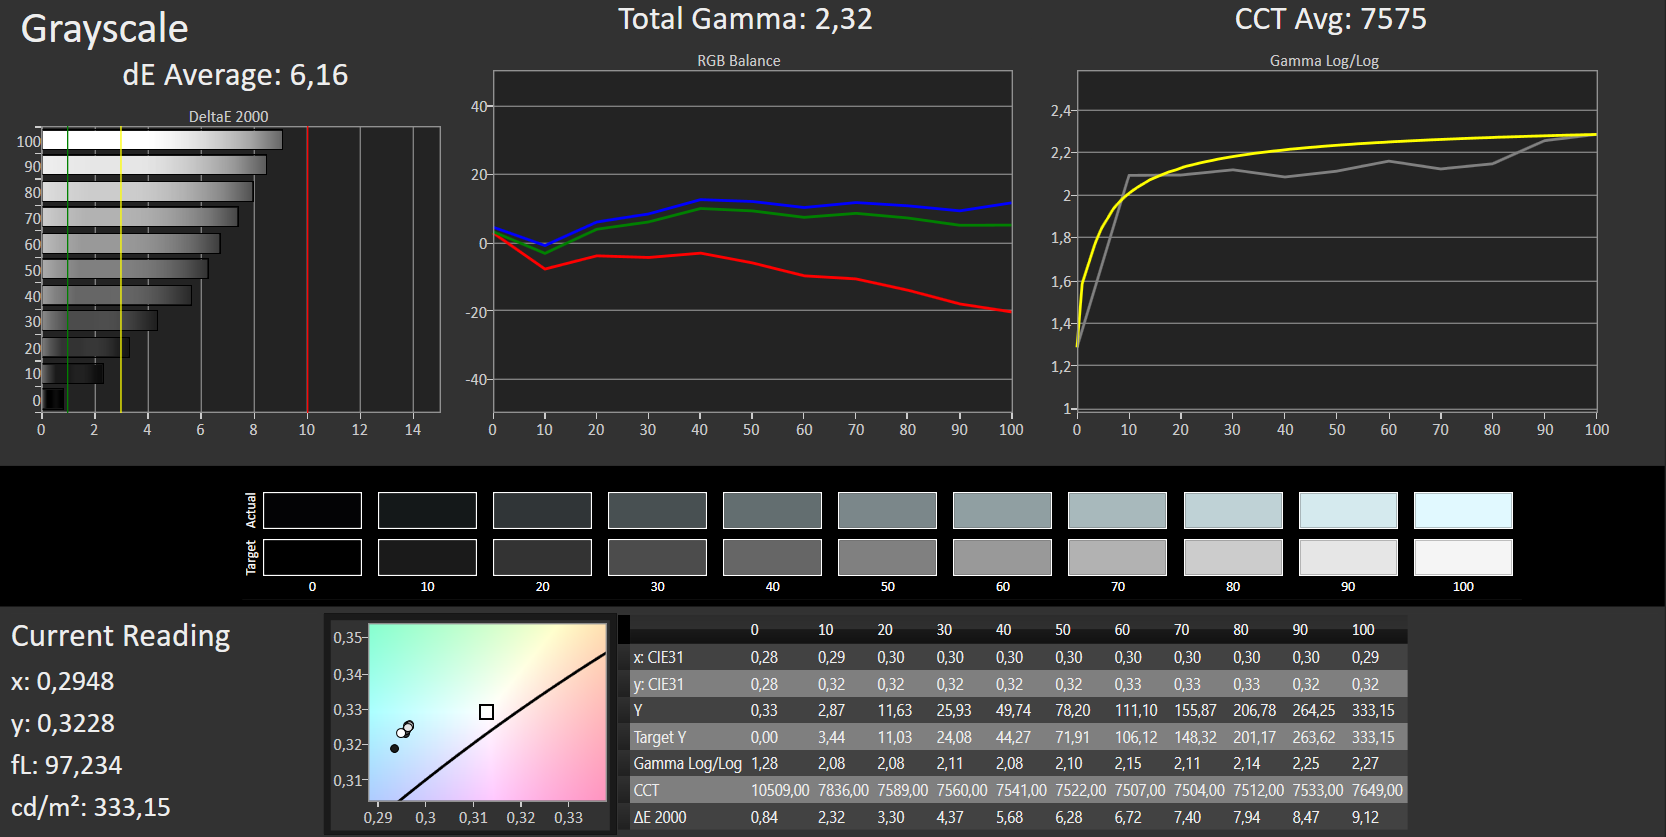
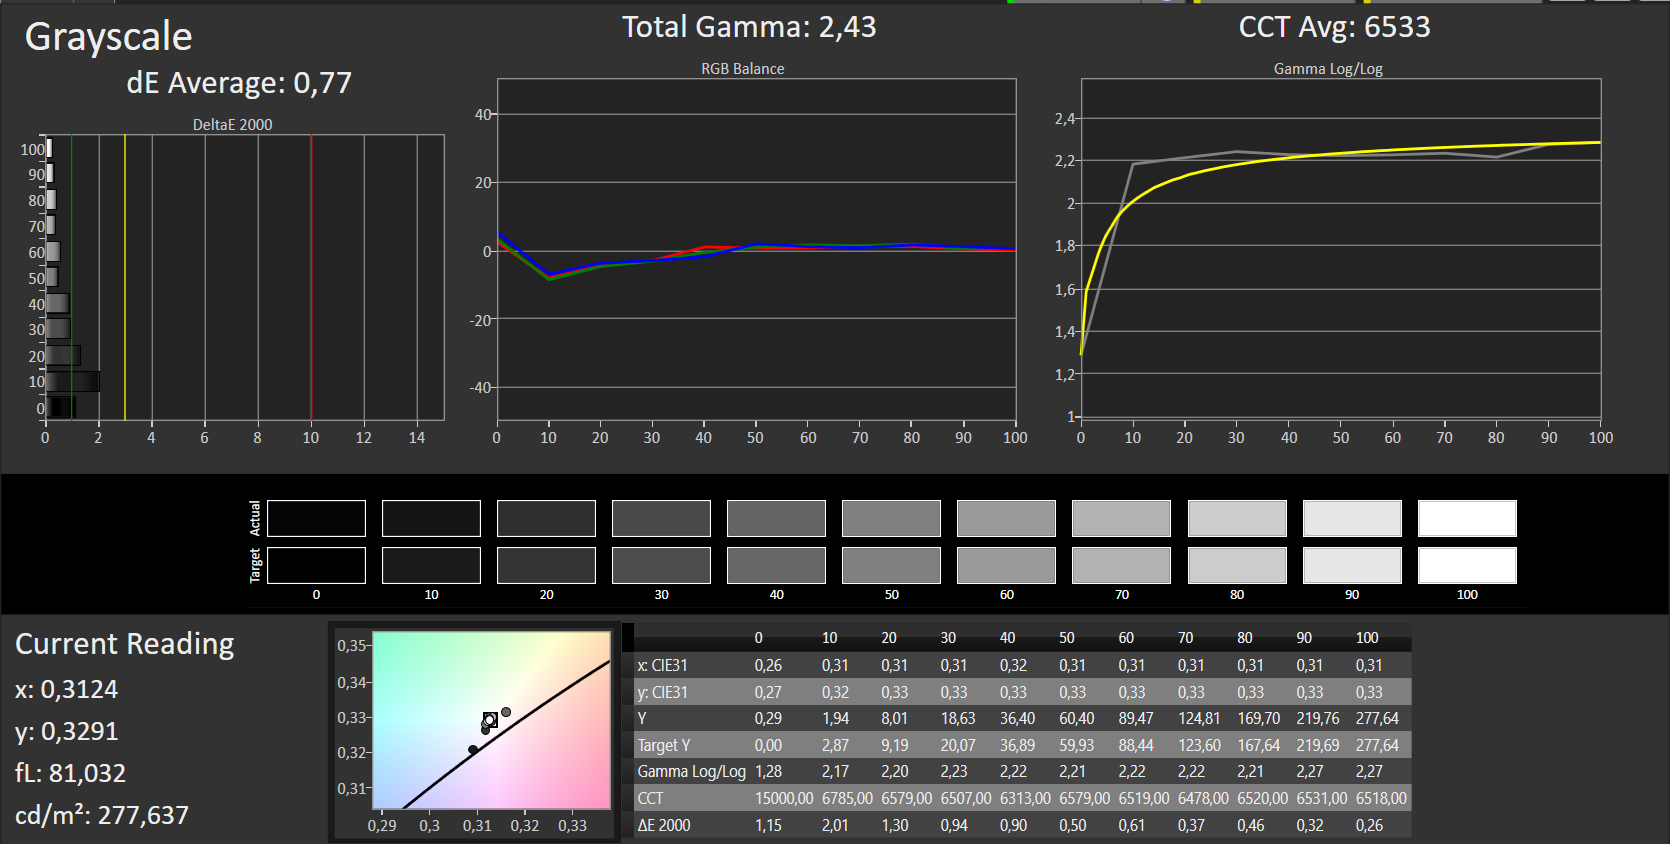
ΔE Greyscale Calman: 6.16 | ∀{0.09-98 Ø4.97}
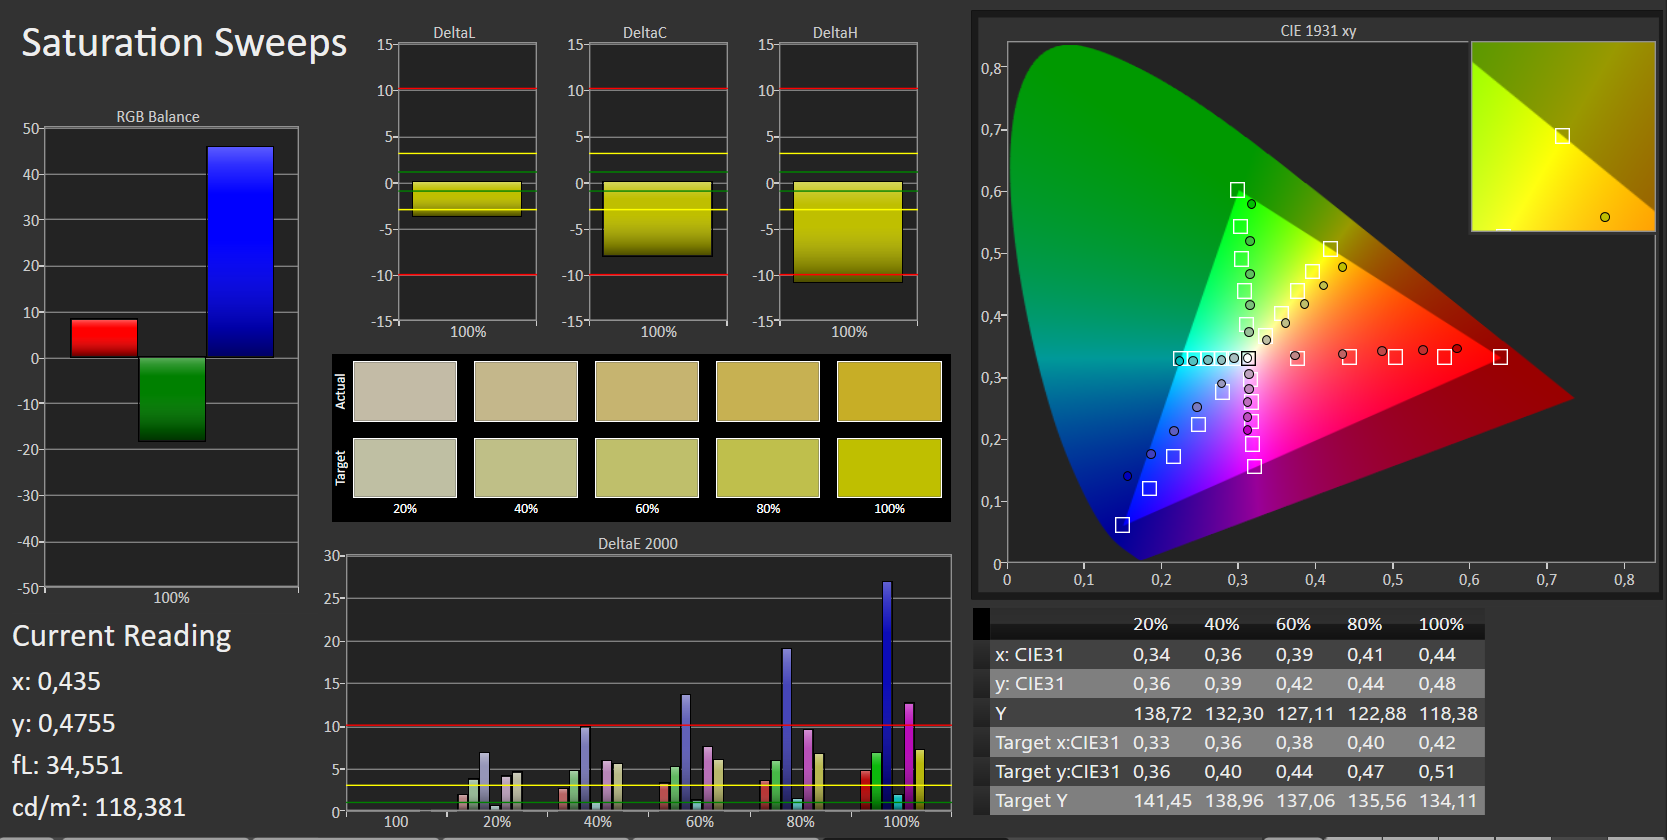
65% sRGB (Argyll 1.6.3 3D)
42% AdobeRGB 1998 (Argyll 1.6.3 3D)
46.04% AdobeRGB 1998 (Argyll 3D)
65.5% sRGB (Argyll 3D)
44.45% Display P3 (Argyll 3D)
Gamma: 2.32
CCT: 7575 K
| HP EliteBook 820 G4 Z2V72ET IPS, 1920x1080, 12.5" | HP EliteBook 820 G3 TN LED, 1366x768, 12.5" | HP EliteBook 725 G3-P4T48EA TN LED, 1366x768, 12.5" | Lenovo ThinkPad X260-20F6007RGE IPS, 1920x1080, 12.5" | Toshiba Portege Z30-C-138 IPS, 1920x1080, 13.3" | Dell Latitude 12 E7270 IPS LED, 1920x1080, 12.5" | Apple MacBook 12 (Early 2016) 1.1 GHz IPS, 2304x1440, 12" | |
|---|---|---|---|---|---|---|---|
| Display | -12% | 7% | 1% | 52% | -11% | 48% | |
| Display P3 Coverage (%) | 44.45 | 38.9 -12% | 47.15 6% | 44.71 1% | 67.9 53% | 39.7 -11% | 66.8 50% |
| sRGB Coverage (%) | 65.5 | 58.5 -11% | 71 8% | 66.1 1% | 98 50% | 59.2 -10% | 95.4 46% |
| AdobeRGB 1998 Coverage (%) | 46.04 | 40.2 -13% | 48.71 6% | 46.23 0% | 69.8 52% | 41.07 -11% | 68 48% |
| Response Times | -39% | -18% | 1% | -14% | -11% | -18% | |
| Response Time Grey 50% / Grey 80% * (ms) | 35 ? | 58 ? -66% | 50 ? -43% | 32.8 ? 6% | 42 ? -20% | 38.4 ? -10% | 41.2 ? -18% |
| Response Time Black / White * (ms) | 26 ? | 29.2 ? -12% | 24 ? 8% | 27.2 ? -5% | 28 ? -8% | 28.8 ? -11% | 30.4 ? -17% |
| PWM Frequency (Hz) | 217 ? | ||||||
| Screen | -33% | -24% | 4% | 13% | -12% | 26% | |
| Brightness middle (cd/m²) | 326 | 244 -25% | 241 -26% | 337 3% | 300 -8% | 353 8% | 387 19% |
| Brightness (cd/m²) | 304 | 240 -21% | 240 -21% | 322 6% | 280 -8% | 334 10% | 358 18% |
| Brightness Distribution (%) | 81 | 84 4% | 83 2% | 91 12% | 87 7% | 91 12% | 88 9% |
| Black Level * (cd/m²) | 0.29 | 0.6 -107% | 0.54 -86% | 0.32 -10% | 0.31 -7% | 0.47 -62% | 0.47 -62% |
| Contrast (:1) | 1124 | 407 -64% | 446 -60% | 1053 -6% | 968 -14% | 751 -33% | 823 -27% |
| Colorchecker dE 2000 * | 6.49 | 9 -39% | 8.04 -24% | 5.71 12% | 4.9 24% | 7.79 -20% | 1.6 75% |
| Colorchecker dE 2000 max. * | 15.95 | 15.73 1% | 13.9 13% | 15.39 4% | 8.91 44% | 15.19 5% | 4 75% |
| Greyscale dE 2000 * | 6.16 | 9.48 -54% | 9.52 -55% | 5.15 16% | 6.69 -9% | 7.38 -20% | 1 84% |
| Gamma | 2.32 95% | 2.44 90% | 2.42 91% | 2.38 92% | 2.33 94% | 2.43 91% | 2.26 97% |
| CCT | 7575 86% | 11116 58% | 11362 57% | 6881 94% | 6487 100% | 6158 106% | 6680 97% |
| Color Space (Percent of AdobeRGB 1998) (%) | 42 | 37.18 -11% | 45.03 7% | 42.38 1% | 63 50% | 37.72 -10% | 61.6 47% |
| Color Space (Percent of sRGB) (%) | 65 | 58.63 -10% | 71.12 9% | 65.62 1% | 98 51% | 58.87 -9% | 82.2 26% |
| Media total (Programa/Opciones) | -28% /
-29% | -12% /
-17% | 2% /
3% | 17% /
17% | -11% /
-11% | 19% /
25% |
* ... más pequeño es mejor
Parpadeo de Pantalla / PWM (Pulse-Width Modulation)
| Parpadeo de Pantalla / PWM no detectado | ||
Comparación: 52 % de todos los dispositivos testados no usaron PWM para atenuar el display. Si se usó, medimos una media de 7794 (mínimo: 5 - máxmo: 343500) Hz. | ||
Tiempos de respuesta del display
| ↔ Tiempo de respuesta de Negro a Blanco | ||
|---|---|---|
| 26 ms ... subida ↗ y bajada ↘ combinada | ↗ 7 ms subida | 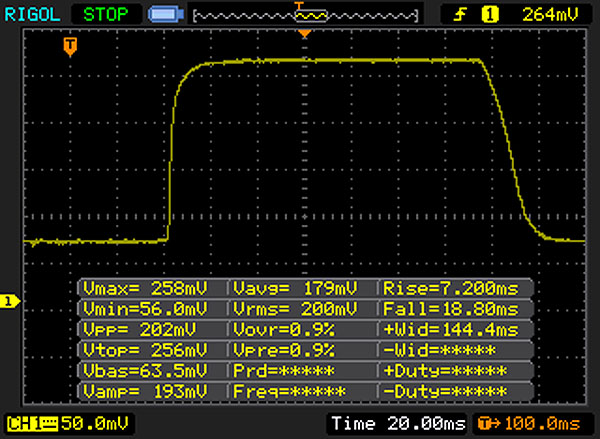 |
| ↘ 19 ms bajada | ||
| La pantalla mostró tiempos de respuesta relativamente lentos en nuestros tests pero podría ser demasiado lenta para los jugones. En comparación, todos los dispositivos de prueba van de ##min### (mínimo) a 240 (máximo) ms. » 62 % de todos los dispositivos son mejores. Eso quiere decir que el tiempo de respuesta es peor que la media (19.9 ms) de todos los dispositivos testados. | ||
| ↔ Tiempo de respuesta 50% Gris a 80% Gris | ||
| 35 ms ... subida ↗ y bajada ↘ combinada | ↗ 16 ms subida |  |
| ↘ 19 ms bajada | ||
| La pantalla mostró tiempos de respuesta lentos en nuestros tests y podría ser demasiado lenta para los jugones. En comparación, todos los dispositivos de prueba van de ##min### (mínimo) a 636 (máximo) ms. » 49 % de todos los dispositivos son mejores. Eso quiere decir que el tiempo de respuesta es peor que la media (31.1 ms) de todos los dispositivos testados. | ||
| Geekbench 3 | |
| 32 Bit Single-Core Score | |
| HP EliteBook 820 G4 Z2V72ET | |
| Lenovo ThinkPad X260-20F6007RGE | |
| HP EliteBook 725 G3-P4T48EA | |
| 32 Bit Multi-Core Score | |
| HP EliteBook 820 G4 Z2V72ET | |
| Lenovo ThinkPad X260-20F6007RGE | |
| HP EliteBook 725 G3-P4T48EA | |
| Geekbench 4.0 | |
| 64 Bit Single-Core Score | |
| HP EliteBook 820 G4 Z2V72ET | |
| 64 Bit Multi-Core Score | |
| HP EliteBook 820 G4 Z2V72ET | |
| PCMark 7 Score | 5376 puntos | |
| PCMark 8 Home Score Accelerated v2 | 3660 puntos | |
| PCMark 8 Creative Score Accelerated v2 | 4631 puntos | |
| PCMark 8 Work Score Accelerated v2 | 4824 puntos | |
ayuda | ||

| HP EliteBook 820 G4 Z2V72ET Samsung PM951 NVMe MZVLV512 | HP EliteBook 820 G3 Samsung SM951 MZVPV256HDGL m.2 PCI-e | Lenovo ThinkPad X260-20F6007RGE Liteonit LCH-512V2S | Toshiba Portege Z30-C-138 Toshiba HG6 THNSNJ512G8NY | Dell Latitude 12 E7270 Liteon L8H-256V2G | Apple MacBook 12 (Early 2016) 1.1 GHz Apple SSD AP0256 | |
|---|---|---|---|---|---|---|
| CrystalDiskMark 3.0 | 23% | -44% | -48% | -50% | -29% | |
| Read Seq (MB/s) | 1315 | 1255 -5% | 499.6 -62% | 518 -61% | 498.4 -62% | 754 -43% |
| Write Seq (MB/s) | 594 | 1240 109% | 403 -32% | 423.3 -29% | 286.7 -52% | 638 7% |
| Read 512 (MB/s) | 661 | 1131 71% | 322.9 -51% | 414.8 -37% | 616 -7% | |
| Write 512 (MB/s) | 594 | 811 37% | 372.4 -37% | 379.9 -36% | 678 14% | |
| Read 4k (MB/s) | 42.87 | 51 19% | 27.22 -37% | 21.17 -51% | 24.89 -42% | 14.6 -66% |
| Write 4k (MB/s) | 151.6 | 134.1 -12% | 83.6 -45% | 86.3 -43% | 88 -42% | 20.5 -86% |
| Read 4k QD32 (MB/s) | 568 | 549 -3% | 316.5 -44% | 227.3 -60% | 280.5 -51% | 464 -18% |
| Write 4k QD32 (MB/s) | 491.7 | 343.9 -30% | 273.1 -44% | 174.7 -64% | 241.9 -51% | 315 -36% |
| 3DMark 06 Standard Score | 7375 puntos | |
| 3DMark 11 Performance | 1645 puntos | |
| 3DMark Ice Storm Standard Score | 56060 puntos | |
| 3DMark Cloud Gate Standard Score | 6084 puntos | |
| 3DMark Fire Strike Score | 822 puntos | |
| 3DMark Fire Strike Extreme Score | 370 puntos | |
ayuda | ||
| bajo | medio | alto | ultra | |
|---|---|---|---|---|
| Tomb Raider (2013) | 70.3 | 36.2 | 21.3 | 10.4 |
| BioShock Infinite (2013) | 41.9 | 25.9 | 21.3 | 6.9 |
| Battlefield 4 (2013) | 33 | 26.9 | 17.4 | 6.1 |
Ruido
| Ocioso |
| 30.7 / 30.7 / 30.7 dB(A) |
| Carga |
| 35.3 / 33.7 dB(A) |
 | ||
30 dB silencioso 40 dB(A) audible 50 dB(A) ruidosamente alto |
||
min: | ||
| HP EliteBook 820 G4 Z2V72ET i7-7500U, HD Graphics 620 | HP EliteBook 820 G3 6300U, HD Graphics 520 | HP EliteBook 725 G3-P4T48EA Pro A10-8700B, Radeon R6 (Carrizo) | Lenovo ThinkPad X260-20F6007RGE 6500U, HD Graphics 520 | Toshiba Portege Z30-C-138 6500U, HD Graphics 520 | Dell Latitude 12 E7270 6300U, HD Graphics 520 | |
|---|---|---|---|---|---|---|
| Noise | 2% | -2% | 2% | -10% | 4% | |
| apagado / medio ambiente * (dB) | 30.7 | 29.2 5% | 28.9 6% | 29 6% | 31.2 -2% | 28.9 6% |
| Idle Minimum * (dB) | 30.7 | 29.2 5% | 30.5 1% | 29 6% | 31.2 -2% | 28.9 6% |
| Idle Average * (dB) | 30.7 | 29.2 5% | 30.5 1% | 29 6% | 31.2 -2% | 28.9 6% |
| Idle Maximum * (dB) | 30.7 | 29.2 5% | 30.5 1% | 29 6% | 31.2 -2% | 28.9 6% |
| Load Average * (dB) | 35.3 | 35.6 -1% | 38.2 -8% | 35.1 1% | 43.3 -23% | 31.3 11% |
| Load Maximum * (dB) | 33.7 | 37 -10% | 38.4 -14% | 37.8 -12% | 43.3 -28% | 37.6 -12% |
* ... más pequeño es mejor
(+) La temperatura máxima en la parte superior es de 37 °C / 99 F, frente a la media de 35.9 °C / 97 F, que oscila entre 21.4 y 59 °C para la clase Subnotebook.
(+) El fondo se calienta hasta un máximo de 38.9 °C / 102 F, frente a la media de 39.2 °C / 103 F
(+) En reposo, la temperatura media de la parte superior es de 25.7 °C / 78# F, frente a la media del dispositivo de 30.8 °C / 87 F.
(+) El reposamanos y el panel táctil están a una temperatura inferior a la de la piel, con un máximo de 27.8 °C / 82 F y, por tanto, son fríos al tacto.
(±) La temperatura media de la zona del reposamanos de dispositivos similares fue de 28.2 °C / 82.8 F (+0.4 °C / 0.8 F).
| HP EliteBook 820 G4 Z2V72ET i7-7500U, HD Graphics 620 | HP EliteBook 820 G3 6300U, HD Graphics 520 | HP EliteBook 725 G3-P4T48EA Pro A10-8700B, Radeon R6 (Carrizo) | Lenovo ThinkPad X260-20F6007RGE 6500U, HD Graphics 520 | Toshiba Portege Z30-C-138 6500U, HD Graphics 520 | Dell Latitude 12 E7270 6300U, HD Graphics 520 | Apple MacBook 12 (Early 2016) 1.1 GHz 6Y30, HD Graphics 515 | |
|---|---|---|---|---|---|---|---|
| Heat | -9% | -29% | -27% | 3% | -27% | -15% | |
| Maximum Upper Side * (°C) | 37 | 39.6 -7% | 42.8 -16% | 47.5 -28% | 40.6 -10% | 44.3 -20% | 39 -5% |
| Maximum Bottom * (°C) | 38.9 | 40.1 -3% | 54.3 -40% | 43.6 -12% | 37 5% | 52.6 -35% | 44 -13% |
| Idle Upper Side * (°C) | 26.3 | 29.4 -12% | 33.2 -26% | 34.9 -33% | 24.5 7% | 32.3 -23% | 32 -22% |
| Idle Bottom * (°C) | 27 | 30.6 -13% | 36.5 -35% | 35.9 -33% | 24.9 8% | 35.1 -30% | 32 -19% |
* ... más pequeño es mejor
HP EliteBook 820 G4 Z2V72ET análisis de audio
(-) | altavoces no muy altos (#66 dB)
Graves 100 - 315 Hz
(±) | lubina reducida - en promedio 14.6% inferior a la mediana
(±) | la linealidad de los graves es media (7.6% delta a frecuencia anterior)
Medios 400 - 2000 Hz
(+) | medios equilibrados - a sólo 1.1% de la mediana
(+) | los medios son lineales (4.7% delta a la frecuencia anterior)
Altos 2 - 16 kHz
(±) | máximos más altos - de media 5.8% más altos que la mediana
(+) | los máximos son lineales (5% delta a la frecuencia anterior)
Total 100 - 16.000 Hz
(±) | la linealidad del sonido global es media (17.6% de diferencia con la mediana)
En comparación con la misma clase
» 48% de todos los dispositivos probados de esta clase eran mejores, 7% similares, 45% peores
» El mejor tuvo un delta de 5%, la media fue 18%, el peor fue ###max##%
En comparación con todos los dispositivos probados
» 34% de todos los dispositivos probados eran mejores, 8% similares, 57% peores
» El mejor tuvo un delta de 4%, la media fue 24%, el peor fue ###max##%
Apple MacBook 12 (Early 2016) 1.1 GHz análisis de audio
(+) | los altavoces pueden reproducir a un volumen relativamente alto (#83.6 dB)
Graves 100 - 315 Hz
(±) | lubina reducida - en promedio 11.3% inferior a la mediana
(±) | la linealidad de los graves es media (14.2% delta a frecuencia anterior)
Medios 400 - 2000 Hz
(+) | medios equilibrados - a sólo 2.4% de la mediana
(+) | los medios son lineales (5.5% delta a la frecuencia anterior)
Altos 2 - 16 kHz
(+) | máximos equilibrados - a sólo 2% de la mediana
(+) | los máximos son lineales (4.5% delta a la frecuencia anterior)
Total 100 - 16.000 Hz
(+) | el sonido global es lineal (10.2% de diferencia con la mediana)
En comparación con la misma clase
» 7% de todos los dispositivos probados de esta clase eran mejores, 2% similares, 91% peores
» El mejor tuvo un delta de 5%, la media fue 18%, el peor fue ###max##%
En comparación con todos los dispositivos probados
» 5% de todos los dispositivos probados eran mejores, 1% similares, 94% peores
» El mejor tuvo un delta de 4%, la media fue 24%, el peor fue ###max##%
| Off / Standby | |
| Ocioso | |
| Carga |
|
Clave:
min: | |
| HP EliteBook 820 G4 Z2V72ET i7-7500U, HD Graphics 620 | HP EliteBook 820 G3 6300U, HD Graphics 520 | HP EliteBook 725 G3-P4T48EA Pro A10-8700B, Radeon R6 (Carrizo) | Lenovo ThinkPad X260-20F6007RGE 6500U, HD Graphics 520 | Toshiba Portege Z30-C-138 6500U, HD Graphics 520 | Dell Latitude 12 E7270 6300U, HD Graphics 520 | Apple MacBook 12 (Early 2016) 1.1 GHz 6Y30, HD Graphics 515 | |
|---|---|---|---|---|---|---|---|
| Power Consumption | -14% | -70% | -19% | -37% | -18% | 17% | |
| Idle Minimum * (Watt) | 2.7 | 3.5 -30% | 5.4 -100% | 3.5 -30% | 3.2 -19% | 3.8 -41% | 2.7 -0% |
| Idle Average * (Watt) | 4.8 | 5.4 -13% | 7.5 -56% | 5.5 -15% | 7.8 -63% | 6.7 -40% | 2.7 44% |
| Idle Maximum * (Watt) | 6.6 | 6.2 6% | 13 -97% | 6.7 -2% | 8.7 -32% | 7.2 -9% | 7.2 -9% |
| Load Average * (Watt) | 28.5 | 27.3 4% | 41.2 -45% | 28.9 -1% | 42.2 -48% | 27.2 5% | 22 23% |
| Load Maximum * (Watt) | 29 | 39.5 -36% | 44.7 -54% | 42.1 -45% | 35.7 -23% | 30.2 -4% | 20.5 29% |
* ... más pequeño es mejor
| HP EliteBook 820 G4 Z2V72ET i7-7500U, HD Graphics 620, 49 Wh | HP EliteBook 820 G3 6300U, HD Graphics 520, 44 Wh | HP EliteBook 725 G3-P4T48EA Pro A10-8700B, Radeon R6 (Carrizo), 44 Wh | Lenovo ThinkPad X260-20F6007RGE 6500U, HD Graphics 520, 46 Wh | Toshiba Portege Z30-C-138 6500U, HD Graphics 520, 52 Wh | Dell Latitude 12 E7270 6300U, HD Graphics 520, 55 Wh | Apple MacBook 12 (Early 2016) 1.1 GHz 6Y30, HD Graphics 515, 41.4 Wh | |
|---|---|---|---|---|---|---|---|
| Duración de Batería | -27% | -55% | -27% | -38% | -19% | 0% | |
| Reader / Idle (h) | 22.4 | 13.8 -38% | 9.2 -59% | 15.9 -29% | 17.5 -22% | ||
| H.264 (h) | 8.9 | 8.3 -7% | 4.3 -52% | 7.8 -12% | 8.5 -4% | ||
| WiFi v1.3 (h) | 9.4 | 6.2 -34% | 4.7 -50% | 8.4 -11% | 5.8 -38% | 8.5 -10% | 8.4 -11% |
| Load (h) | 3.4 | 2.4 -29% | 1.4 -59% | 1.5 -56% | 2.6 -24% | 3.9 15% |
Pro
Contra
Incluso aunque el HP EliteBook 820 G4 sea solo una actualización Kaby Lake, podría resultar interesante para los poseedores del predecesor. Sin embargo, esto no es solo por el mayor rendimiento de Kaby Lake ante Skylake.
Una duración de batería significativamente mayor hace (aún más) atractivo este ordenador.
Independientemente de la carga de trabajo, el ordenador se mantiene en buena temperatura y funciona de forma silenciosa la mayor parte del tiempo. Esto último es cierto mientras que el ventilador no funcione o lo haga a baja velocidad. De otra forma se escucha un ligero silbido. Esto no debería ocurrir en dispositivos de este precio; más aún después de que esto fuera ya criticado en su predecesor.
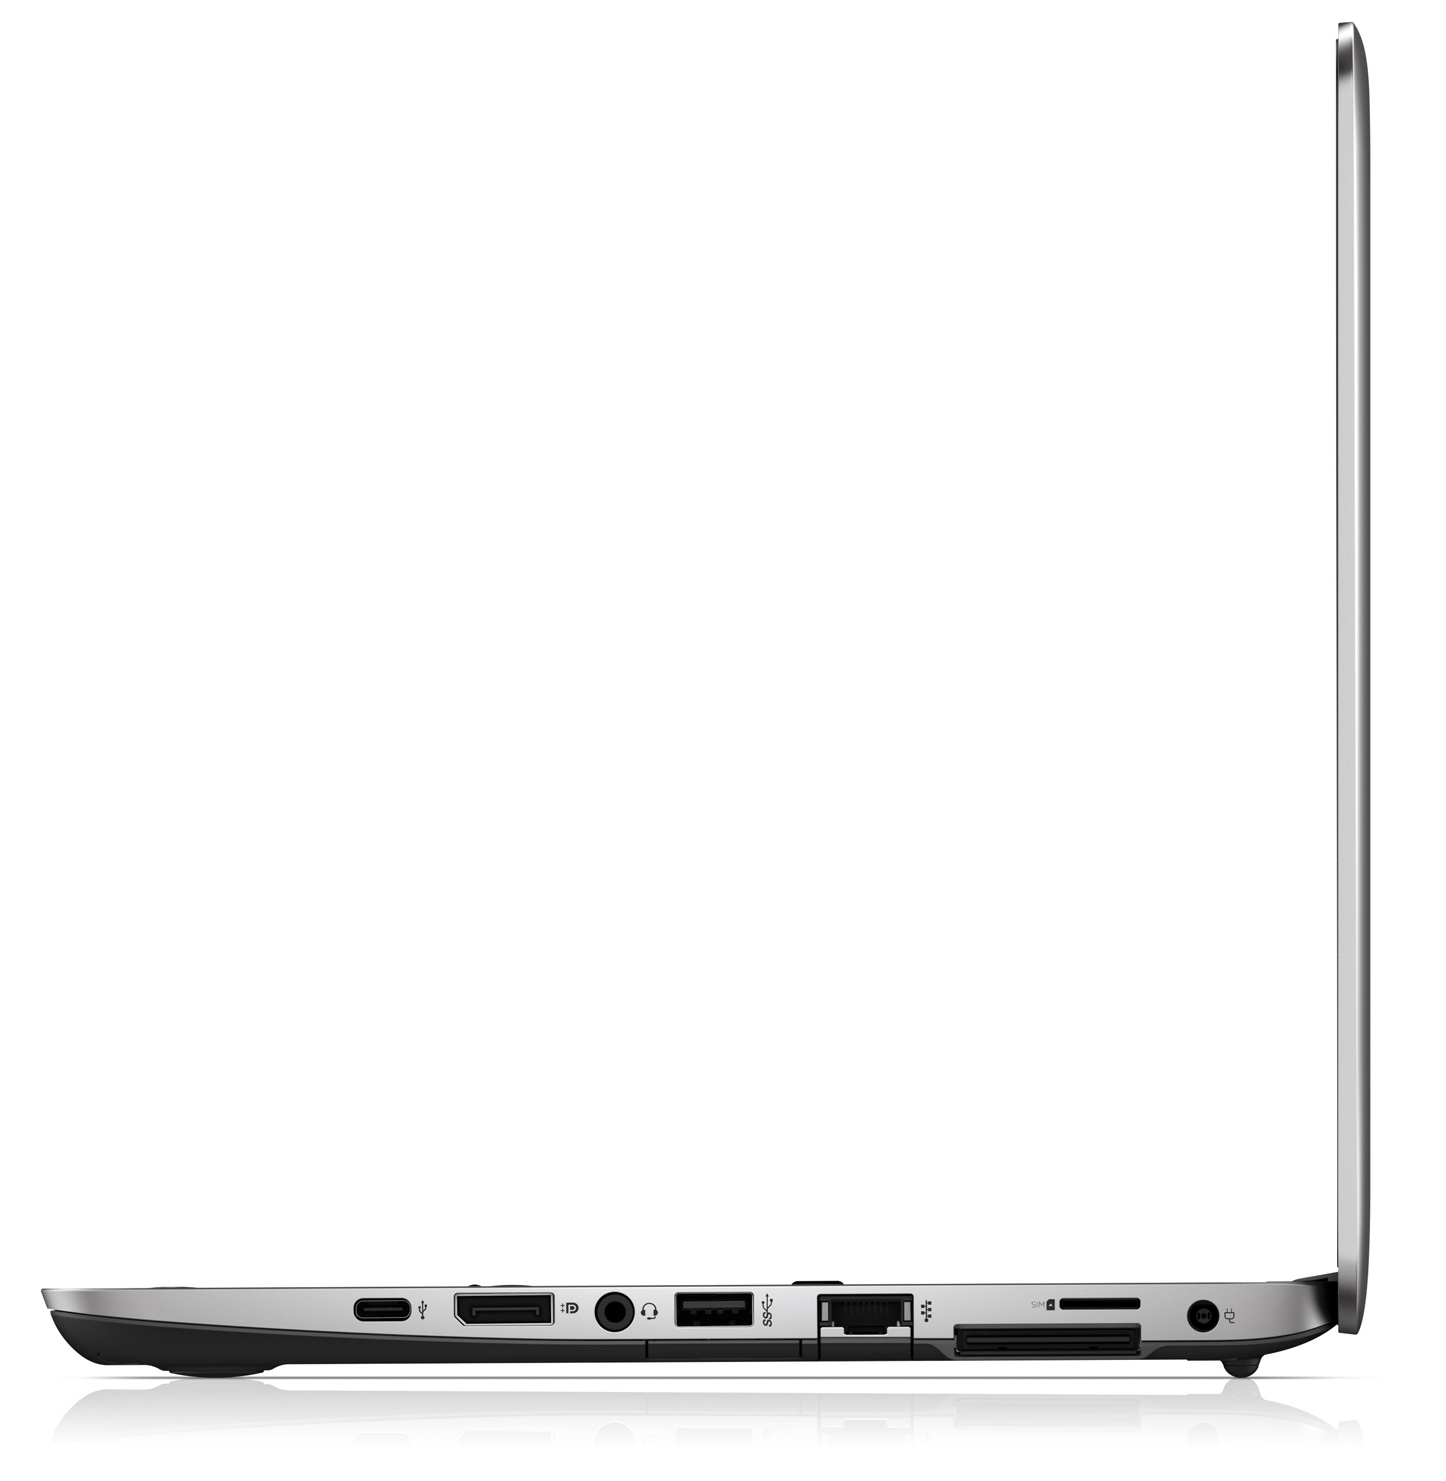
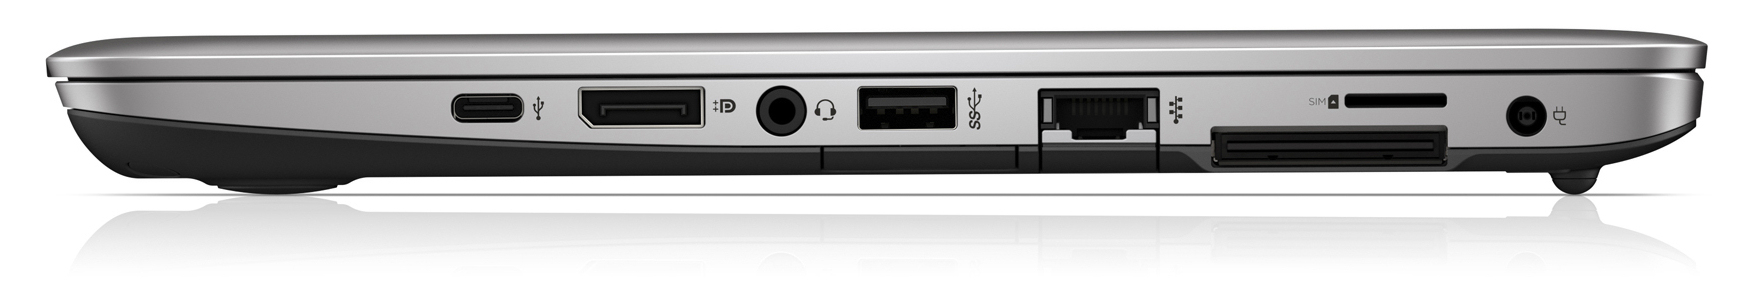
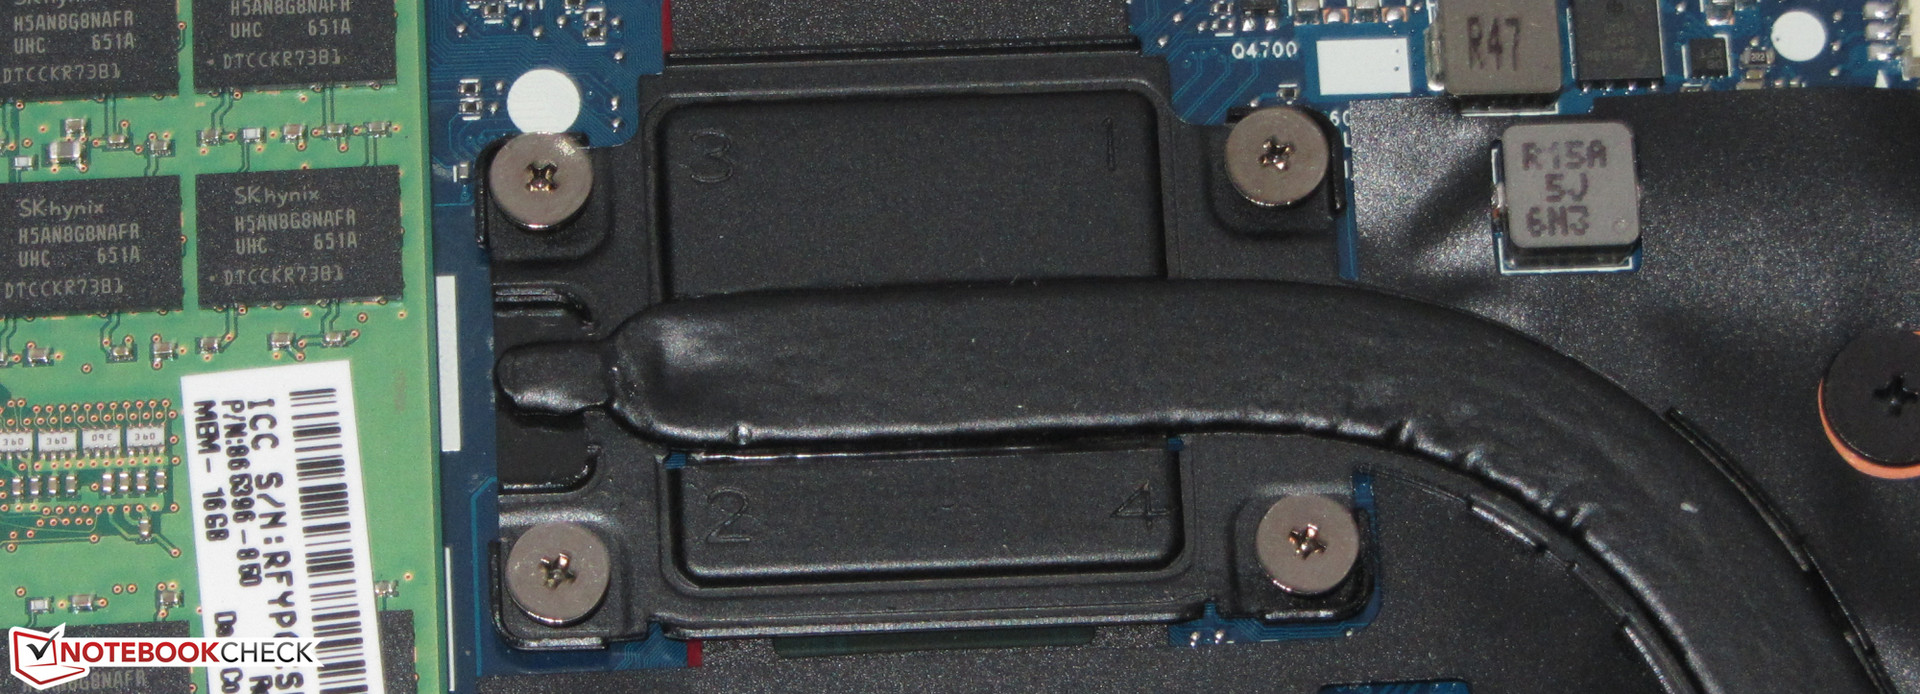
El rápido NVMe-SSD asegura una buena respuesta del sistema. Es posible reemplazar el SSD. Esto requiere extraer la parte inferior del portátil - lo que no requiere mucho esfuerzo. El teclado y la carcasa no han cambiado: HP ofrece la calidad habitual.
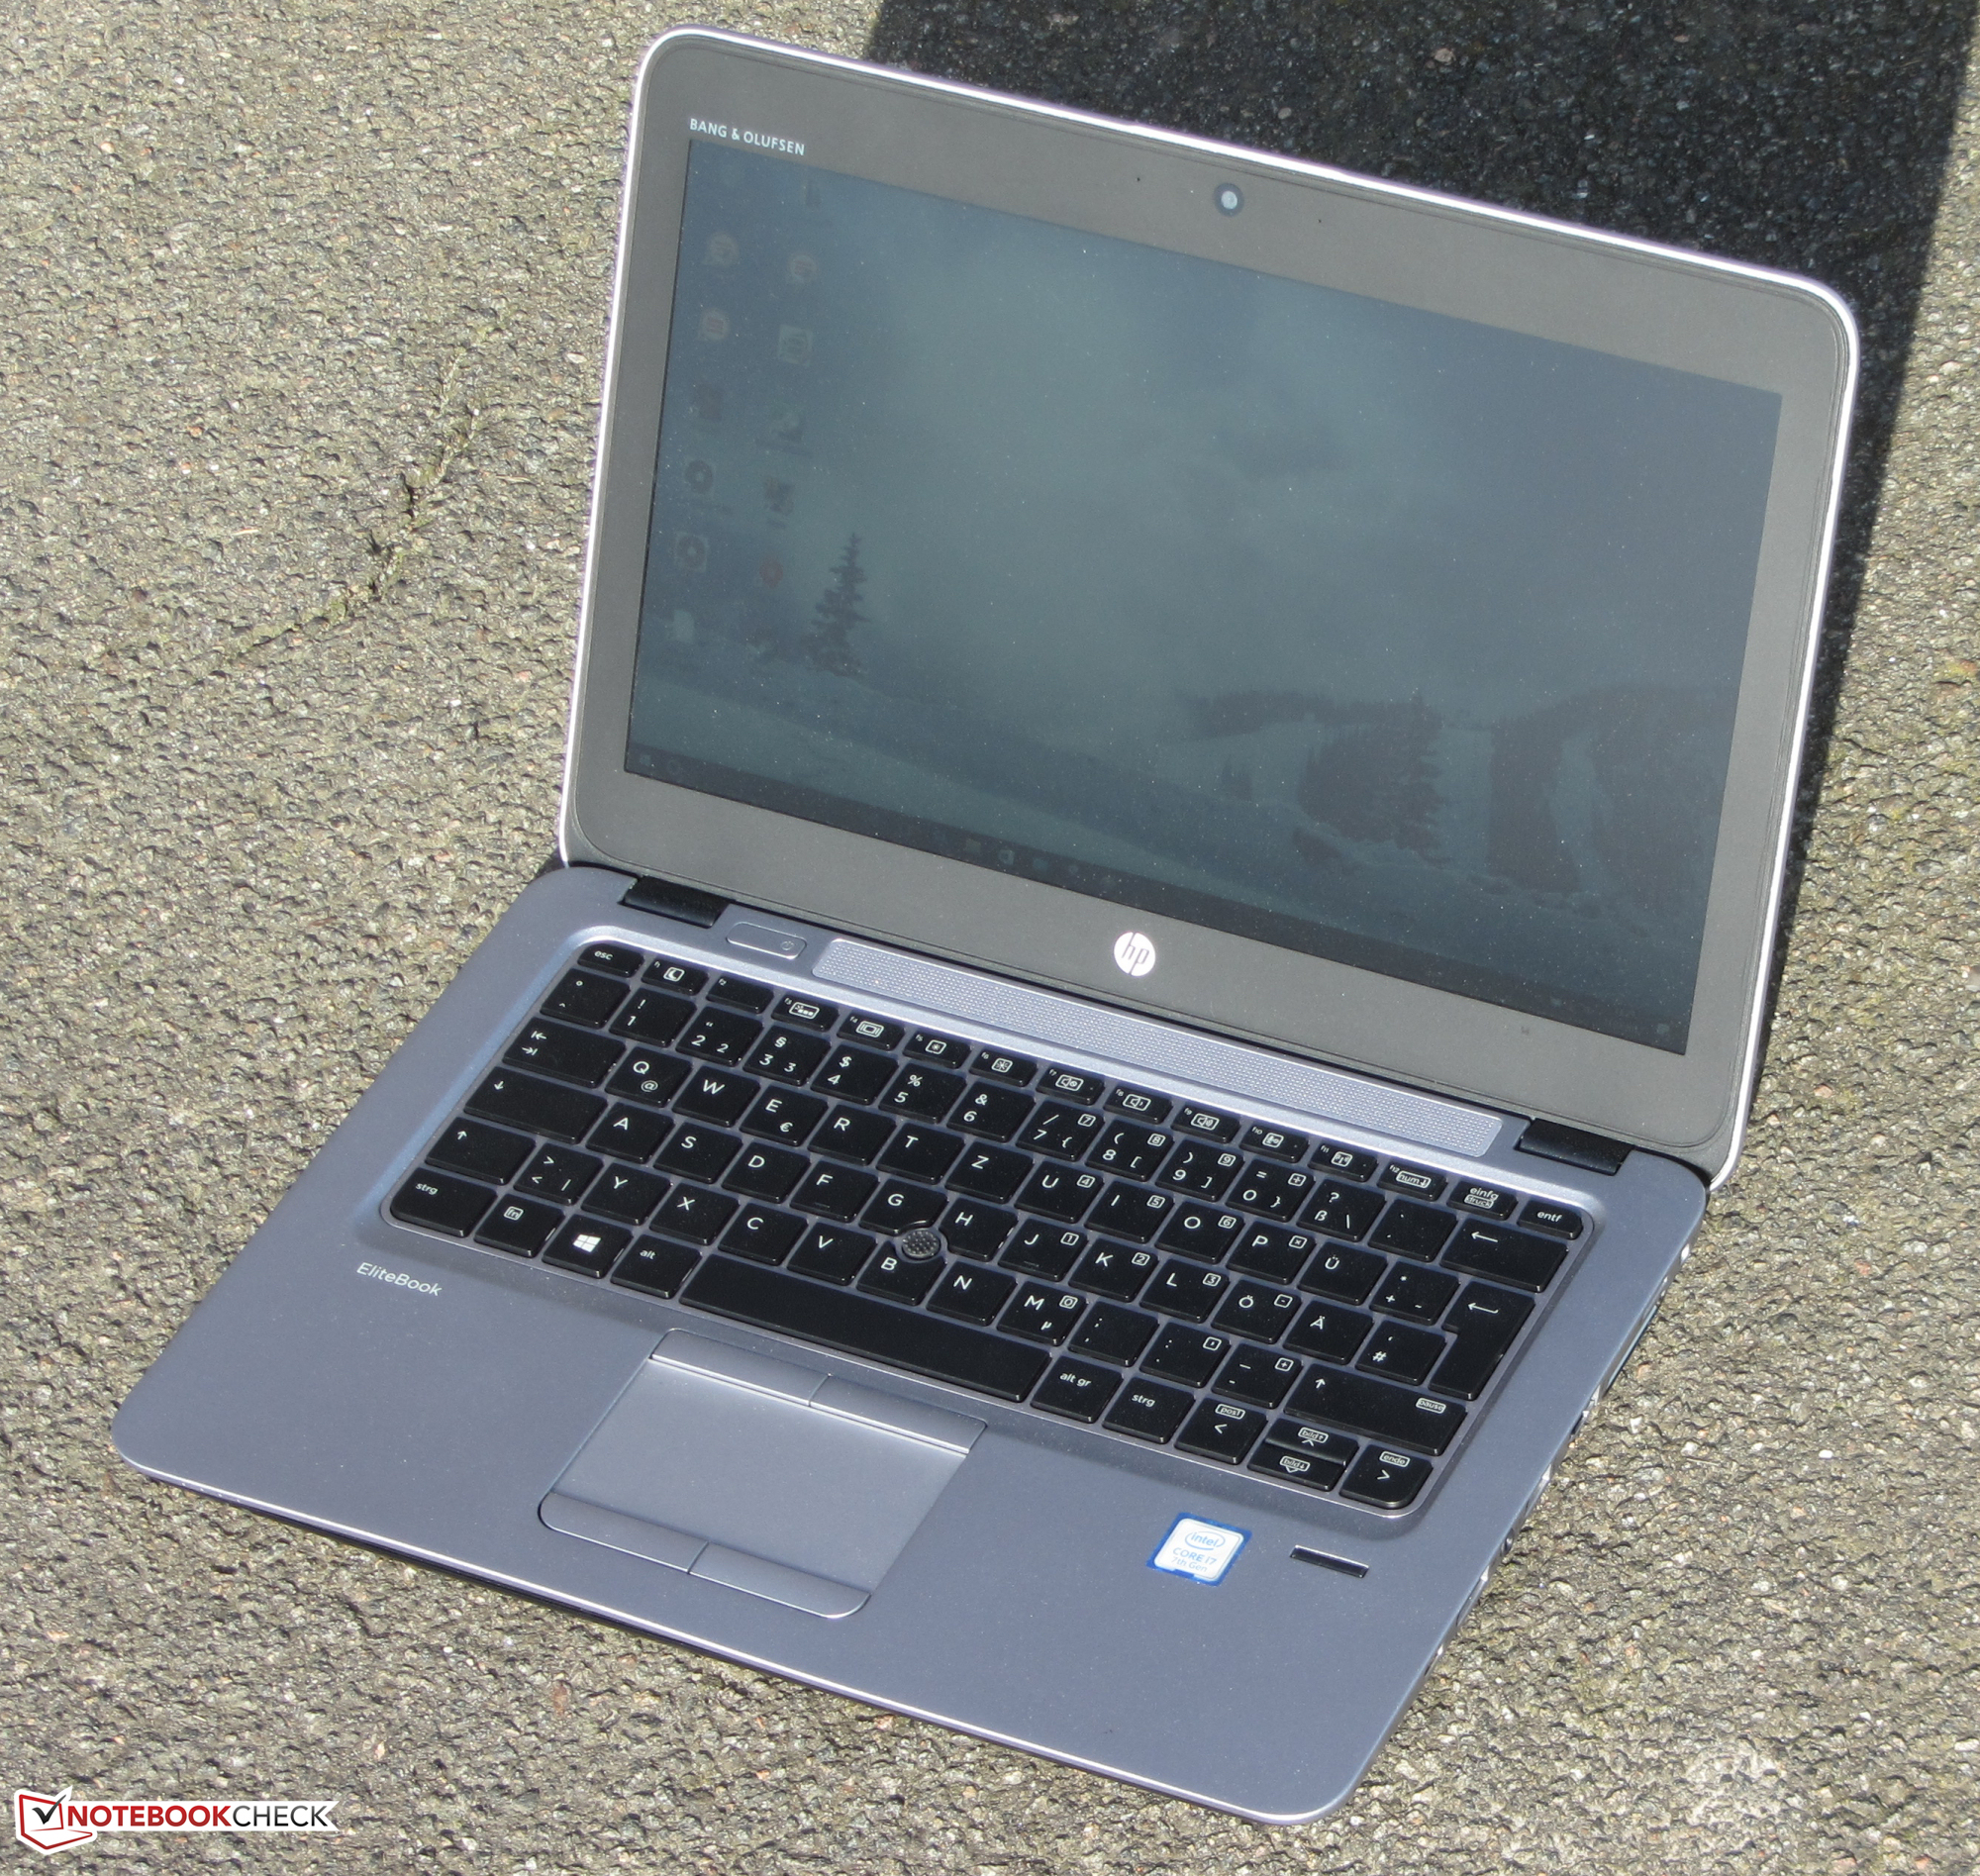
Apenas podemos decir cosas buenas de las pantallas de los portátiles de negocios de HP. Sin embargo esta vez las cosas son distintas: HP ha incluido un panel IPS brillante, con contraste y buenos ángulos de visualización. Hasta los colores son muy decentes sin realizar ninguna calibración.
Ésta es una versión acortada del análisis original. Puedes leer el análisis completo en inglés aquí.
HP EliteBook 820 G4 Z2V72ET
- 02/24/2017 v6 (old)
Sascha Mölck