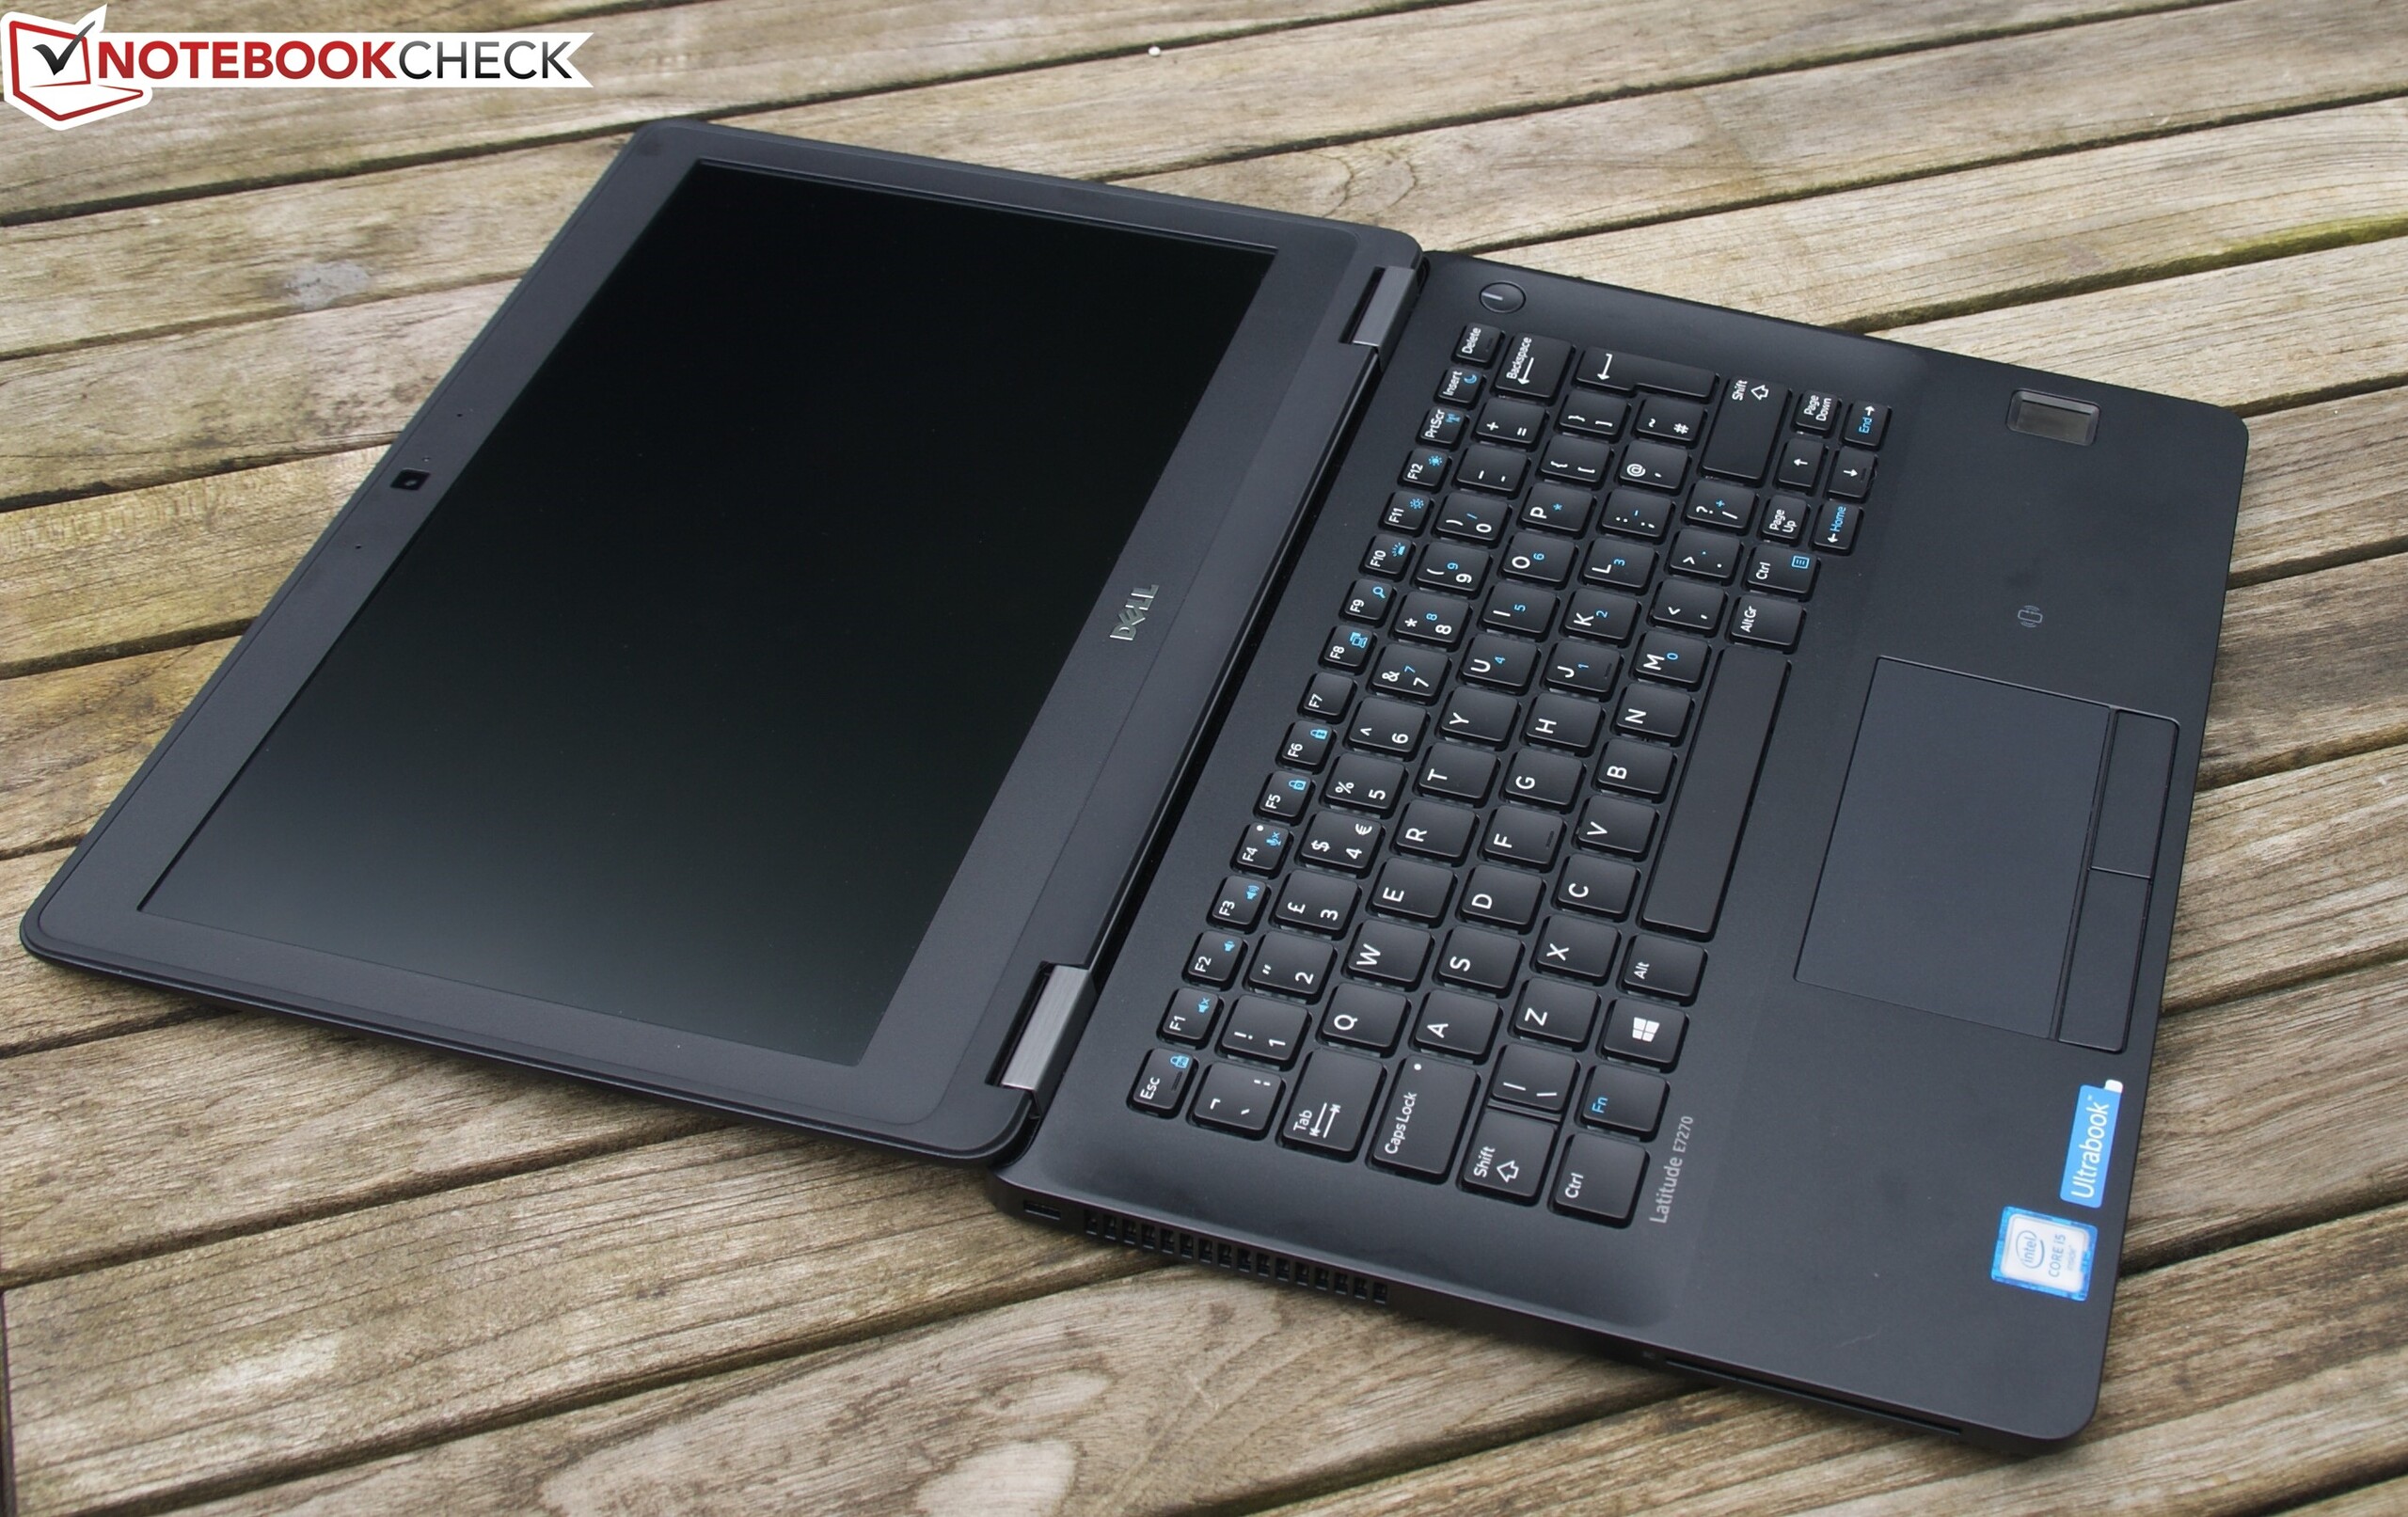
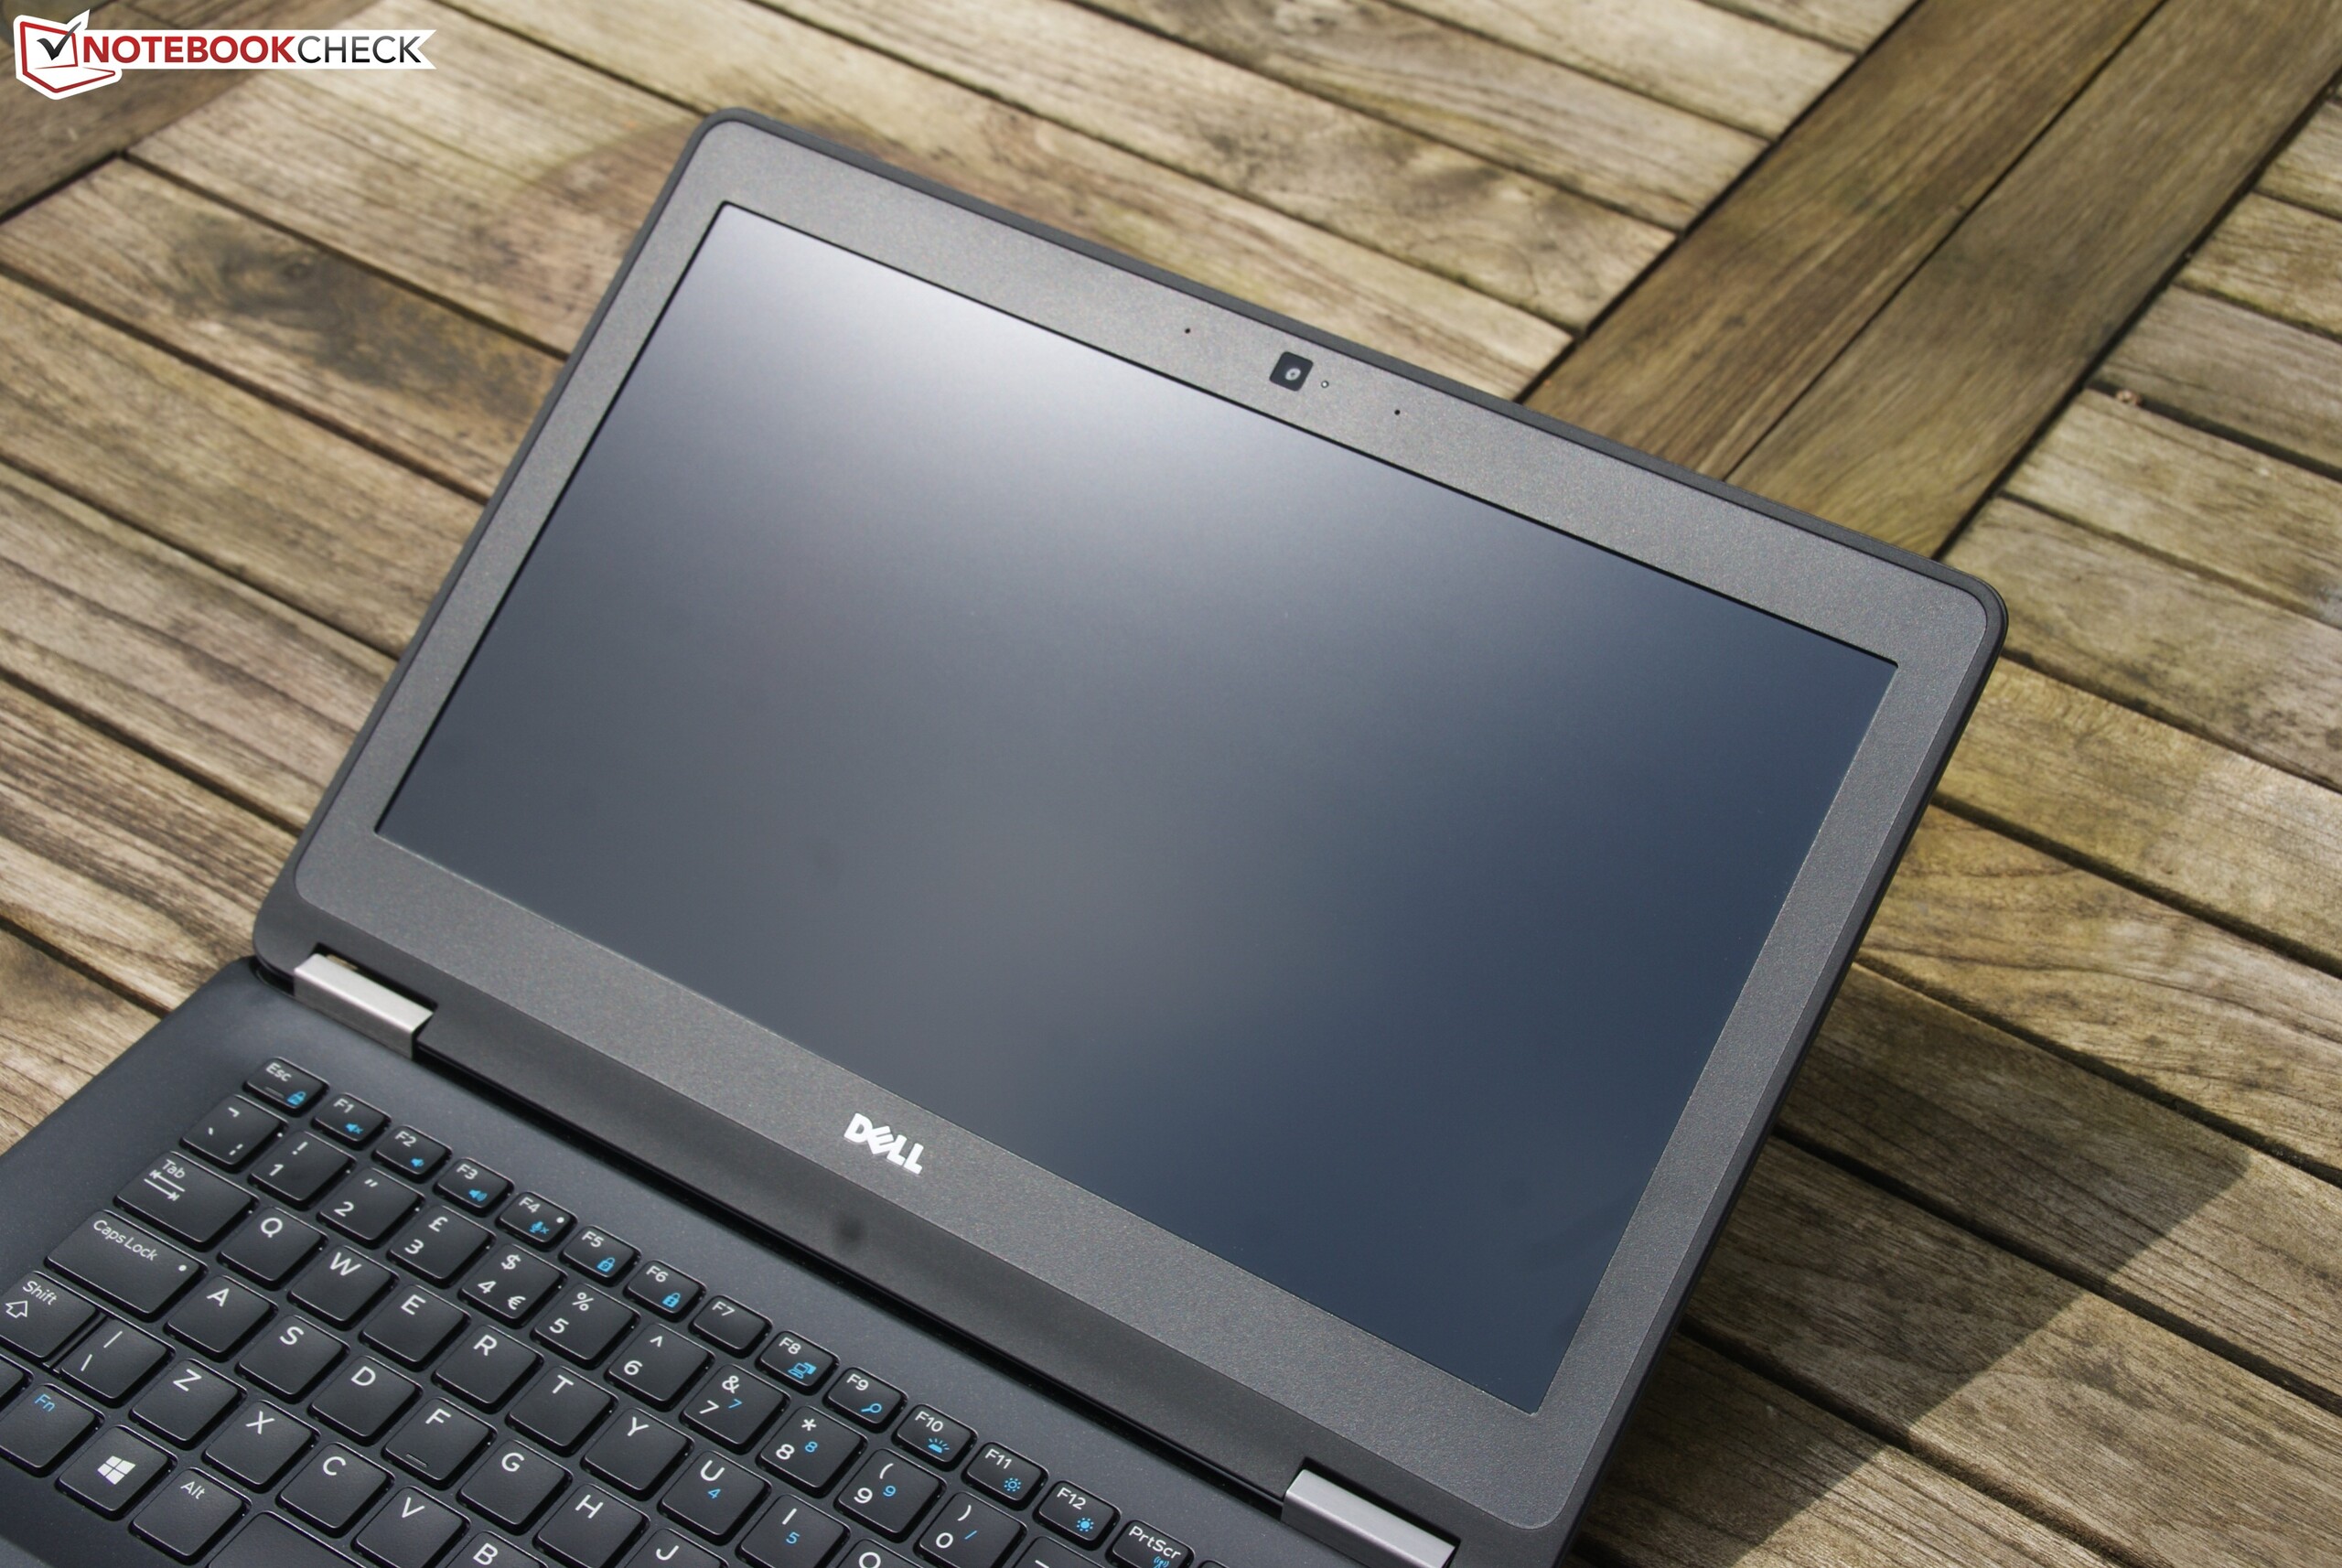
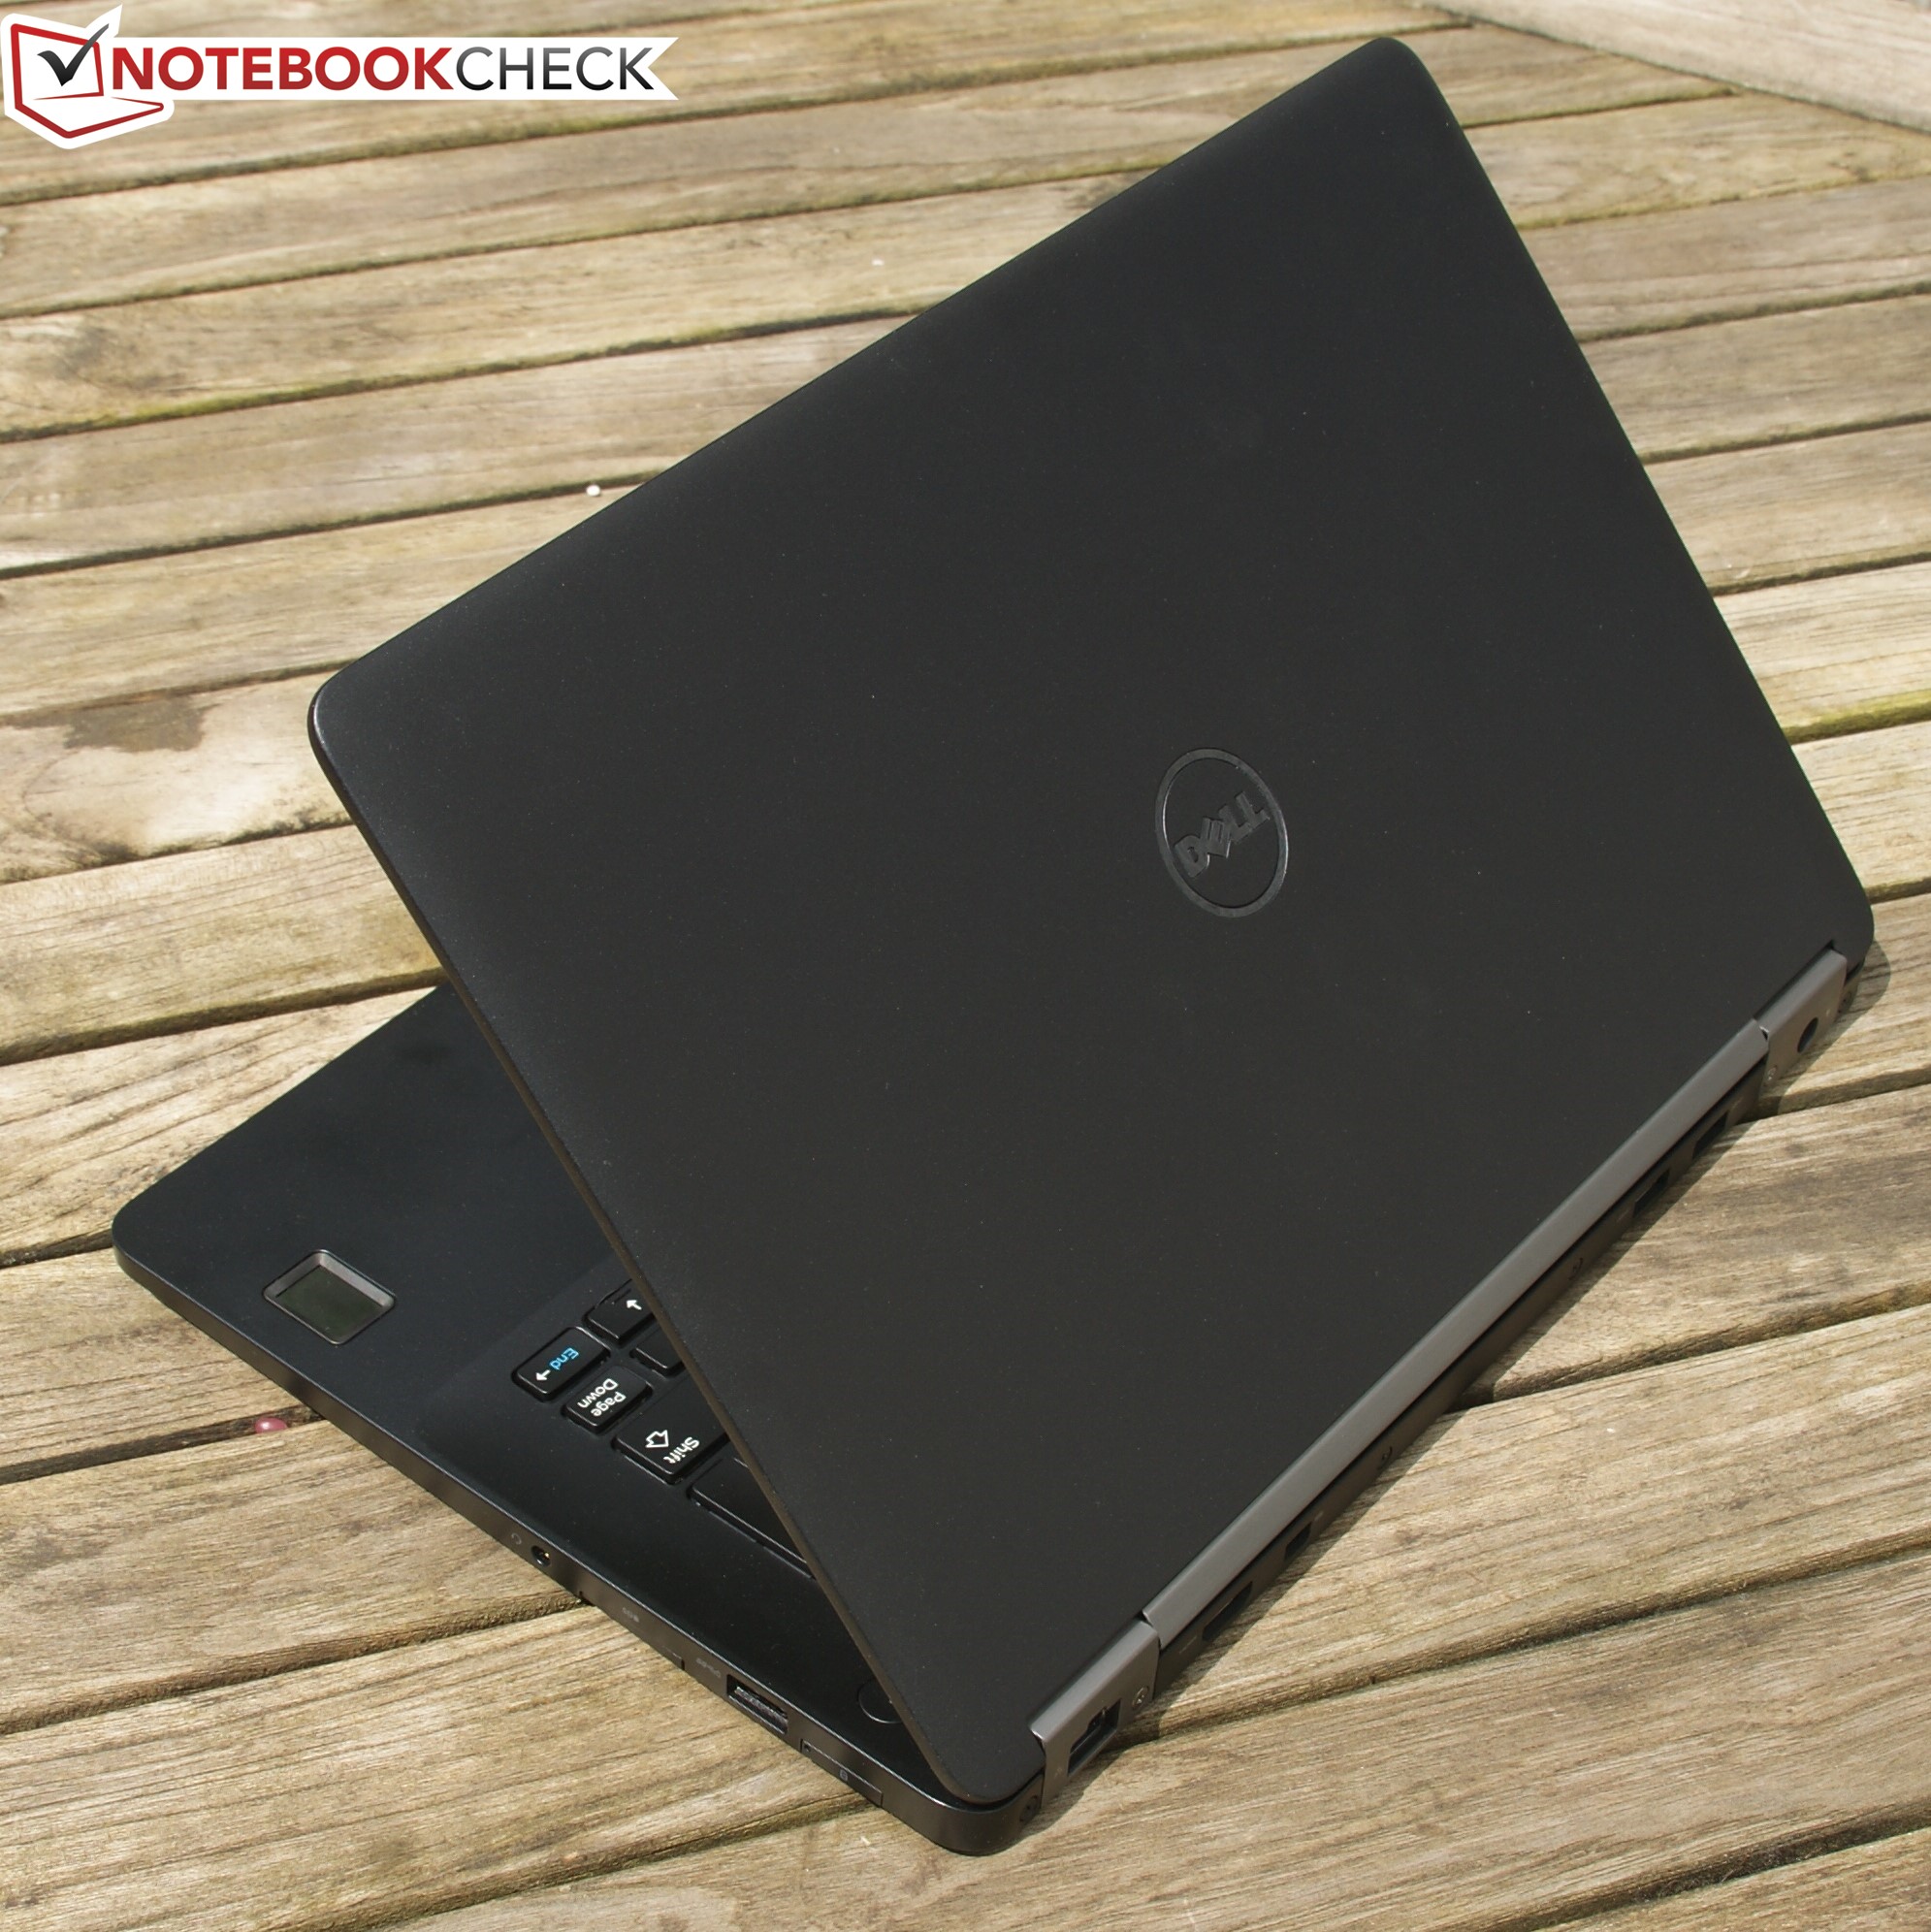
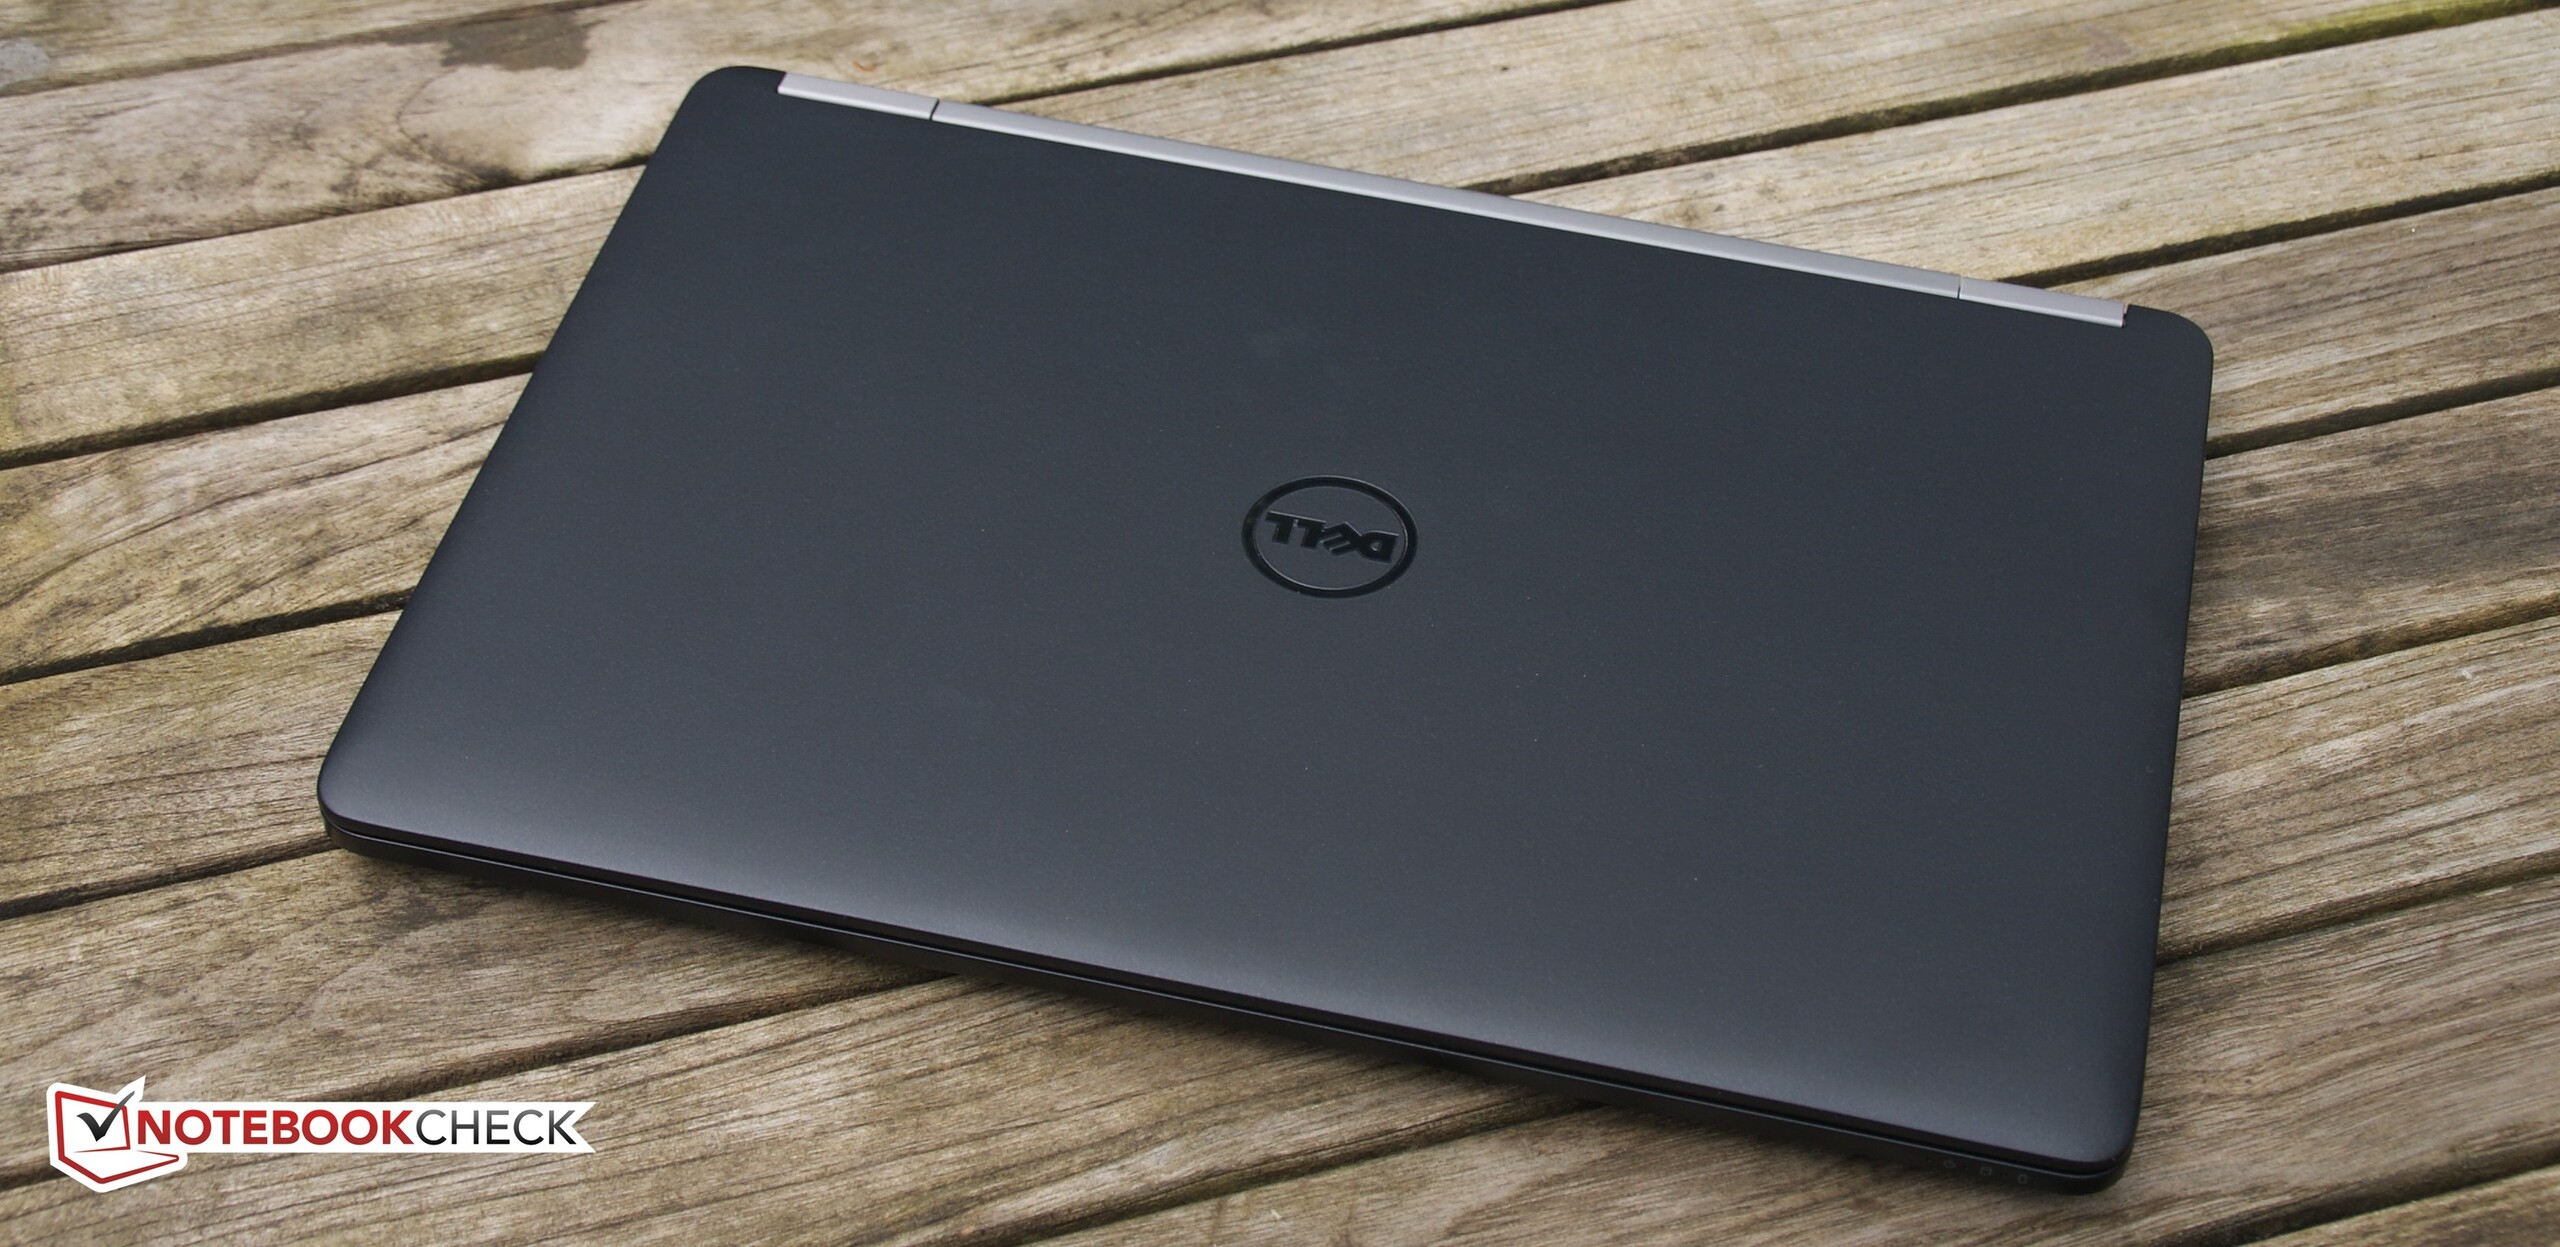
Breve análisis del Dell Latitude 12 E7270
| Networking | |
| iperf Server (receive) TCP 1 m 512KB | |
| Dell Latitude 12 E7270 | |
| Dell Latitude 13 7370 | |
| Lenovo ThinkPad X260-20F6007RGE | |
| iperf Client (transmit) TCP 1 m 512KB | |
| Lenovo ThinkPad X260-20F6007RGE | |
| Dell Latitude 13 7370 | |
| Dell Latitude 12 E7270 | |
| |||||||||||||||||||||||||
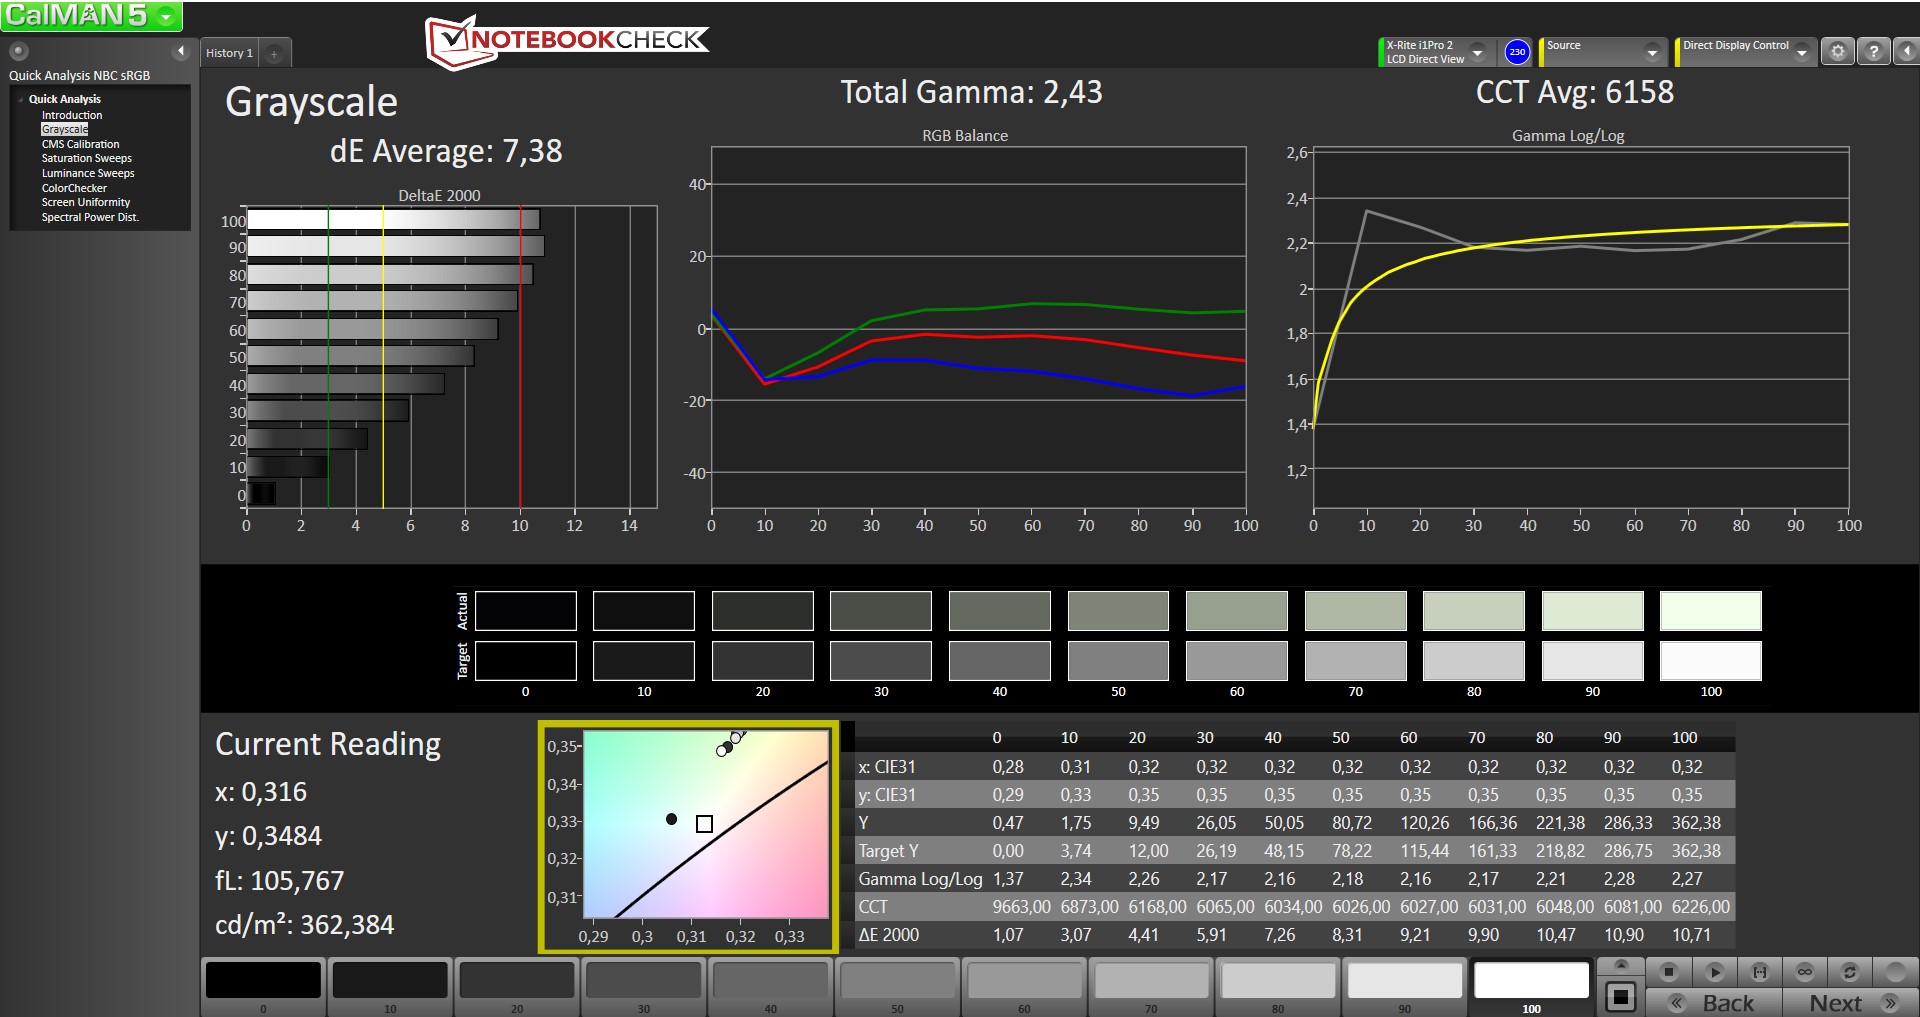
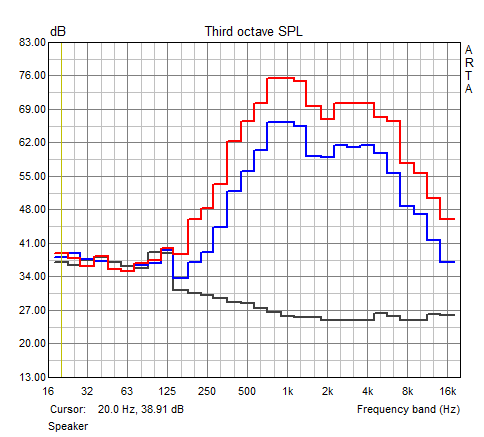
iluminación: 91 %
Brillo con batería: 354 cd/m²
Contraste: 751:1 (Negro: 0.47 cd/m²)
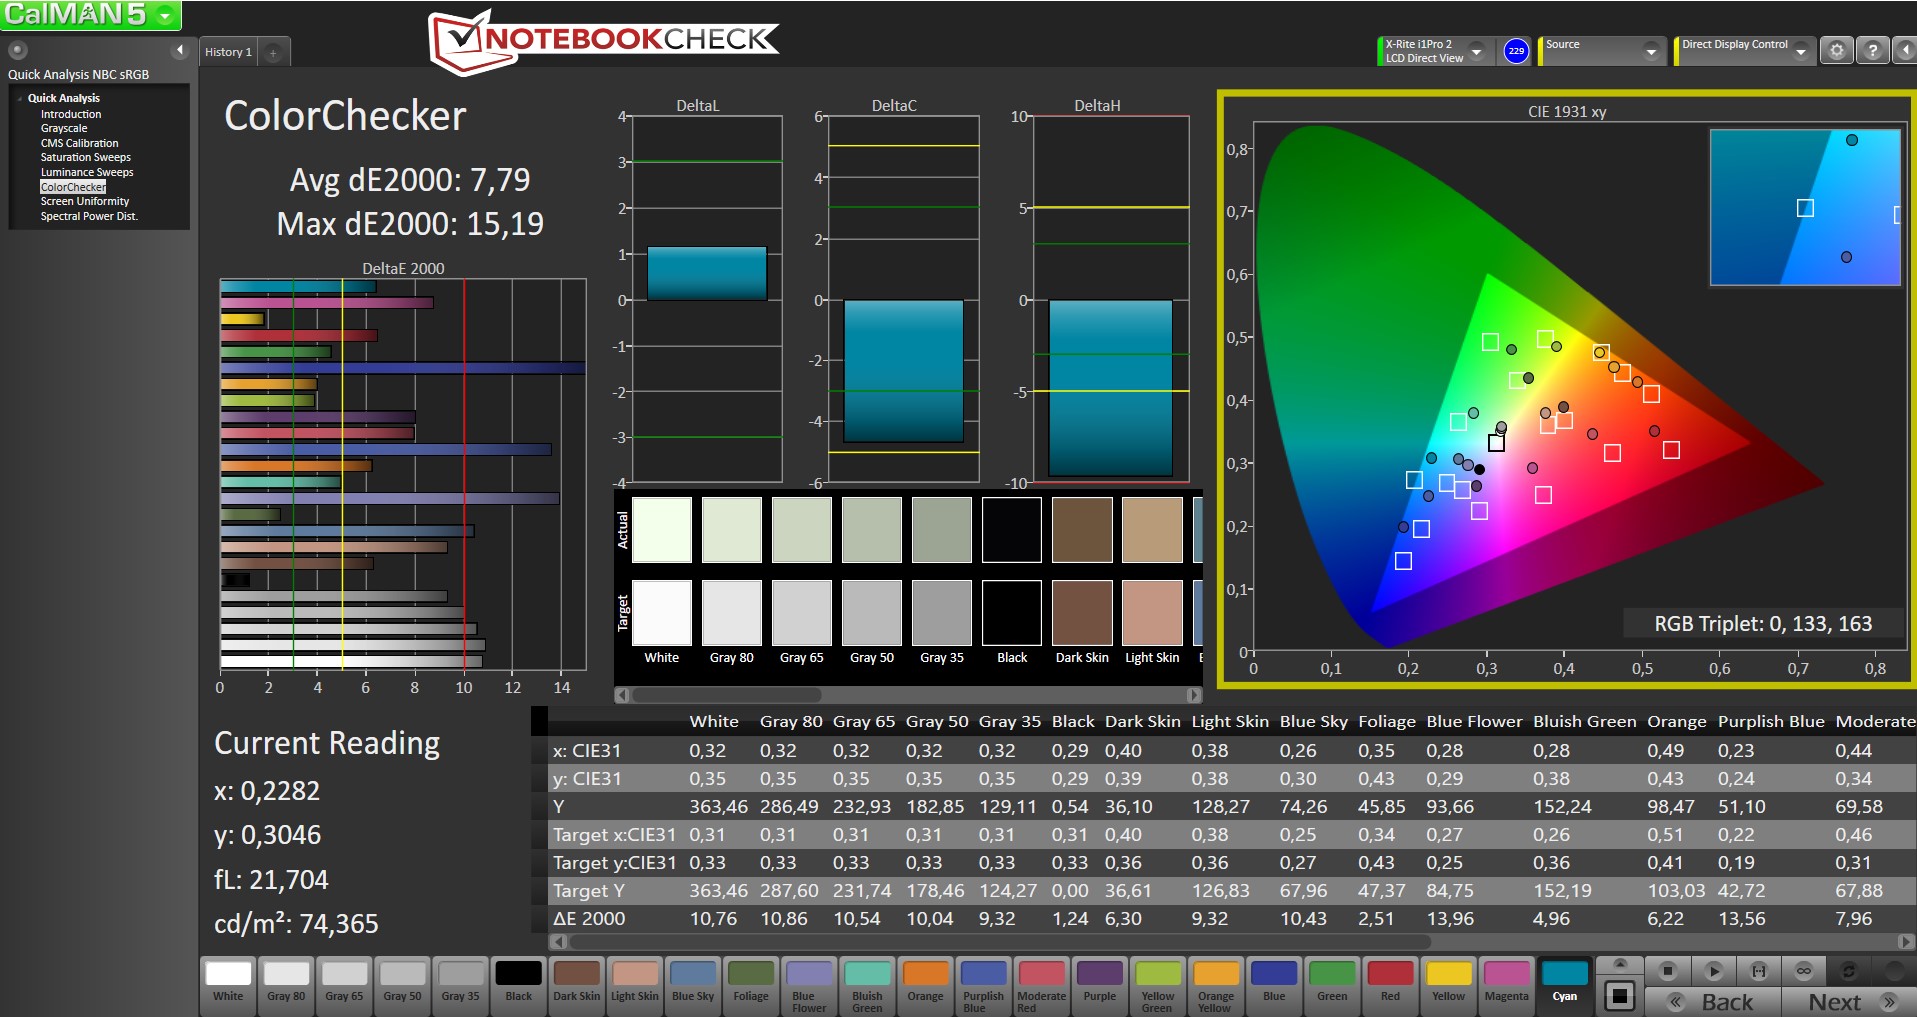
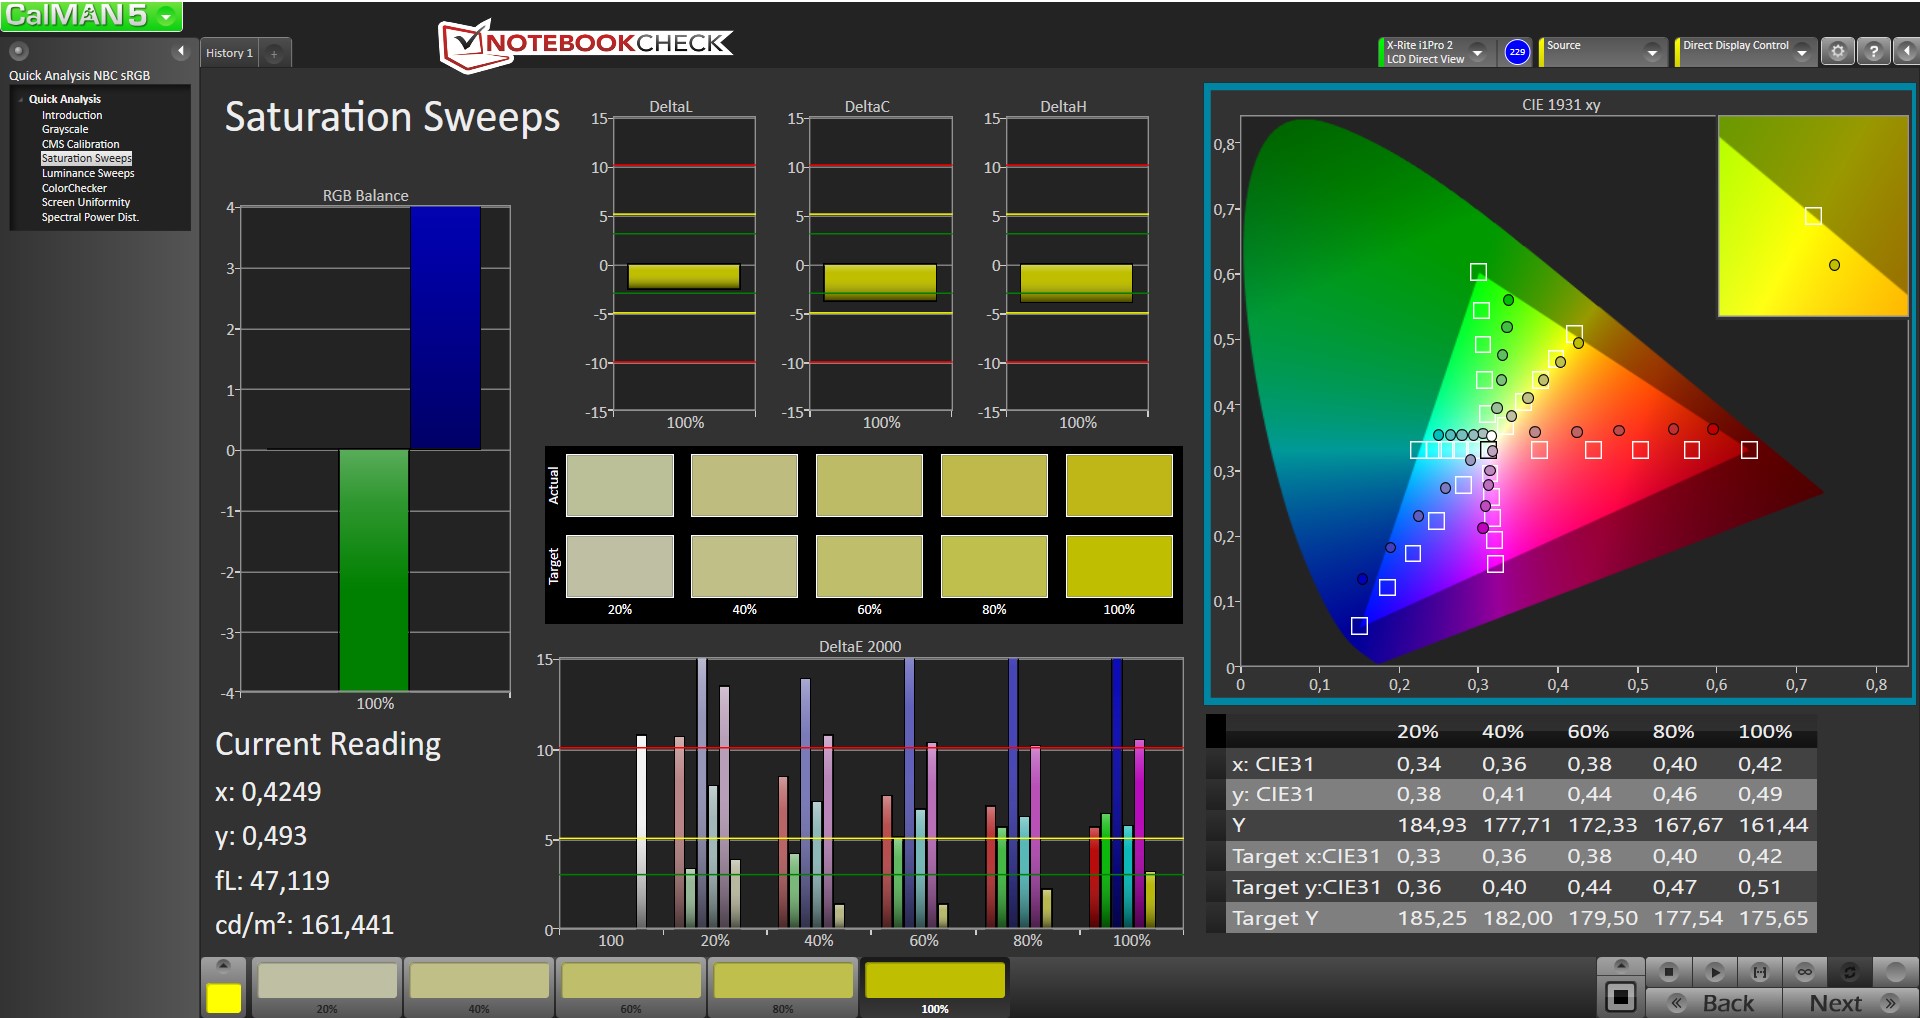
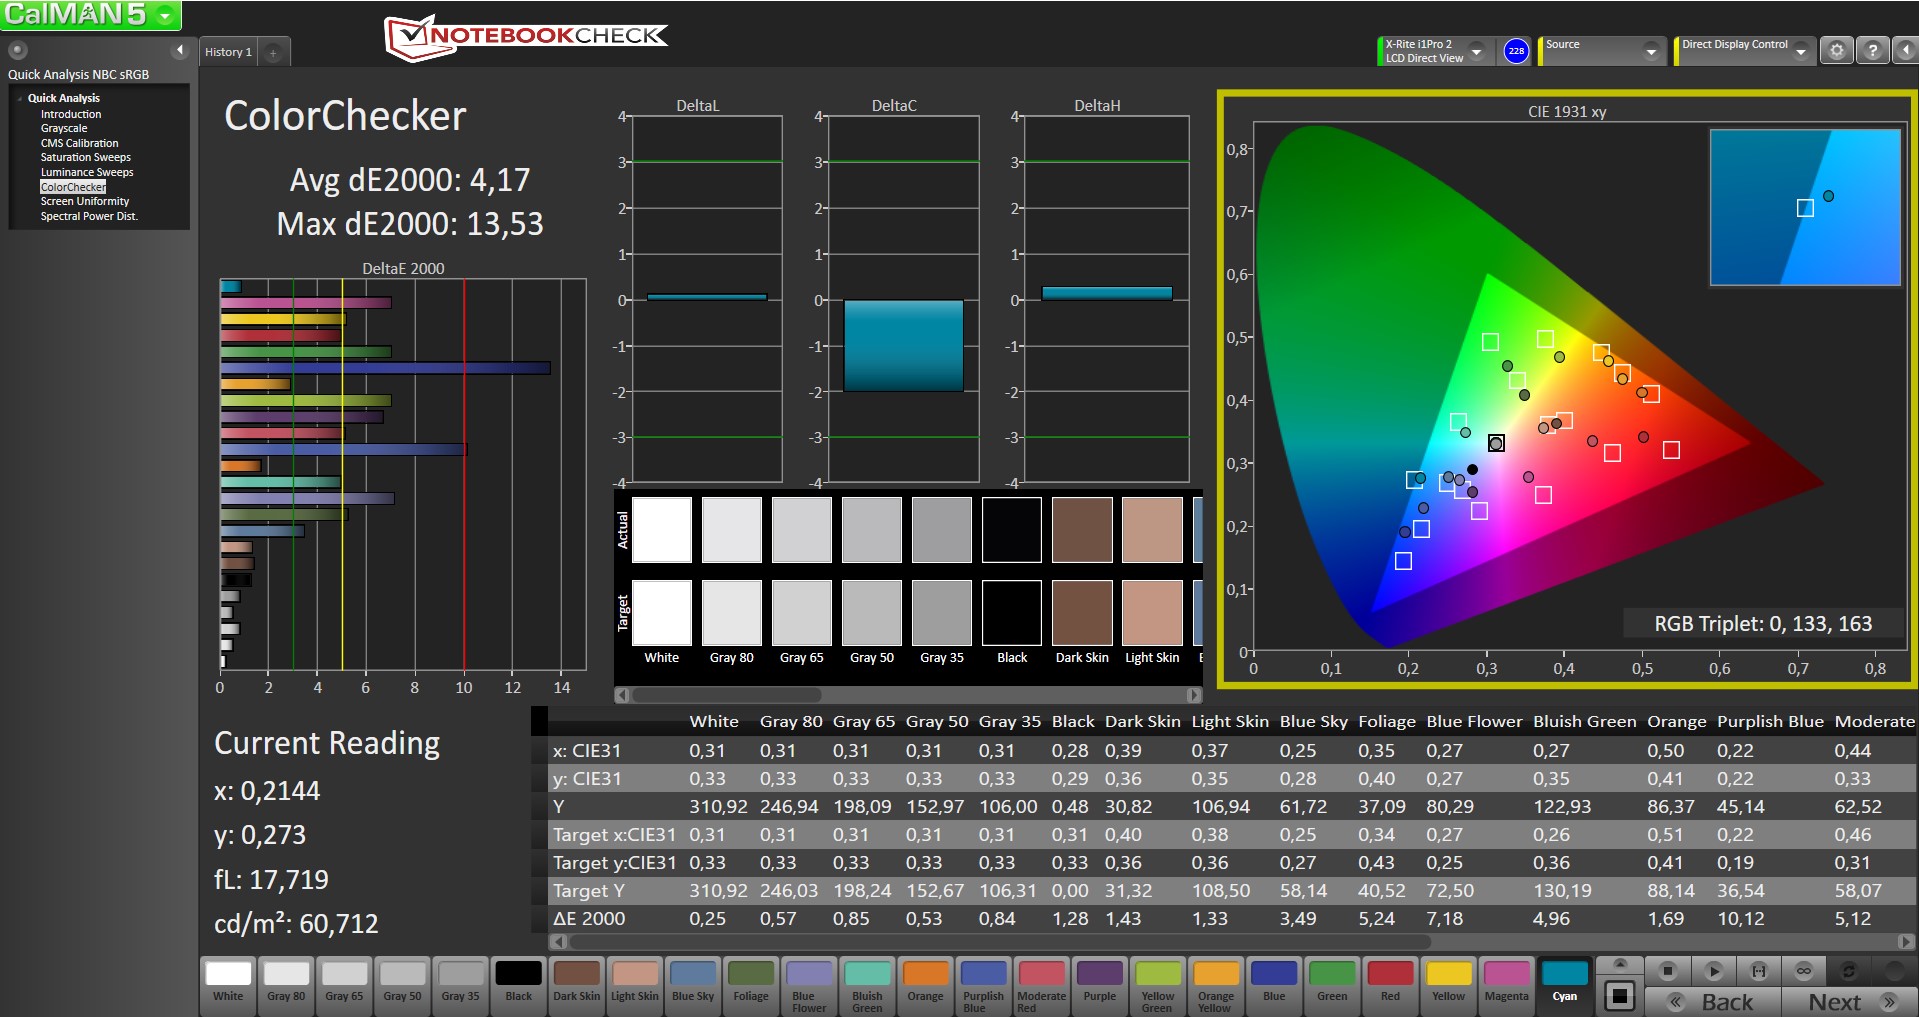
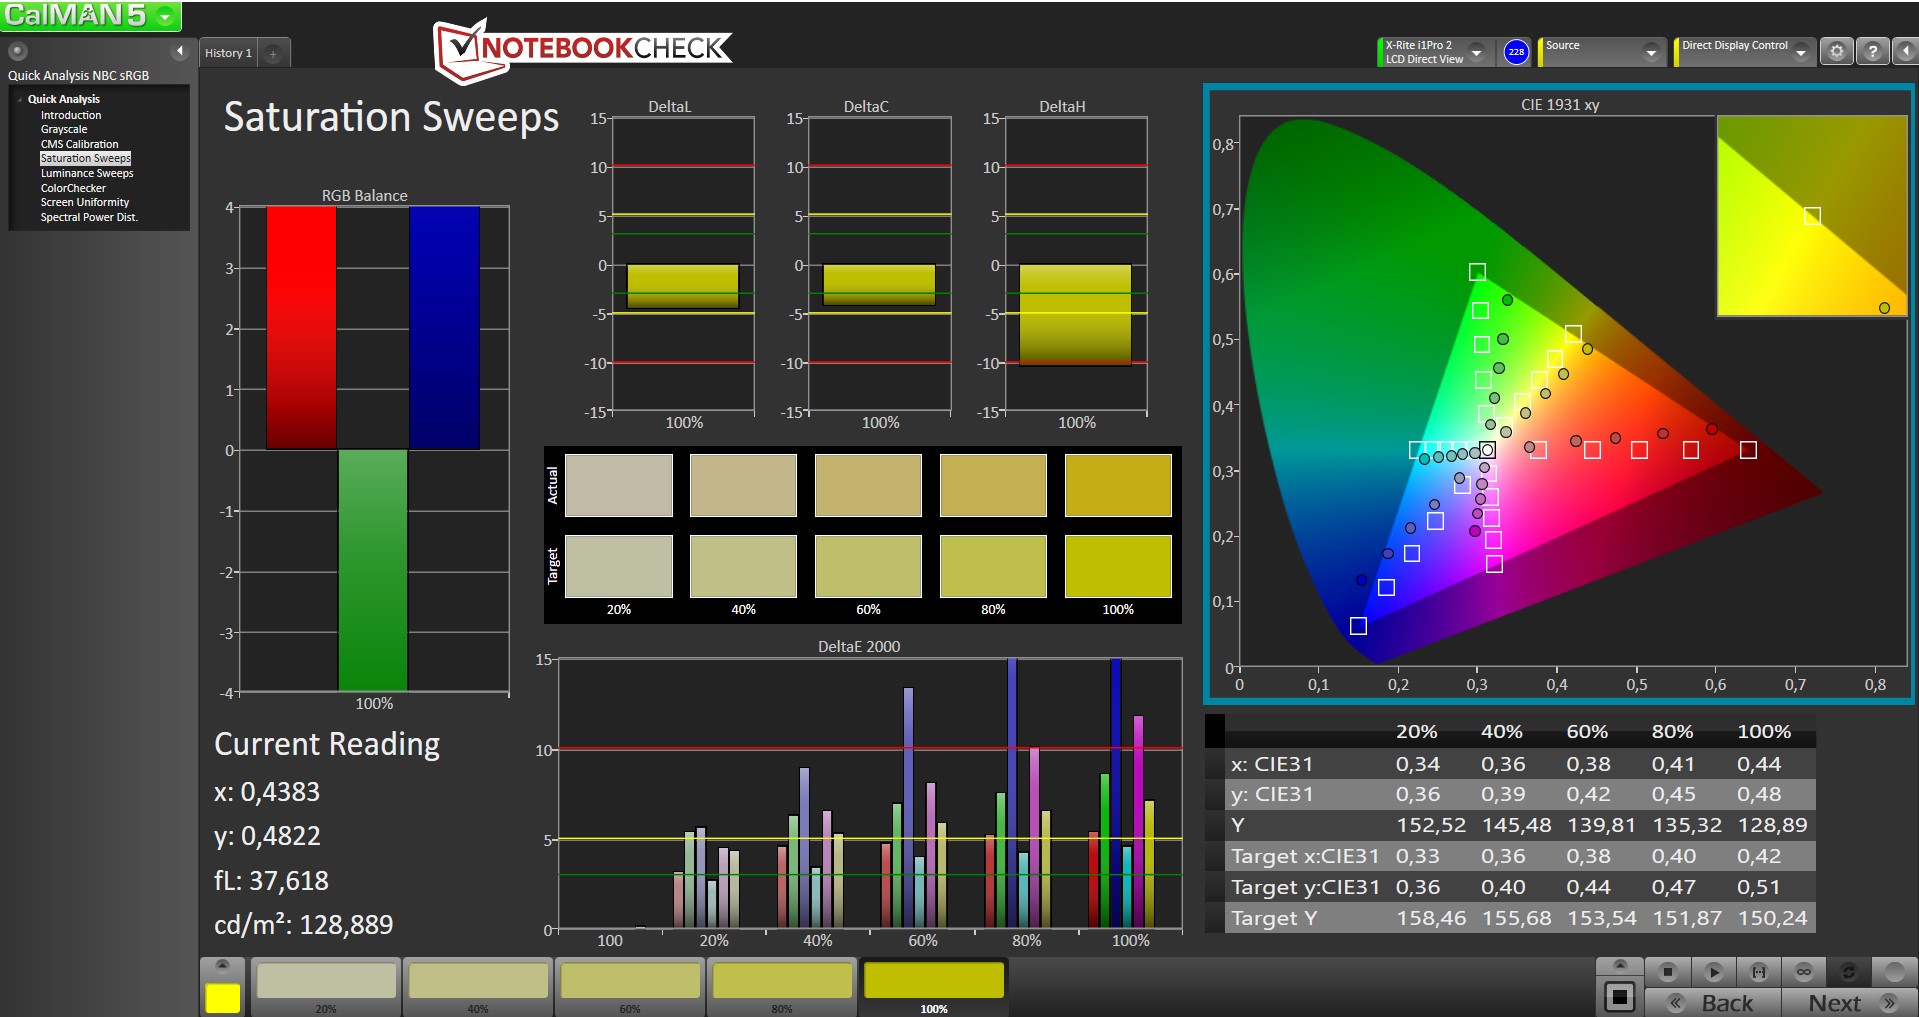
ΔE ColorChecker Calman: 7.79 | ∀{0.5-29.43 Ø4.71}
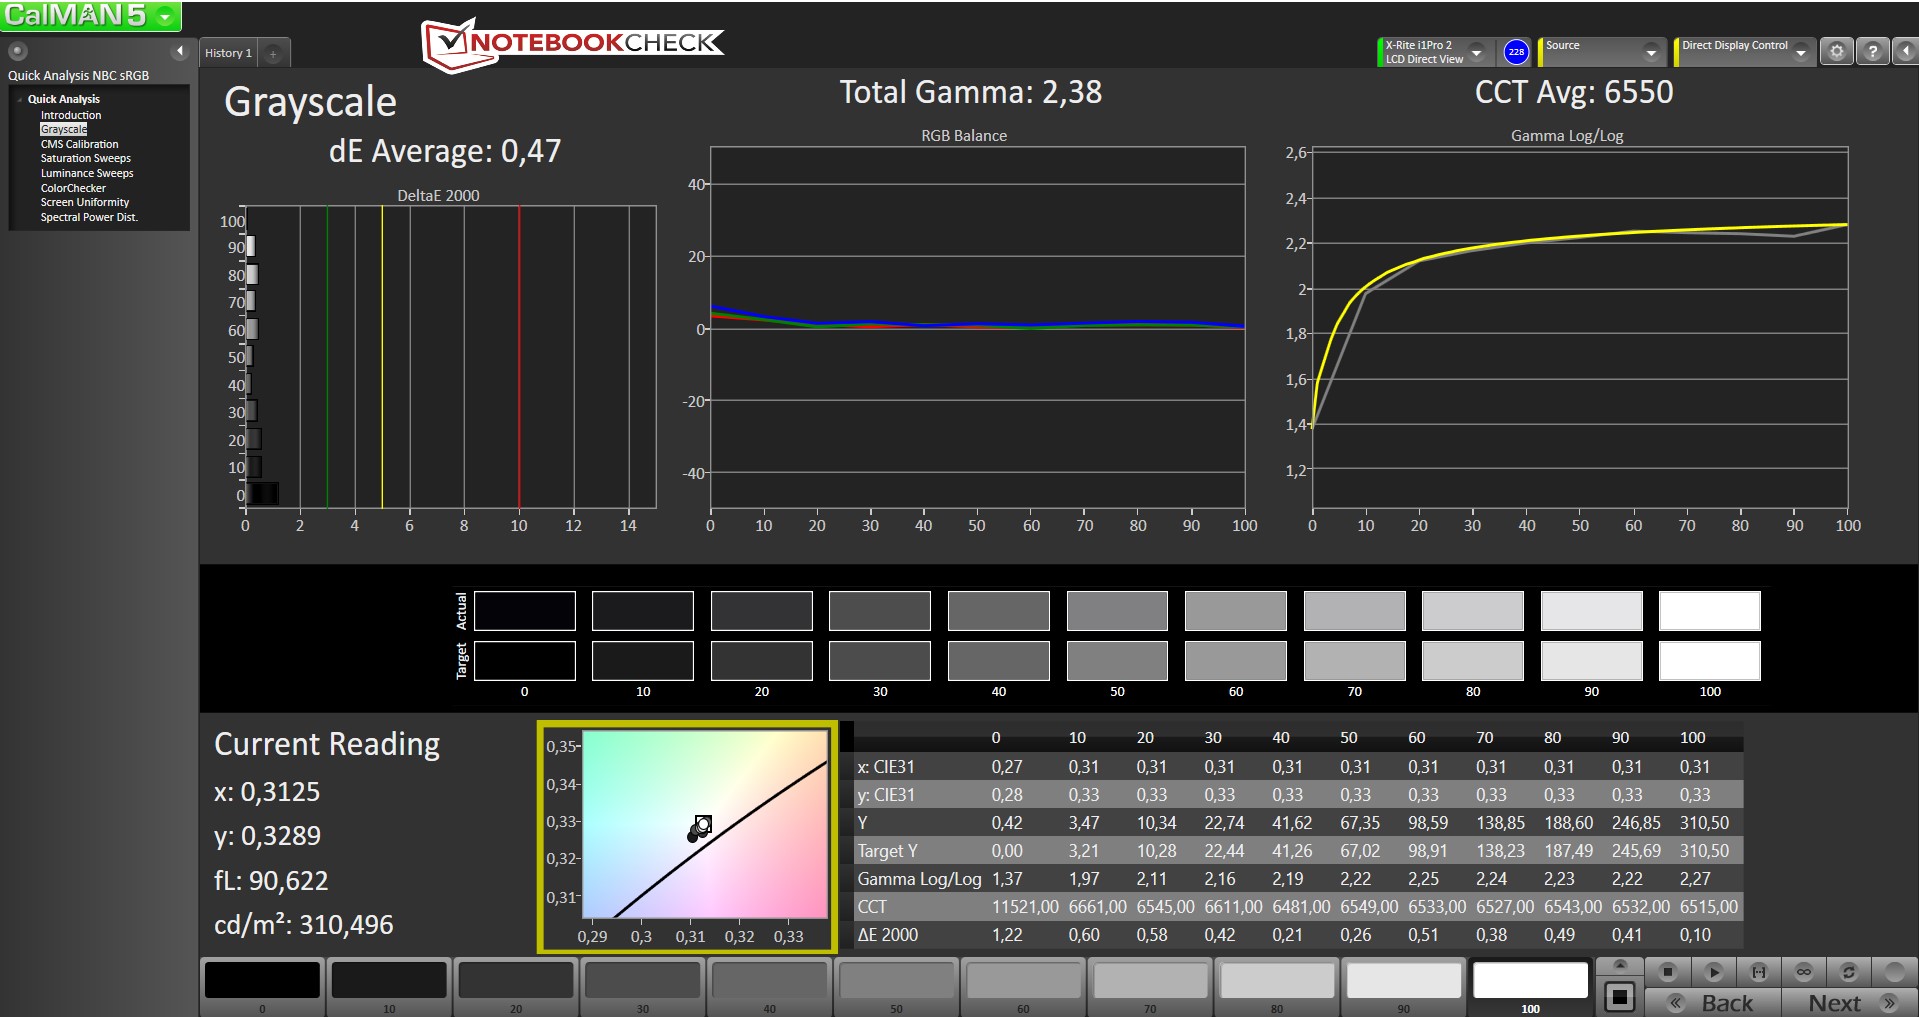
ΔE Greyscale Calman: 7.38 | ∀{0.09-98 Ø4.96}
58.87% sRGB (Argyll 1.6.3 3D)
37.72% AdobeRGB 1998 (Argyll 1.6.3 3D)
41.07% AdobeRGB 1998 (Argyll 3D)
59.2% sRGB (Argyll 3D)
39.7% Display P3 (Argyll 3D)
Gamma: 2.43
CCT: 6158 K
| Dell Latitude 12 E7270 IPS LED, 1920x1080 | Lenovo ThinkPad X260-20F6007RGE IPS, 1920x1080 | HP EliteBook 820 G3 TN LED, 1366x768 | Dell Latitude 13 7370 IPS, 1920x1080 | Dell XPS 13 9350 WQXGA IPS, 3200x1800 | |
|---|---|---|---|---|---|
| Display | 13% | -2% | 31% | 58% | |
| Display P3 Coverage (%) | 39.7 | 44.71 13% | 38.9 -2% | 52.2 31% | 63.6 60% |
| sRGB Coverage (%) | 59.2 | 66.1 12% | 58.5 -1% | 78.3 32% | 92.3 56% |
| AdobeRGB 1998 Coverage (%) | 41.07 | 46.23 13% | 40.2 -2% | 53.9 31% | 65.4 59% |
| Response Times | 11% | -26% | -24% | -18% | |
| Response Time Grey 50% / Grey 80% * (ms) | 38.4 ? | 32.8 ? 15% | 58 ? -51% | 50.4 ? -31% | 50.8 ? -32% |
| Response Time Black / White * (ms) | 28.8 ? | 27.2 ? 6% | 29.2 ? -1% | 33.6 ? -17% | 29.6 ? -3% |
| PWM Frequency (Hz) | |||||
| Screen | 14% | -19% | 19% | 37% | |
| Brightness middle (cd/m²) | 353 | 337 -5% | 244 -31% | 261 -26% | 307.5 -13% |
| Brightness (cd/m²) | 334 | 322 -4% | 240 -28% | 241 -28% | 297 -11% |
| Brightness Distribution (%) | 91 | 91 0% | 84 -8% | 85 -7% | 92 1% |
| Black Level * (cd/m²) | 0.47 | 0.32 32% | 0.6 -28% | 0.26 45% | 0.207 56% |
| Contrast (:1) | 751 | 1053 40% | 407 -46% | 1004 34% | 1486 98% |
| Colorchecker dE 2000 * | 7.79 | 5.71 27% | 9 -16% | 4.3 45% | 4.18 46% |
| Colorchecker dE 2000 max. * | 15.19 | 15.39 -1% | 15.73 -4% | 8.66 43% | 7.84 48% |
| Greyscale dE 2000 * | 7.38 | 5.15 30% | 9.48 -28% | 5.82 21% | 4.94 33% |
| Gamma | 2.43 91% | 2.38 92% | 2.44 90% | 2.44 90% | 2.31 95% |
| CCT | 6158 106% | 6881 94% | 11116 58% | 6771 96% | 7645 85% |
| Color Space (Percent of AdobeRGB 1998) (%) | 37.72 | 42.38 12% | 37.18 -1% | 49.18 30% | 59 56% |
| Color Space (Percent of sRGB) (%) | 58.87 | 65.62 11% | 58.63 0% | 77.84 32% | 92 56% |
| Media total (Programa/Opciones) | 13% /
13% | -16% /
-16% | 9% /
16% | 26% /
34% |
* ... más pequeño es mejor
Tiempos de respuesta del display
| ↔ Tiempo de respuesta de Negro a Blanco | ||
|---|---|---|
| 28.8 ms ... subida ↗ y bajada ↘ combinada | ↗ 10.8 ms subida |  |
| ↘ 18 ms bajada | ||
| La pantalla mostró tiempos de respuesta relativamente lentos en nuestros tests pero podría ser demasiado lenta para los jugones. En comparación, todos los dispositivos de prueba van de ##min### (mínimo) a 240 (máximo) ms. » 76 % de todos los dispositivos son mejores. Eso quiere decir que el tiempo de respuesta es peor que la media (19.8 ms) de todos los dispositivos testados. | ||
| ↔ Tiempo de respuesta 50% Gris a 80% Gris | ||
| 38.4 ms ... subida ↗ y bajada ↘ combinada | ↗ 17.2 ms subida |  |
| ↘ 21.2 ms bajada | ||
| La pantalla mostró tiempos de respuesta lentos en nuestros tests y podría ser demasiado lenta para los jugones. En comparación, todos los dispositivos de prueba van de ##min### (mínimo) a 636 (máximo) ms. » 58 % de todos los dispositivos son mejores. Eso quiere decir que el tiempo de respuesta es peor que la media (30.9 ms) de todos los dispositivos testados. | ||
Parpadeo de Pantalla / PWM (Pulse-Width Modulation)
| Parpadeo de Pantalla / PWM no detectado | ||
Comparación: 52 % de todos los dispositivos testados no usaron PWM para atenuar el display. Si se usó, medimos una media de 7748 (mínimo: 5 - máxmo: 343500) Hz. | ||
| PCMark 8 Home Score Accelerated v2 | 3420 puntos | |
| PCMark 8 Work Score Accelerated v2 | 4395 puntos | |
ayuda | ||
| CrystalDiskMark 3.0 | |
| Write 4k | |
| Samsung SM951 MZVPV256HDGL m.2 PCI-e | |
| Liteon L8H-256V2G | |
| Liteonit LCH-512V2S | |
| Read 4k | |
| Samsung SM951 MZVPV256HDGL m.2 PCI-e | |
| Liteonit LCH-512V2S | |
| Liteon L8H-256V2G | |

| 3DMark - 1280x720 Cloud Gate Standard Score | |
| Dell XPS 13 9350 WQXGA | |
| Lenovo ThinkPad X260-20F6007RGE | |
| Dell Latitude 12 E7270 | |
| HP EliteBook 820 G3 | |
| Dell Latitude 12 E7250 | |
| Dell Latitude 13 7370 | |
| 3DMark 11 - 1280x720 Performance | |
| Dell XPS 13 9350 WQXGA | |
| Dell Latitude 12 E7270 | |
| HP EliteBook 820 G3 | |
| Lenovo ThinkPad X260-20F6007RGE | |
| Dell Latitude 13 7370 | |
| Dell Latitude 12 E7250 | |
| 3DMark 11 Performance | 1433 puntos | |
| 3DMark Ice Storm Standard Score | 47956 puntos | |
| 3DMark Cloud Gate Standard Score | 5250 puntos | |
| 3DMark Fire Strike Score | 698 puntos | |
ayuda | ||
| bajo | medio | alto | ultra | |
|---|---|---|---|---|
| BioShock Infinite (2013) | 38 | 25 | 19 | 5 |
| Battlefield 4 (2013) | 35 | 25 | 16 | 5 |
| Rise of the Tomb Raider (2016) | 14 | 9 | 5 |
Ruido
| Ocioso |
| 28.9 / 28.9 / 28.9 dB(A) |
| Carga |
| 31.3 / 37.6 dB(A) |
 | ||
30 dB silencioso 40 dB(A) audible 50 dB(A) ruidosamente alto |
||
min: | ||
(±) La temperatura máxima en la parte superior es de 44.3 °C / 112 F, frente a la media de 35.9 °C / 97 F, que oscila entre 21.4 y 59 °C para la clase Subnotebook.
(-) El fondo se calienta hasta un máximo de 52.6 °C / 127 F, frente a la media de 39.2 °C / 103 F
(+) En reposo, la temperatura media de la parte superior es de 30.2 °C / 86# F, frente a la media del dispositivo de 30.8 °C / 87 F.
(+) Los reposamanos y el panel táctil alcanzan como máximo la temperatura de la piel (32.8 °C / 91 F) y, por tanto, no están calientes.
(-) La temperatura media de la zona del reposamanos de dispositivos similares fue de 28.2 °C / 82.8 F (-4.6 °C / -8.2 F).
| Off / Standby | |
| Ocioso | |
| Carga |
|
Clave:
min: | |
| Dell Latitude 12 E7270 55 Wh | Lenovo ThinkPad X260-20F6007RGE 46 Wh | HP Elitebook 820 G2-J8R58EA 46 Wh | Dell Latitude 12 E7250 52 Wh | Dell XPS 13 9350 WQXGA 56 Wh | Dell Latitude 13 7370 34 Wh | |
|---|---|---|---|---|---|---|
| Power Consumption | -2% | -5% | -23% | -41% | 0% | |
| Idle Minimum * (Watt) | 3.8 | 3.5 8% | 3.1 18% | 4.1 -8% | 7.2 -89% | 5 -32% |
| Idle Average * (Watt) | 6.7 | 5.5 18% | 5.8 13% | 8.3 -24% | 9.3 -39% | 7.5 -12% |
| Idle Maximum * (Watt) | 7.2 | 6.7 7% | 6.5 10% | 9.4 -31% | 11.6 -61% | 8 -11% |
| Load Average * (Watt) | 27.2 | 28.9 -6% | 30.5 -12% | 31.6 -16% | 31.9 -17% | 15.3 44% |
| Load Maximum * (Watt) | 30.2 | 42.1 -39% | 46.3 -53% | 40.4 -34% | 29.9 1% | 26.8 11% |
* ... más pequeño es mejor
| Battery Runtime - WiFi Websurfing | |
| Dell Latitude 12 E7270 | |
| Lenovo ThinkPad X260-20F6007RGE | |
| Dell Latitude 13 7370 | |
| HP Elitebook 820 G2-J8R58EA | |
| Dell XPS 13 9350 WQXGA | |
Pro
Contra
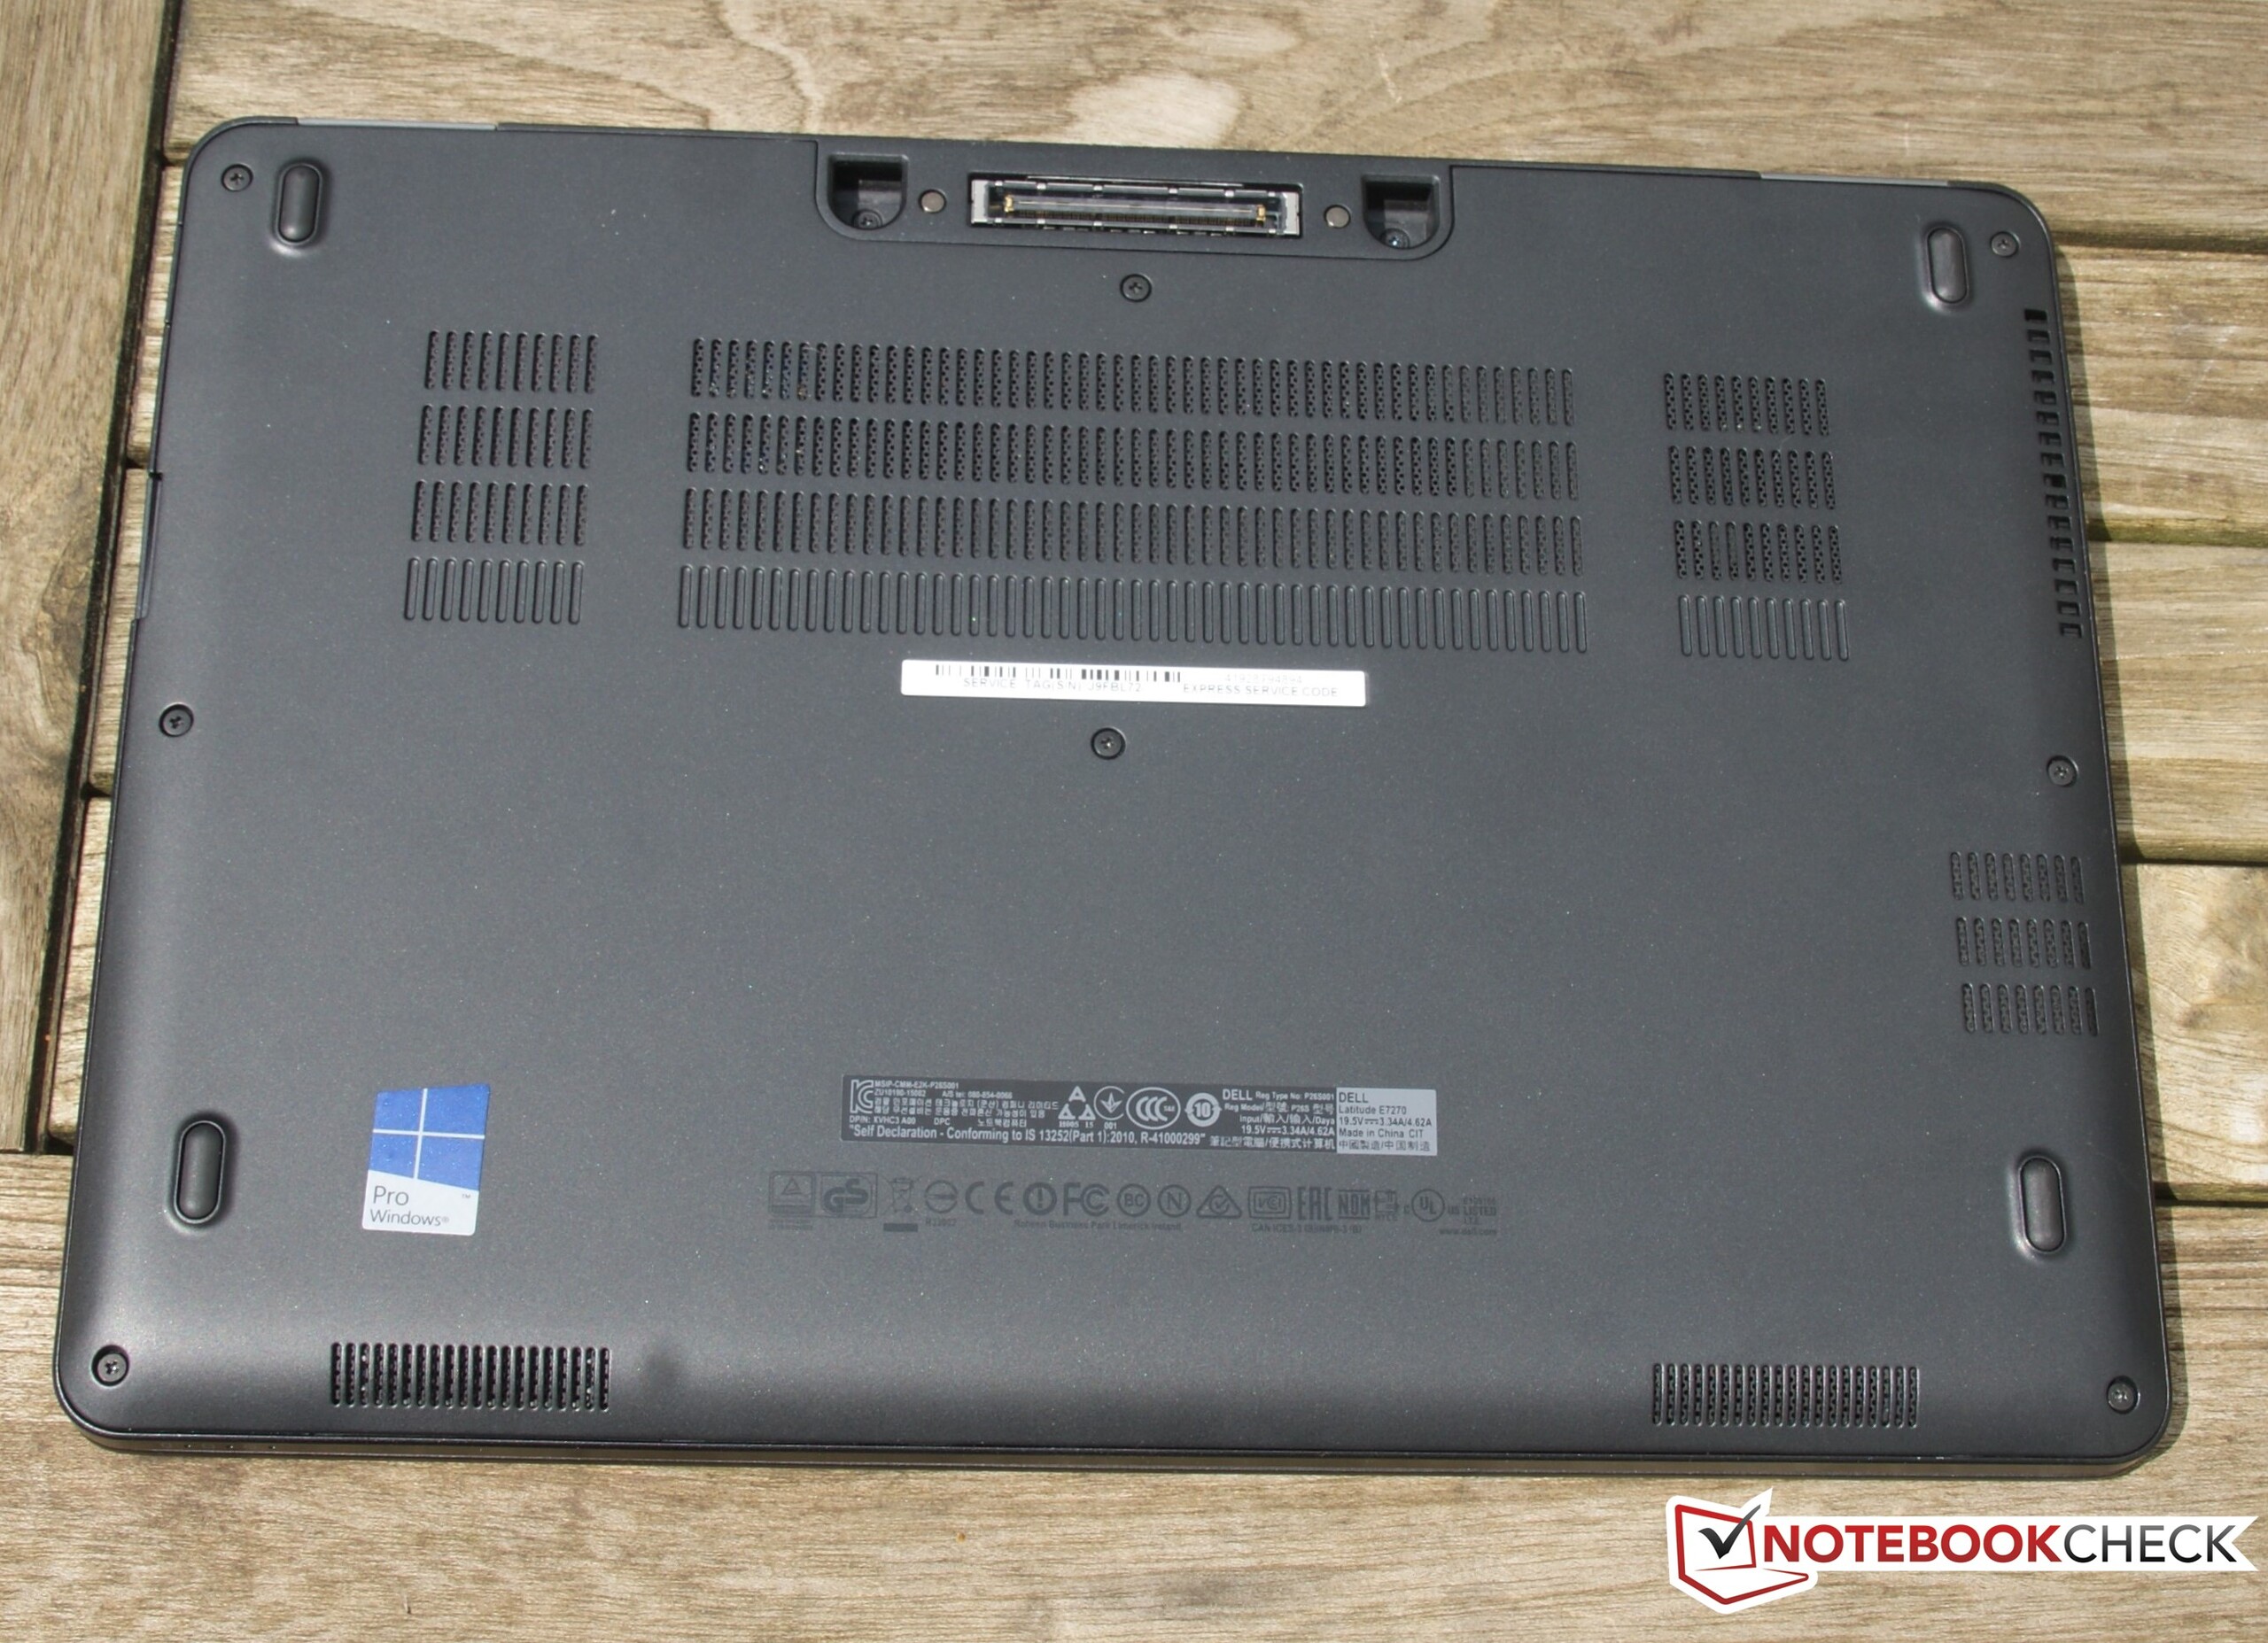
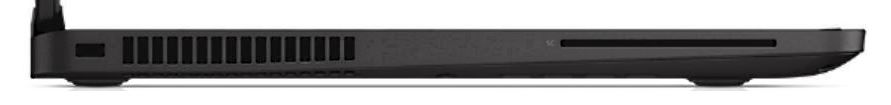
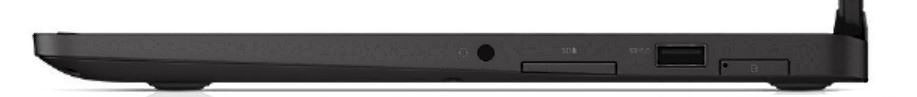
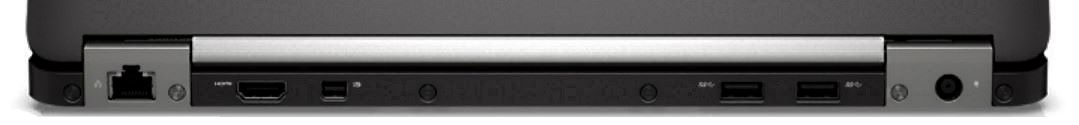
La actualización Skylake de la línea Latitude 7000 Series no decepciona. Con el E7270, Dell saca al mercado un dispositivo sólido y bien desarrollado que excita particularmente con su gran movilidad. La pantalla presenta un brillo elevado de más de 300 nits, más de lo que especifica Dell, la batería tiene un aguante sobresaliente, y el dispositivo es muy compacto, ligero y delgado. Gracias a la robusta carcasa, el usuario no tiene que preocuparse durante el transporte. Lo que es más, el E7270 es extremadamente flexible con una buena diversidad de puertos situados de forma ideal gracias a la tradicional construcción de arriba a abajo. El E7270 debería por tanto cumplir con su labor como oficinista móvil muy bien. Las características típicas business (seguridad, puerto de anclaje) están todas presentes.
Se puede dar una recomendación de compra para el grupo objetivo (usuarios business móviles). Sin embargo, también se puede para los HP 820 G3 y Lenovo ThinkPad X260. Los detalles marcan la diferencia aquí. El Latitude no trae TrackPoint, lo que parece una decisión inusual en el sector business, y es una desventaja frente a los oponentes. Aunque tiene una ventaja en el aguante de batería cuando se emplea la gran batería de 55 Wh, el rival de Lenovo se hace fuerte con su flexible tecnologia Power Bridge. Otro punto débil del E7270 es la reproducción de color de la pantalla. Sin embargo, el dispositivo Lenovo es sólo ligeramente mejor (el modelo HP sólo lo testamos con pantalla HD, lo que sería una comparación injusta).
Dell ofrece un oficinista sólido que también es competitivo. Sin embargo, el Latitude lo tendra difícil frente al propio Dell XPS 13 cuando no hagan falta las características especiales business.
Las cosas se complican cuando se mira más allá del sector business. El Dell XPS 13 ofrece, por menos dinero, una pantalla mejor y más grande, un diseño más moderno con biseles delgados, y además aguantará mejor el paso del tiempo gracias a Thunderbolt. Por otro lado, su ampliabilidad no es tan buena, y al dispositivo le faltan naturalmente ciertas características business que sí se encuentran en la competencia subportátil.
Ésta es una versión acortada del análisis original. Puedes leer el análisis completo en inglés aquí.
Dell Latitude 12 E7270
- 06/30/2016 v5.1 (old)
Benjamin Herzig