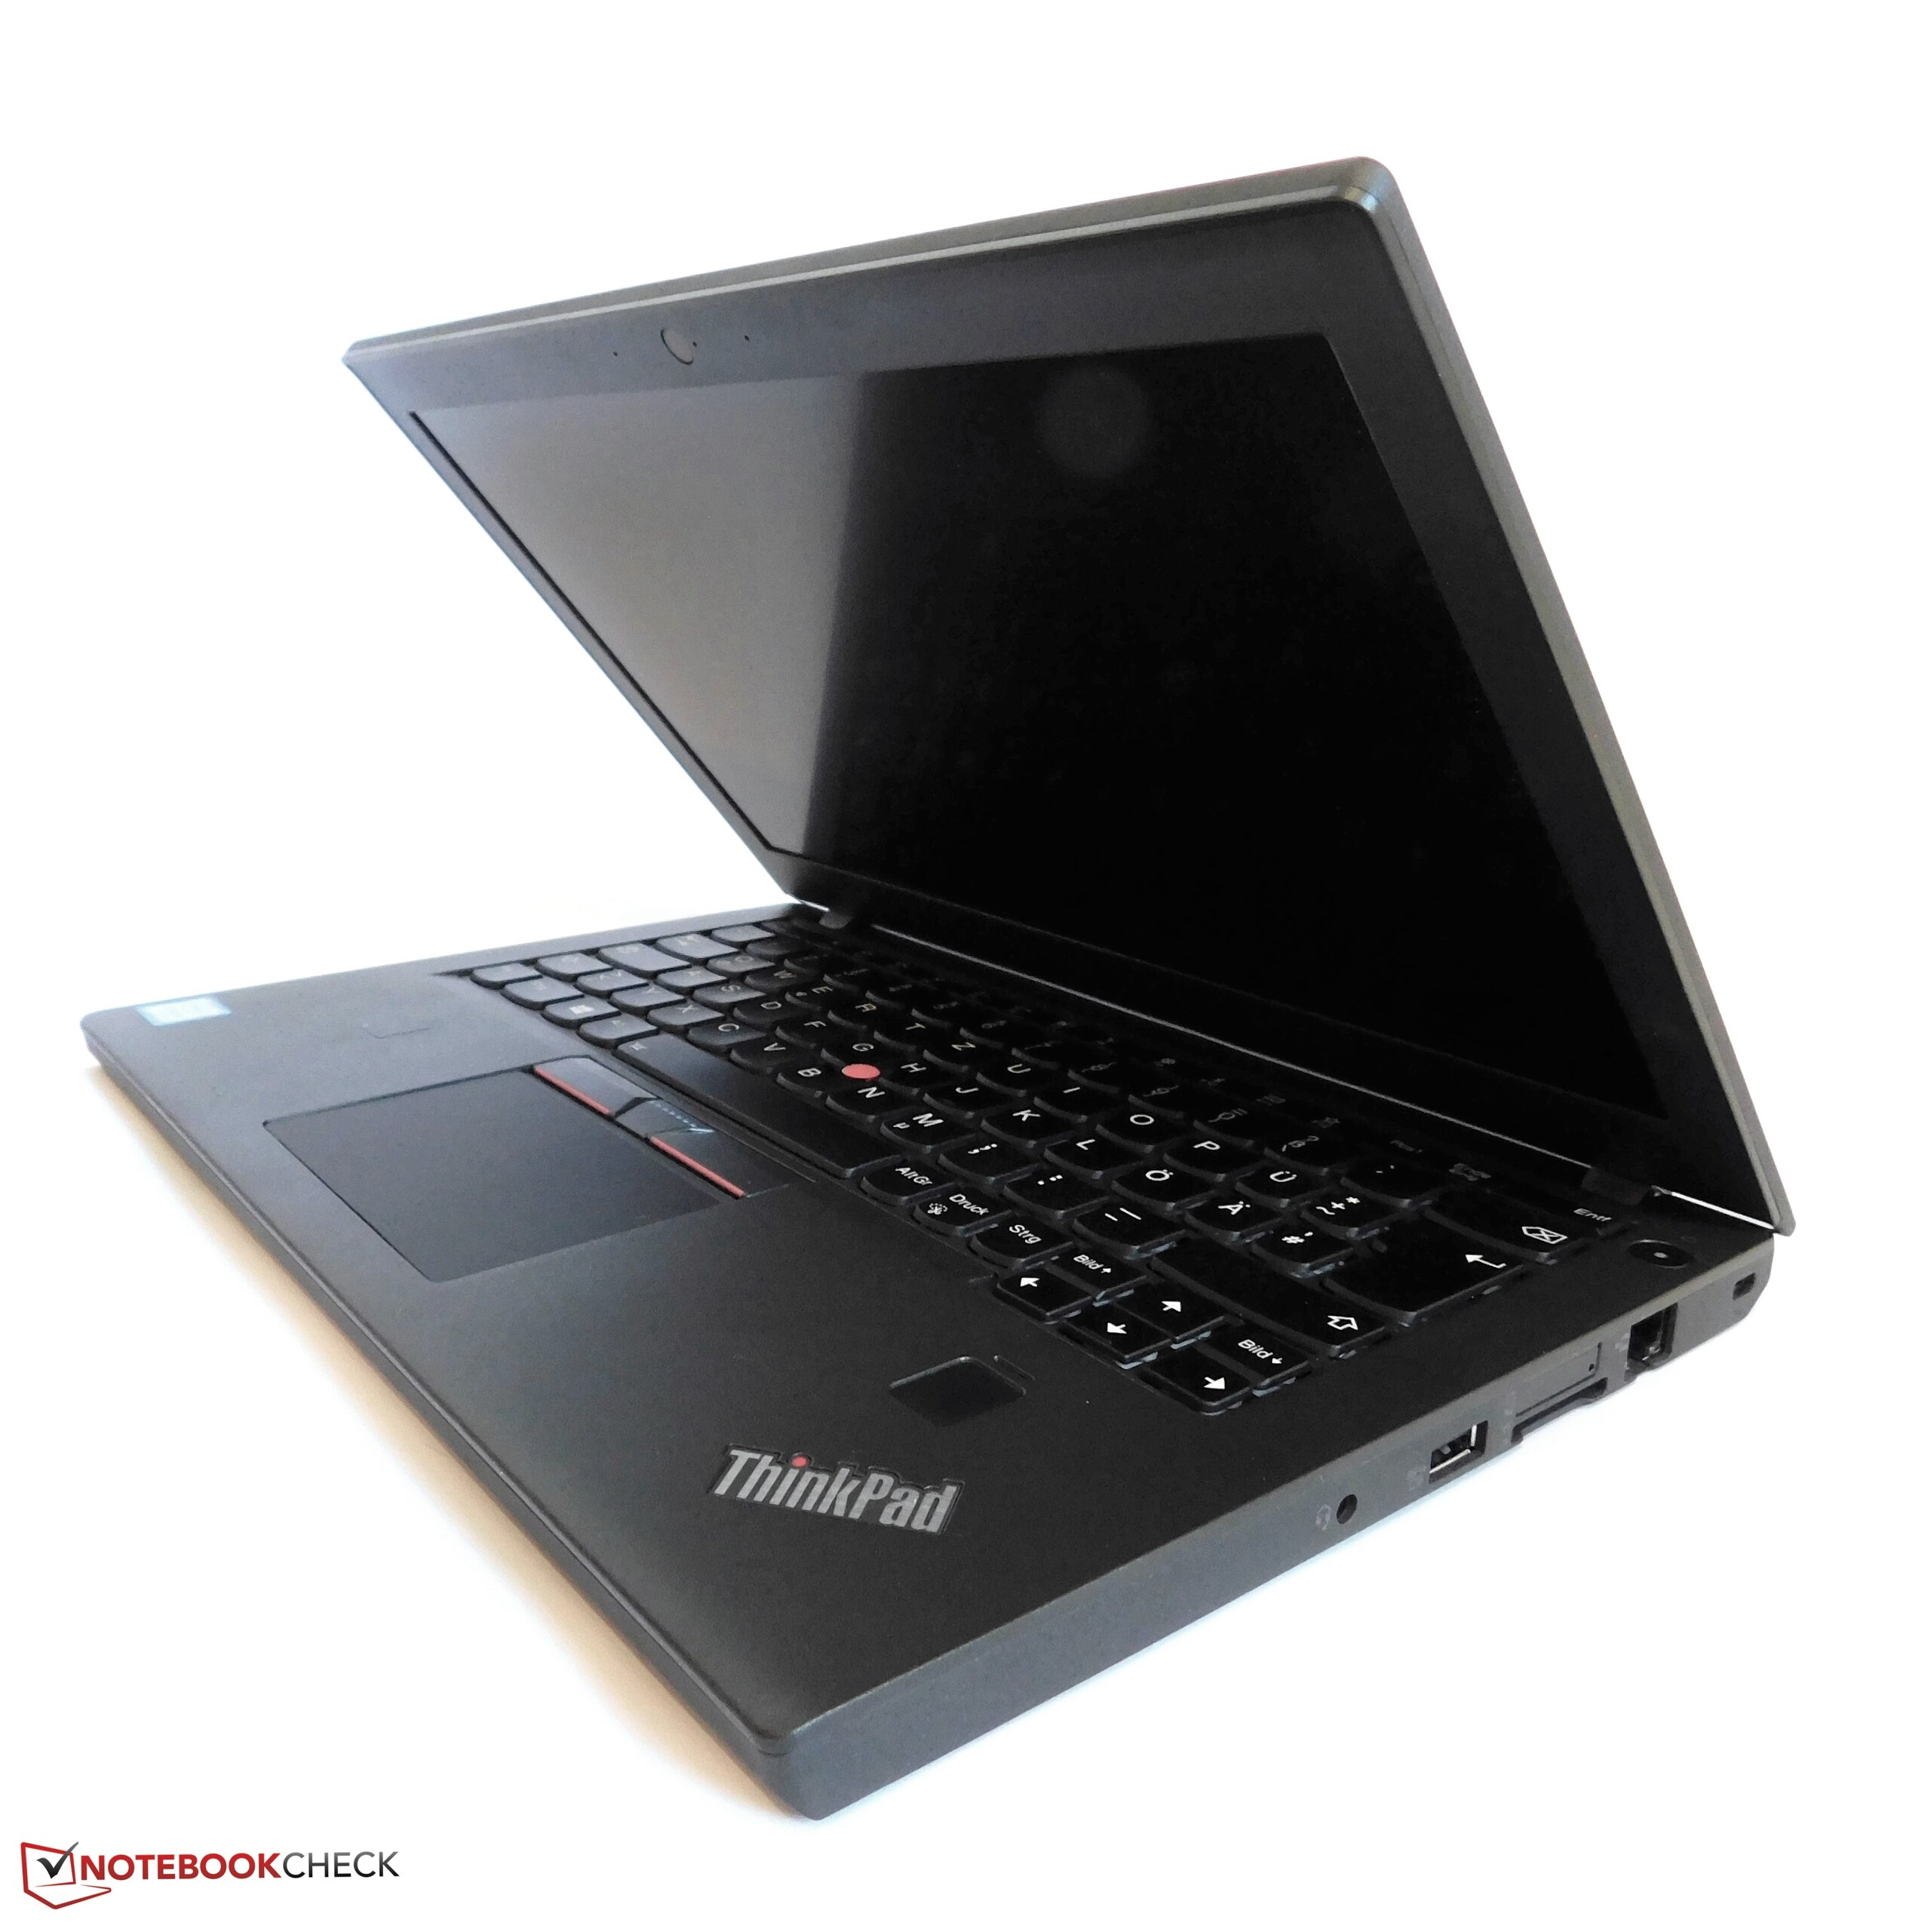
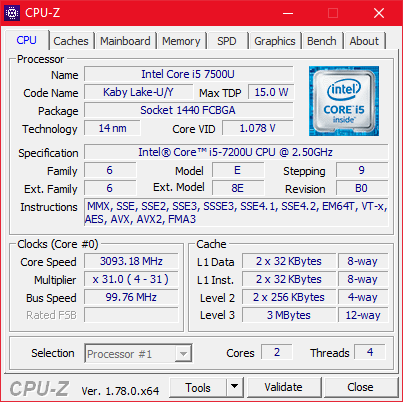
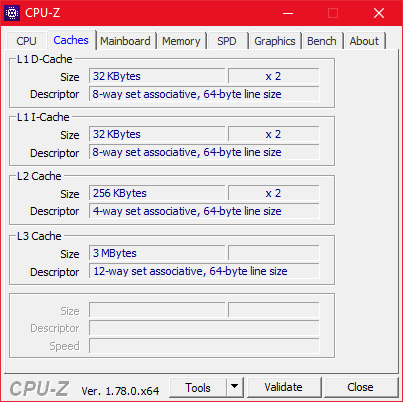
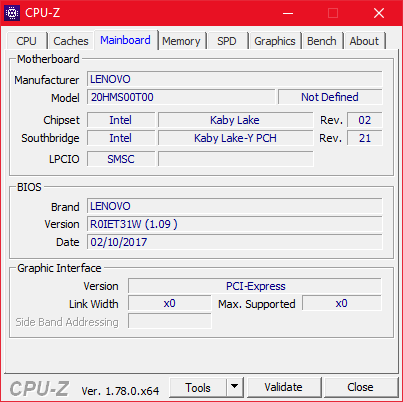
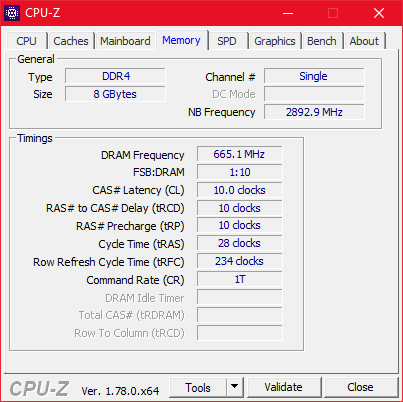
Breve análisis del portátil Lenovo ThinkPad X270 (Core i5, Full HD)
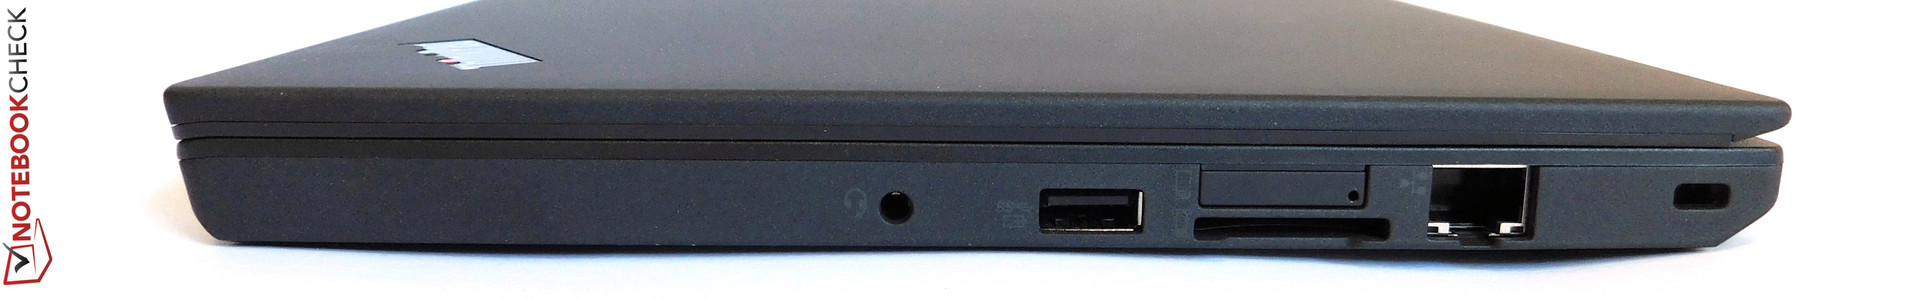
| SD Card Reader | |
| average JPG Copy Test (av. of 3 runs) | |
| HP EliteBook 820 G4 Z2V72ET | |
| Dell Latitude 7280 | |
| Lenovo ThinkPad X270-20HMS00T00 | |
| maximum AS SSD Seq Read Test (1GB) | |
| Dell Latitude 7280 | |
| Lenovo ThinkPad X270-20HMS00T00 | |
| HP EliteBook 820 G4 Z2V72ET | |
| Networking | |
| iperf3 transmit AX12 | |
| Dell Latitude 7280 | |
| Lenovo ThinkPad X270-20HMS00T00 | |
| HP EliteBook 820 G4 Z2V72ET (jseb) | |
| iperf3 receive AX12 | |
| Lenovo ThinkPad X270-20HMS00T00 | |
| Dell Latitude 7280 | |
| HP EliteBook 820 G4 Z2V72ET (jseb) | |
| |||||||||||||||||||||||||
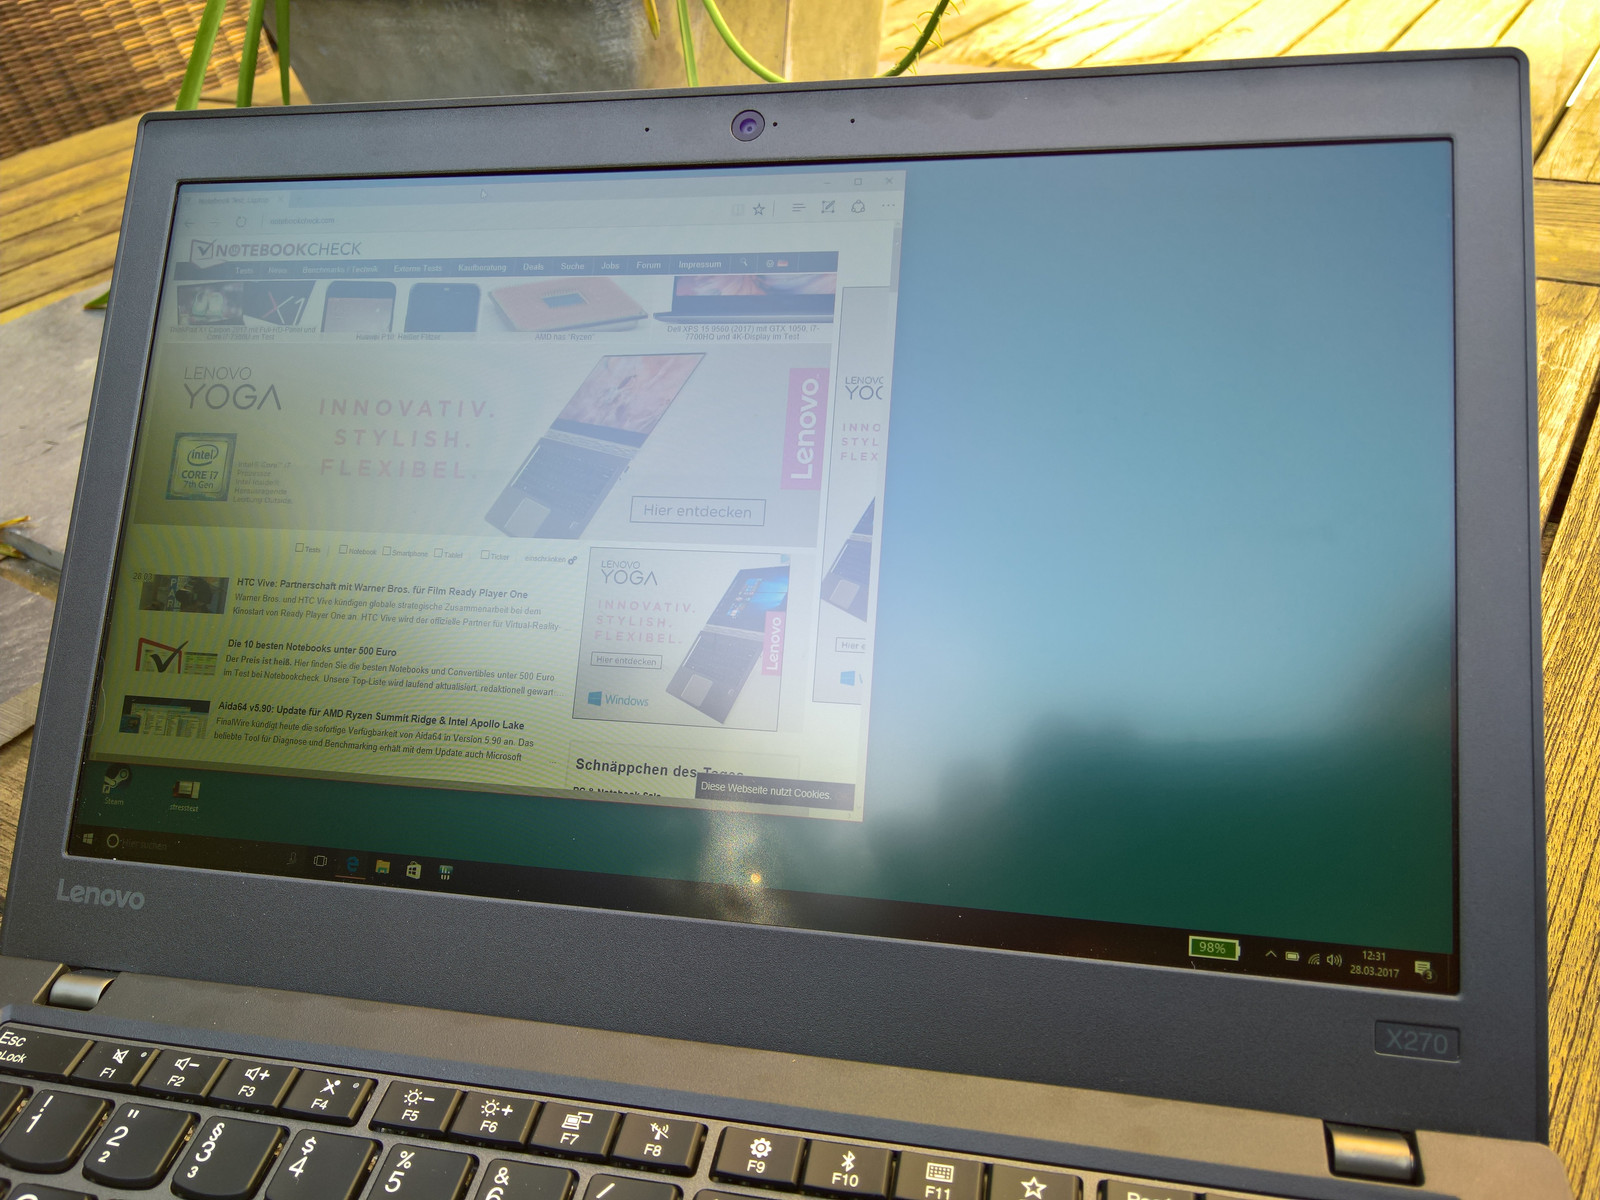
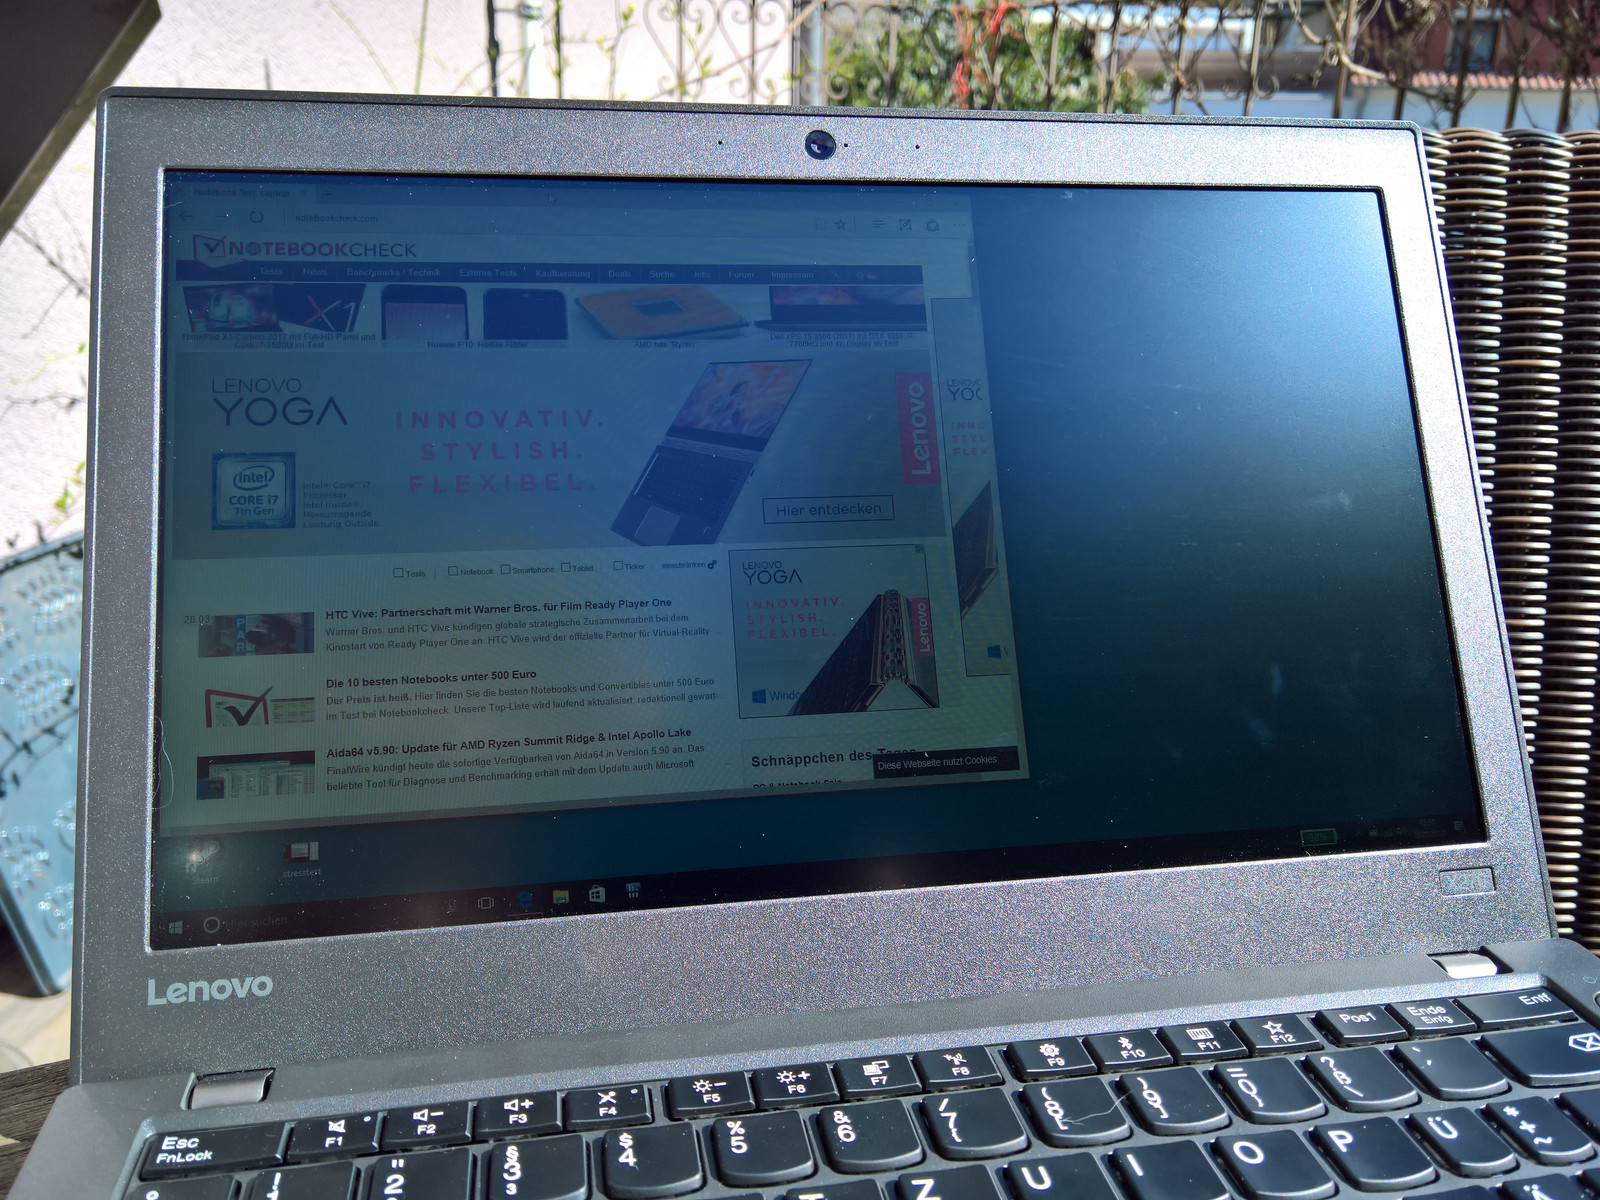
iluminación: 94 %
Brillo con batería: 282 cd/m²
Contraste: 1132:1 (Negro: 0.25 cd/m²)
ΔE ColorChecker Calman: 6.1 | ∀{0.5-29.43 Ø4.72}
ΔE Greyscale Calman: 6 | ∀{0.09-98 Ø4.97}
65.43% sRGB (Argyll 1.6.3 3D)
42.26% AdobeRGB 1998 (Argyll 1.6.3 3D)
46.11% AdobeRGB 1998 (Argyll 3D)
65.9% sRGB (Argyll 3D)
44.6% Display P3 (Argyll 3D)
Gamma: 2.05
CCT: 6832 K
| Lenovo ThinkPad X270-20HMS00T00 Innolux N125HCE-GN1, , 1920x1080, 12.5" | Dell Latitude 7280 AUO236D , , 1920x1080, 12.5" | HP EliteBook 820 G4 Z2V72ET Chi Mei, , 1920x1080, 12.5" | Lenovo ThinkPad X1 Carbon 2017-20HQS03P00 B140HAN03_1, , 1920x1080, 14" | Dell XPS 13 9360 FHD i5 Sharp SHP1449 LQ133M1, , 1920x1080, 13.3" | Lenovo ThinkPad X260-20F6007RGE Lenovo N125HCE-GN1, , 1920x1080, 12.5" | |
|---|---|---|---|---|---|---|
| Display | -0% | -0% | 34% | 10% | 0% | |
| Display P3 Coverage (%) | 44.6 44.6 | 44.41 0% | 44.45 0% | 61.4 38% | 48.94 10% | 44.71 0% |
| sRGB Coverage (%) | 65.9 65.9 | 65.4 -1% | 65.5 -1% | 85.9 30% | 73.3 11% | 66.1 0% |
| AdobeRGB 1998 Coverage (%) | 46.11 46.11 | 45.9 0% | 46.04 0% | 62.4 35% | 50.5 10% | 46.23 0% |
| Response Times | 9% | 14% | -3% | 6% | 16% | |
| Response Time Grey 50% / Grey 80% * (ms) | 40.8 ? | 32.4 ? 21% | 35 ? 14% | 41.6 ? -2% | 32.8 ? 20% | 32.8 ? 20% |
| Response Time Black / White * (ms) | 30.4 ? | 31.2 ? -3% | 26 ? 14% | 31.6 ? -4% | 33.2 ? -9% | 27.2 ? 11% |
| PWM Frequency (Hz) | 26040 ? | |||||
| Screen | -5% | -2% | 13% | 16% | 2% | |
| Brightness middle (cd/m²) | 283 | 310.4 10% | 326 15% | 311 10% | 351.2 24% | 337 19% |
| Brightness (cd/m²) | 281 | 301 7% | 304 8% | 288 2% | 325 16% | 322 15% |
| Brightness Distribution (%) | 94 | 88 -6% | 81 -14% | 85 -10% | 89 -5% | 91 -3% |
| Black Level * (cd/m²) | 0.25 | 0.32 -28% | 0.29 -16% | 0.24 4% | 0.195 22% | 0.32 -28% |
| Contrast (:1) | 1132 | 970 -14% | 1124 -1% | 1296 14% | 1801 59% | 1053 -7% |
| Colorchecker dE 2000 * | 6.1 | 5.9 3% | 6.49 -6% | 5.5 10% | 7.4 -21% | 5.71 6% |
| Colorchecker dE 2000 max. * | 15.4 | 21 -36% | 15.95 -4% | 9 42% | 9.08 41% | 15.39 -0% |
| Greyscale dE 2000 * | 6 | 5.1 15% | 6.16 -3% | 6.2 -3% | 6.71 -12% | 5.15 14% |
| Gamma | 2.05 107% | 2.33 94% | 2.32 95% | 2.02 109% | 2.74 80% | 2.38 92% |
| CCT | 6832 95% | 6816 95% | 7575 86% | 5950 109% | 7222 90% | 6881 94% |
| Color Space (Percent of AdobeRGB 1998) (%) | 42.26 | 42 -1% | 42 -1% | 55.96 32% | 50.48 19% | 42.38 0% |
| Color Space (Percent of sRGB) (%) | 65.43 | 65 -1% | 65 -1% | 85.77 31% | 73.31 12% | 65.62 0% |
| Media total (Programa/Opciones) | 1% /
-2% | 4% /
0% | 15% /
15% | 11% /
13% | 6% /
3% |
* ... más pequeño es mejor
Tiempos de respuesta del display
| ↔ Tiempo de respuesta de Negro a Blanco | ||
|---|---|---|
| 30.4 ms ... subida ↗ y bajada ↘ combinada | ↗ 16.4 ms subida | 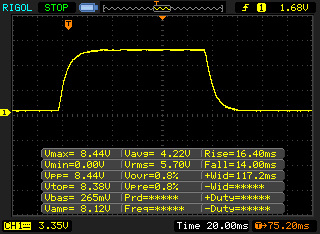 |
| ↘ 14 ms bajada | ||
| La pantalla mostró tiempos de respuesta lentos en nuestros tests y podría ser demasiado lenta para los jugones. En comparación, todos los dispositivos de prueba van de ##min### (mínimo) a 240 (máximo) ms. » 82 % de todos los dispositivos son mejores. Eso quiere decir que el tiempo de respuesta es peor que la media (19.8 ms) de todos los dispositivos testados. | ||
| ↔ Tiempo de respuesta 50% Gris a 80% Gris | ||
| 40.8 ms ... subida ↗ y bajada ↘ combinada | ↗ 21.2 ms subida | 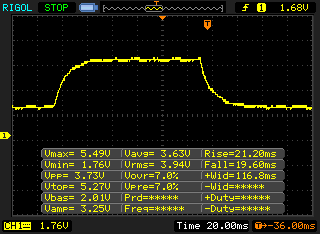 |
| ↘ 19.6 ms bajada | ||
| La pantalla mostró tiempos de respuesta lentos en nuestros tests y podría ser demasiado lenta para los jugones. En comparación, todos los dispositivos de prueba van de ##min### (mínimo) a 636 (máximo) ms. » 64 % de todos los dispositivos son mejores. Eso quiere decir que el tiempo de respuesta es peor que la media (31 ms) de todos los dispositivos testados. | ||
Parpadeo de Pantalla / PWM (Pulse-Width Modulation)
| Parpadeo de Pantalla / PWM detectado | 26040 Hz | ≤ 50 % de brillo | 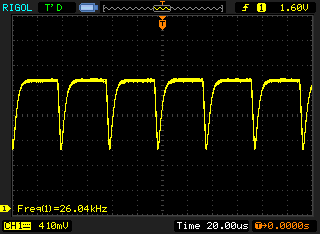 |
La retroiluminación del display parpadea a 26040 Hz (seguramente usa PWM - Pulse-Width Modulation) a un brillo del 50 % e inferior. Sobre este nivel de brillo no debería darse parpadeo / PWM. La frecuencia de 26040 Hz es bastante alta, por lo que la mayoría de gente sensible al parpadeo no debería ver parpadeo o tener fatiga visual. Comparación: 52 % de todos los dispositivos testados no usaron PWM para atenuar el display. Si se usó, medimos una media de 7763 (mínimo: 5 - máxmo: 343500) Hz. | |||
| PCMark 8 Home Score Accelerated v2 | 3575 puntos | |
| PCMark 8 Work Score Accelerated v2 | 4660 puntos | |
ayuda | ||
| Lenovo ThinkPad X270-20HMS00T00 Toshiba NVMe THNSF5512GPUK | Dell Latitude 7280 SanDisk X400 M.2 2280 256GB | HP EliteBook 820 G4 Z2V72ET Samsung PM951 NVMe MZVLV512 | Lenovo ThinkPad X1 Carbon 2017-20HQS03P00 Samsung PM961 NVMe MZVLW512HMJP | Dell XPS 13 9360 FHD i5 Toshiba NVMe THNSN5256GPUK | Lenovo ThinkPad X260-20F6007RGE Liteonit LCH-512V2S | |
|---|---|---|---|---|---|---|
| CrystalDiskMark 3.0 | -45% | 5% | 43% | -12% | -42% | |
| Read Seq (MB/s) | 1190 | 470.8 -60% | 1315 11% | 1827 54% | 1233 4% | 499.6 -58% |
| Write Seq (MB/s) | 985 | 477.4 -52% | 594 -40% | 1383 40% | 733 -26% | 403 -59% |
| Read 512 (MB/s) | 858 | 370.1 -57% | 661 -23% | 814 -5% | 1036 21% | 322.9 -62% |
| Write 512 (MB/s) | 528 | 323.2 -39% | 594 13% | 1098 108% | 439.9 -17% | 372.4 -29% |
| Read 4k (MB/s) | 35.27 | 30.23 -14% | 42.87 22% | 61 73% | 29.31 -17% | 27.22 -23% |
| Write 4k (MB/s) | 124.5 | 59.5 -52% | 151.6 22% | 172.2 38% | 116.9 -6% | 83.6 -33% |
| Read 4k QD32 (MB/s) | 495.3 | 344.4 -30% | 568 15% | 601 21% | 479.2 -3% | 316.5 -36% |
| Write 4k QD32 (MB/s) | 418.3 | 183 -56% | 491.7 18% | 495.6 18% | 218.3 -48% | 273.1 -35% |

| 3DMark 11 Performance | 1543 puntos | |
| 3DMark Cloud Gate Standard Score | 5519 puntos | |
| 3DMark Fire Strike Score | 739 puntos | |
ayuda | ||
| bajo | medio | alto | ultra | |
|---|---|---|---|---|
| BioShock Infinite (2013) | 42.8 | 25.3 | 20.8 | 6.5 |
| Rise of the Tomb Raider (2016) | 19.1 | |||
| Civilization 6 (2016) | 30.7 | 10.3 |
Ruido
| Ocioso |
| 29 / 29 / 30.4 dB(A) |
| Carga |
| 34.1 / 37.6 dB(A) |
 | ||
30 dB silencioso 40 dB(A) audible 50 dB(A) ruidosamente alto |
||
min: | ||
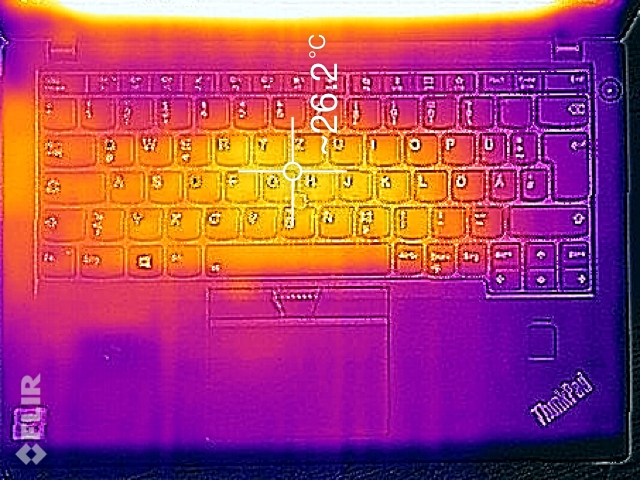
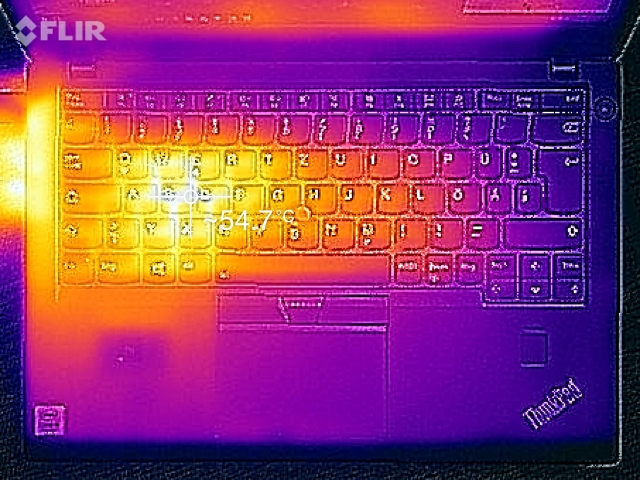
(-) La temperatura máxima en la parte superior es de 52.9 °C / 127 F, frente a la media de 34.3 °C / 94 F, que oscila entre 21.2 y 62.5 °C para la clase Office.
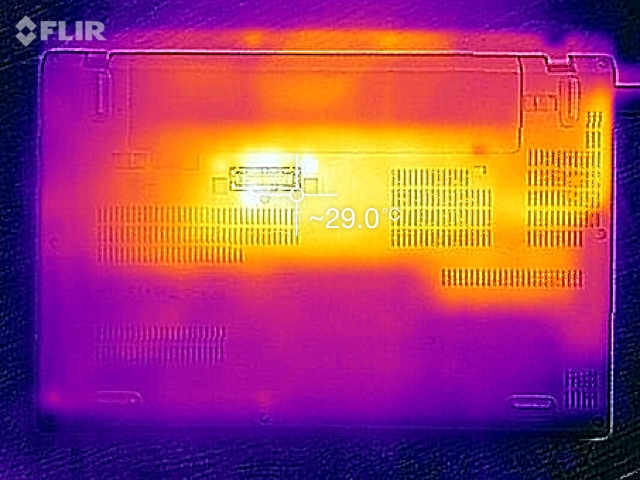
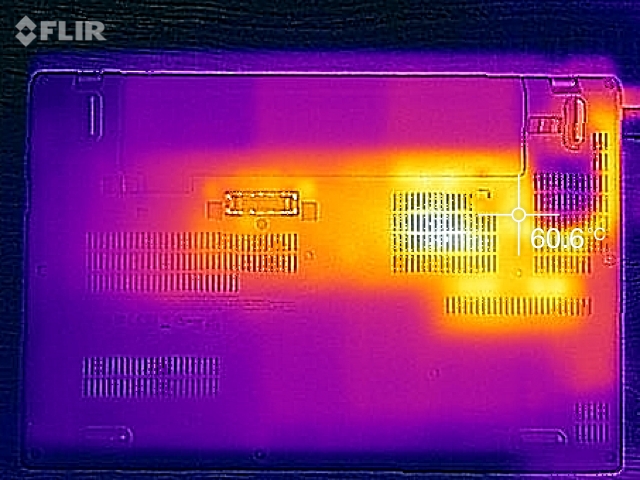
(-) El fondo se calienta hasta un máximo de 57.8 °C / 136 F, frente a la media de 36.8 °C / 98 F
(+) En reposo, la temperatura media de la parte superior es de 24.1 °C / 75# F, frente a la media del dispositivo de 29.5 °C / 85 F.
(±) El reposamanos y el touchpad pueden calentarse mucho al tacto con un máximo de 38.5 °C / 101.3 F.
(-) La temperatura media de la zona del reposamanos de dispositivos similares fue de 27.5 °C / 81.5 F (-11 °C / -19.8 F).
Lenovo ThinkPad X270-20HMS00T00 análisis de audio
(-) | altavoces no muy altos (#66.8 dB)
Graves 100 - 315 Hz
(-) | casi sin bajos - de media 18.8% inferior a la mediana
(±) | la linealidad de los graves es media (11.1% delta a frecuencia anterior)
Medios 400 - 2000 Hz
(+) | medios equilibrados - a sólo 1.5% de la mediana
(+) | los medios son lineales (5.4% delta a la frecuencia anterior)
Altos 2 - 16 kHz
(+) | máximos equilibrados - a sólo 3.1% de la mediana
(+) | los máximos son lineales (6.4% delta a la frecuencia anterior)
Total 100 - 16.000 Hz
(±) | la linealidad del sonido global es media (22.3% de diferencia con la mediana)
En comparación con la misma clase
» 59% de todos los dispositivos probados de esta clase eran mejores, 9% similares, 32% peores
» El mejor tuvo un delta de 7%, la media fue 21%, el peor fue ###max##%
En comparación con todos los dispositivos probados
» 65% de todos los dispositivos probados eran mejores, 6% similares, 29% peores
» El mejor tuvo un delta de 4%, la media fue 24%, el peor fue ###max##%
Apple MacBook 12 (Early 2016) 1.1 GHz análisis de audio
(+) | los altavoces pueden reproducir a un volumen relativamente alto (#83.6 dB)
Graves 100 - 315 Hz
(±) | lubina reducida - en promedio 11.3% inferior a la mediana
(±) | la linealidad de los graves es media (14.2% delta a frecuencia anterior)
Medios 400 - 2000 Hz
(+) | medios equilibrados - a sólo 2.4% de la mediana
(+) | los medios son lineales (5.5% delta a la frecuencia anterior)
Altos 2 - 16 kHz
(+) | máximos equilibrados - a sólo 2% de la mediana
(+) | los máximos son lineales (4.5% delta a la frecuencia anterior)
Total 100 - 16.000 Hz
(+) | el sonido global es lineal (10.2% de diferencia con la mediana)
En comparación con la misma clase
» 7% de todos los dispositivos probados de esta clase eran mejores, 2% similares, 91% peores
» El mejor tuvo un delta de 5%, la media fue 18%, el peor fue ###max##%
En comparación con todos los dispositivos probados
» 5% de todos los dispositivos probados eran mejores, 1% similares, 94% peores
» El mejor tuvo un delta de 4%, la media fue 24%, el peor fue ###max##%
| Off / Standby | |
| Ocioso | |
| Carga |
|
Clave:
min: | |
| Lenovo ThinkPad X270-20HMS00T00 i5-7200U, HD Graphics 620, Toshiba NVMe THNSF5512GPUK, IPS LED, 1920x1080, 12.5" | Dell Latitude 7280 i7-7600U, HD Graphics 620, SanDisk X400 M.2 2280 256GB, IPS, 1920x1080, 12.5" | HP EliteBook 820 G4 Z2V72ET i7-7500U, HD Graphics 620, Samsung PM951 NVMe MZVLV512, IPS, 1920x1080, 12.5" | Lenovo ThinkPad X1 Carbon 2017-20HQS03P00 i7-7500U, HD Graphics 620, Samsung PM961 NVMe MZVLW512HMJP, IPS, 1920x1080, 14" | Dell XPS 13 9360 FHD i5 i5-7200U, HD Graphics 620, Toshiba NVMe THNSN5256GPUK, IPS, 1920x1080, 13.3" | Lenovo ThinkPad X260-20F6007RGE 6500U, HD Graphics 520, Liteonit LCH-512V2S, IPS, 1920x1080, 12.5" | |
|---|---|---|---|---|---|---|
| Power Consumption | 11% | 19% | -16% | 21% | 5% | |
| Idle Minimum * (Watt) | 3.5 | 4.28 -22% | 2.7 23% | 3.84 -10% | 4.1 -17% | 3.5 -0% |
| Idle Average * (Watt) | 5.8 | 5.11 12% | 4.8 17% | 6.3 -9% | 4.2 28% | 5.5 5% |
| Idle Maximum * (Watt) | 7.6 | 5.49 28% | 6.6 13% | 8.6 -13% | 5.1 33% | 6.7 12% |
| Load Average * (Watt) | 33.2 | 29.83 10% | 28.5 14% | 41.9 -26% | 22.1 33% | 28.9 13% |
| Load Maximum * (Watt) | 40.4 | 30.05 26% | 29 28% | 48.7 -21% | 29.4 27% | 42.1 -4% |
* ... más pequeño es mejor
| Lenovo ThinkPad X270-20HMS00T00 i5-7200U, HD Graphics 620, 46 Wh | Dell Latitude 7280 i7-7600U, HD Graphics 620, 60 Wh | HP EliteBook 820 G4 Z2V72ET i7-7500U, HD Graphics 620, 49 Wh | Lenovo ThinkPad X1 Carbon 2017-20HQS03P00 i7-7500U, HD Graphics 620, 57 Wh | Dell XPS 13 9360 FHD i5 i5-7200U, HD Graphics 620, 60 Wh | Lenovo ThinkPad X260-20F6007RGE 6500U, HD Graphics 520, 46 Wh | |
|---|---|---|---|---|---|---|
| Duración de Batería | 74% | 59% | 39% | 63% | 13% | |
| Reader / Idle (h) | 17.1 | 25.9 51% | 22.4 31% | 20.9 22% | 21.6 26% | 15.9 -7% |
| H.264 (h) | 6.8 | 8.9 31% | 11.9 75% | 7.8 15% | ||
| WiFi v1.3 (h) | 5.4 | 11.4 111% | 9.4 74% | 8.3 54% | 11.3 109% | 8.4 56% |
| Load (h) | 1.7 | 2.7 59% | 3.4 100% | 1.8 6% | 2.6 53% | 1.5 -12% |
Pro
Contra
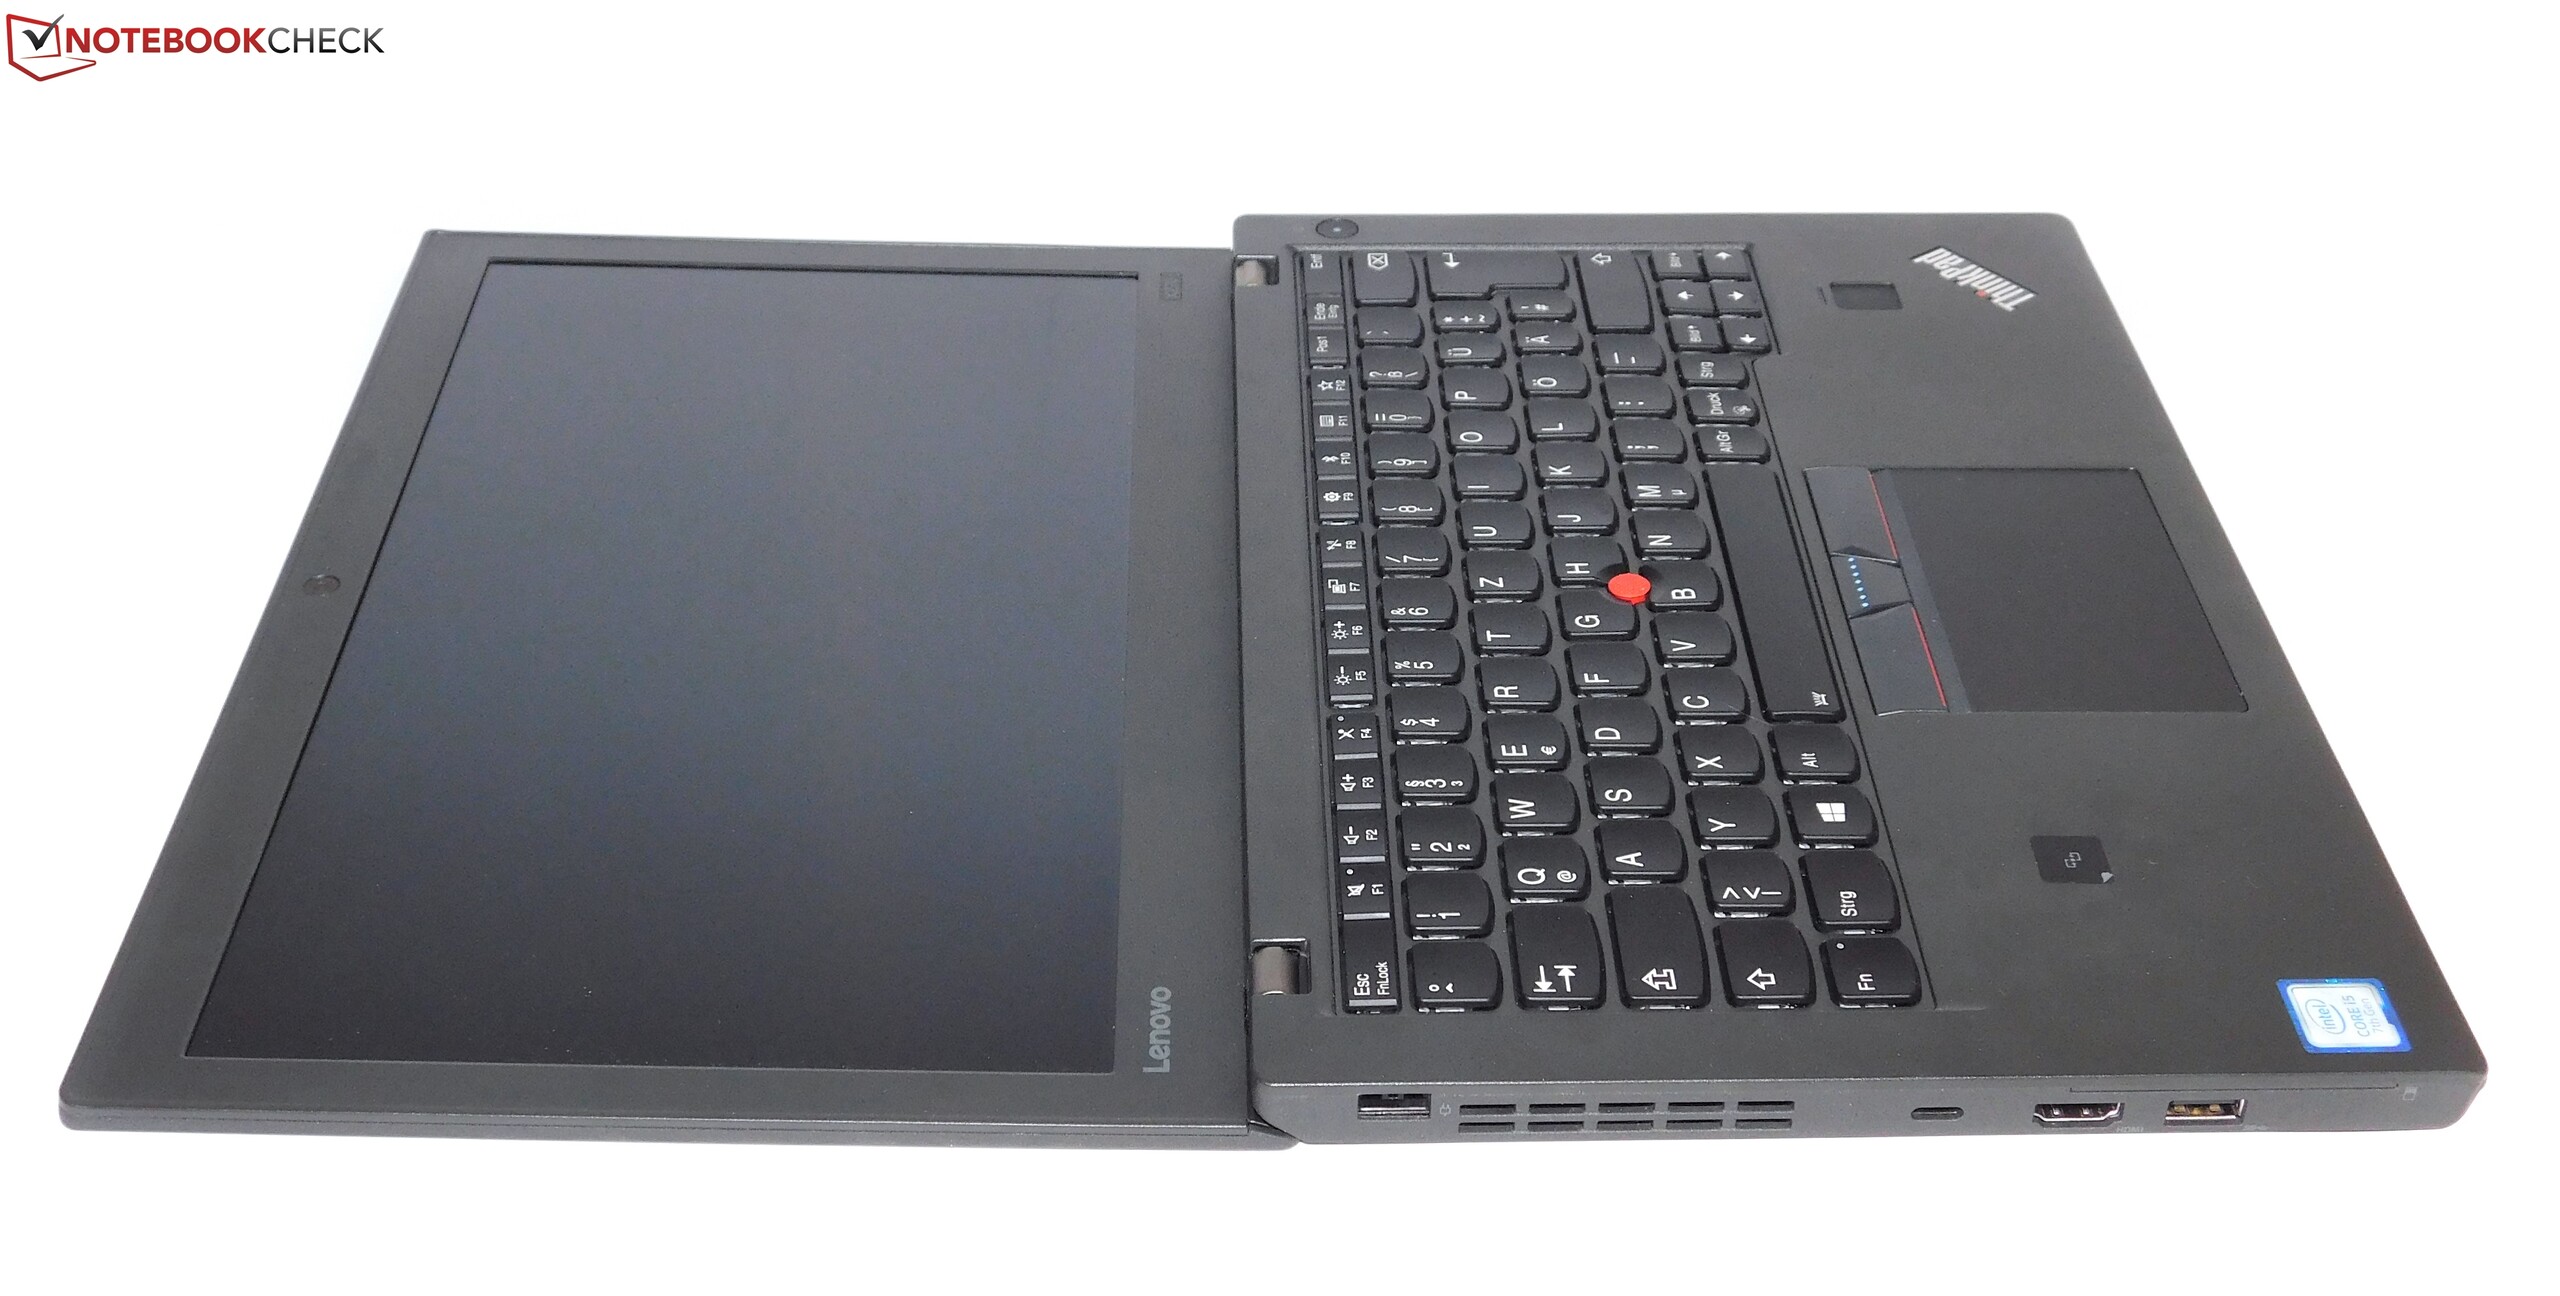
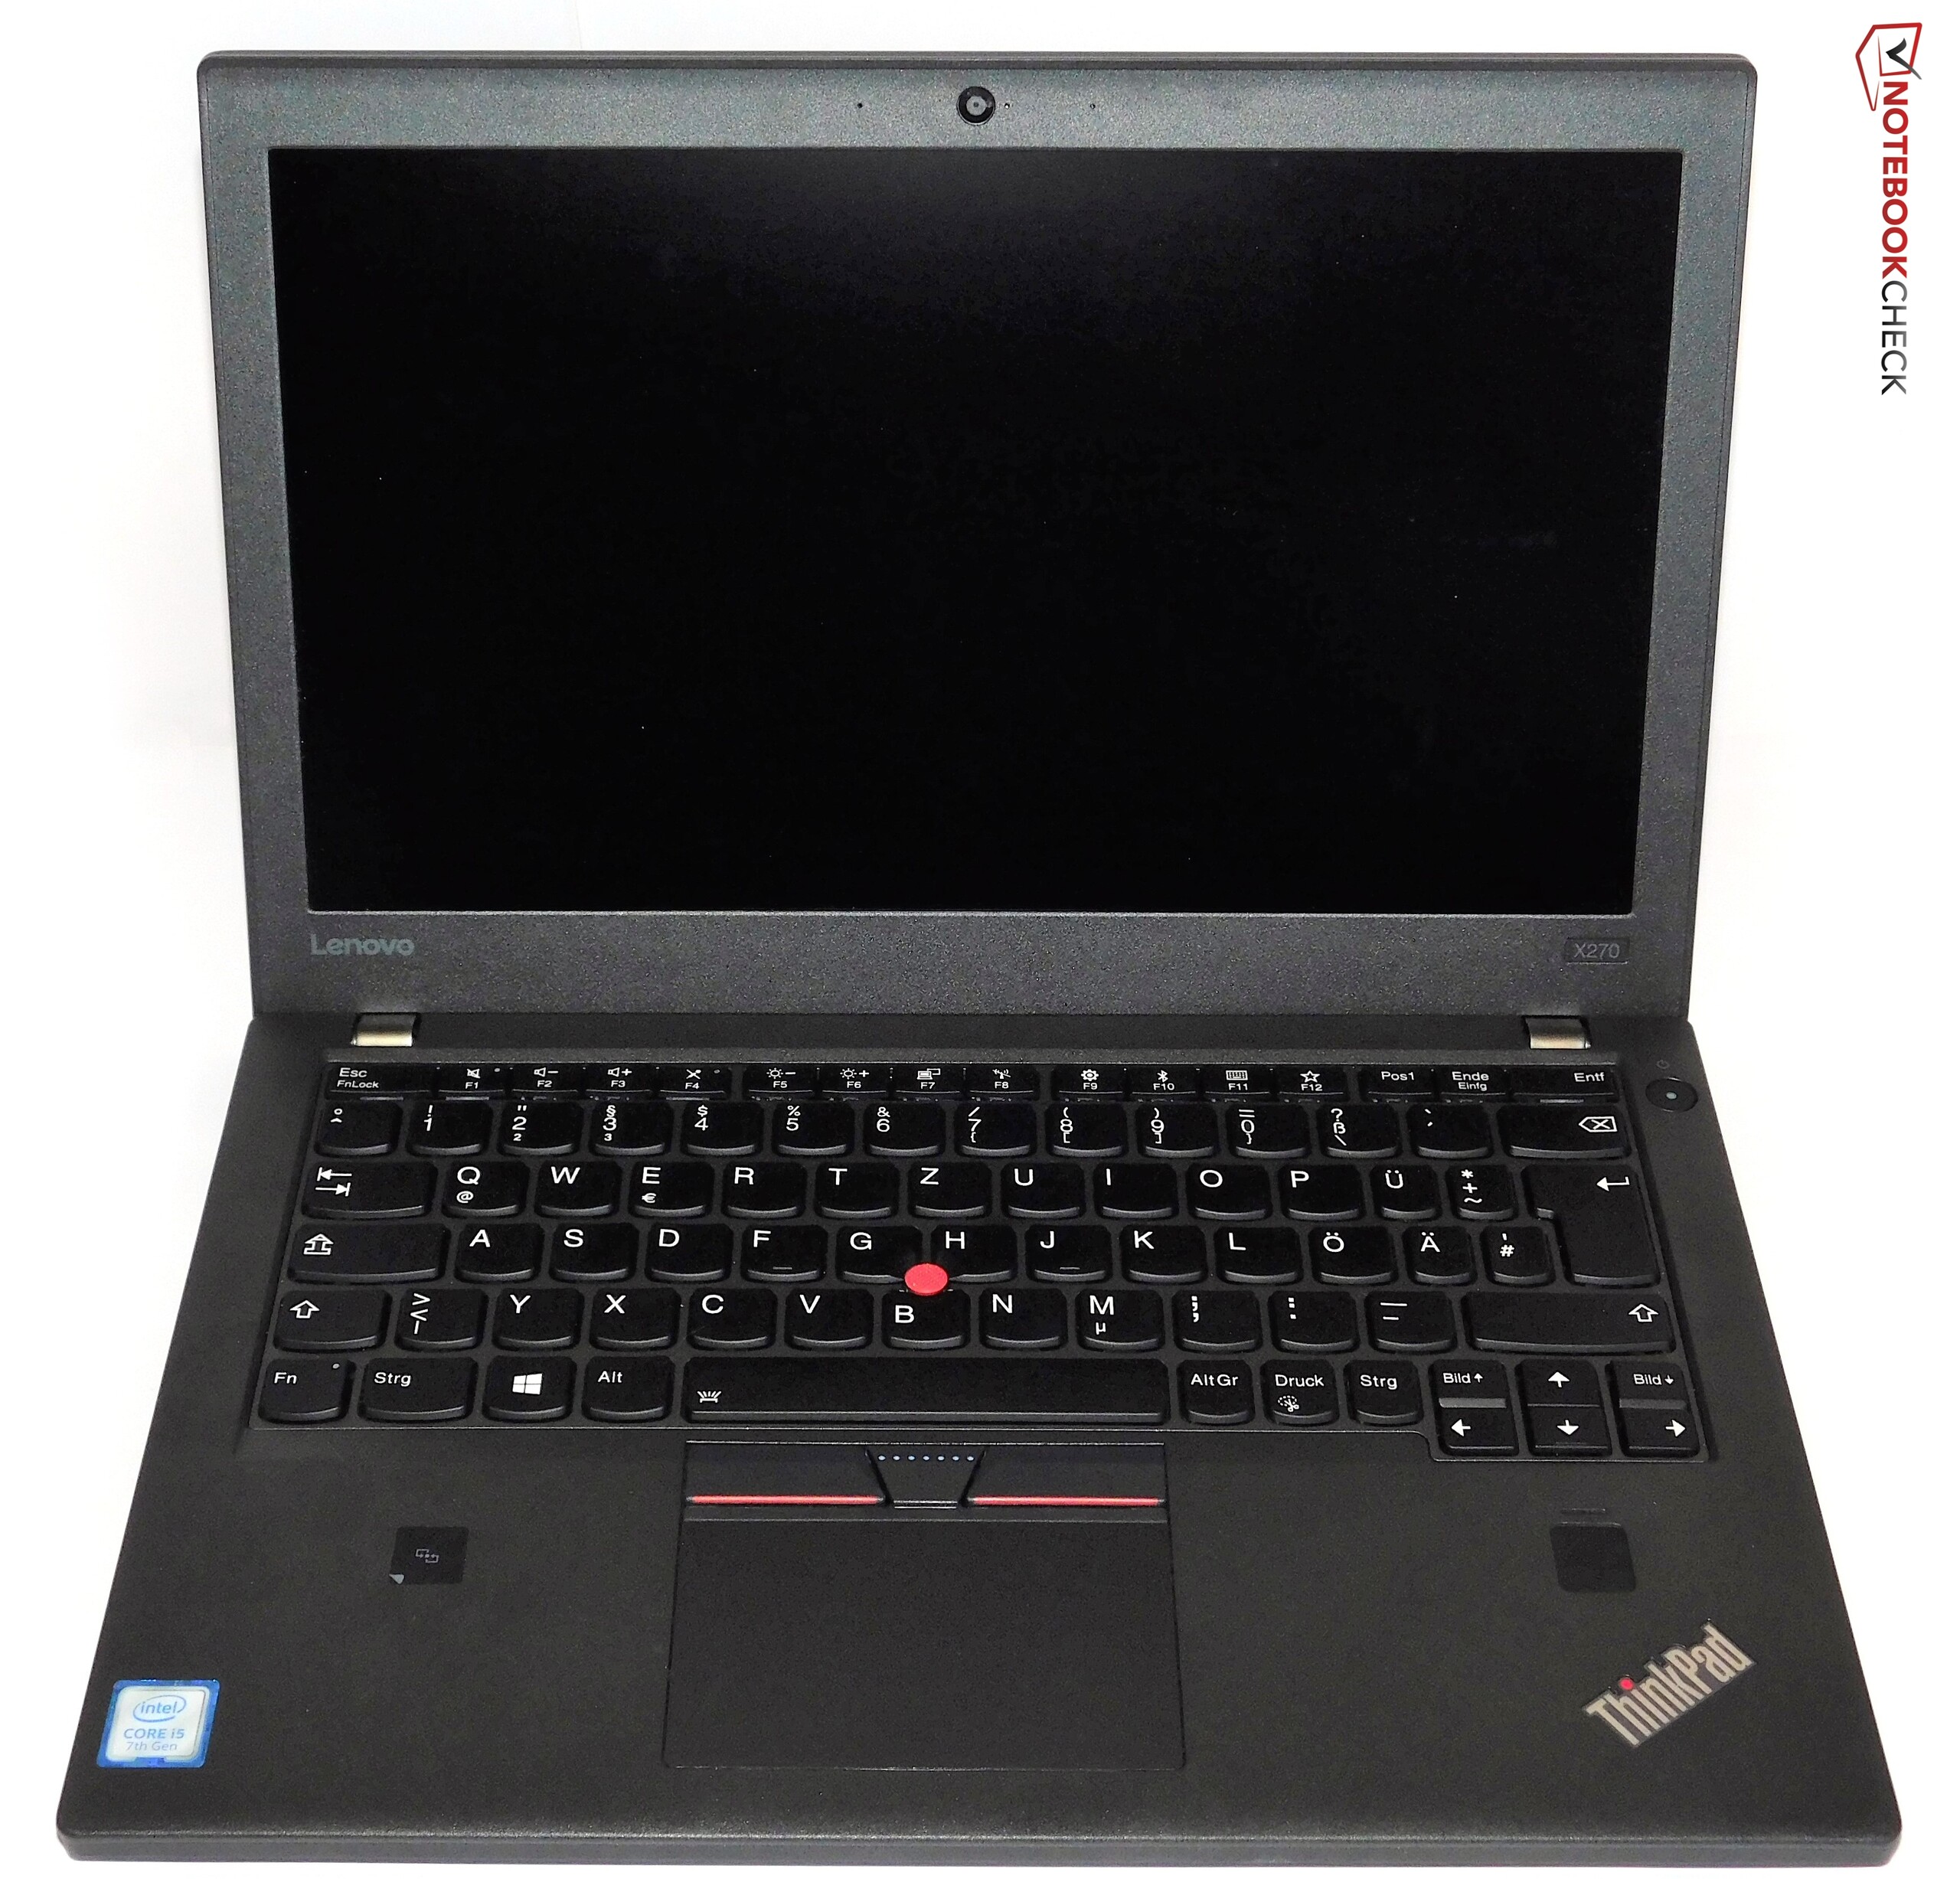
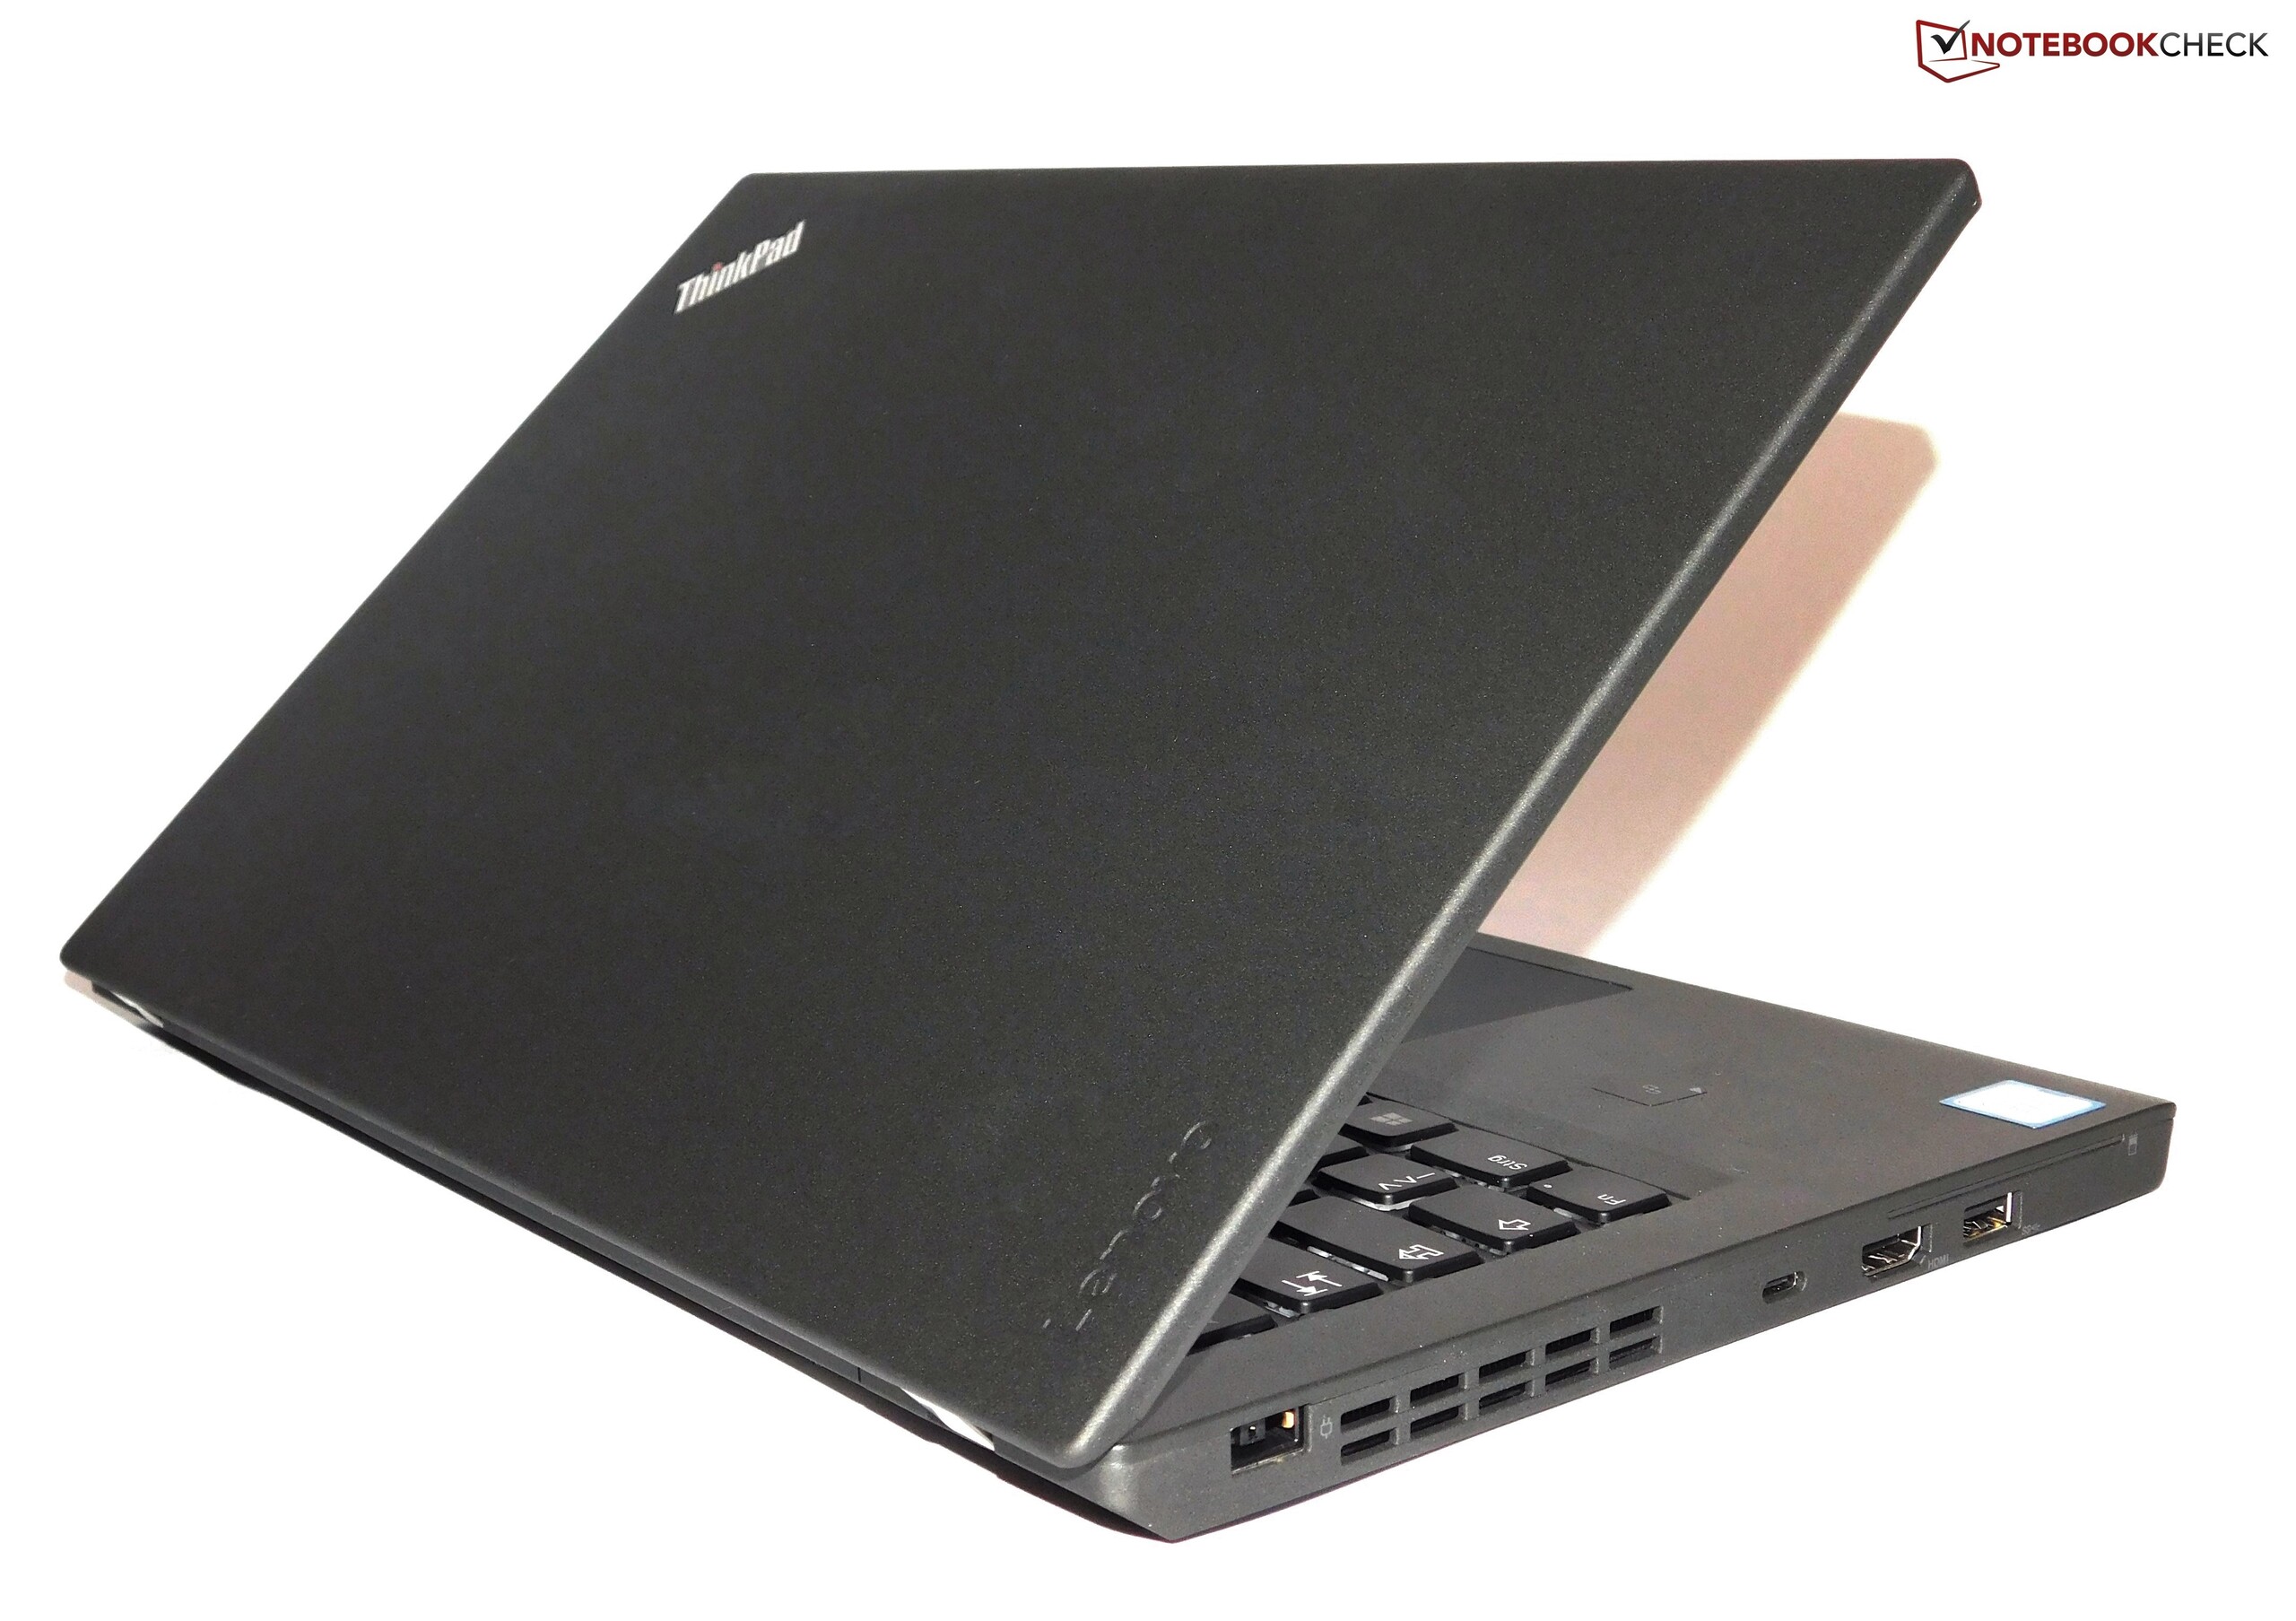
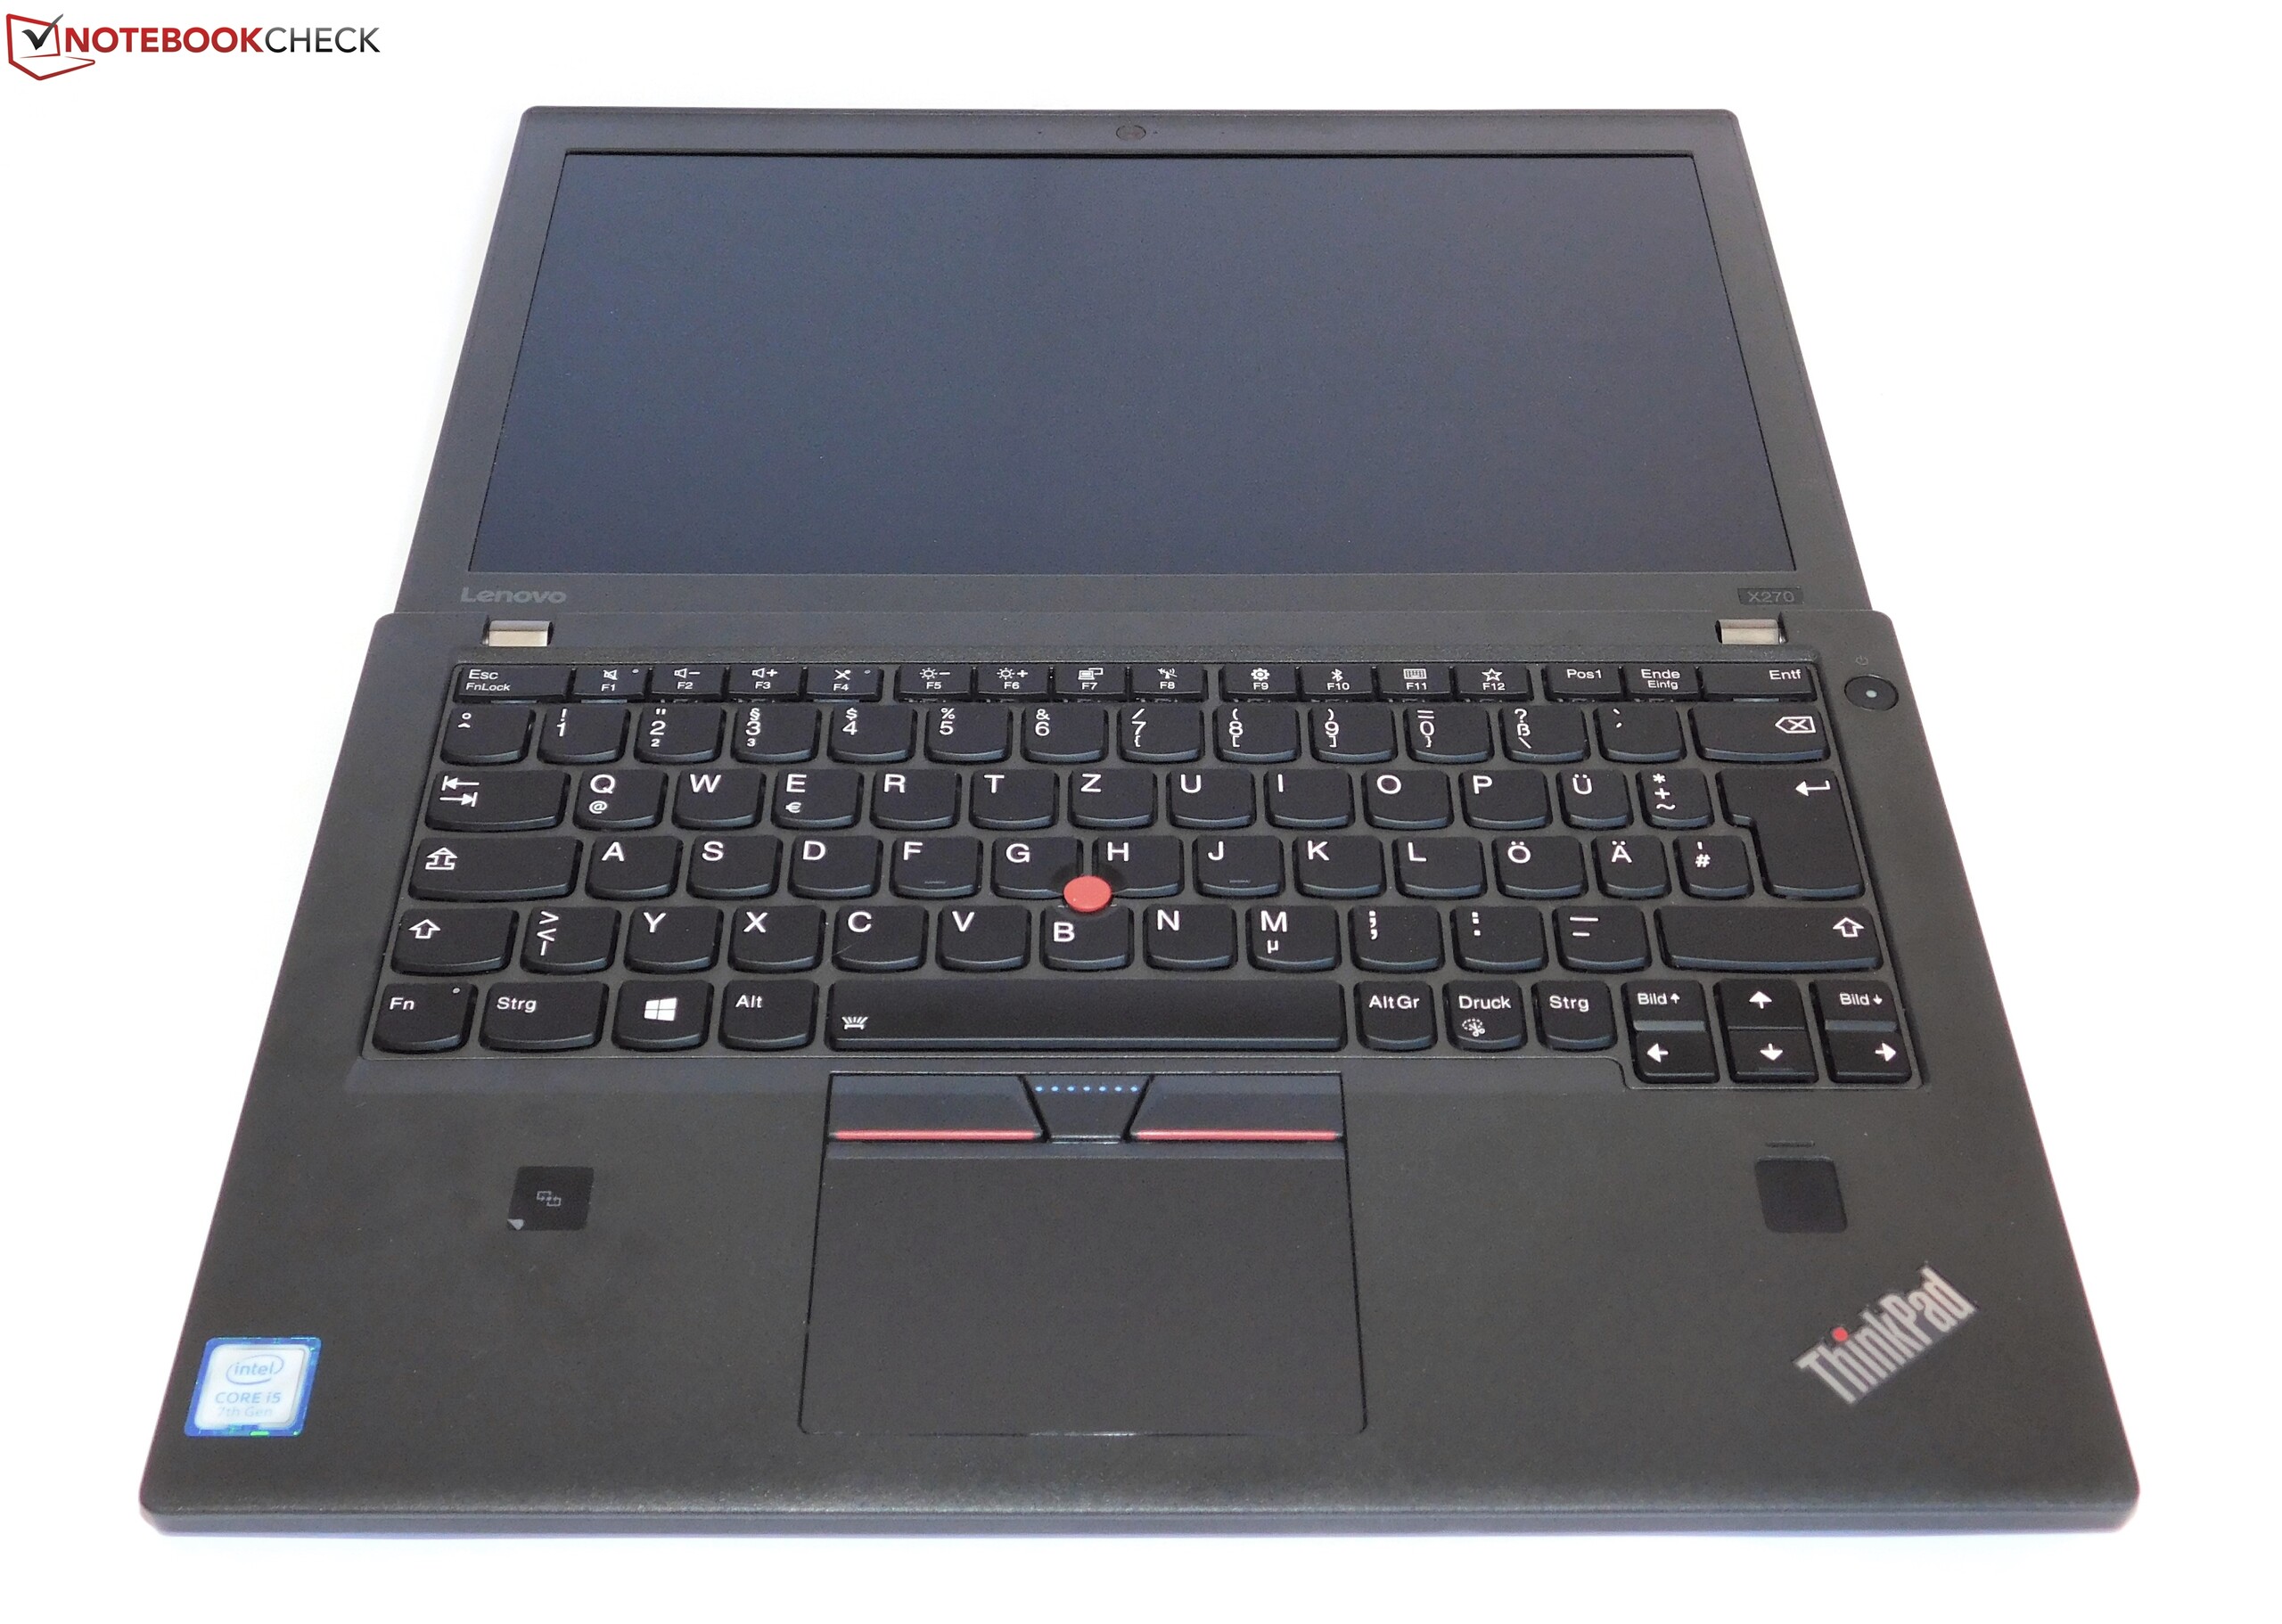
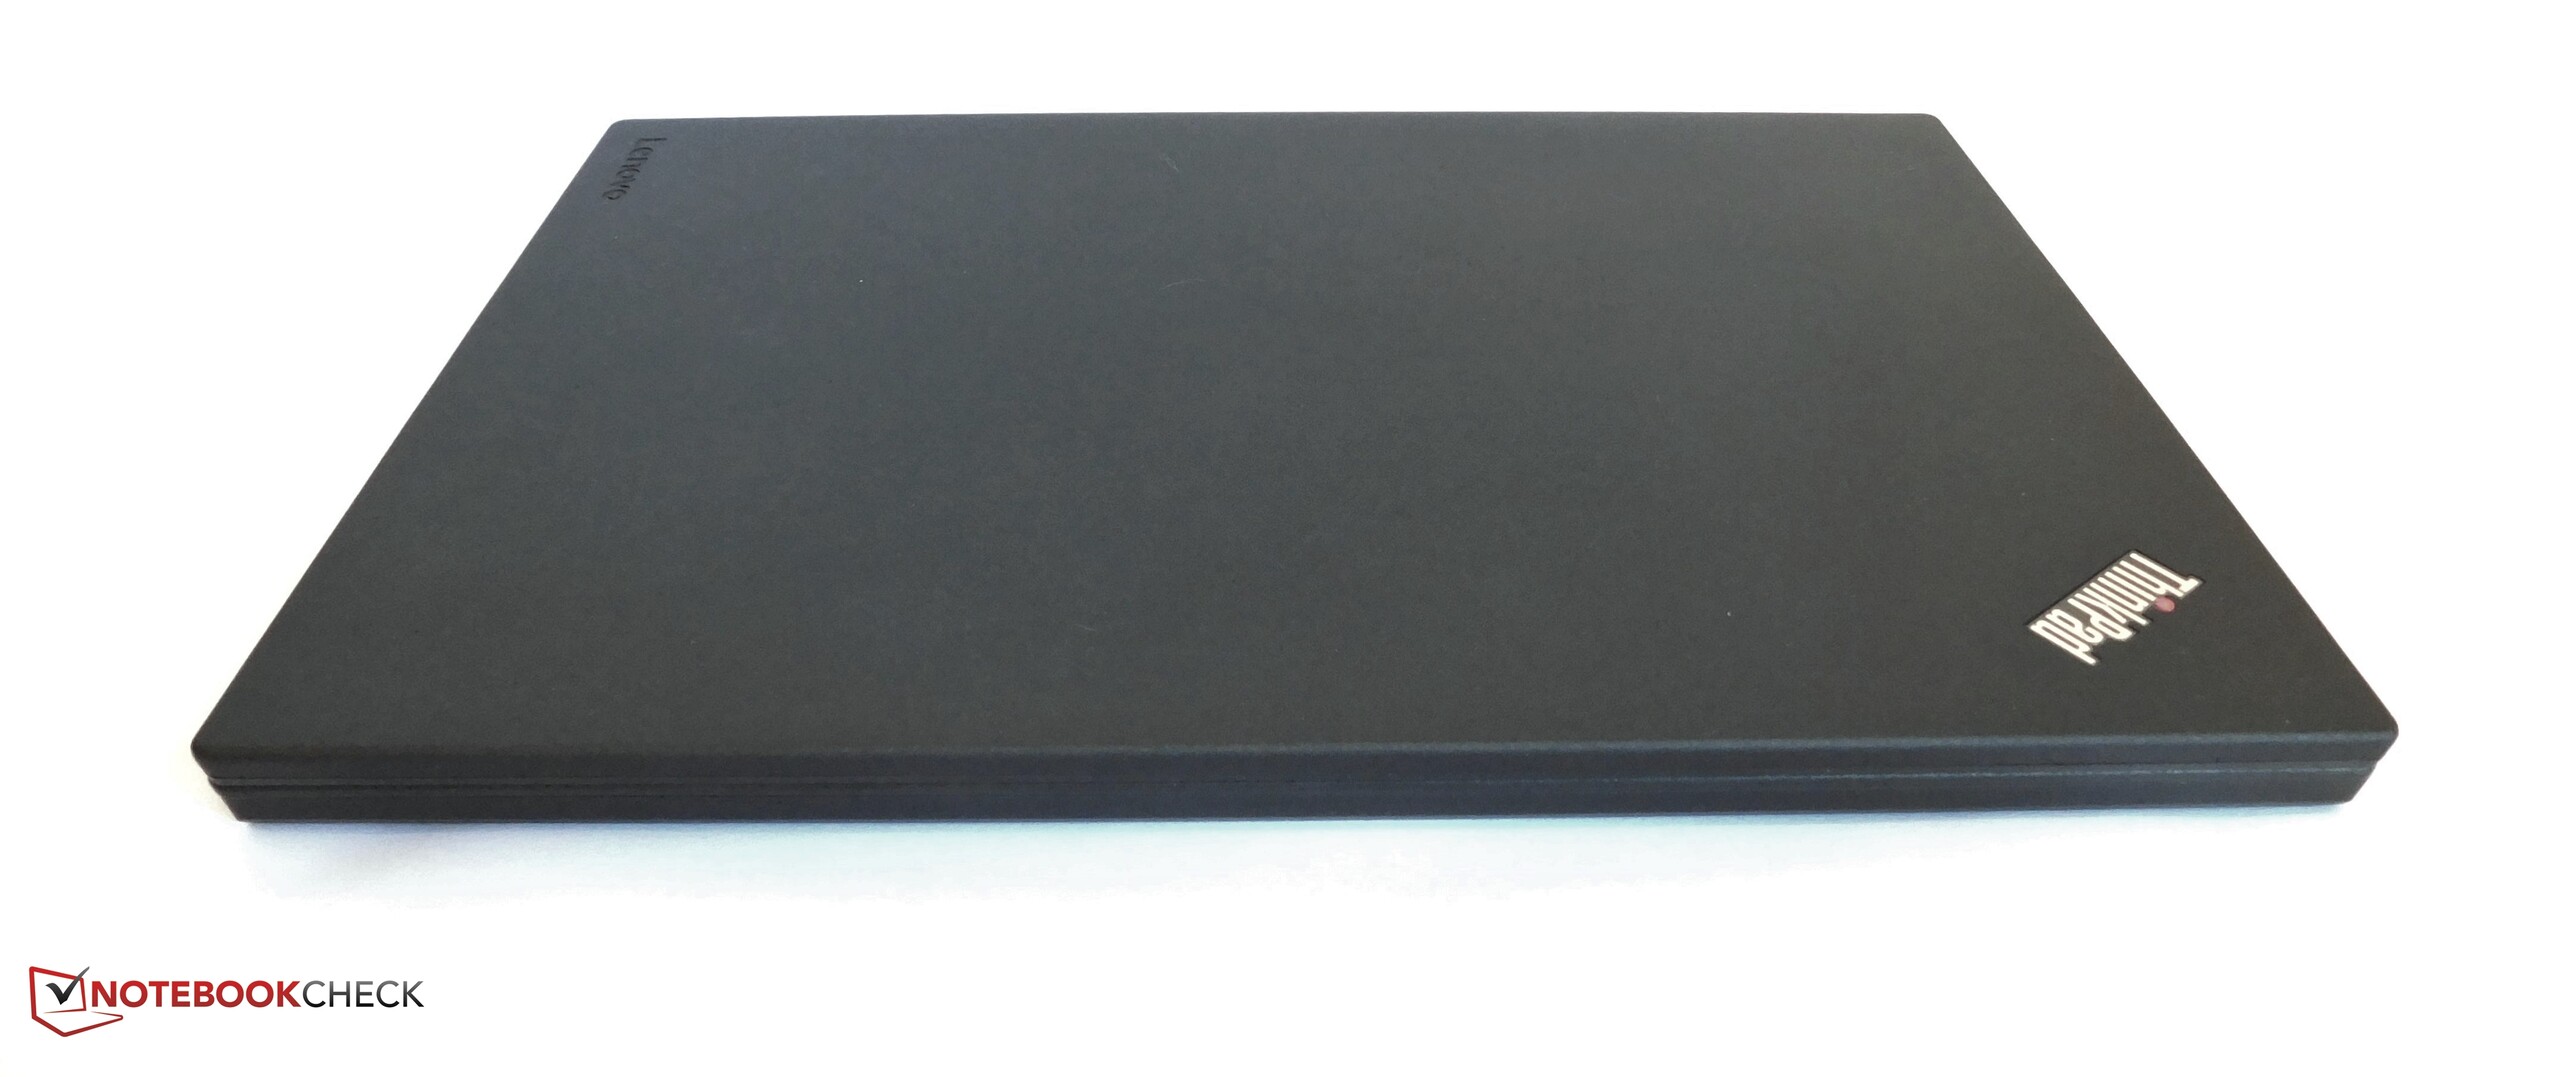
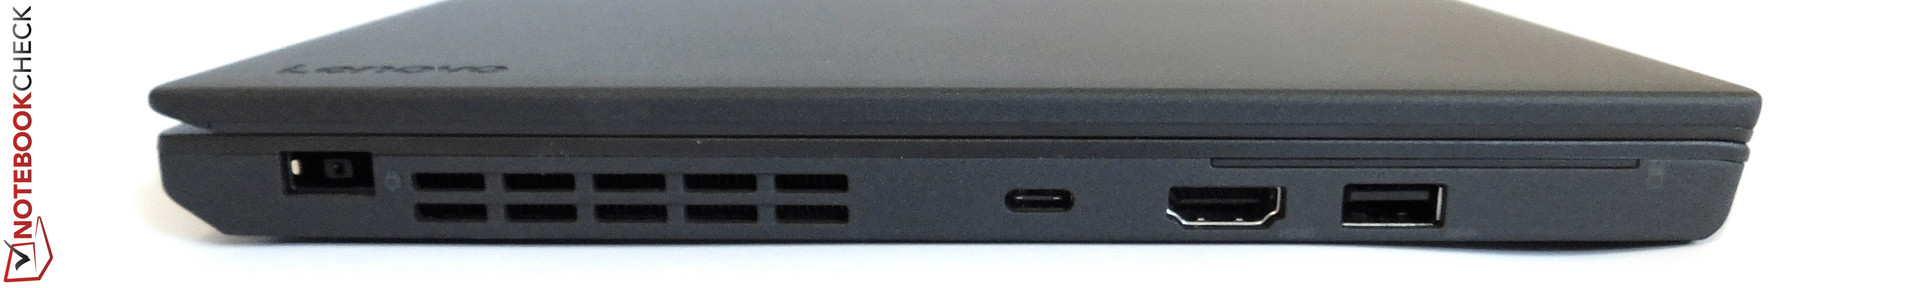
Es la cuarta ocasión en la que Lenovo reutiliza el mismo chasis. Como siempre ocurre con los ThinkPad, los buenos dispositivos de entrada, así como la característica PowerBridge -que no tiene competencia- son puntos a favor. Considerando su tamaño, el X270 tiene gran cantidad de puertos, lo que significa flexibilidad en el uso. El pequeño tamaño también significa que es sencillo y cómodo de manejar. En este aspecto no hay diferencias con sus predecesores - después de todo es básicamente el mismo dispositivo.
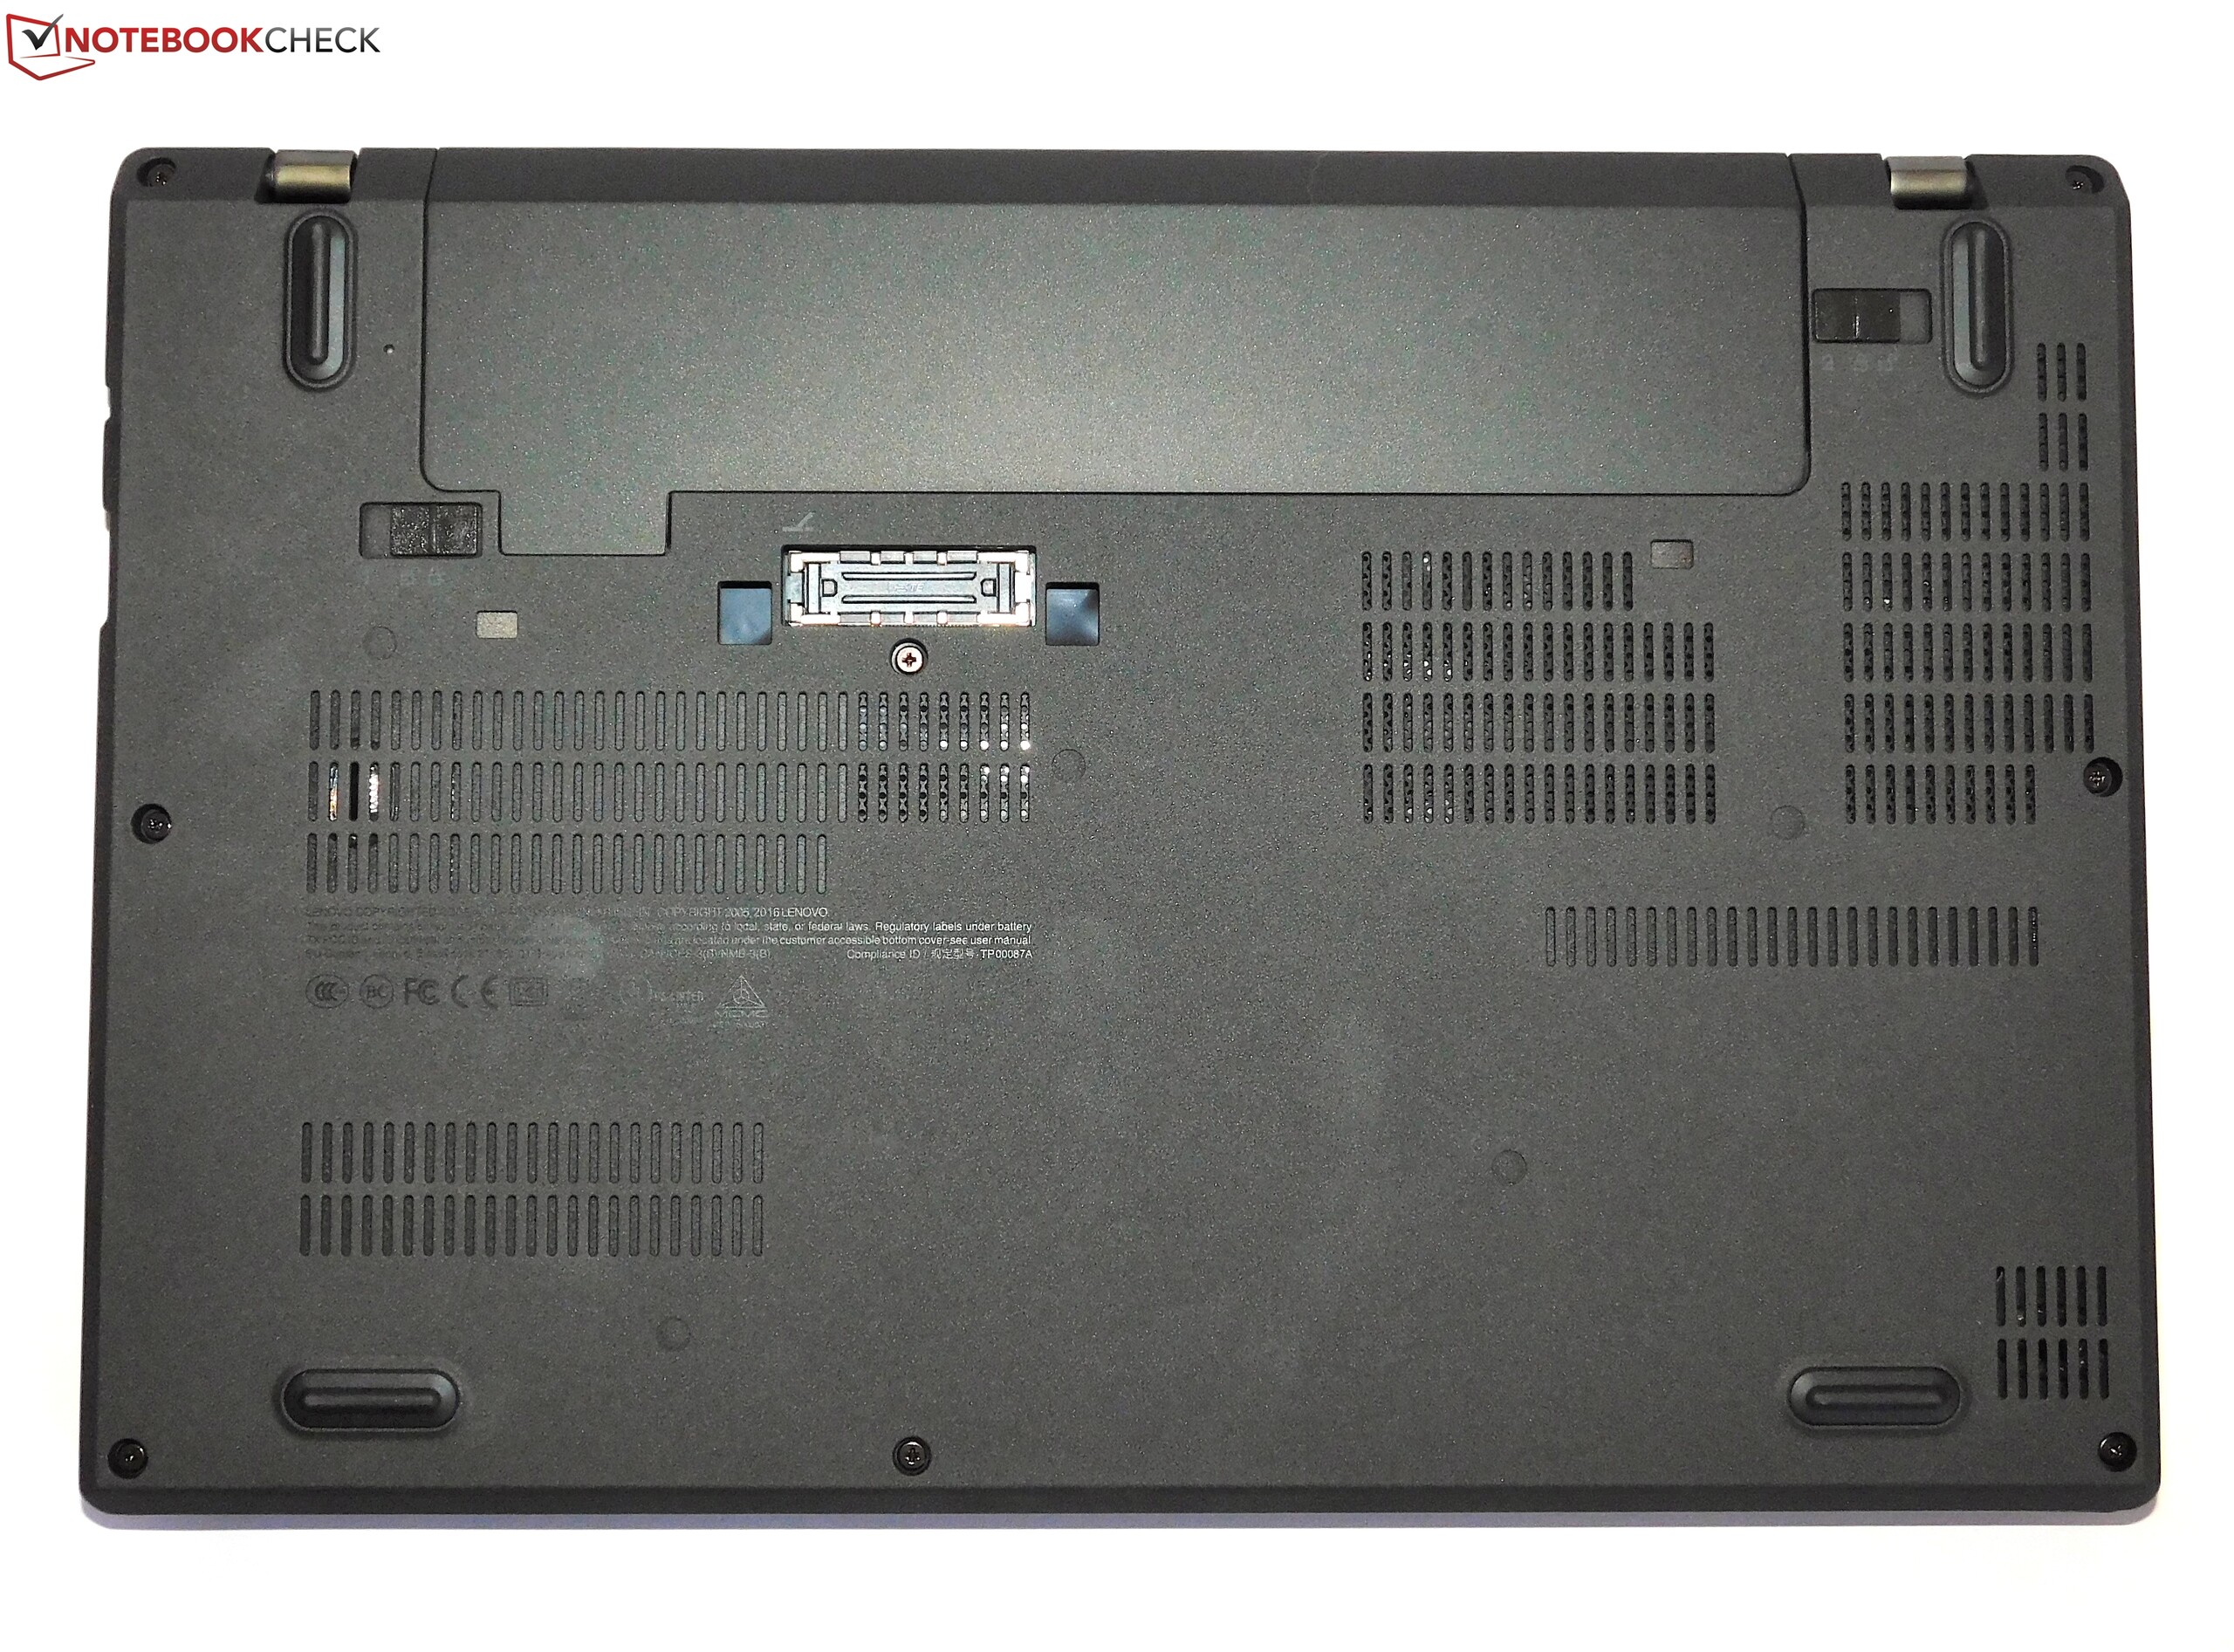
Desafortunadamente Lenovo ha fallado en algunos aspectos del X270. En primer lugar, el sistema de ventilación: es un poco alarmante que un dispositivo equipado con un procesador ULV alcance los 60ºC en algunas superficies - a pesar de que el ventilador funciona con una frecuencia que llega a ser molesta. Otro problema es la pantalla FullHD que es bastante más oscura que la de su predecesor con una cobertura de color similar. Los fallos de fabricación con similares a los de versiones anteriores. El mantenimiento, ya era un problema en el X260: no resulta divertido abrir la BaseCover. Sorprendentemente la batería de 3 celdas también ofrece menor batería que su predecesor.
La gama ThinkPad X2xx necesita un rediseño. Debido a muchos problemas menores no podemos recomendar la compra del X270.
Si no necesitas un portátil compacto con una configuración de batería flexible (PowerBridge), no podemos recomendarte la compra del ThinkPad X270. Esto no es solo por la serie de problemas que hemos descrito - a pesar de que solo por ellos recomendaríamos echar un ojo a competidores directos como el HP EliteBook 820 G4 y el Dell Latitude 7280. En general es difícil encontrar razones para comprar el X270 a no ser que necesites PowerBridge y algunas características que son particularmente importantes para compañias grandes (smart card, base de expansión, ethernet). El Dell XPS 13 y el ThinkPad X1 Carbon, también de Lenovo, son modelos que ofrecen mayor calidad y mayor pantalla y siguen siendo muy portables. Esto nos lleva a preguntarnos si tiene sentido la existencia de subportátiles. Un argumento podría ser el precio - pero los subportátiles de 12 pulgadas no son precisamente baratos.
Ésta es una versión acortada del análisis original. Puedes leer el análisis completo en inglés aquí.
Lenovo ThinkPad X270-20HMS00T00
- 03/29/2017 v6 (old)
Benjamin Herzig