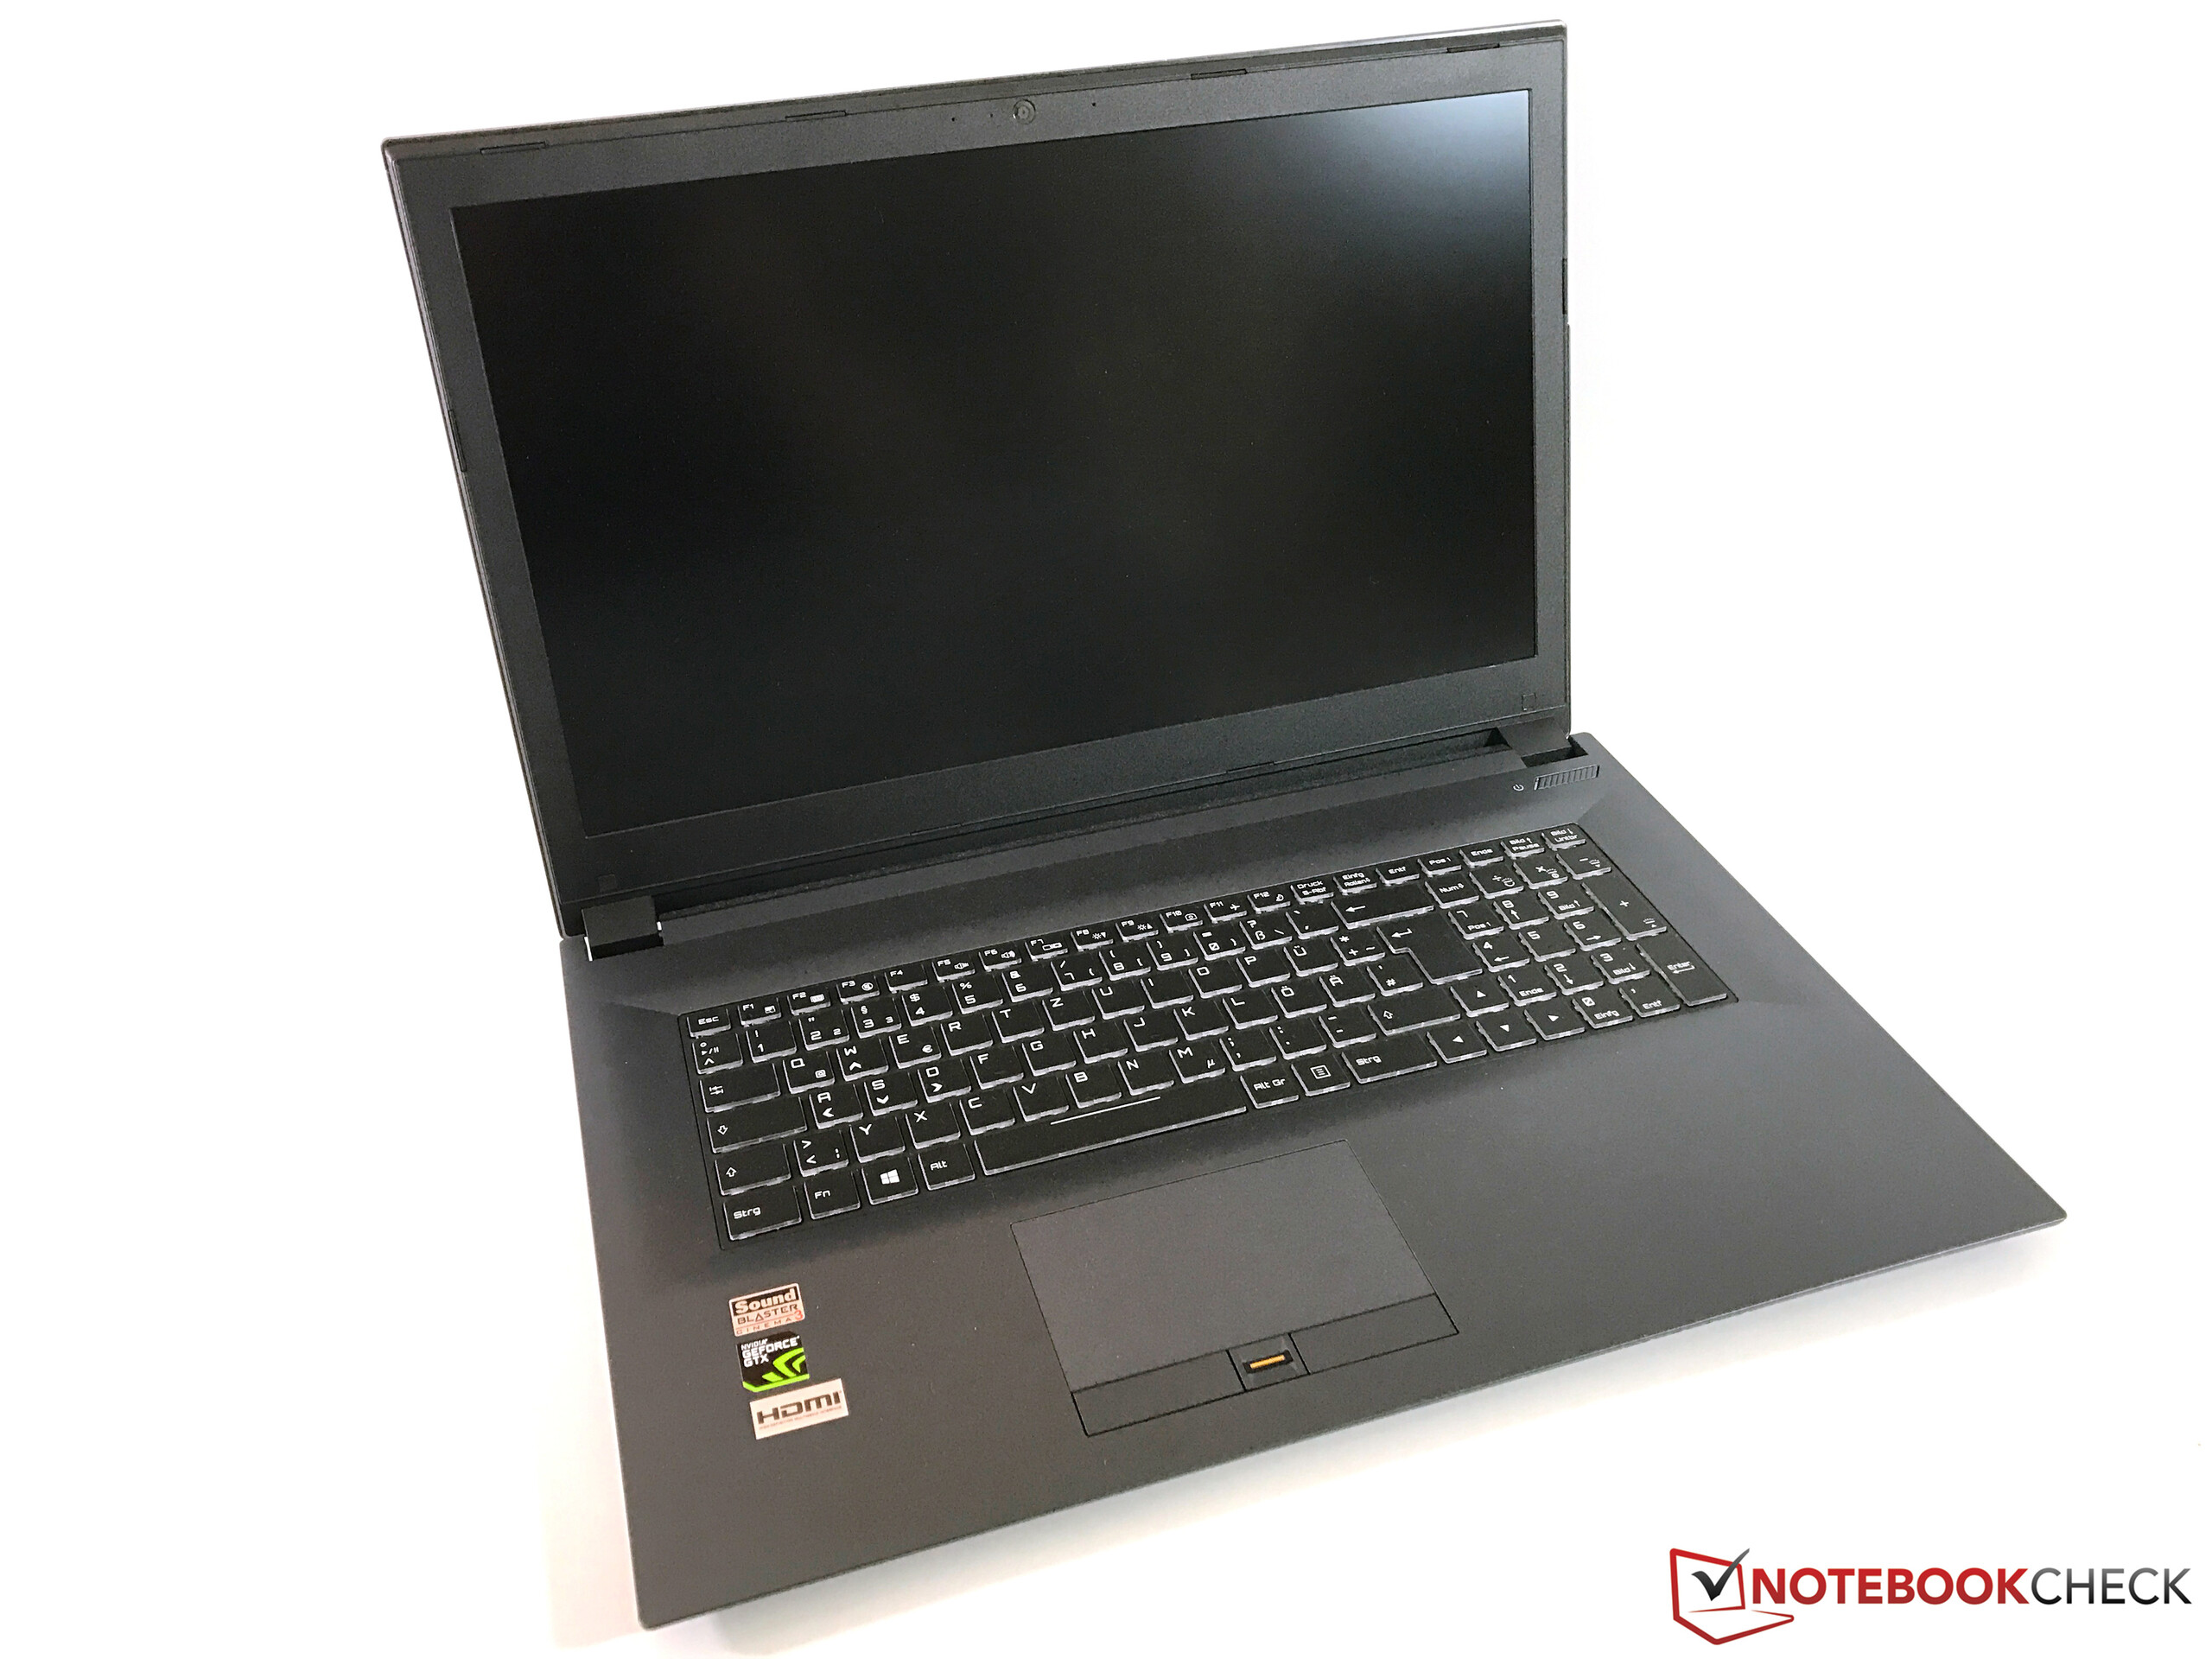
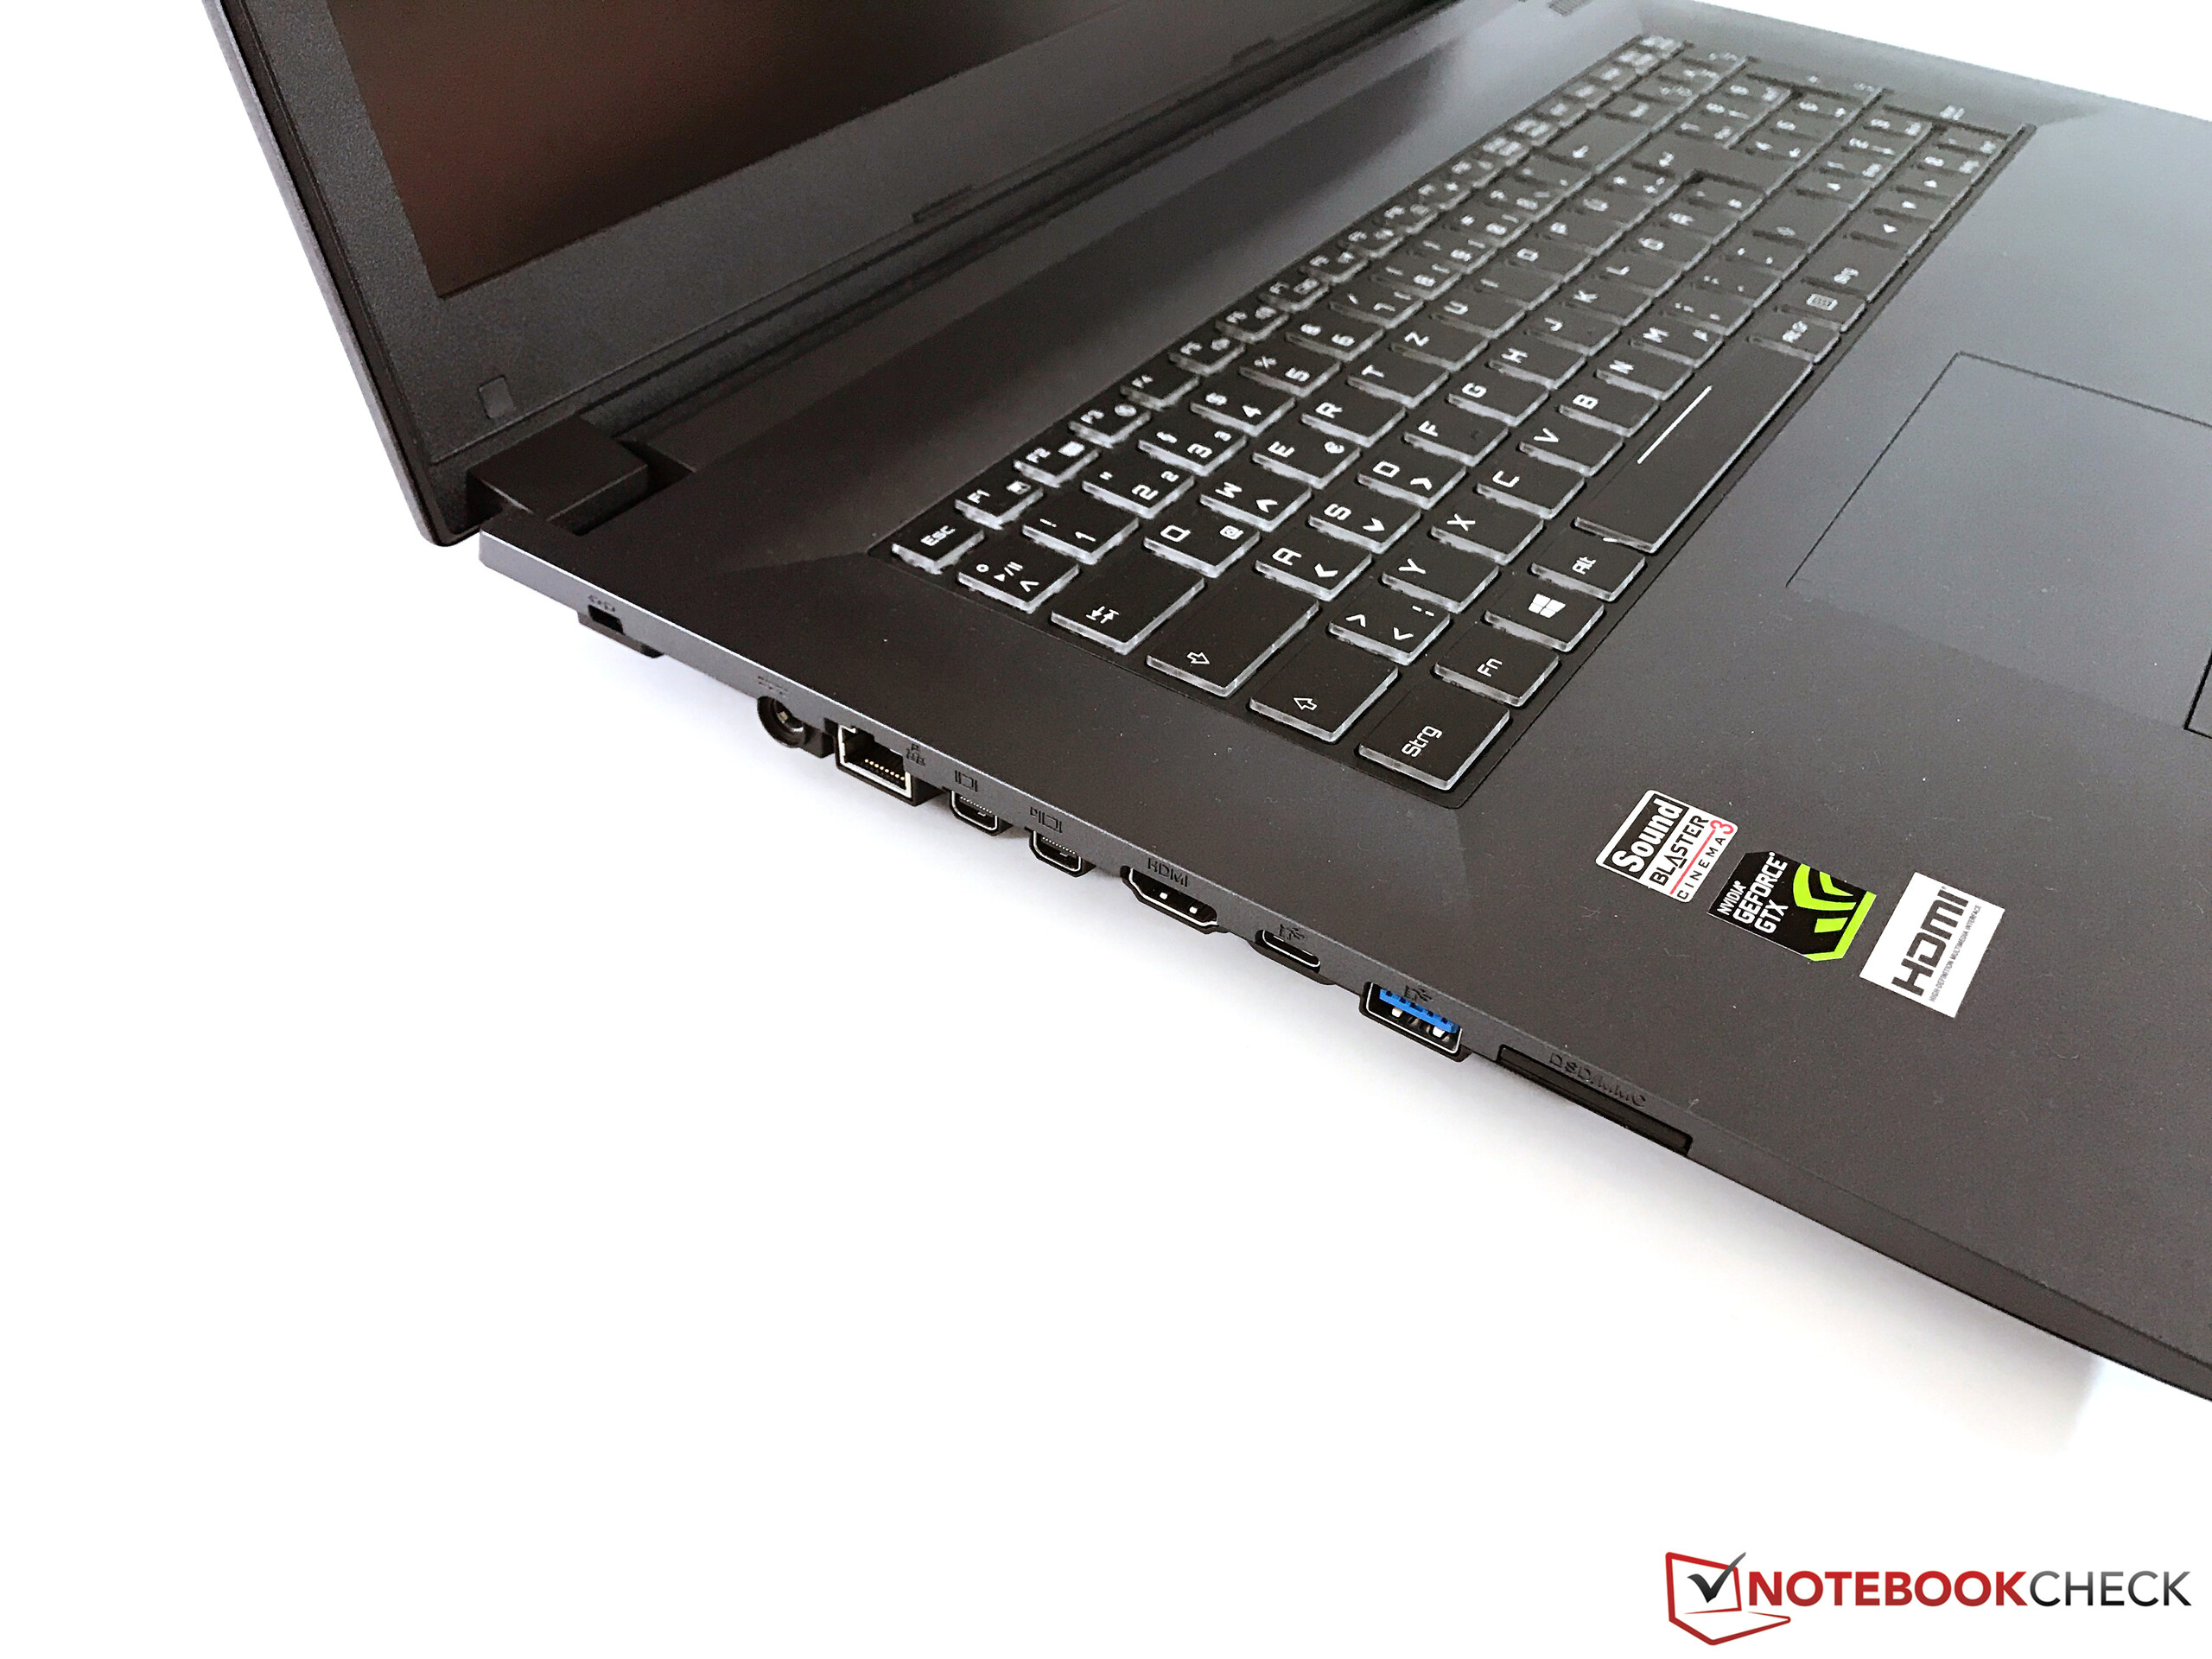
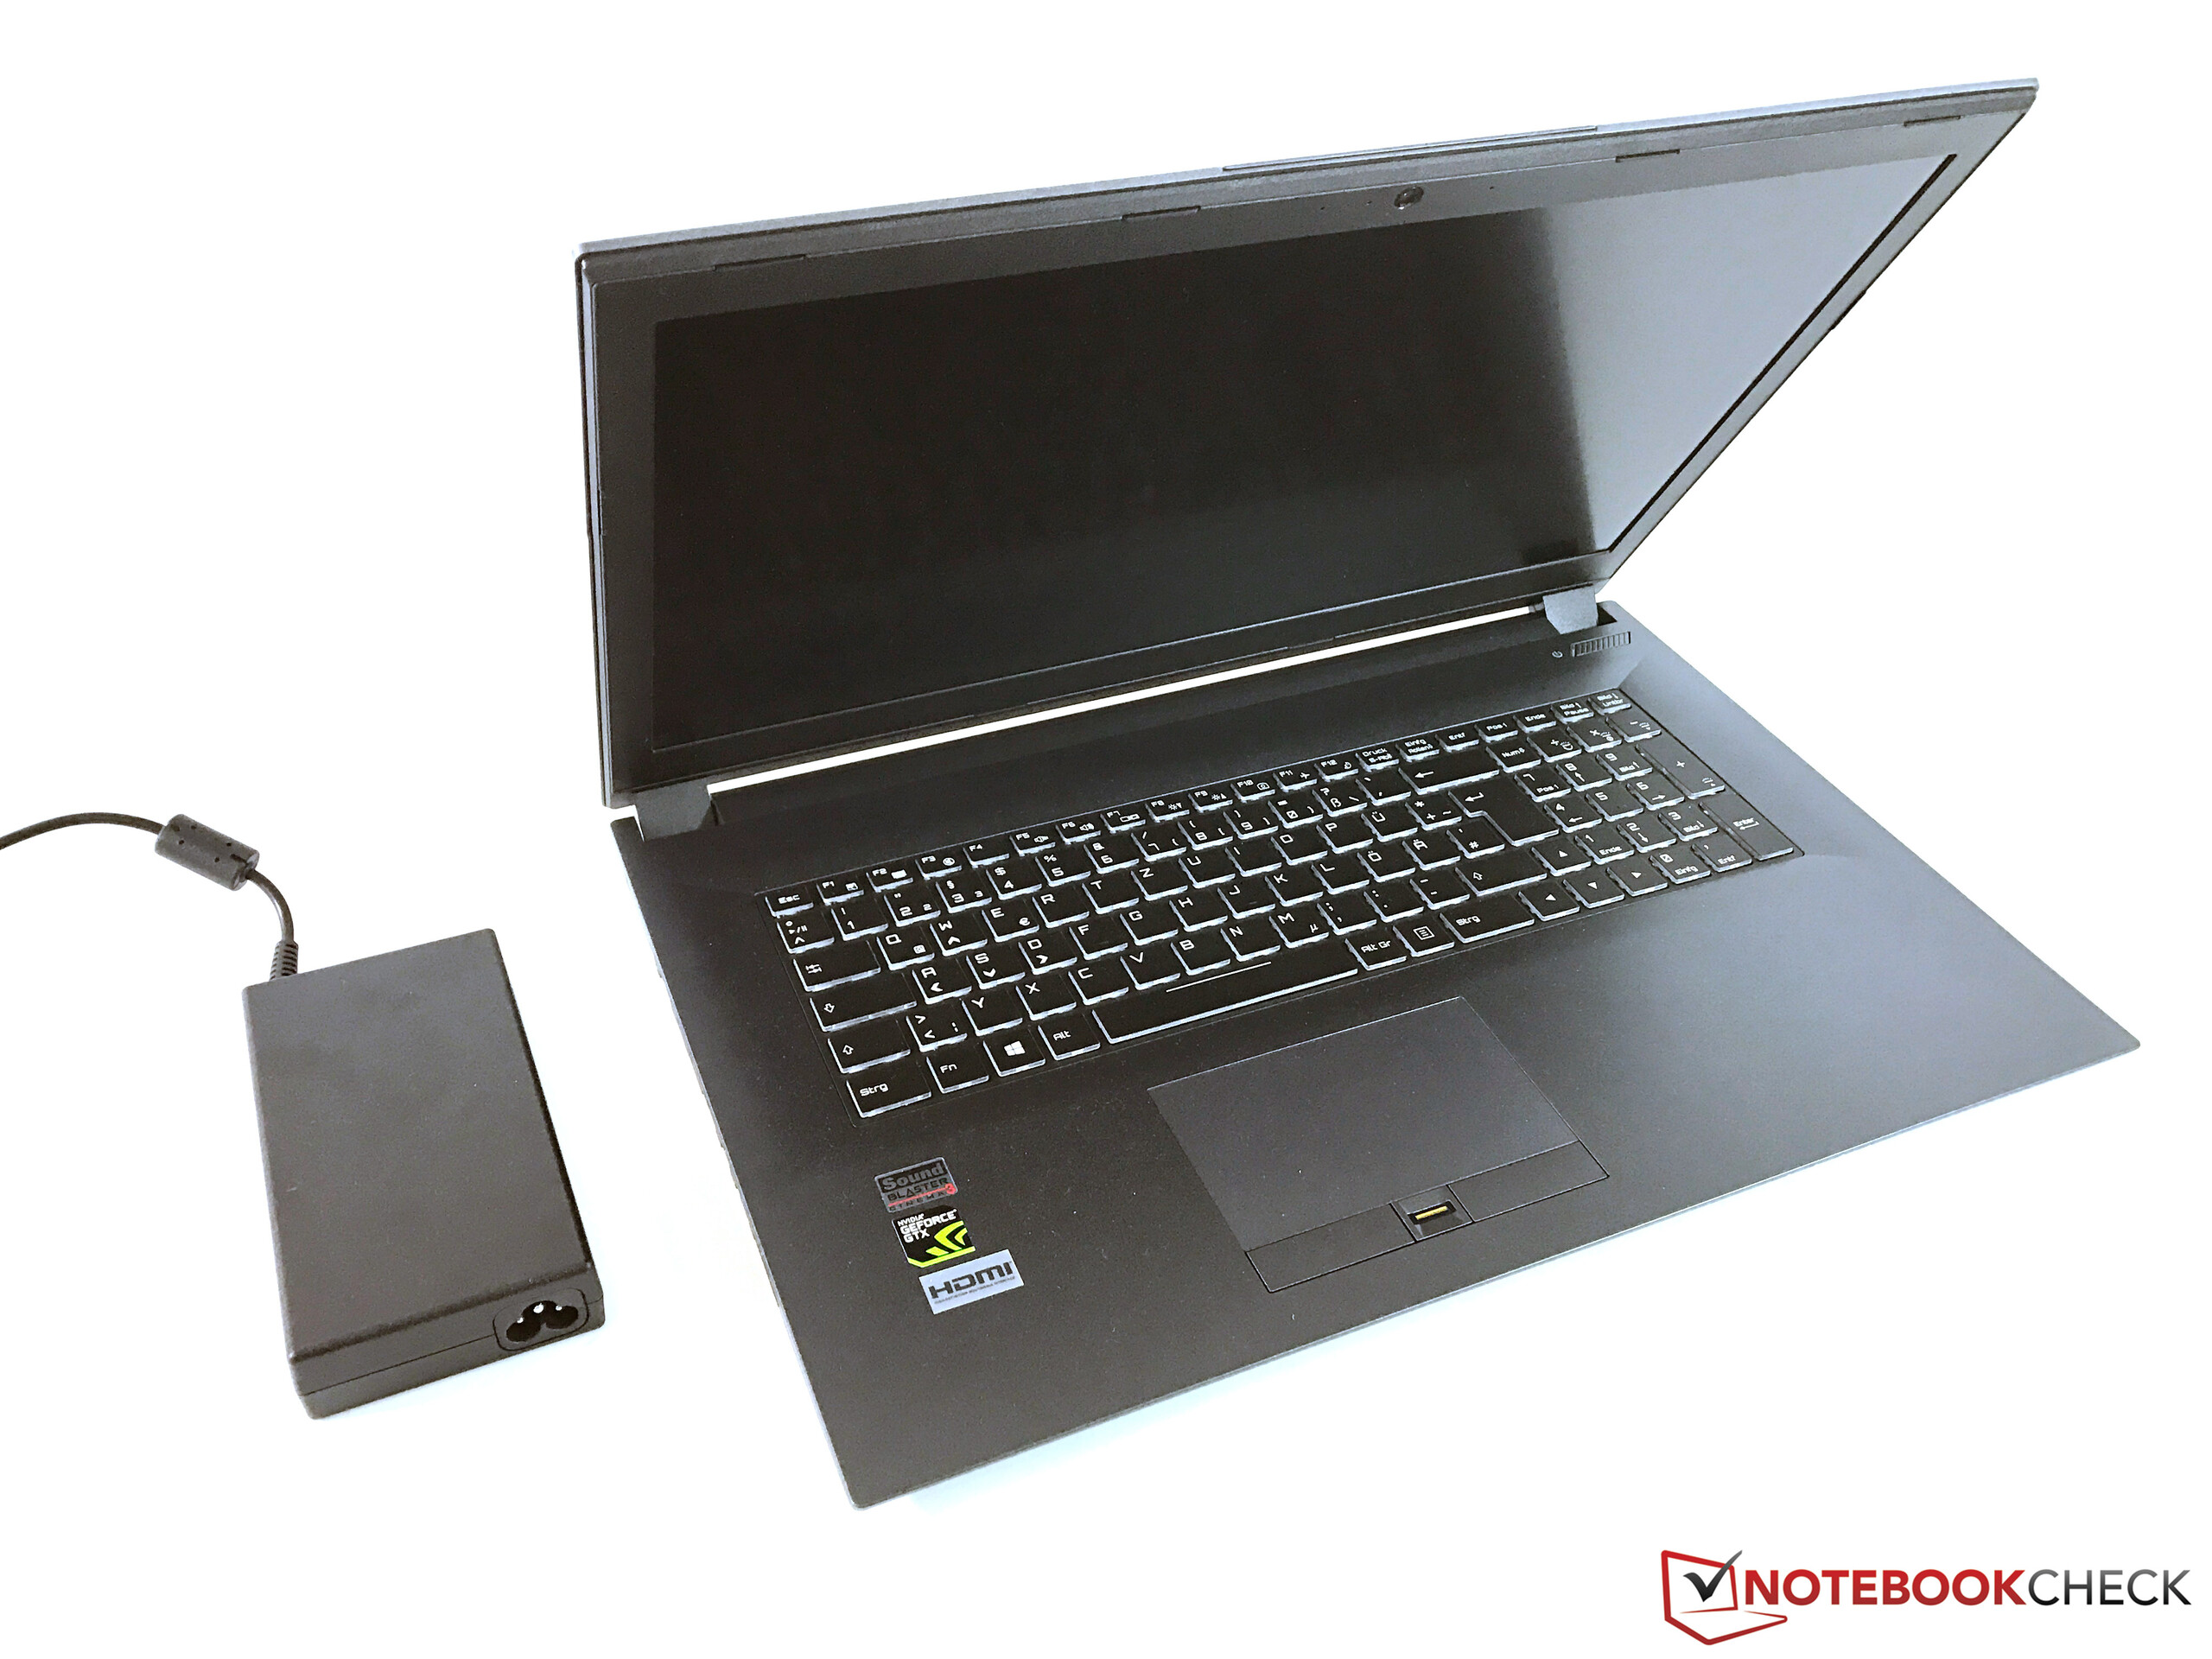
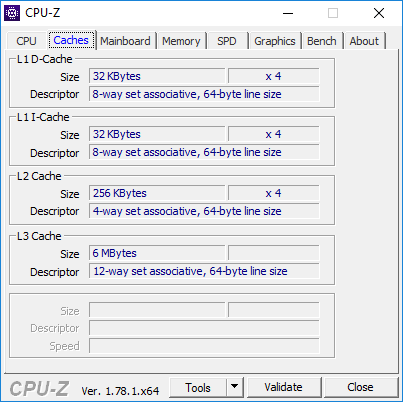
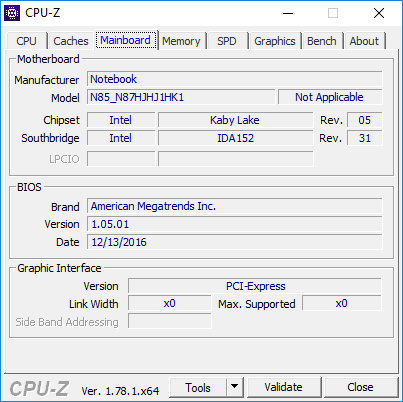
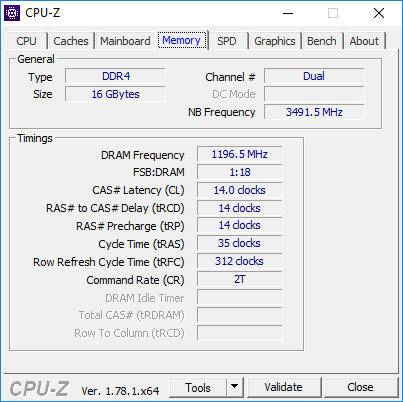
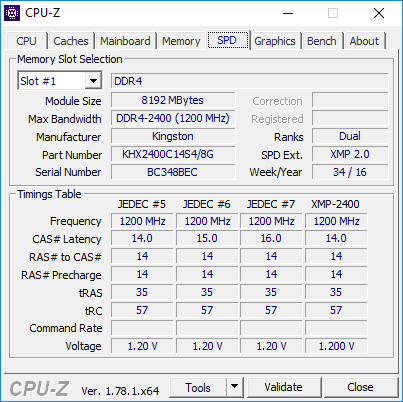
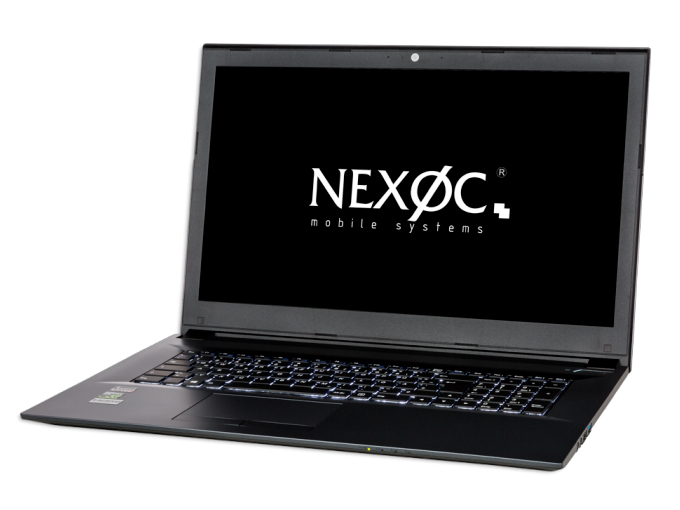
Breve análisis del portátil Nexoc G739 (Clevo N870HK1)
| SD Card Reader | |
| average JPG Copy Test (av. of 3 runs) | |
| Nexoc G739 | |
| Asus Strix GL753VD-GC045T | |
| HP Omen 17-w100ng | |
| Asus GL702VM-GC102D | |
| MSI GE72 7RE-046 | |
| maximum AS SSD Seq Read Test (1GB) | |
| HP Omen 17-w100ng | |
| Nexoc G739 | |
| Asus Strix GL753VD-GC045T | |
| Asus GL702VM-GC102D | |
| MSI GE72 7RE-046 | |
| Networking | |
| iperf3 transmit AX12 | |
| Asus Strix GL753VD-GC045T | |
| HP Omen 17-w100ng | |
| Nexoc G739 | |
| MSI GE72 7RE-046 | |
| iperf3 receive AX12 | |
| HP Omen 17-w100ng | |
| Asus Strix GL753VD-GC045T | |
| Nexoc G739 | |
| MSI GE72 7RE-046 | |
| |||||||||||||||||||||||||
iluminación: 85 %
Brillo con batería: 312 cd/m²
Contraste: 1357:1 (Negro: 0.23 cd/m²)
ΔE ColorChecker Calman: 4.19 | ∀{0.5-29.43 Ø4.71}
ΔE Greyscale Calman: 3.72 | ∀{0.09-98 Ø4.96}
91% sRGB (Argyll 1.6.3 3D)
59% AdobeRGB 1998 (Argyll 1.6.3 3D)
66.4% AdobeRGB 1998 (Argyll 3D)
91% sRGB (Argyll 3D)
66.7% Display P3 (Argyll 3D)
Gamma: 2.29
CCT: 7104 K
| Nexoc G739 CMN1738, 1920x1080, 17.3" | Asus Strix GL753VD-GC045T LP173WF4-SPF3, 1920x1080, 17.3" | HP Omen 17-w100ng LG Philips LGD046E, 1920x1080, 17.3" | MSI GE72 7RE-046 N173HHE-G32 (CMN1747), 1920x1080, 17.3" | Asus GL702VM-GC102D LG Philips LP173WF4-SPF3, 1920x1080, 17.3" | |
|---|---|---|---|---|---|
| Display | -4% | -3% | 25% | -6% | |
| Display P3 Coverage (%) | 66.7 | 67.1 1% | 67.2 1% | 90.7 36% | 65.1 -2% |
| sRGB Coverage (%) | 91 | 84.8 -7% | 86.6 -5% | 99.9 10% | 83.5 -8% |
| AdobeRGB 1998 Coverage (%) | 66.4 | 62 -7% | 63.3 -5% | 85.2 28% | 61.1 -8% |
| Response Times | 12% | 17% | 54% | 17% | |
| Response Time Grey 50% / Grey 80% * (ms) | 45 ? | 33.2 ? 26% | 35 ? 22% | 27 ? 40% | 38 ? 16% |
| Response Time Black / White * (ms) | 28 ? | 28.8 ? -3% | 25 ? 11% | 9 ? 68% | 23 ? 18% |
| PWM Frequency (Hz) | 450 ? | ||||
| Screen | -21% | -6% | -16% | -35% | |
| Brightness middle (cd/m²) | 312 | 349 12% | 342 10% | 253 -19% | 326 4% |
| Brightness (cd/m²) | 304 | 337 11% | 331 9% | 230 -24% | 312 3% |
| Brightness Distribution (%) | 85 | 91 7% | 84 -1% | 86 1% | 91 7% |
| Black Level * (cd/m²) | 0.23 | 0.58 -152% | 0.32 -39% | 0.24 -4% | 0.5 -117% |
| Contrast (:1) | 1357 | 602 -56% | 1069 -21% | 1054 -22% | 652 -52% |
| Colorchecker dE 2000 * | 4.19 | 4.5 -7% | 4.35 -4% | 5.01 -20% | 6.3 -50% |
| Colorchecker dE 2000 max. * | 8.7 | 10.2 -17% | 9.24 -6% | 10.4 -20% | 11.69 -34% |
| Greyscale dE 2000 * | 3.72 | 3.3 11% | 3.73 -0% | 7.26 -95% | 7.37 -98% |
| Gamma | 2.29 96% | 2.15 102% | 2.23 99% | 2.09 105% | 2.37 93% |
| CCT | 7104 91% | 6103 107% | 6801 96% | 6329 103% | 7116 91% |
| Color Space (Percent of AdobeRGB 1998) (%) | 59 | 55.7 -6% | 57 -3% | 76 29% | 55 -7% |
| Color Space (Percent of sRGB) (%) | 91 | 75.7 -17% | 86 -5% | 100 10% | 83 -9% |
| Media total (Programa/Opciones) | -4% /
-14% | 3% /
-2% | 21% /
1% | -8% /
-22% |
* ... más pequeño es mejor
Tiempos de respuesta del display
| ↔ Tiempo de respuesta de Negro a Blanco | ||
|---|---|---|
| 28 ms ... subida ↗ y bajada ↘ combinada | ↗ 7 ms subida | 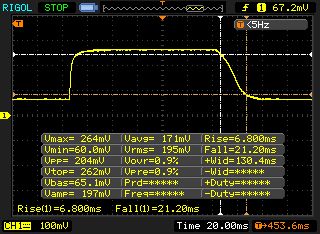 |
| ↘ 21 ms bajada | ||
| La pantalla mostró tiempos de respuesta relativamente lentos en nuestros tests pero podría ser demasiado lenta para los jugones. En comparación, todos los dispositivos de prueba van de ##min### (mínimo) a 240 (máximo) ms. » 71 % de todos los dispositivos son mejores. Eso quiere decir que el tiempo de respuesta es peor que la media (19.8 ms) de todos los dispositivos testados. | ||
| ↔ Tiempo de respuesta 50% Gris a 80% Gris | ||
| 45 ms ... subida ↗ y bajada ↘ combinada | ↗ 20 ms subida | 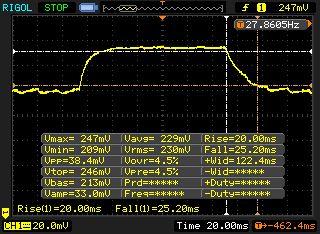 |
| ↘ 25 ms bajada | ||
| La pantalla mostró tiempos de respuesta lentos en nuestros tests y podría ser demasiado lenta para los jugones. En comparación, todos los dispositivos de prueba van de ##min### (mínimo) a 636 (máximo) ms. » 77 % de todos los dispositivos son mejores. Eso quiere decir que el tiempo de respuesta es peor que la media (31 ms) de todos los dispositivos testados. | ||
Parpadeo de Pantalla / PWM (Pulse-Width Modulation)
| Parpadeo de Pantalla / PWM detectado | 450 Hz | ≤ 90 % de brillo | 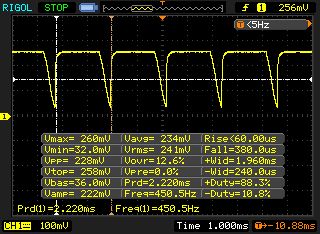 |
La retroiluminación del display parpadea a 450 Hz (seguramente usa PWM - Pulse-Width Modulation) a un brillo del 90 % e inferior. Sobre este nivel de brillo no debería darse parpadeo / PWM. La frecuencia de 450 Hz es relativamente alta, por lo que la mayoría de gente no debería ver parpadeo o tener fatiga visual. Sin embargo, hay informes de que algunas personas pueden seguir viendo parpadeos a 500 Hz y superior, por lo que cuidado. Comparación: 52 % de todos los dispositivos testados no usaron PWM para atenuar el display. Si se usó, medimos una media de 7754 (mínimo: 5 - máxmo: 343500) Hz. | |||
| Cinebench R15 | |
| CPU Single 64Bit | |
| Nexoc G739 | |
| Asus Strix GL753VD-GC045T | |
| MSI GE72 7RE-046 | |
| Asus GL702VM-GC102D | |
| HP Omen 17-w100ng | |
| CPU Multi 64Bit | |
| Nexoc G739 | |
| Asus Strix GL753VD-GC045T | |
| MSI GE72 7RE-046 | |
| Asus GL702VM-GC102D | |
| HP Omen 17-w100ng | |
| Cinebench R11.5 | |
| CPU Single 64Bit | |
| Nexoc G739 | |
| Asus Strix GL753VD-GC045T | |
| MSI GE72 7RE-046 | |
| Asus GL702VM-GC102D | |
| HP Omen 17-w100ng | |
| CPU Multi 64Bit | |
| Nexoc G739 | |
| Asus Strix GL753VD-GC045T | |
| MSI GE72 7RE-046 | |
| Asus GL702VM-GC102D | |
| HP Omen 17-w100ng | |
| PCMark 8 | |
| Home Score Accelerated v2 | |
| HP Omen 17-w100ng | |
| Asus GL702VM-GC102D | |
| Nexoc G739 | |
| Asus Strix GL753VD-GC045T | |
| Work Score Accelerated v2 | |
| HP Omen 17-w100ng | |
| Nexoc G739 | |
| Asus GL702VM-GC102D | |
| PCMark 7 - Score | |
| Nexoc G739 | |
| HP Omen 17-w100ng | |
| MSI GE72 7RE-046 | |
| Asus GL702VM-GC102D | |
| PCMark 7 Score | 6331 puntos | |
| PCMark 8 Home Score Accelerated v2 | 4270 puntos | |
| PCMark 8 Creative Score Accelerated v2 | 5420 puntos | |
| PCMark 8 Work Score Accelerated v2 | 5243 puntos | |
ayuda | ||
| Nexoc G739 Samsung PM961 MZVLW256HEHP | Asus Strix GL753VD-GC045T Micron SSD 1100 (MTFDDAV256TBN) | HP Omen 17-w100ng SanDisk Z400s SD8SNAT-128G | MSI GE72 7RE-046 Toshiba HG6 THNSNJ256G8NY | Asus GL702VM-GC102D HGST Travelstar 7K1000 HTS721010A9E630 | |
|---|---|---|---|---|---|
| CrystalDiskMark 3.0 | -60% | -70% | -51% | -96% | |
| Read Seq (MB/s) | 1666 | 475.7 -71% | 495 -70% | 540 -68% | 134.6 -92% |
| Write Seq (MB/s) | 1192 | 419.1 -65% | 180.2 -85% | 495.7 -58% | 130.6 -89% |
| Read 512 (MB/s) | 857 | 336.1 -61% | 315.5 -63% | 455.1 -47% | 44.85 -95% |
| Write 512 (MB/s) | 827 | 346.6 -58% | 172.4 -79% | 481.4 -42% | 63.3 -92% |
| Read 4k (MB/s) | 60.7 | 24.7 -59% | 20.25 -67% | 22.7 -63% | 0.602 -99% |
| Write 4k (MB/s) | 154.5 | 76.8 -50% | 76.1 -51% | 112.9 -27% | 1.146 -99% |
| Read 4k QD32 (MB/s) | 636 | 247.6 -61% | 141.6 -78% | 372.5 -41% | 1.106 -100% |
| Write 4k QD32 (MB/s) | 544 | 234.9 -57% | 170.8 -69% | 212.9 -61% | 1.186 -100% |

| 3DMark 11 - 1280x720 Performance GPU | |
| HP Omen 17-w100ng | |
| Asus GL702VM-GC102D | |
| MSI GE72 7RE-046 | |
| Nexoc G739 | |
| Asus Strix GL753VD-GC045T | |
| 3DMark | |
| 1280x720 Cloud Gate Standard Graphics | |
| Asus GL702VM-GC102D | |
| HP Omen 17-w100ng | |
| Nexoc G739 | |
| MSI GE72 7RE-046 | |
| Asus Strix GL753VD-GC045T | |
| 1920x1080 Fire Strike Graphics | |
| HP Omen 17-w100ng | |
| Asus GL702VM-GC102D | |
| MSI GE72 7RE-046 | |
| Nexoc G739 | |
| Asus Strix GL753VD-GC045T | |
| Asus Strix GL753VD-GC045T | |
| 3DMark 11 Performance | 9687 puntos | |
| 3DMark Cloud Gate Standard Score | 22876 puntos | |
| 3DMark Fire Strike Score | 6950 puntos | |
| 3DMark Time Spy Score | 2519 puntos | |
ayuda | ||
| Battlefield 1 | |
| 1920x1080 Ultra Preset AA:T | |
| Asus GL702VM-GC102D | |
| HP Omen 17-w100ng | |
| MSI GE72 7RE-046 | |
| Nexoc G739 | |
| Asus Strix GL753VD-GC045T | |
| 1920x1080 High Preset AA:T | |
| Asus GL702VM-GC102D | |
| HP Omen 17-w100ng | |
| MSI GE72 7RE-046 | |
| Nexoc G739 | |
| Asus Strix GL753VD-GC045T | |
| The Witcher 3 | |
| 1920x1080 Ultra Graphics & Postprocessing (HBAO+) | |
| Nexoc G739 | |
| MSI GE72 7RE-046 | |
| Asus Strix GL753VD-GC045T | |
| 1920x1080 High Graphics & Postprocessing (Nvidia HairWorks Off) | |
| Nexoc G739 | |
| MSI GE72 7RE-046 | |
| Asus Strix GL753VD-GC045T | |
| Rise of the Tomb Raider | |
| 1920x1080 Very High Preset AA:FX AF:16x | |
| Nexoc G739 | |
| MSI GE72 7RE-046 | |
| Asus Strix GL753VD-GC045T | |
| 1920x1080 High Preset AA:FX AF:4x | |
| Nexoc G739 | |
| MSI GE72 7RE-046 | |
| Asus Strix GL753VD-GC045T | |
| For Honor | |
| 1920x1080 Extreme Preset AA:T AF:16x | |
| Nexoc G739 | |
| MSI GE72 7RE-046 | |
| 1920x1080 High Preset AA:T AF:8x | |
| MSI GE72 7RE-046 | |
| Nexoc G739 | |
| BioShock Infinite - 1920x1080 Ultra Preset, DX11 (DDOF) | |
| HP Omen 17-w100ng | |
| Asus GL702VM-GC102D | |
| Nexoc G739 | |
| bajo | medio | alto | ultra | |
|---|---|---|---|---|
| BioShock Infinite (2013) | 72.5 | |||
| The Witcher 3 (2015) | 89.8 | 50.4 | 27.6 | |
| Rise of the Tomb Raider (2016) | 84.2 | 47.6 | 40.7 | |
| Battlefield 1 (2016) | 79.2 | 55.7 | 50.8 | |
| For Honor (2017) | 65.8 | 62.1 | 46.1 |
Ruido
| Ocioso |
| 31 / 32 / 38 dB(A) |
| HDD |
| 31 dB(A) |
| Carga |
| 44 / 50 dB(A) |
 | ||
30 dB silencioso 40 dB(A) audible 50 dB(A) ruidosamente alto |
||
min: | ||
| Nexoc G739 GeForce GTX 1050 Ti Mobile, i7-7700HQ | Asus Strix GL753VD-GC045T GeForce GTX 1050 Mobile, i7-7700HQ | HP Omen 17-w100ng GeForce GTX 1060 Mobile, 6300HQ | MSI GE72 7RE-046 GeForce GTX 1050 Ti Mobile, i7-7700HQ | Asus GL702VM-GC102D GeForce GTX 1060 Mobile, 6700HQ | |
|---|---|---|---|---|---|
| Noise | -0% | -6% | -1% | 5% | |
| apagado / medio ambiente * (dB) | 30 | 28.8 4% | 31 -3% | 30 -0% | 30.5 -2% |
| Idle Minimum * (dB) | 31 | 33.9 -9% | 35 -13% | 34 -10% | 31.4 -1% |
| Idle Average * (dB) | 32 | 33.9 -6% | 36 -13% | 35 -9% | 31.4 2% |
| Idle Maximum * (dB) | 38 | 37.8 1% | 37 3% | 36 5% | 31.5 17% |
| Load Average * (dB) | 44 | 42.7 3% | 44 -0% | 41 7% | 40.9 7% |
| Load Maximum * (dB) | 50 | 47.4 5% | 54 -8% | 49 2% | 46.2 8% |
* ... más pequeño es mejor
(-) La temperatura máxima en la parte superior es de 50.6 °C / 123 F, frente a la media de 40.4 °C / 105 F, que oscila entre 21.2 y 68.8 °C para la clase Gaming.
(-) El fondo se calienta hasta un máximo de 50.8 °C / 123 F, frente a la media de 43.2 °C / 110 F
(+) En reposo, la temperatura media de la parte superior es de 25.6 °C / 78# F, frente a la media del dispositivo de 33.9 °C / 93 F.
(-) El reposamanos y el touchpad pueden calentarse mucho al tacto con un máximo de 42.8 °C / 109 F.
(-) La temperatura media de la zona del reposamanos de dispositivos similares fue de 28.8 °C / 83.8 F (-14 °C / -25.2 F).
| Nexoc G739 GeForce GTX 1050 Ti Mobile, i7-7700HQ | Asus Strix GL753VD-GC045T GeForce GTX 1050 Mobile, i7-7700HQ | HP Omen 17-w100ng GeForce GTX 1060 Mobile, 6300HQ | MSI GE72 7RE-046 GeForce GTX 1050 Ti Mobile, i7-7700HQ | Asus GL702VM-GC102D GeForce GTX 1060 Mobile, 6700HQ | |
|---|---|---|---|---|---|
| Heat | 19% | 2% | 0% | -8% | |
| Maximum Upper Side * (°C) | 50.6 | 37.7 25% | 41.5 18% | 45.8 9% | 53.1 -5% |
| Maximum Bottom * (°C) | 50.8 | 36.3 29% | 45.5 10% | 45.2 11% | 44.9 12% |
| Idle Upper Side * (°C) | 28.7 | 25.7 10% | 31.8 -11% | 31.7 -10% | 32.9 -15% |
| Idle Bottom * (°C) | 27.1 | 24.4 10% | 29.6 -9% | 29.9 -10% | 33.4 -23% |
* ... más pequeño es mejor
Nexoc G739 análisis de audio
(±) | la sonoridad del altavoz es media pero buena (76 dB)
Graves 100 - 315 Hz
(-) | casi sin bajos - de media 23.2% inferior a la mediana
(±) | la linealidad de los graves es media (13.3% delta a frecuencia anterior)
Medios 400 - 2000 Hz
(±) | medias más altas - de media 7.8% más altas que la mediana
(±) | la linealidad de los medios es media (8% delta respecto a la frecuencia anterior)
Altos 2 - 16 kHz
(±) | máximos más altos - de media 6.4% más altos que la mediana
(±) | la linealidad de los máximos es media (12.4% delta a frecuencia anterior)
Total 100 - 16.000 Hz
(-) | el sonido global no es lineal (31.5% de diferencia con la mediana)
En comparación con la misma clase
» 97% de todos los dispositivos probados de esta clase eran mejores, 1% similares, 2% peores
» El mejor tuvo un delta de 6%, la media fue 18%, el peor fue ###max##%
En comparación con todos los dispositivos probados
» 90% de todos los dispositivos probados eran mejores, 2% similares, 8% peores
» El mejor tuvo un delta de 4%, la media fue 23%, el peor fue ###max##%
Asus Strix GL753VD-GC045T análisis de audio
(±) | la sonoridad del altavoz es media pero buena (81.5 dB)
Graves 100 - 315 Hz
(-) | casi sin bajos - de media 15.8% inferior a la mediana
(±) | la linealidad de los graves es media (12.2% delta a frecuencia anterior)
Medios 400 - 2000 Hz
(+) | medios equilibrados - a sólo 3.1% de la mediana
(±) | la linealidad de los medios es media (7% delta respecto a la frecuencia anterior)
Altos 2 - 16 kHz
(±) | máximos más altos - de media 6.3% más altos que la mediana
(+) | los máximos son lineales (5.4% delta a la frecuencia anterior)
Total 100 - 16.000 Hz
(±) | la linealidad del sonido global es media (17.2% de diferencia con la mediana)
En comparación con la misma clase
» 47% de todos los dispositivos probados de esta clase eran mejores, 11% similares, 42% peores
» El mejor tuvo un delta de 6%, la media fue 18%, el peor fue ###max##%
En comparación con todos los dispositivos probados
» 32% de todos los dispositivos probados eran mejores, 8% similares, 60% peores
» El mejor tuvo un delta de 4%, la media fue 23%, el peor fue ###max##%
| Off / Standby | |
| Ocioso | |
| Carga |
|
Clave:
min: | |
| Nexoc G739 GeForce GTX 1050 Ti Mobile, i7-7700HQ | Asus Strix GL753VD-GC045T GeForce GTX 1050 Mobile, i7-7700HQ | HP Omen 17-w100ng GeForce GTX 1060 Mobile, 6300HQ | MSI GE72 7RE-046 GeForce GTX 1050 Ti Mobile, i7-7700HQ | Asus GL702VM-GC102D GeForce GTX 1060 Mobile, 6700HQ | |
|---|---|---|---|---|---|
| Power Consumption | 16% | -40% | -27% | -32% | |
| Idle Minimum * (Watt) | 7 | 6.2 11% | 17 -143% | 14 -100% | 15.6 -123% |
| Idle Average * (Watt) | 14 | 12.2 13% | 22 -57% | 20 -43% | 20.2 -44% |
| Idle Maximum * (Watt) | 23 | 14.8 36% | 29 -26% | 25 -9% | 21.4 7% |
| Load Average * (Watt) | 82 | 84.9 -4% | 72 12% | 82 -0% | 90 -10% |
| Load Maximum * (Watt) | 163 | 120.7 26% | 141 13% | 135 17% | 147 10% |
* ... más pequeño es mejor
| Nexoc G739 GeForce GTX 1050 Ti Mobile, i7-7700HQ, 62 Wh | Asus Strix GL753VD-GC045T GeForce GTX 1050 Mobile, i7-7700HQ, 48 Wh | HP Omen 17-w100ng GeForce GTX 1060 Mobile, 6300HQ, 95.8 Wh | MSI GE72 7RE-046 GeForce GTX 1050 Ti Mobile, i7-7700HQ, 51.4 Wh | Asus GL702VM-GC102D GeForce GTX 1060 Mobile, 6700HQ, 76 Wh | |
|---|---|---|---|---|---|
| Duración de Batería | -29% | 7% | -37% | -26% | |
| Reader / Idle (h) | 10.2 | 8.6 -16% | 9.1 -11% | 5.9 -42% | |
| H.264 (h) | 5.4 | 5.2 -4% | 3.3 -39% | 4.4 -19% | |
| WiFi v1.3 (h) | 4.8 | 4.4 -8% | 6.1 27% | 3.1 -35% | 4.2 -12% |
| Load (h) | 2.1 | 0.8 -62% | 2.4 14% | 1.5 -29% |
Pro
Contra
Gracias al potente hardware, el Nexoc G739 es un buen portátil de gama baja. La tarjeta gráfica combina bien la pantalla FullHD, que es suficientemente brillante y ha conseguido buenos resultados. Pero en otras muchas areas, como por ejemplo las conexiones, la carcasa y los dispositivos de entrada, el dispositivo solo consigue puntuaciones medias.
Respecto al rendimiento, el Nexoc G739 no muestra ninguna debilidad y mueve bien juegos exigentes, pero las emisiones de chasis Clevo-N870HK1 son muy mejorables.
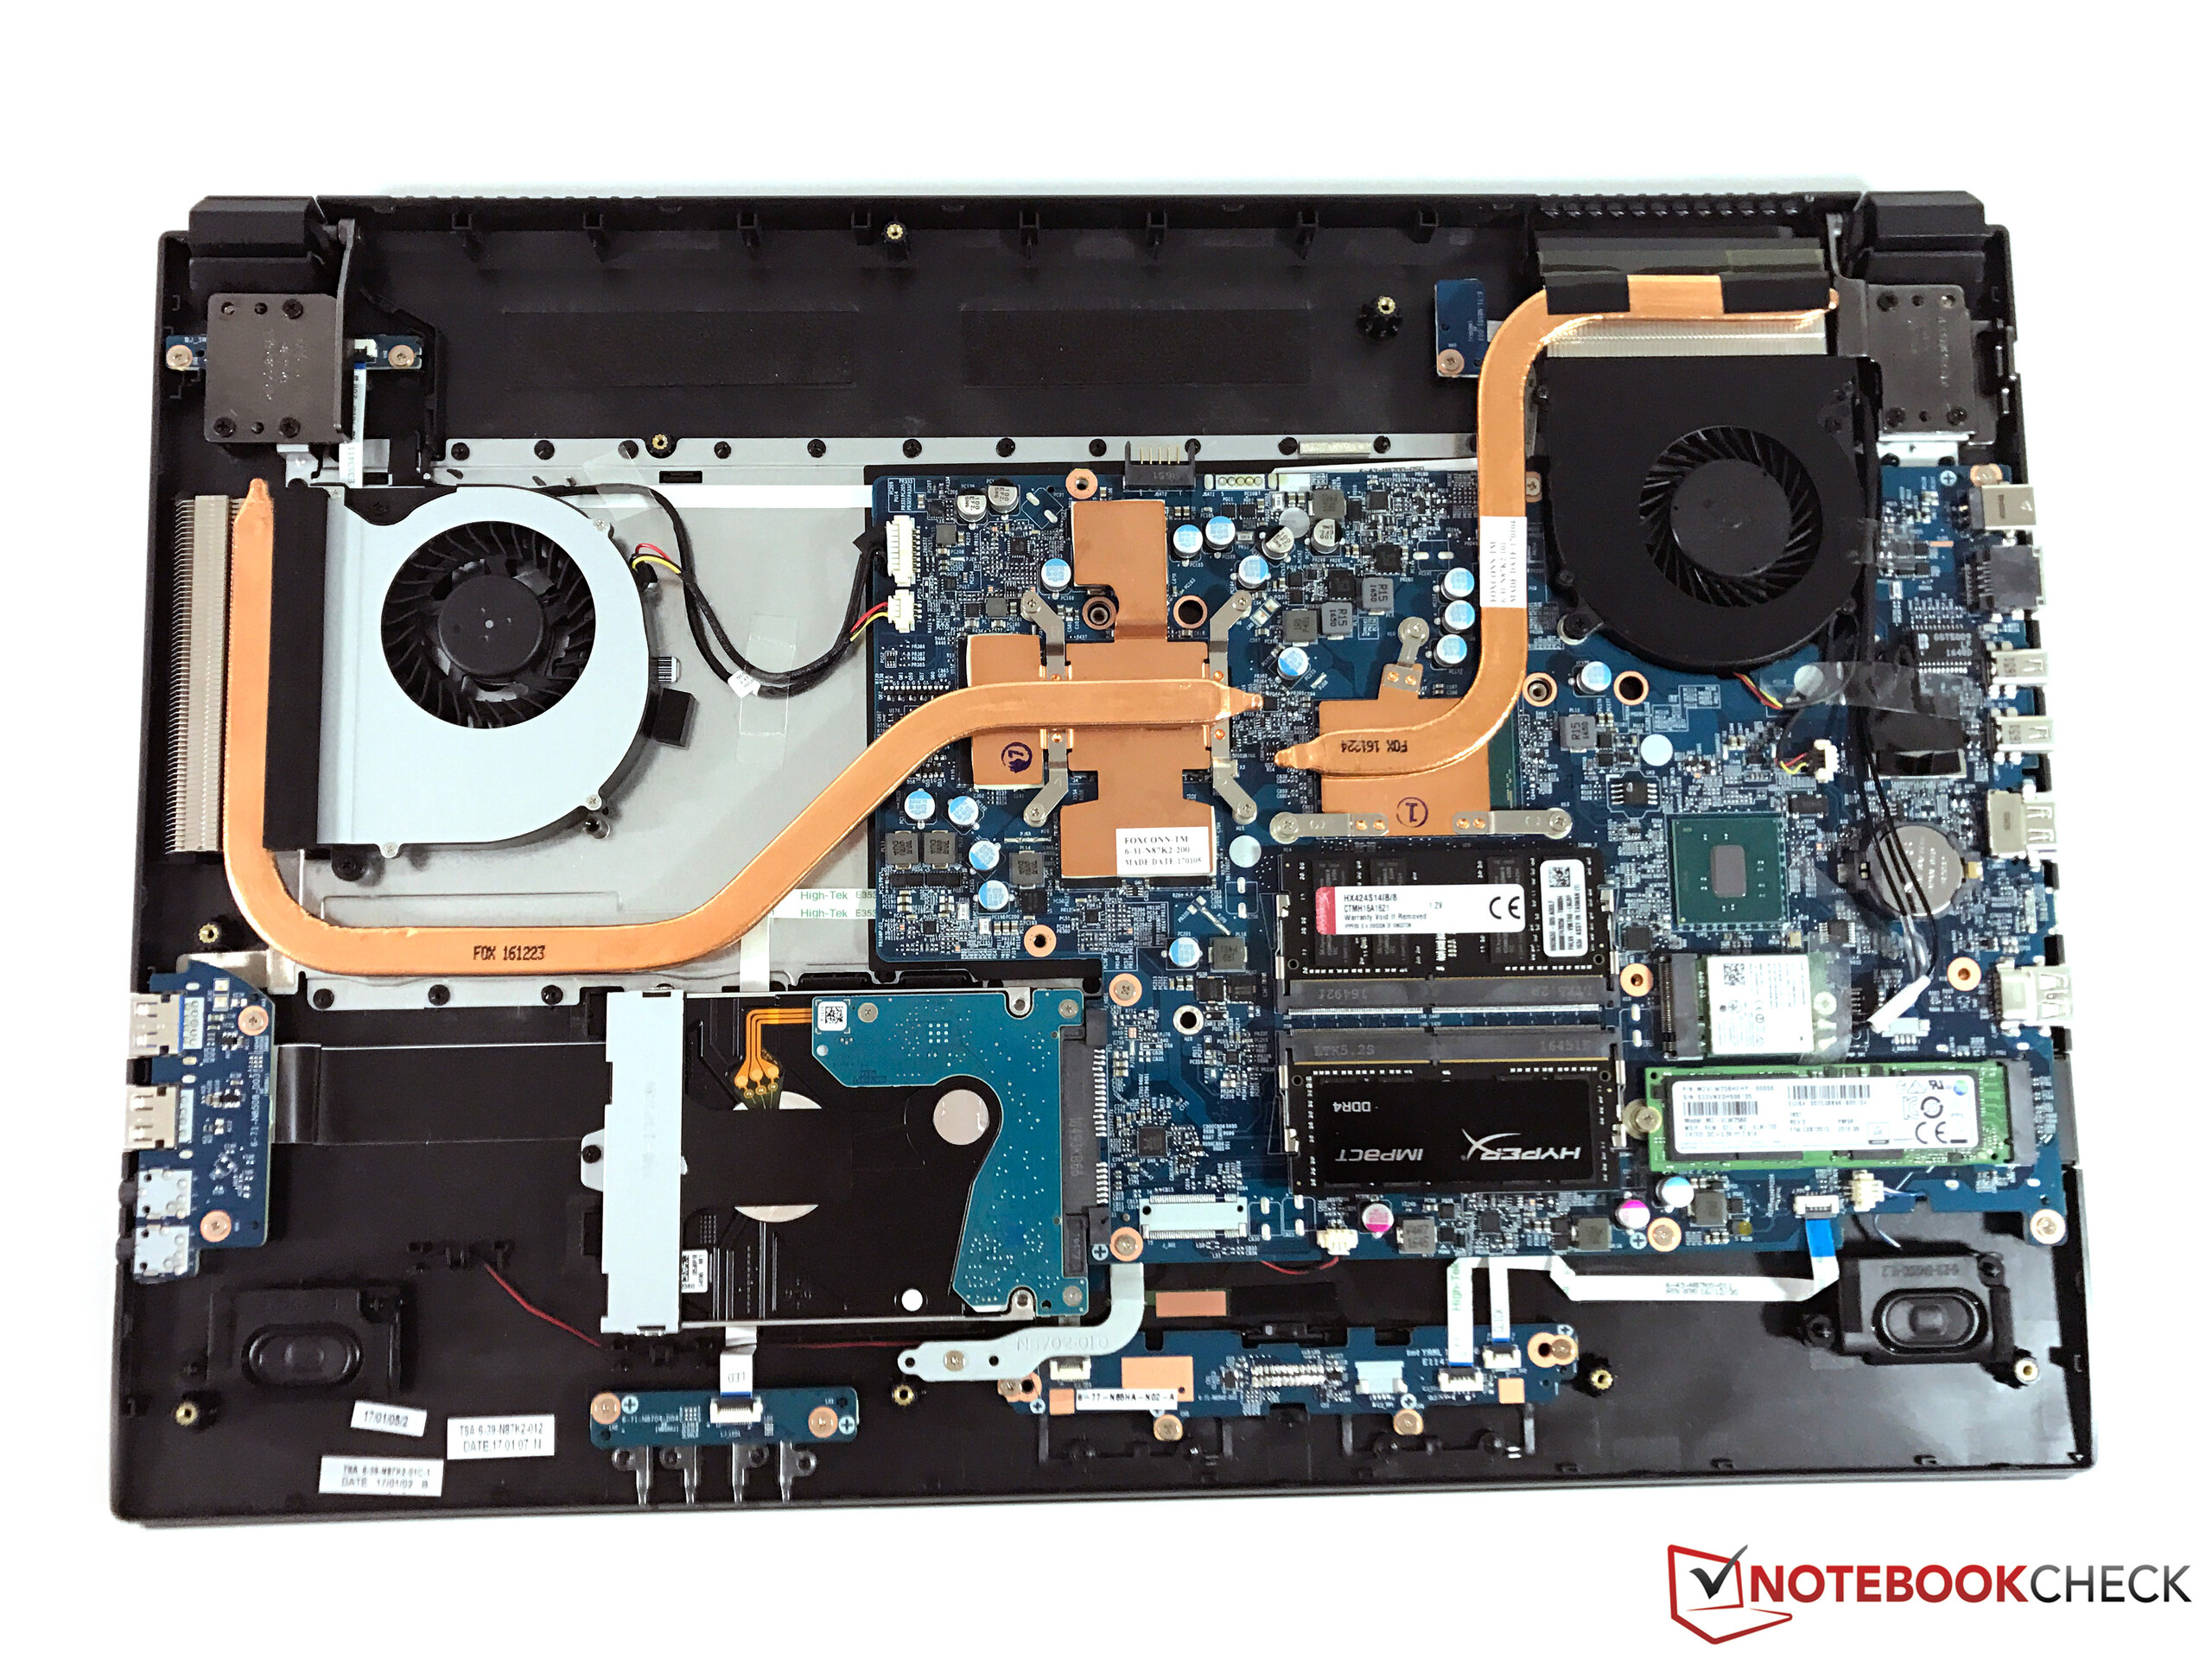
Los puntos débiles incluyen las temperaturas y el ruido generado. La carcasa ofrece suficiente espacio para un mejor sistema de refrigeración, pero los pequeños ventiladores hacen mucho ruido y la carcasa se calienta mucho. También hay que mejorar las conexiones (no tiene Thunderbolt) y buscamos, sin éxito, características útiles para juegos como G-Sync.
En general, el Nexoc G739 no es para nada un mal portátil para juegos, pero echar un ojo a la competencia no estaría de más.
Ésta es una versión acortada del análisis original. Puedes leer el análisis completo en inglés aquí.
Nexoc G739
- 06/23/2018 v6 (old)
Andreas Osthoff