Breve análisis de MSI GE72 7RE Apache Pro


| SD Card Reader | |
| average JPG Copy Test (av. of 3 runs) | |
| Aorus X7 v6 | |
| HP Omen 17-w110ng | |
| Asus GL702VM-GC102D | |
| MSI GE72 7RE-046 | |
| MSI GS73VR 6RF | |
| maximum AS SSD Seq Read Test (1GB) | |
| HP Omen 17-w110ng | |
| Aorus X7 v6 | |
| Asus GL702VM-GC102D | |
| MSI GE72 7RE-046 | |
| MSI GS73VR 6RF | |
| Networking | |
| iperf3 transmit AX12 | |
| Aorus X7 v6 | |
| HP Omen 17-w110ng | |
| MSI GE72 7RE-046 | |
| iperf3 receive AX12 | |
| HP Omen 17-w110ng | |
| Aorus X7 v6 | |
| MSI GE72 7RE-046 | |
| |||||||||||||||||||||||||
iluminación: 86 %
Brillo con batería: 253 cd/m²
Contraste: 1054:1 (Negro: 0.24 cd/m²)
ΔE ColorChecker Calman: 5.01 | ∀{0.5-29.43 Ø4.71}
ΔE Greyscale Calman: 7.26 | ∀{0.09-98 Ø4.96}
100% sRGB (Argyll 1.6.3 3D)
76% AdobeRGB 1998 (Argyll 1.6.3 3D)
85.2% AdobeRGB 1998 (Argyll 3D)
99.9% sRGB (Argyll 3D)
90.7% Display P3 (Argyll 3D)
Gamma: 2.09
CCT: 6329 K
| MSI GE72 7RE-046 N173HHE-G32 (CMN1747), 1920x1080 | Aorus X7 v6 B173QTN01.0 (AUO1096), 2560x1440 | HP Omen 17-w110ng LG Philips LGD046E, 1920x1080 | MSI GS73VR 6RF 1920x1080 | Asus GL702VM-GC102D LG Philips LP173WF4-SPF3, 1920x1080 | |
|---|---|---|---|---|---|
| Display | -26% | -24% | -1% | -24% | |
| Display P3 Coverage (%) | 90.7 | 60.9 -33% | 66.6 -27% | 90 -1% | 65.1 -28% |
| sRGB Coverage (%) | 99.9 | 84.2 -16% | 84.1 -16% | 99.9 0% | 83.5 -16% |
| AdobeRGB 1998 Coverage (%) | 85.2 | 61.2 -28% | 61.5 -28% | 83.6 -2% | 61.1 -28% |
| Response Times | -13% | -102% | -6% | -99% | |
| Response Time Grey 50% / Grey 80% * (ms) | 27 ? | 31 ? -15% | 37 ? -37% | 28 ? -4% | 38 ? -41% |
| Response Time Black / White * (ms) | 9 ? | 10 ? -11% | 24 ? -167% | 9.6 ? -7% | 23 ? -156% |
| PWM Frequency (Hz) | |||||
| Screen | -18% | 10% | 20% | -16% | |
| Brightness middle (cd/m²) | 253 | 343 36% | 362 43% | 337.2 33% | 326 29% |
| Brightness (cd/m²) | 230 | 312 36% | 342 49% | 315 37% | 312 36% |
| Brightness Distribution (%) | 86 | 80 -7% | 87 1% | 86 0% | 91 6% |
| Black Level * (cd/m²) | 0.24 | 0.5 -108% | 0.31 -29% | 0.308 -28% | 0.5 -108% |
| Contrast (:1) | 1054 | 686 -35% | 1168 11% | 1095 4% | 652 -38% |
| Colorchecker dE 2000 * | 5.01 | 7.33 -46% | 4.5 10% | 2.96 41% | 6.3 -26% |
| Colorchecker dE 2000 max. * | 10.4 | 10.79 -4% | 9.31 10% | 5.45 48% | 11.69 -12% |
| Greyscale dE 2000 * | 7.26 | 7.6 -5% | 3.48 52% | 2.57 65% | 7.37 -2% |
| Gamma | 2.09 105% | 2.19 100% | 2.23 99% | 2.25 98% | 2.37 93% |
| CCT | 6329 103% | 9024 72% | 6144 106% | 7114 91% | 7116 91% |
| Color Space (Percent of AdobeRGB 1998) (%) | 76 | 55 -28% | 55 -28% | 74.3 -2% | 55 -28% |
| Color Space (Percent of sRGB) (%) | 100 | 84 -16% | 84 -16% | 100 0% | 83 -17% |
| Media total (Programa/Opciones) | -19% /
-19% | -39% /
-11% | 4% /
12% | -46% /
-29% |
* ... más pequeño es mejor
Tiempos de respuesta del display
| ↔ Tiempo de respuesta de Negro a Blanco | ||
|---|---|---|
| 9 ms ... subida ↗ y bajada ↘ combinada | ↗ 6 ms subida | 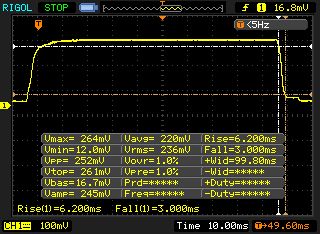 |
| ↘ 3 ms bajada | ||
| La pantalla mostró tiempos de respuesta rápidos en nuestros tests y debería ser adecuada para juegos. En comparación, todos los dispositivos de prueba van de ##min### (mínimo) a 240 (máximo) ms. » 25 % de todos los dispositivos son mejores. Esto quiere decir que el tiempo de respuesta medido es mejor que la media (19.8 ms) de todos los dispositivos testados. | ||
| ↔ Tiempo de respuesta 50% Gris a 80% Gris | ||
| 27 ms ... subida ↗ y bajada ↘ combinada | ↗ 13 ms subida | 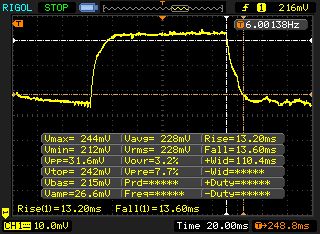 |
| ↘ 14 ms bajada | ||
| La pantalla mostró tiempos de respuesta relativamente lentos en nuestros tests pero podría ser demasiado lenta para los jugones. En comparación, todos los dispositivos de prueba van de ##min### (mínimo) a 636 (máximo) ms. » 37 % de todos los dispositivos son mejores. Esto quiere decir que el tiempo de respuesta medido es mejor que la media (31 ms) de todos los dispositivos testados. | ||
Parpadeo de Pantalla / PWM (Pulse-Width Modulation)
| Parpadeo de Pantalla / PWM no detectado | 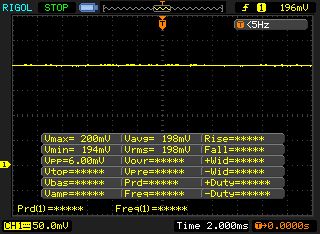 | ||
Comparación: 52 % de todos los dispositivos testados no usaron PWM para atenuar el display. Si se usó, medimos una media de 7757 (mínimo: 5 - máxmo: 343500) Hz. | |||
| Cinebench R15 | |
| CPU Single 64Bit | |
| Aorus X7 v6 | |
| HP Omen 17-w110ng | |
| MSI GE72 7RE-046 | |
| MSI GS73VR 6RF | |
| Asus GL702VM-GC102D | |
| CPU Multi 64Bit | |
| Aorus X7 v6 | |
| MSI GE72 7RE-046 | |
| HP Omen 17-w110ng | |
| Asus GL702VM-GC102D | |
| MSI GS73VR 6RF | |
| Cinebench R11.5 | |
| CPU Single 64Bit | |
| Aorus X7 v6 | |
| HP Omen 17-w110ng | |
| MSI GE72 7RE-046 | |
| MSI GS73VR 6RF | |
| Asus GL702VM-GC102D | |
| CPU Multi 64Bit | |
| Aorus X7 v6 | |
| MSI GE72 7RE-046 | |
| HP Omen 17-w110ng | |
| Asus GL702VM-GC102D | |
| MSI GS73VR 6RF | |
| PCMark 7 Score | 5810 puntos | |
ayuda | ||
| PCMark 7 - Score | |
| Aorus X7 v6 | |
| MSI GE72 7RE-046 | |
| HP Omen 17-w110ng | |
| Asus GL702VM-GC102D | |
| MSI GE72 7RE-046 Toshiba HG6 THNSNJ256G8NY | Aorus X7 v6 Toshiba NVMe THNSN5512GPU7 | HP Omen 17-w110ng Samsung PM951 NVMe MZVLV256 | MSI GS73VR 6RF SanDisk SD8SN8U1T001122 | Asus GL702VM-GC102D HGST Travelstar 7K1000 HTS721010A9E630 | |
|---|---|---|---|---|---|
| CrystalDiskMark 3.0 | 124% | 49% | -37% | -86% | |
| Read Seq (MB/s) | 540 | 1499 178% | 1156 114% | 334.3 -38% | 134.6 -75% |
| Write Seq (MB/s) | 495.7 | 1411 185% | 294.9 -41% | 319 -36% | 130.6 -74% |
| Read 4k (MB/s) | 22.7 | 44.33 95% | 42.7 88% | 20.3 -11% | 0.602 -97% |
| Write 4k (MB/s) | 112.9 | 155.5 38% | 153.3 36% | 42.51 -62% | 1.146 -99% |

| 3DMark Vantage P Result | 30690 puntos | |
| 3DMark 11 Performance | 9269 puntos | |
| 3DMark Ice Storm Standard Score | 69304 puntos | |
| 3DMark Cloud Gate Standard Score | 20933 puntos | |
| 3DMark Fire Strike Score | 6959 puntos | |
ayuda | ||
| 3DMark | |
| 1920x1080 Fire Strike Graphics | |
| Aorus X7 v6 | |
| HP Omen 17-w110ng | |
| MSI GS73VR 6RF | |
| Asus GL702VM-GC102D | |
| MSI GE72 7RE-046 | |
| 1280x720 Sky Diver Graphics | |
| Aorus X7 v6 | |
| HP Omen 17-w110ng | |
| Asus GL702VM-GC102D | |
| MSI GE72 7RE-046 | |
| 3DMark 11 - 1280x720 Performance GPU | |
| Aorus X7 v6 | |
| HP Omen 17-w110ng | |
| MSI GS73VR 6RF | |
| Asus GL702VM-GC102D | |
| MSI GE72 7RE-046 | |
| Unigine Heaven 4.0 - Extreme Preset DX11 | |
| Aorus X7 v6 | |
| HP Omen 17-w110ng | |
| MSI GE72 7RE-046 | |
| Battlefield 1 | |
| 1920x1080 Ultra Preset AA:T | |
| Aorus X7 v6 | |
| HP Omen 17-w110ng | |
| Asus GL702VM-GC102D | |
| MSI GE72 7RE-046 | |
| 1920x1080 High Preset AA:T | |
| Aorus X7 v6 | |
| HP Omen 17-w110ng | |
| Asus GL702VM-GC102D | |
| MSI GE72 7RE-046 | |
| bajo | medio | alto | ultra | QHD | 4K | |
|---|---|---|---|---|---|---|
| Dirt Rally (2015) | 93.4 | 65.7 | 57.8 | |||
| The Witcher 3 (2015) | 48.7 | 26.9 | 17.6 | |||
| Batman: Arkham Knight (2015) | 60 | 41 | 19 | |||
| Mad Max (2015) | 89.7 | 82.7 | 28.6 | |||
| Anno 2205 (2015) | 63.7 | 20.6 | 24 | |||
| Fallout 4 (2015) | 56 | 46.2 | 18.5 | |||
| Star Wars Battlefront (2015) | 72.4 | 62.7 | 22.4 | |||
| Assassin's Creed Syndicate (2015) | 47.8 | 23.5 | 17.1 | |||
| Rainbow Six Siege (2015) | 92.2 | 74.4 | 28.4 | |||
| Just Cause 3 (2015) | 58.9 | 52.7 | 22.1 | |||
| Rise of the Tomb Raider (2016) | 47.4 | 39.7 | 17.6 | |||
| XCOM 2 (2016) | 37.7 | 19 | 10.3 | |||
| Far Cry Primal (2016) | 53 | 40 | 17 | |||
| The Division (2016) | 45 | 34.9 | 16.6 | |||
| Hitman 2016 (2016) | 38.4 | 36.6 | 16.3 | |||
| Need for Speed 2016 (2016) | 60.4 | 46.4 | 21.3 | |||
| Doom (2016) | 68.3 | 63.8 | 21.2 | |||
| Overwatch (2016) | 118 | 71 | 38.3 | |||
| Mirror's Edge Catalyst (2016) | 50.3 | 45.1 | 16.2 | |||
| No Man's Sky (2016) | 44.6 | 22 | 18.1 | |||
| Deus Ex Mankind Divided (2016) | 38.3 | 19.7 | 12.3 | |||
| FIFA 17 (2016) | 130 | 128 | 66.1 | |||
| Mafia 3 (2016) | 28.7 | 9.8 | ||||
| Battlefield 1 (2016) | 56.7 | 50.8 | 19.8 | |||
| Farming Simulator 17 (2016) | 130 | 117 | 59.7 | |||
| Titanfall 2 (2016) | 62 | 56.2 | 18.7 | |||
| Call of Duty Infinite Warfare (2016) | 67.4 | 58.8 | 27.4 | |||
| Dishonored 2 (2016) | 48.7 | 39.6 | 18.2 | |||
| Watch Dogs 2 (2016) | 42.4 | 26.6 | 14.4 | |||
| Resident Evil 7 (2017) | 64.5 | 24.3 | ||||
| For Honor (2017) | 66 () | 62 () | 45 () | |||
| Ghost Recon Wildlands (2017) | 106 | 46.1 | 40.3 | 9.8 | ||
| Mass Effect Andromeda (2017) | 105 | 50.2 | 27.9 | 23 | ||
| Warhammer 40.000: Dawn of War III (2017) | 112 | 46.6 | 29.8 | 25.8 | 0 | |
| Rocket League (2017) | 158 | 61 | ||||
| Dirt 4 (2017) | 74.2 | 39.2 | ||||
| Team Fortress 2 (2017) | 105 | 74.4 | ||||
| Playerunknown's Battlegrounds (PUBG) (2017) | 54.1 | 45.2 | ||||
| F1 2017 (2017) | 66 | 40 | 16 | |||
| Ark Survival Evolved (2017) | 89 | 31.6 | 21.8 | |||
| FIFA 18 (2017) | 149 | 62.3 | ||||
| Middle-earth: Shadow of War (2017) | 121 | 62 | 43 | 29 | 12 | |
| The Evil Within 2 (2017) | 61.8 | 36.1 | 32.9 | 31 | 2 | |
| ELEX (2017) | 102 | 52.2 | 41.9 | 31 | 19.6 | 6.6 |
| Destiny 2 (2017) | 116 | 65.5 | 62.1 | 51.1 | 26.1 | 17.8 |
| Assassin´s Creed Origins (2017) | 77 | 45 | 38 | 28 | 20 | 4 |
| Call of Duty WWII (2017) | 191 | 129 | 67.8 | 42.4 | 30.8 | 18.9 |
| Need for Speed Payback (2017) | 115 | 66 | 54.7 | 50.9 | 30.3 | 9.7 |
| Star Wars Battlefront 2 (2017) | 135 | 75 | 65 | 43 | 19.5 | 5.7 |
| Fortnite (2018) | 61 | 45.1 | 28.8 | 8.8 | ||
| Final Fantasy XV Benchmark (2018) | 74 | 37.1 | 23.4 | |||
| Kingdom Come: Deliverance (2018) | 107 | 49.5 | 40.5 | 28 | 16.9 | 6 |
| X-Plane 11.11 (2018) | 77.3 | 69.9 | 61.2 | 45.3 | ||
| Far Cry 5 (2018) | 95 | 47 | 43 | 39 | 25 | 12 |
| The Crew 2 (2018) | 51 | 44.1 | ||||
| Monster Hunter World (2018) | 93 | 41.2 | 35.5 | 27.9 | ||
| F1 2018 (2018) | 146 | 81 | 62 | 37 | 28 | 15 |
| Shadow of the Tomb Raider (2018) | 97 | 38 | 31 | 25 | 17 | 8 |
| FIFA 19 (2018) | 192 | 169 | 157 | 150 | 51.3 | |
| Forza Horizon 4 (2018) | 122 | 62 | 55 | 40 | ||
| Assassin´s Creed Odyssey (2018) | 77 | 41 | 31 | 17 | ||
| Call of Duty Black Ops 4 (2018) | 35.5 | 10.2 | ||||
| Hitman 2 (2018) | 55.6 | 39 | 29.7 | 23.6 | ||
| Fallout 76 (2018) | 48.4 | 45.3 |
Ruido
| Ocioso |
| 34 / 35 / 36 dB(A) |
| DVD |
| 40 / dB(A) |
| Carga |
| 41 / 49 dB(A) |
 | ||
30 dB silencioso 40 dB(A) audible 50 dB(A) ruidosamente alto |
||
min: | ||
| MSI GE72 7RE-046 GeForce GTX 1050 Ti Mobile, i7-7700HQ | Aorus X7 v6 GeForce GTX 1070 Mobile, 6820HK | HP Omen 17-w110ng GeForce GTX 1070 Mobile, 6700HQ | MSI GS73VR 6RF GeForce GTX 1060 Mobile, 6700HQ | Asus GL702VM-GC102D GeForce GTX 1060 Mobile, 6700HQ | |
|---|---|---|---|---|---|
| Noise | -4% | -1% | 2% | 6% | |
| apagado / medio ambiente * (dB) | 30 | 30 -0% | 30 -0% | 28.4 5% | 30.5 -2% |
| Idle Minimum * (dB) | 34 | 33 3% | 33 3% | 31.9 6% | 31.4 8% |
| Idle Average * (dB) | 35 | 35 -0% | 34 3% | 32 9% | 31.4 10% |
| Idle Maximum * (dB) | 36 | 40 -11% | 35 3% | 34 6% | 31.5 12% |
| Load Average * (dB) | 41 | 43 -5% | 45 -10% | 47 -15% | 40.9 -0% |
| Load Maximum * (dB) | 49 | 54 -10% | 52 -6% | 49.4 -1% | 46.2 6% |
* ... más pequeño es mejor
(-) La temperatura máxima en la parte superior es de 45.8 °C / 114 F, frente a la media de 40.4 °C / 105 F, que oscila entre 21.2 y 68.8 °C para la clase Gaming.
(-) El fondo se calienta hasta un máximo de 45.2 °C / 113 F, frente a la media de 43.2 °C / 110 F
(+) En reposo, la temperatura media de la parte superior es de 26.7 °C / 80# F, frente a la media del dispositivo de 33.9 °C / 93 F.
(-) El reposamanos y el touchpad pueden calentarse mucho al tacto con un máximo de 40.3 °C / 104.5 F.
(-) La temperatura media de la zona del reposamanos de dispositivos similares fue de 28.8 °C / 83.8 F (-11.5 °C / -20.7 F).
| MSI GE72 7RE-046 GeForce GTX 1050 Ti Mobile, i7-7700HQ | Aorus X7 v6 GeForce GTX 1070 Mobile, 6820HK | HP Omen 17-w110ng GeForce GTX 1070 Mobile, 6700HQ | MSI GS73VR 6RF GeForce GTX 1060 Mobile, 6700HQ | Asus GL702VM-GC102D GeForce GTX 1060 Mobile, 6700HQ | |
|---|---|---|---|---|---|
| Heat | -3% | -2% | -7% | -8% | |
| Maximum Upper Side * (°C) | 45.8 | 47.5 -4% | 45 2% | 50.8 -11% | 53.1 -16% |
| Maximum Bottom * (°C) | 45.2 | 54.5 -21% | 54.3 -20% | 60 -33% | 44.9 1% |
| Idle Upper Side * (°C) | 31.7 | 28.6 10% | 29.6 7% | 27.4 14% | 32.9 -4% |
| Idle Bottom * (°C) | 29.9 | 28.8 4% | 28.6 4% | 28.8 4% | 33.4 -12% |
* ... más pequeño es mejor
MSI GE72 7RE-046 análisis de audio
(+) | los altavoces pueden reproducir a un volumen relativamente alto (#91 dB)
Graves 100 - 315 Hz
(-) | casi sin bajos - de media 17.2% inferior a la mediana
(±) | la linealidad de los graves es media (9.2% delta a frecuencia anterior)
Medios 400 - 2000 Hz
(+) | medios equilibrados - a sólo 3.3% de la mediana
(+) | los medios son lineales (4.7% delta a la frecuencia anterior)
Altos 2 - 16 kHz
(+) | máximos equilibrados - a sólo 3.3% de la mediana
(+) | los máximos son lineales (4% delta a la frecuencia anterior)
Total 100 - 16.000 Hz
(+) | el sonido global es lineal (13.7% de diferencia con la mediana)
En comparación con la misma clase
» 21% de todos los dispositivos probados de esta clase eran mejores, 7% similares, 72% peores
» El mejor tuvo un delta de 6%, la media fue 18%, el peor fue ###max##%
En comparación con todos los dispositivos probados
» 15% de todos los dispositivos probados eran mejores, 4% similares, 81% peores
» El mejor tuvo un delta de 4%, la media fue 23%, el peor fue ###max##%
Asus GL702VM-GC102D análisis de audio
(-) | altavoces no muy altos (#64 dB)
Graves 100 - 315 Hz
(±) | lubina reducida - en promedio 7.7% inferior a la mediana
(±) | la linealidad de los graves es media (14% delta a frecuencia anterior)
Medios 400 - 2000 Hz
(+) | medios equilibrados - a sólo 1.5% de la mediana
(+) | los medios son lineales (6.3% delta a la frecuencia anterior)
Altos 2 - 16 kHz
(±) | máximos reducidos - de media 5.3% inferior a la mediana
(±) | la linealidad de los máximos es media (9.8% delta a frecuencia anterior)
Total 100 - 16.000 Hz
(±) | la linealidad del sonido global es media (16.7% de diferencia con la mediana)
En comparación con la misma clase
» 43% de todos los dispositivos probados de esta clase eran mejores, 10% similares, 47% peores
» El mejor tuvo un delta de 6%, la media fue 18%, el peor fue ###max##%
En comparación con todos los dispositivos probados
» 29% de todos los dispositivos probados eran mejores, 7% similares, 64% peores
» El mejor tuvo un delta de 4%, la media fue 23%, el peor fue ###max##%
| Off / Standby | |
| Ocioso | |
| Carga |
|
Clave:
min: | |
| MSI GE72 7RE-046 GeForce GTX 1050 Ti Mobile, i7-7700HQ | Aorus X7 v6 GeForce GTX 1070 Mobile, 6820HK | HP Omen 17-w110ng GeForce GTX 1070 Mobile, 6700HQ | MSI GS73VR 6RF GeForce GTX 1060 Mobile, 6700HQ | Asus GL702VM-GC102D GeForce GTX 1060 Mobile, 6700HQ | |
|---|---|---|---|---|---|
| Power Consumption | -67% | -28% | -44% | -3% | |
| Idle Minimum * (Watt) | 14 | 29 -107% | 19 -36% | 22.6 -61% | 15.6 -11% |
| Idle Average * (Watt) | 20 | 31 -55% | 25 -25% | 32.7 -64% | 20.2 -1% |
| Idle Maximum * (Watt) | 25 | 38 -52% | 31 -24% | 32.8 -31% | 21.4 14% |
| Load Average * (Watt) | 82 | 111 -35% | 90 -10% | 114.7 -40% | 90 -10% |
| Load Maximum * (Watt) | 135 | 253 -87% | 193 -43% | 167.9 -24% | 147 -9% |
* ... más pequeño es mejor
| MSI GE72 7RE-046 51.4 Wh | Aorus X7 v6 94 Wh | HP Omen 17-w110ng 95 Wh | MSI GS73VR 6RF 65 Wh | Asus GL702VM-GC102D 76 Wh | |
|---|---|---|---|---|---|
| Duración de Batería | -3% | 25% | 16% | 34% | |
| H.264 (h) | 3.3 | 3.9 18% | 4.4 33% | ||
| WiFi v1.3 (h) | 3.1 | 3 -3% | 4.1 32% | 3.6 16% | 4.2 35% |
Pro
Contra
Aunque al GE72 7RE le falta una certificación para la RV, se le puede considerar un portátil gaming. La nueva Nvidia GeForce GTX 1050 Ti ofrece mayormente bastante rendimiento para lograr frame rates medio decentes con una resolución de 1,920 x 1,080 pixels y detalles altos.
El rendimiento caerá rápidamente en el rango de 3K y 4K y hará que los títulos exigentes resulten injugables. Sin embargo, los gamers deberían plantearse gastar algo más en una GTX 1060. A la larga, 6 GB de VRAM aguantarán más tiempo que 4 GB y tales dispositivos raramente cuestan más.
En nuestra opinión, la arquitectura Intel Kaby Lake no es espectacular, y sólo mejora ligeramente el rendimiento CPU.
Los que estéis dudando entre un portátil multimedia barato y uno realmente de primera pueden quedar satisfechos con el GE72 7RE.
Ésta es una versión acortada del análisis original. Puedes leer el análisis completo en inglés aquí.
MSI GE72 7RE-046
- 12/28/2016 v6 (old)
Florian Glaser