Breve análisis del portátil Asus GL702VM-GC102D
| SD Card Reader | |
| average JPG Copy Test (av. of 3 runs) | |
| Schenker XMG P507 | |
| Gigabyte P57X v6 | |
| HP Omen 17-w110ng | |
| Asus GL702VM-GC102D | |
| MSI GS73VR 6RF | |
| maximum AS SSD Seq Read Test (1GB) | |
| Gigabyte P57X v6 | |
| HP Omen 17-w110ng | |
| Schenker XMG P507 | |
| Asus GL702VM-GC102D | |
| MSI GS73VR 6RF | |
| Networking | |
| iperf Server (receive) TCP 1 m | |
| HP Omen 17-w110ng | |
| Asus GL702VM-GC102D (jseb) | |
| Schenker XMG P507 | |
| MSI GS73VR 6RF | |
| iperf Client (transmit) TCP 1 m | |
| Asus GL702VM-GC102D (jseb) | |
| MSI GS73VR 6RF | |
| HP Omen 17-w110ng | |
| Schenker XMG P507 | |
| |||||||||||||||||||||||||
iluminación: 91 %
Brillo con batería: 326 cd/m²
Contraste: 652:1 (Negro: 0.5 cd/m²)
ΔE ColorChecker Calman: 6.3 | ∀{0.5-29.43 Ø4.73}
ΔE Greyscale Calman: 7.37 | ∀{0.09-98 Ø4.97}
83% sRGB (Argyll 1.6.3 3D)
55% AdobeRGB 1998 (Argyll 1.6.3 3D)
61.1% AdobeRGB 1998 (Argyll 3D)
83.5% sRGB (Argyll 3D)
65.1% Display P3 (Argyll 3D)
Gamma: 2.37
CCT: 7116 K
| Asus GL702VM-GC102D IPS, 1920x1080, 17.3" | HP Omen 17-w110ng IPS, 1920x1080, 17.3" | Gigabyte P57X v6 IPS, 1920x1080, 17.3" | MSI GS73VR 6RF TN LED, 1920x1080, 17.3" | Schenker XMG P507 IPS, 60 Hz, 1920x1080, 15.6" | |
|---|---|---|---|---|---|
| Display | 1% | 5% | 32% | -0% | |
| Display P3 Coverage (%) | 65.1 | 66.6 2% | 68 4% | 90 38% | 64.5 -1% |
| sRGB Coverage (%) | 83.5 | 84.1 1% | 87.5 5% | 99.9 20% | 83.4 0% |
| AdobeRGB 1998 Coverage (%) | 61.1 | 61.5 1% | 64 5% | 83.6 37% | 61 0% |
| Response Times | -1% | 1% | 42% | 3% | |
| Response Time Grey 50% / Grey 80% * (ms) | 38 ? | 37 ? 3% | 33.6 ? 12% | 28 ? 26% | 36 ? 5% |
| Response Time Black / White * (ms) | 23 ? | 24 ? -4% | 25.6 ? -11% | 9.6 ? 58% | 23 ? -0% |
| PWM Frequency (Hz) | |||||
| Screen | 24% | 17% | 33% | 14% | |
| Brightness middle (cd/m²) | 326 | 362 11% | 329.2 1% | 337.2 3% | 288 -12% |
| Brightness (cd/m²) | 312 | 342 10% | 321 3% | 315 1% | 292 -6% |
| Brightness Distribution (%) | 91 | 87 -4% | 93 2% | 86 -5% | 87 -4% |
| Black Level * (cd/m²) | 0.5 | 0.31 38% | 0.267 47% | 0.308 38% | 0.3 40% |
| Contrast (:1) | 652 | 1168 79% | 1233 89% | 1095 68% | 960 47% |
| Colorchecker dE 2000 * | 6.3 | 4.5 29% | 5.93 6% | 2.96 53% | 5.1 19% |
| Colorchecker dE 2000 max. * | 11.69 | 9.31 20% | 11.07 5% | 5.45 53% | 9.44 19% |
| Greyscale dE 2000 * | 7.37 | 3.48 53% | 6.72 9% | 2.57 65% | 4.43 40% |
| Gamma | 2.37 93% | 2.23 99% | 2.12 104% | 2.25 98% | 2.46 89% |
| CCT | 7116 91% | 6144 106% | 7611 85% | 7114 91% | 6687 97% |
| Color Space (Percent of AdobeRGB 1998) (%) | 55 | 55 0% | 57 4% | 74.3 35% | 55 0% |
| Color Space (Percent of sRGB) (%) | 83 | 84 1% | 87 5% | 100 20% | 83 0% |
| Media total (Programa/Opciones) | 8% /
16% | 8% /
12% | 36% /
34% | 6% /
10% |
* ... más pequeño es mejor
Parpadeo de Pantalla / PWM (Pulse-Width Modulation)
| Parpadeo de Pantalla / PWM no detectado | ||
Comparación: 52 % de todos los dispositivos testados no usaron PWM para atenuar el display. Si se usó, medimos una media de 7794 (mínimo: 5 - máxmo: 343500) Hz. | ||
Tiempos de respuesta del display
| ↔ Tiempo de respuesta de Negro a Blanco | ||
|---|---|---|
| 23 ms ... subida ↗ y bajada ↘ combinada | ↗ 5 ms subida | 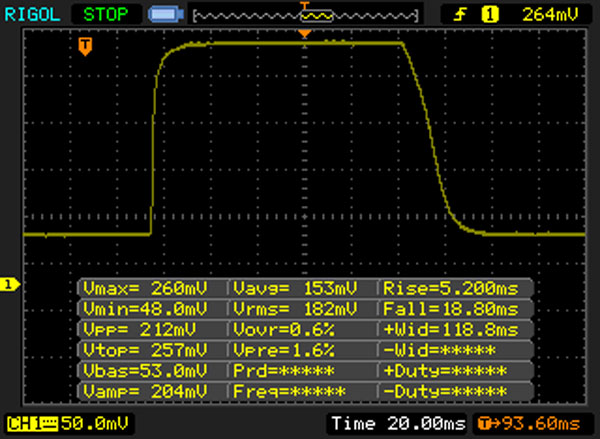 |
| ↘ 18 ms bajada | ||
| La pantalla mostró buenos tiempos de respuesta en nuestros tests pero podría ser demasiado lenta para los jugones competitivos. En comparación, todos los dispositivos de prueba van de ##min### (mínimo) a 240 (máximo) ms. » 52 % de todos los dispositivos son mejores. Eso quiere decir que el tiempo de respuesta es peor que la media (19.9 ms) de todos los dispositivos testados. | ||
| ↔ Tiempo de respuesta 50% Gris a 80% Gris | ||
| 38 ms ... subida ↗ y bajada ↘ combinada | ↗ 12 ms subida | 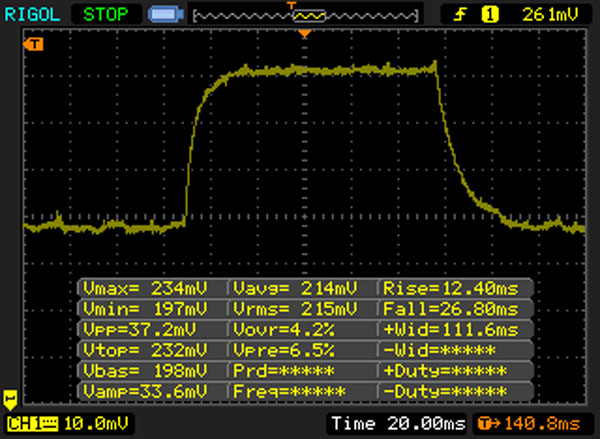 |
| ↘ 26 ms bajada | ||
| La pantalla mostró tiempos de respuesta lentos en nuestros tests y podría ser demasiado lenta para los jugones. En comparación, todos los dispositivos de prueba van de ##min### (mínimo) a 636 (máximo) ms. » 55 % de todos los dispositivos son mejores. Eso quiere decir que el tiempo de respuesta es peor que la media (31.1 ms) de todos los dispositivos testados. | ||
| Cinebench R10 | |
| Rendering Multiple CPUs 32Bit | |
| HP Omen 17-w110ng | |
| Asus GL702VM-GC102D | |
| MSI GS73VR 6RF | |
| Rendering Single 32Bit | |
| HP Omen 17-w110ng | |
| Asus GL702VM-GC102D | |
| MSI GS73VR 6RF | |
| Geekbench 3 | |
| 32 Bit Single-Core Score | |
| Asus GL702VM-GC102D | |
| 32 Bit Multi-Core Score | |
| Asus GL702VM-GC102D | |
| Geekbench 4.0 | |
| 64 Bit Single-Core Score | |
| Asus GL702VM-GC102D | |
| 64 Bit Multi-Core Score | |
| Asus GL702VM-GC102D | |
| JetStream 1.1 - 1.1 Total | |
| HP Omen 17-w110ng | |
| Gigabyte P57X v6 | |
| Asus GL702VM-GC102D | |
| MSI GS73VR 6RF | |
| PCMark 7 Score | 4114 puntos | |
| PCMark 8 Home Score Accelerated v2 | 4670 puntos | |
| PCMark 8 Creative Score Accelerated v2 | 6361 puntos | |
| PCMark 8 Work Score Accelerated v2 | 4809 puntos | |
ayuda | ||
| PCMark 8 | |
| Home Score Accelerated v2 | |
| HP Omen 17-w110ng | |
| Asus GL702VM-GC102D | |
| Gigabyte P57X v6 | |
| MSI GS73VR 6RF | |
| Work Score Accelerated v2 | |
| HP Omen 17-w110ng | |
| Gigabyte P57X v6 | |
| Asus GL702VM-GC102D | |
| MSI GS73VR 6RF | |

| Asus GL702VM-GC102D HGST Travelstar 7K1000 HTS721010A9E630 | MSI CX72-7QLi581 WDC Scorpio Blue WD10JPVX-22JC3T0 | HP Omen 17-w110ng Samsung PM951 NVMe MZVLV256 | Gigabyte P57X v6 Transcend MTS800 256GB M.2 (TS256GMTS800) | MSI GS73VR 6RF SanDisk SD8SN8U1T001122 | |
|---|---|---|---|---|---|
| CrystalDiskMark 3.0 | -20% | 12718% | 7576% | 5569% | |
| Read Seq (MB/s) | 134.6 | 102.8 -24% | 1156 759% | 481.7 258% | 334.3 148% |
| Write Seq (MB/s) | 130.6 | 100.2 -23% | 294.9 126% | 315.4 142% | 319 144% |
| Read 512 (MB/s) | 44.85 | 34.83 -22% | 616 1273% | 303.1 576% | 242.3 440% |
| Write 512 (MB/s) | 63.3 | 46.87 -26% | 294.7 366% | 314.4 397% | 254.4 302% |
| Read 4k (MB/s) | 0.602 | 0.422 -30% | 42.7 6993% | 25.93 4207% | 20.3 3272% |
| Write 4k (MB/s) | 1.146 | 1.063 -7% | 153.3 13277% | 84.6 7282% | 42.51 3609% |
| Read 4k QD32 (MB/s) | 1.106 | 0.918 -17% | 600 54150% | 273.9 24665% | 251.6 22649% |
| Write 4k QD32 (MB/s) | 1.186 | 1.064 -10% | 295.3 24799% | 274.9 23079% | 167.1 13989% |
| 3DMark 06 Standard Score | 19244 puntos | |
| 3DMark 11 Performance | 11159 puntos | |
| 3DMark Ice Storm Standard Score | 113032 puntos | |
| 3DMark Cloud Gate Standard Score | 22619 puntos | |
| 3DMark Fire Strike Score | 9432 puntos | |
| 3DMark Fire Strike Extreme Score | 5067 puntos | |
| 3DMark Time Spy Score | 3536 puntos | |
ayuda | ||
| 3DMark 11 - 1280x720 Performance GPU | |
| Gigabyte P57X v6 | |
| HP Omen 17-w110ng | |
| MSI RX 470 Gaming X 4GB | |
| MSI GS73VR 6RF | |
| XMG P723 Pro | |
| Asus GL702VM-GC102D | |
| Schenker XMG P507 | |
| XFX RX-460P4DFG5 Double Dissipation 4 GB | |
| MSI GL72 6QF | |
| 3DMark | |
| 1280x720 Cloud Gate Standard Graphics | |
| HP Omen 17-w110ng | |
| Gigabyte P57X v6 | |
| Asus GL702VM-GC102D | |
| XMG P723 Pro | |
| Schenker XMG P507 | |
| MSI GS73VR 6RF | |
| MSI RX 470 Gaming X 4GB | |
| XFX RX-460P4DFG5 Double Dissipation 4 GB | |
| MSI GL72 6QF | |
| 1920x1080 Fire Strike Graphics | |
| HP Omen 17-w110ng | |
| MSI RX 470 Gaming X 4GB | |
| MSI GS73VR 6RF | |
| Asus GL702VM-GC102D | |
| XMG P723 Pro | |
| Schenker XMG P507 | |
| XFX RX-460P4DFG5 Double Dissipation 4 GB | |
| MSI GL72 6QF | |
| bajo | medio | alto | ultra | |
|---|---|---|---|---|
| Tomb Raider (2013) | 344.9 | 325.4 | 286.2 | 138.4 |
| BioShock Infinite (2013) | 195.1 | 177.3 | 166.4 | 98.9 |
| Battlefield 4 (2013) | 180.1 | 167.2 | 151.4 | 99.1 |
| X-Plane 10.25 (2013) | 81.8 | 46.6 | 24.5 | 24.5 |
| Middle-earth: Shadow of Mordor (2014) | 147.5 | 130.9 | 109 | 85.7 |
| GTA V (2015) | 122.3 | 117.7 | 90.3 | 48.2 |
| Ashes of the Singularity (2016) | 51.2 | 49.1 | 47.5 | |
| Deus Ex Mankind Divided (2016) | 65 | 61.9 | 48.7 | 27.3 |
| FIFA 17 (2016) | 232.7 | 216.2 | 198.6 | 197.9 |
| Mafia 3 (2016) | 51.3 | 47.1 | 40.1 | |
| Battlefield 1 (2016) | 116.4 | 104.9 | 87.4 | 79 |
| Farming Simulator 17 (2016) | 209.3 | 179.6 | 165.1 | 153.9 |
| Titanfall 2 (2016) | 143.4 | 143 | 89.3 | 80.2 |
| BioShock Infinite - 1920x1080 Ultra Preset, DX11 (DDOF) | |
| Gigabyte P57X v6 | |
| HP Omen 17-w110ng | |
| MSI GS73VR 6RF | |
| Asus GL702VM-GC102D | |
| Schenker XMG P507 | |
| Tomb Raider - 1920x1080 Ultra Preset AA:FX AF:16x | |
| Asus GL702VM-GC102D | |
| Battlefield 4 - 1920x1080 Ultra Preset AA:4x MS | |
| Asus GL702VM-GC102D | |
| Schenker XMG P507 | |
Ruido
| Ocioso |
| 31.4 / 31.4 / 31.5 dB(A) |
| HDD |
| 31.5 dB(A) |
| Carga |
| 40.9 / 46.2 dB(A) |
 | ||
30 dB silencioso 40 dB(A) audible 50 dB(A) ruidosamente alto |
||
min: | ||
| Asus GL702VM-GC102D 6700HQ, GeForce GTX 1060 Mobile | HP Omen 17-w110ng 6700HQ, GeForce GTX 1070 Mobile | Gigabyte P57X v6 6700HQ, GeForce GTX 1070 Mobile | MSI GS73VR 6RF 6700HQ, GeForce GTX 1060 Mobile | Schenker XMG P507 6700HQ, GeForce GTX 1060 Mobile | |
|---|---|---|---|---|---|
| Noise | -8% | -7% | -5% | -6% | |
| apagado / medio ambiente * (dB) | 30.5 | 30 2% | 29.7 3% | 28.4 7% | 30 2% |
| Idle Minimum * (dB) | 31.4 | 33 -5% | 33.2 -6% | 31.9 -2% | 31 1% |
| Idle Average * (dB) | 31.4 | 34 -8% | 33.2 -6% | 32 -2% | 32 -2% |
| Idle Maximum * (dB) | 31.5 | 35 -11% | 33.2 -5% | 34 -8% | 38 -21% |
| Load Average * (dB) | 40.9 | 45 -10% | 47.5 -16% | 47 -15% | 46 -12% |
| Load Maximum * (dB) | 46.2 | 52 -13% | 52.5 -14% | 49.4 -7% | 49 -6% |
* ... más pequeño es mejor
(-) La temperatura máxima en la parte superior es de 53.1 °C / 128 F, frente a la media de 40.4 °C / 105 F, que oscila entre 21.2 y 68.8 °C para la clase Gaming.
(±) El fondo se calienta hasta un máximo de 44.9 °C / 113 F, frente a la media de 43.2 °C / 110 F
(+) En reposo, la temperatura media de la parte superior es de 27.8 °C / 82# F, frente a la media del dispositivo de 33.9 °C / 93 F.
(+) El reposamanos y el panel táctil están a una temperatura inferior a la de la piel, con un máximo de 27.9 °C / 82.2 F y, por tanto, son fríos al tacto.
(±) La temperatura media de la zona del reposamanos de dispositivos similares fue de 28.8 °C / 83.8 F (+0.9 °C / 1.6 F).
| Asus GL702VM-GC102D 6700HQ, GeForce GTX 1060 Mobile | HP Omen 17-w110ng 6700HQ, GeForce GTX 1070 Mobile | Gigabyte P57X v6 6700HQ, GeForce GTX 1070 Mobile | MSI GS73VR 6RF 6700HQ, GeForce GTX 1060 Mobile | Schenker XMG P507 6700HQ, GeForce GTX 1060 Mobile | |
|---|---|---|---|---|---|
| Heat | 5% | -13% | 0% | 1% | |
| Maximum Upper Side * (°C) | 53.1 | 45 15% | 59 -11% | 50.8 4% | 49.3 7% |
| Maximum Bottom * (°C) | 44.9 | 54.3 -21% | 66 -47% | 60 -34% | 52.7 -17% |
| Idle Upper Side * (°C) | 32.9 | 29.6 10% | 33.2 -1% | 27.4 17% | 32.6 1% |
| Idle Bottom * (°C) | 33.4 | 28.6 14% | 30.6 8% | 28.8 14% | 29.5 12% |
* ... más pequeño es mejor
Asus GL702VM-GC102D análisis de audio
(-) | altavoces no muy altos (#64 dB)
Graves 100 - 315 Hz
(±) | lubina reducida - en promedio 7.7% inferior a la mediana
(±) | la linealidad de los graves es media (14% delta a frecuencia anterior)
Medios 400 - 2000 Hz
(+) | medios equilibrados - a sólo 1.5% de la mediana
(+) | los medios son lineales (6.3% delta a la frecuencia anterior)
Altos 2 - 16 kHz
(±) | máximos reducidos - de media 5.3% inferior a la mediana
(±) | la linealidad de los máximos es media (9.8% delta a frecuencia anterior)
Total 100 - 16.000 Hz
(±) | la linealidad del sonido global es media (16.7% de diferencia con la mediana)
En comparación con la misma clase
» 43% de todos los dispositivos probados de esta clase eran mejores, 10% similares, 47% peores
» El mejor tuvo un delta de 6%, la media fue 18%, el peor fue ###max##%
En comparación con todos los dispositivos probados
» 29% de todos los dispositivos probados eran mejores, 7% similares, 64% peores
» El mejor tuvo un delta de 4%, la media fue 24%, el peor fue ###max##%
Apple MacBook 12 (Early 2016) 1.1 GHz análisis de audio
(+) | los altavoces pueden reproducir a un volumen relativamente alto (#83.6 dB)
Graves 100 - 315 Hz
(±) | lubina reducida - en promedio 11.3% inferior a la mediana
(±) | la linealidad de los graves es media (14.2% delta a frecuencia anterior)
Medios 400 - 2000 Hz
(+) | medios equilibrados - a sólo 2.4% de la mediana
(+) | los medios son lineales (5.5% delta a la frecuencia anterior)
Altos 2 - 16 kHz
(+) | máximos equilibrados - a sólo 2% de la mediana
(+) | los máximos son lineales (4.5% delta a la frecuencia anterior)
Total 100 - 16.000 Hz
(+) | el sonido global es lineal (10.2% de diferencia con la mediana)
En comparación con la misma clase
» 7% de todos los dispositivos probados de esta clase eran mejores, 2% similares, 91% peores
» El mejor tuvo un delta de 5%, la media fue 18%, el peor fue ###max##%
En comparación con todos los dispositivos probados
» 5% de todos los dispositivos probados eran mejores, 1% similares, 94% peores
» El mejor tuvo un delta de 4%, la media fue 24%, el peor fue ###max##%
| Off / Standby | |
| Ocioso | |
| Carga |
|
Clave:
min: | |
| Asus GL702VM-GC102D 6700HQ, GeForce GTX 1060 Mobile | HP Omen 17-w110ng 6700HQ, GeForce GTX 1070 Mobile | Gigabyte P57X v6 6700HQ, GeForce GTX 1070 Mobile | MSI GS73VR 6RF 6700HQ, GeForce GTX 1060 Mobile | Schenker XMG P507 6700HQ, GeForce GTX 1060 Mobile | |
|---|---|---|---|---|---|
| Power Consumption | -24% | -39% | -40% | 9% | |
| Idle Minimum * (Watt) | 15.6 | 19 -22% | 18.4 -18% | 22.6 -45% | 11 29% |
| Idle Average * (Watt) | 20.2 | 25 -24% | 22.8 -13% | 32.7 -62% | 16 21% |
| Idle Maximum * (Watt) | 21.4 | 31 -45% | 24 -12% | 32.8 -53% | 21 2% |
| Load Average * (Watt) | 90 | 90 -0% | 175.5 -95% | 114.7 -27% | 80 11% |
| Load Maximum * (Watt) | 147 | 193 -31% | 229.5 -56% | 167.9 -14% | 174 -18% |
* ... más pequeño es mejor
| Asus GL702VM-GC102D 6700HQ, GeForce GTX 1060 Mobile, 76 Wh | HP Omen 17-w110ng 6700HQ, GeForce GTX 1070 Mobile, 95 Wh | Gigabyte P57X v6 6700HQ, GeForce GTX 1070 Mobile, 75.81 Wh | MSI GS73VR 6RF 6700HQ, GeForce GTX 1060 Mobile, 65 Wh | Schenker XMG P507 6700HQ, GeForce GTX 1060 Mobile, 60 Wh | |
|---|---|---|---|---|---|
| Duración de Batería | 9% | 4% | -14% | 22% | |
| Reader / Idle (h) | 5.9 | 7.2 22% | 7 19% | 5.9 0% | 6.8 15% |
| H.264 (h) | 4.4 | 3.9 -11% | |||
| WiFi v1.3 (h) | 4.2 | 4.1 -2% | 3.4 -19% | 3.6 -14% | 4.6 10% |
| Load (h) | 1.5 | 1.9 27% | 1.7 13% | 1.1 -27% | 2.1 40% |
Pro
Contra
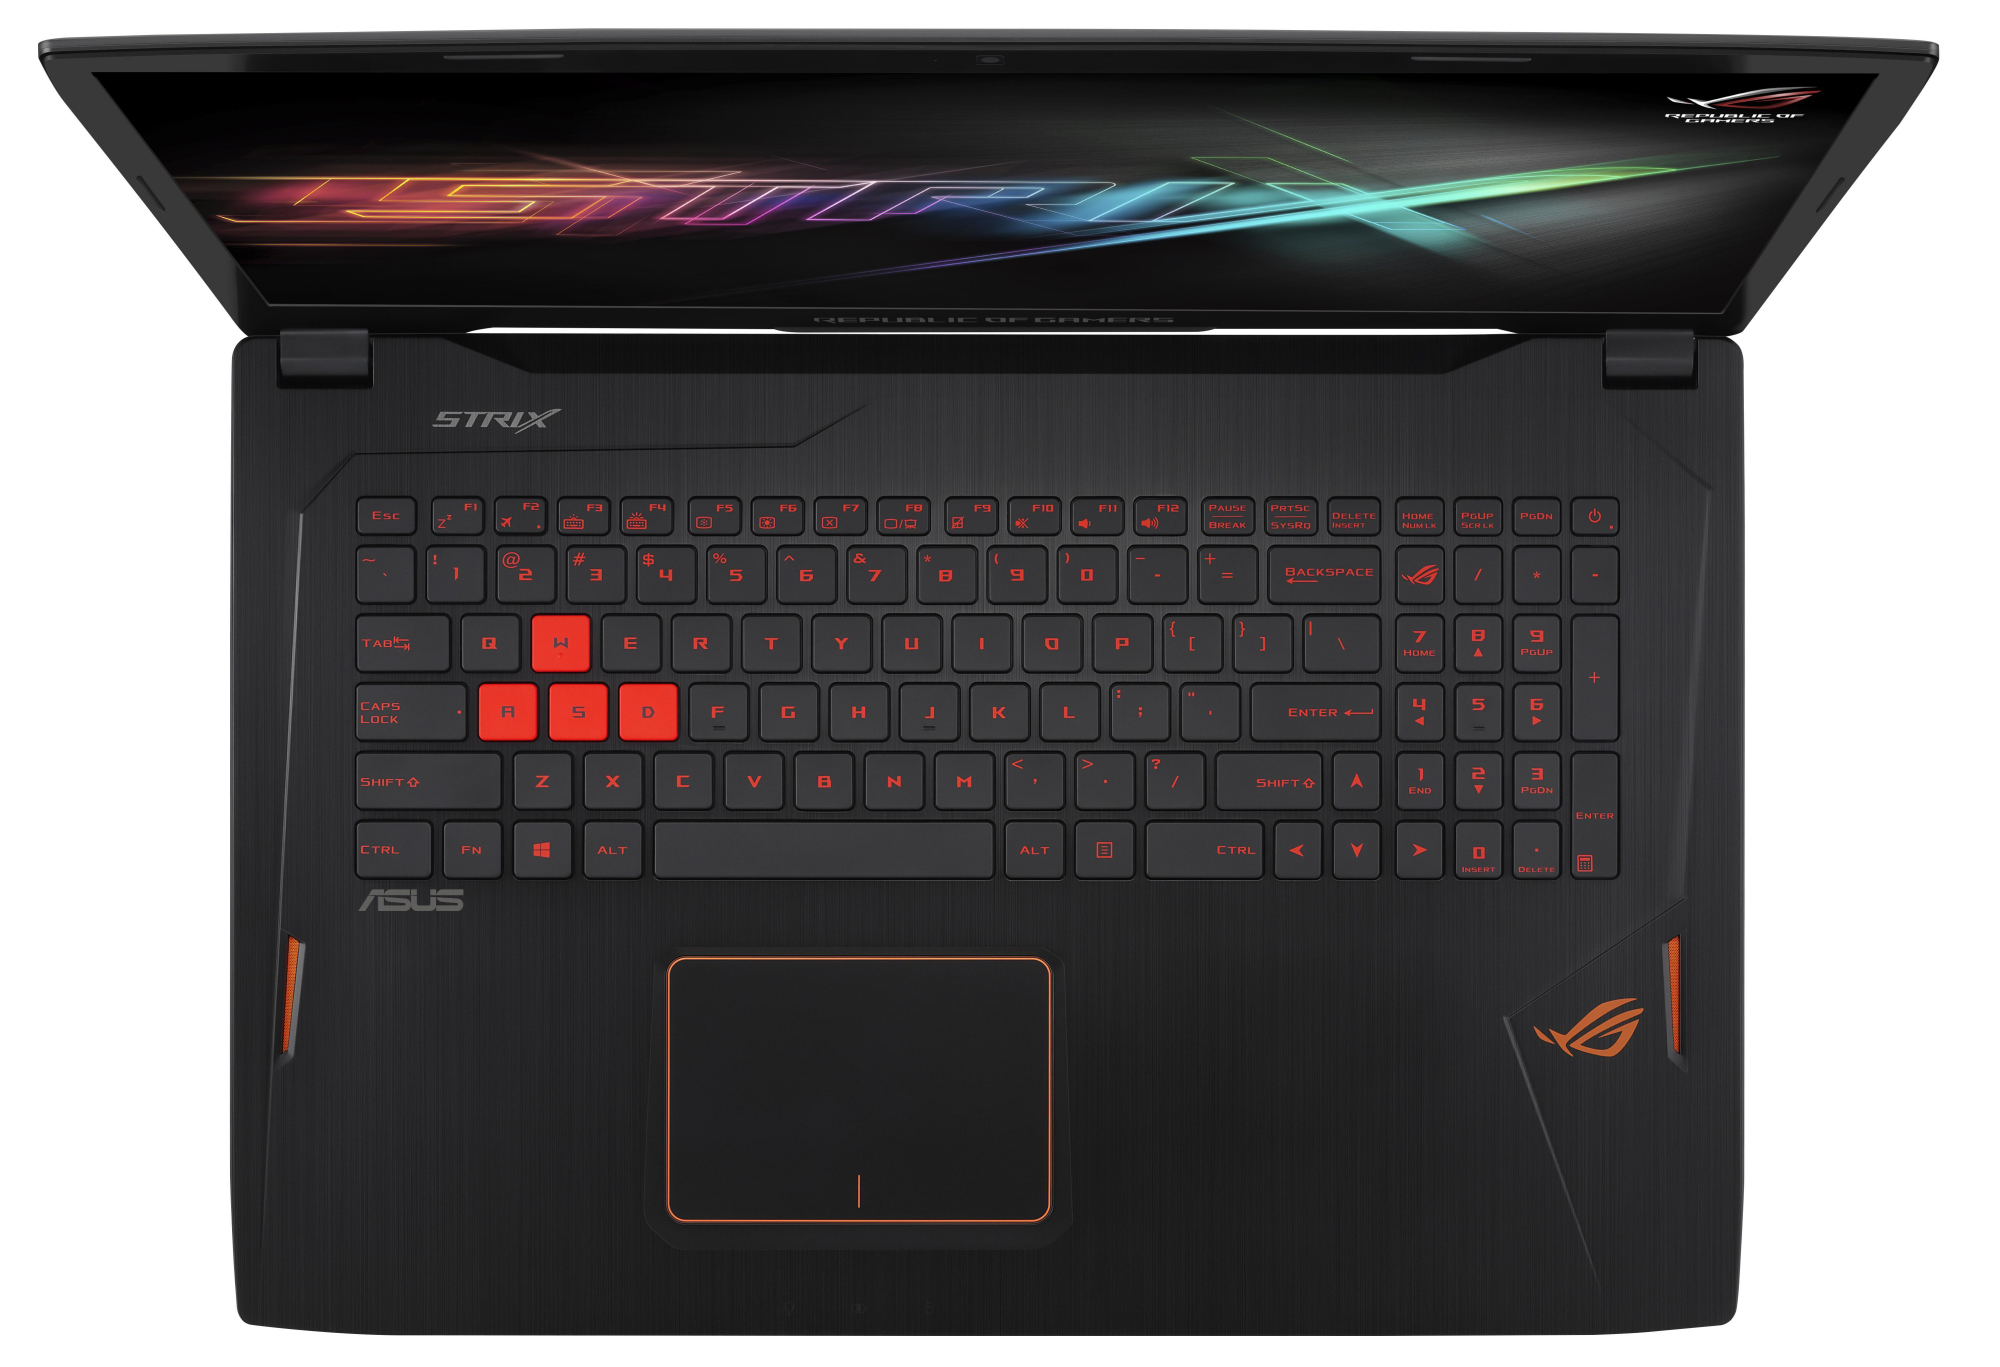
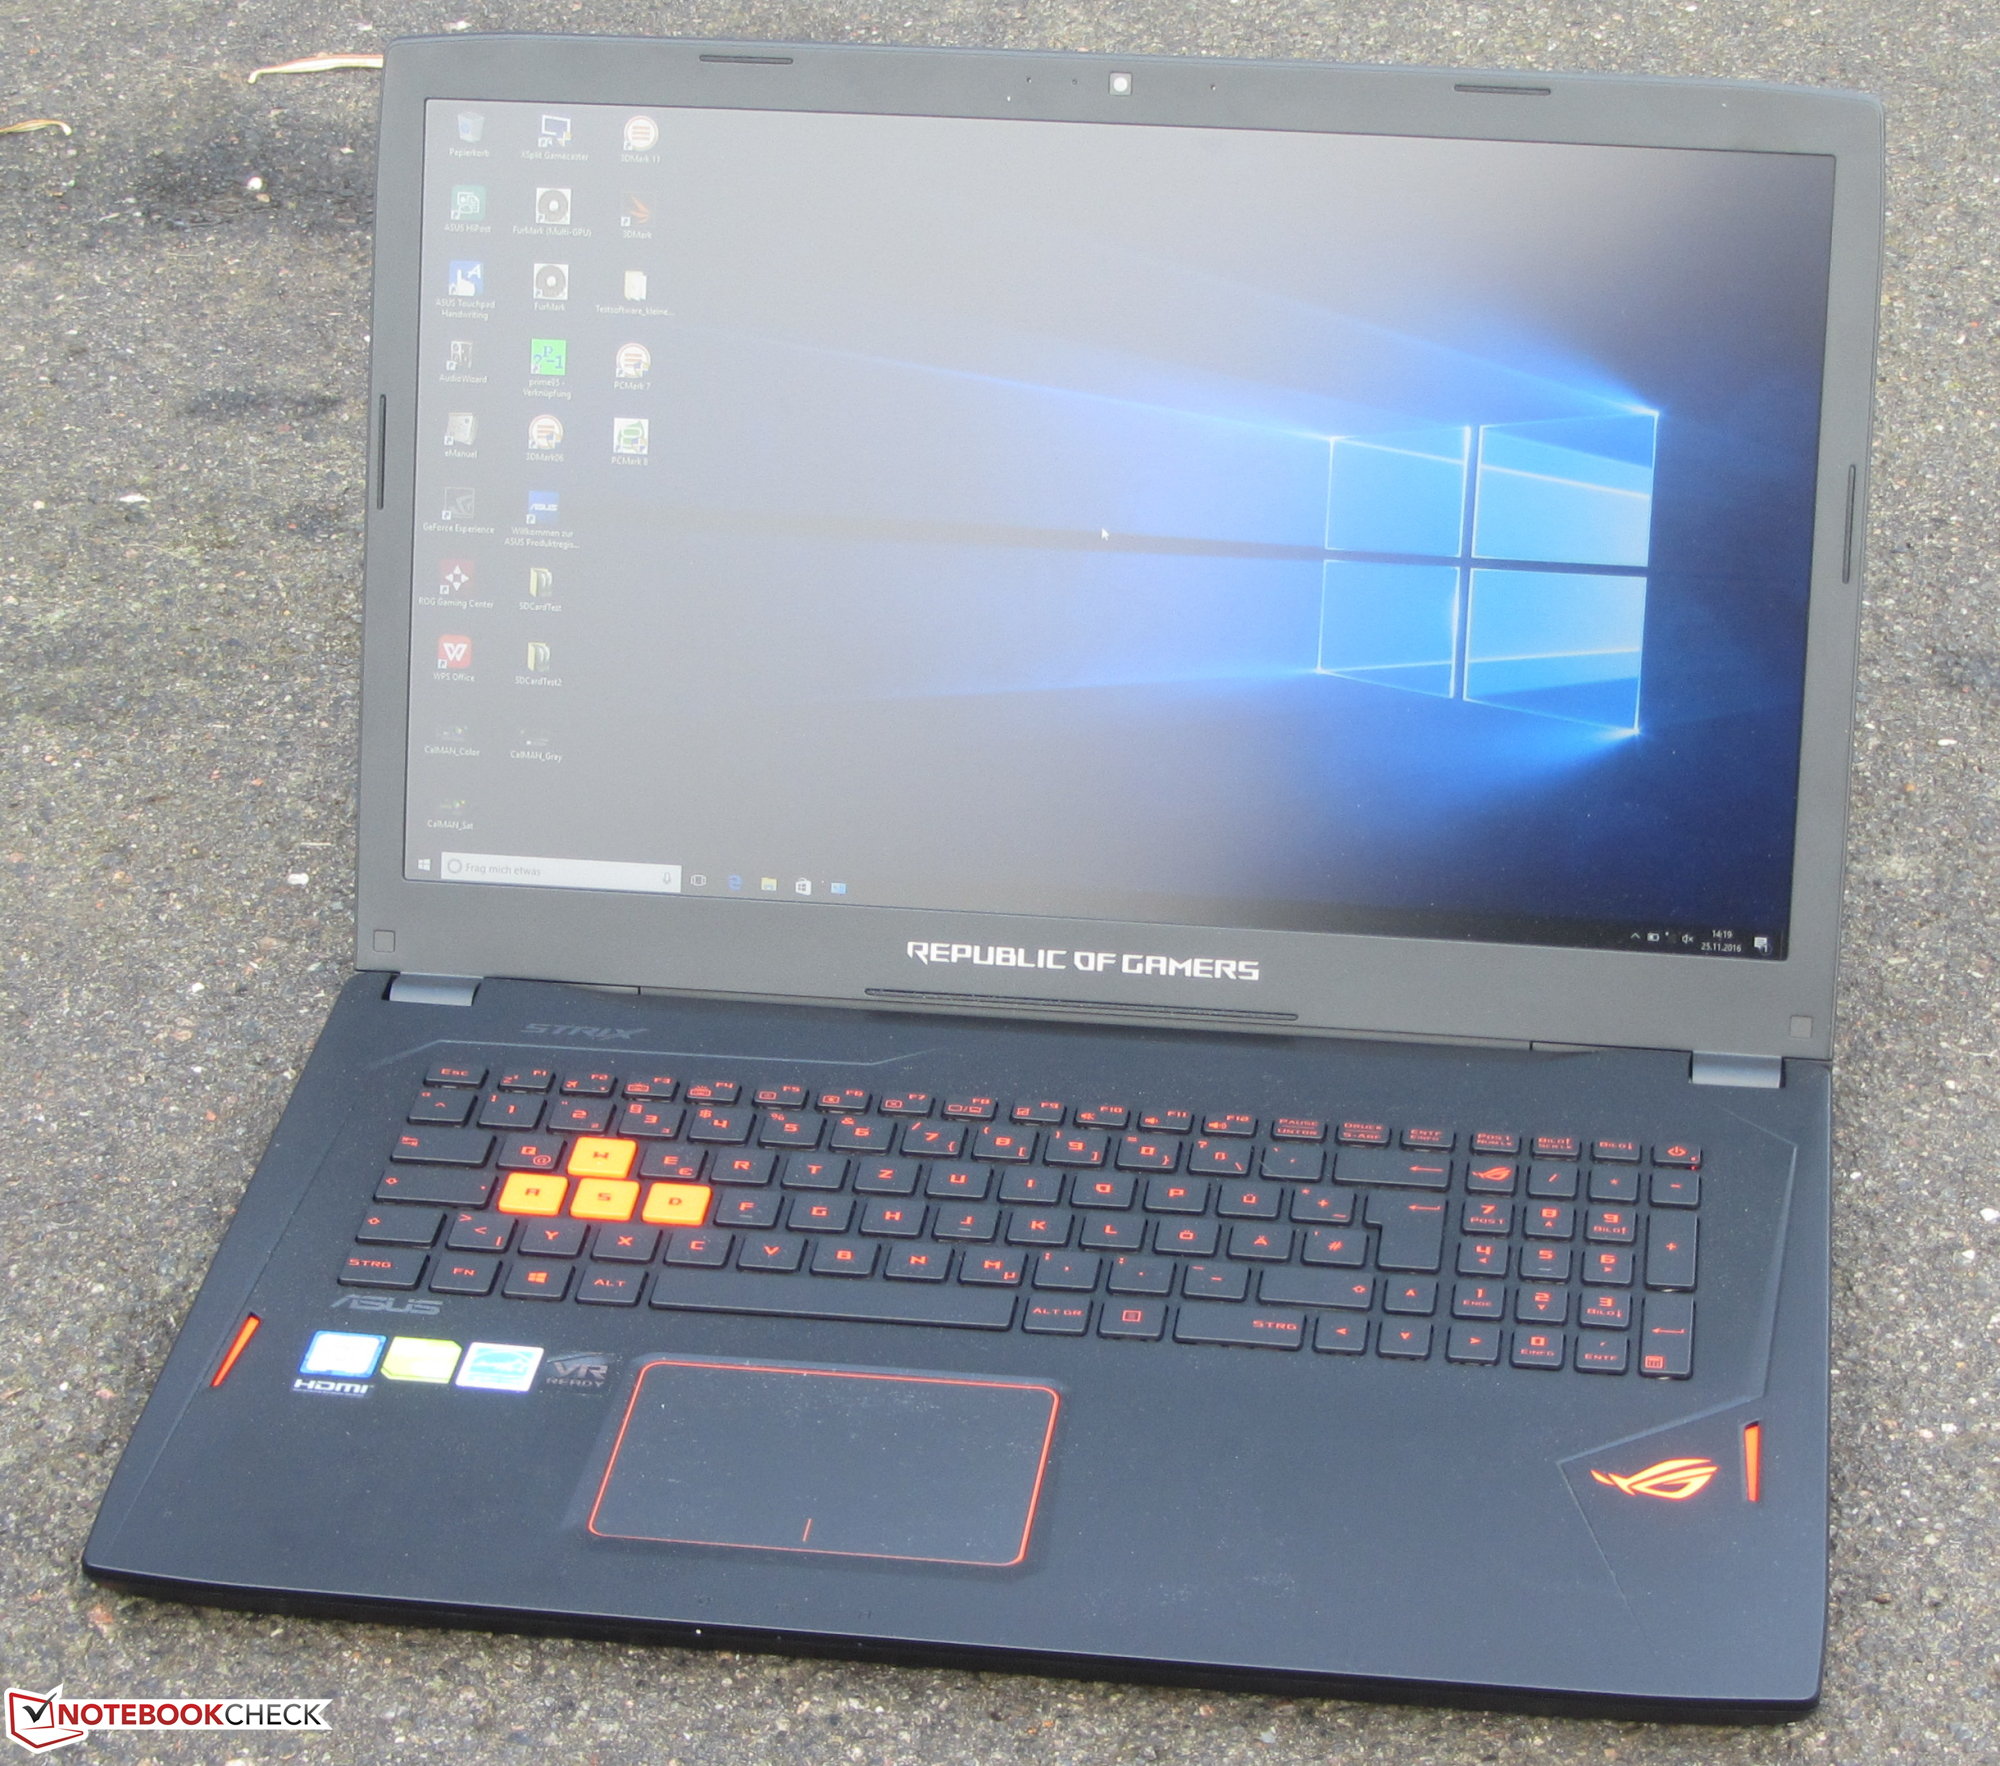
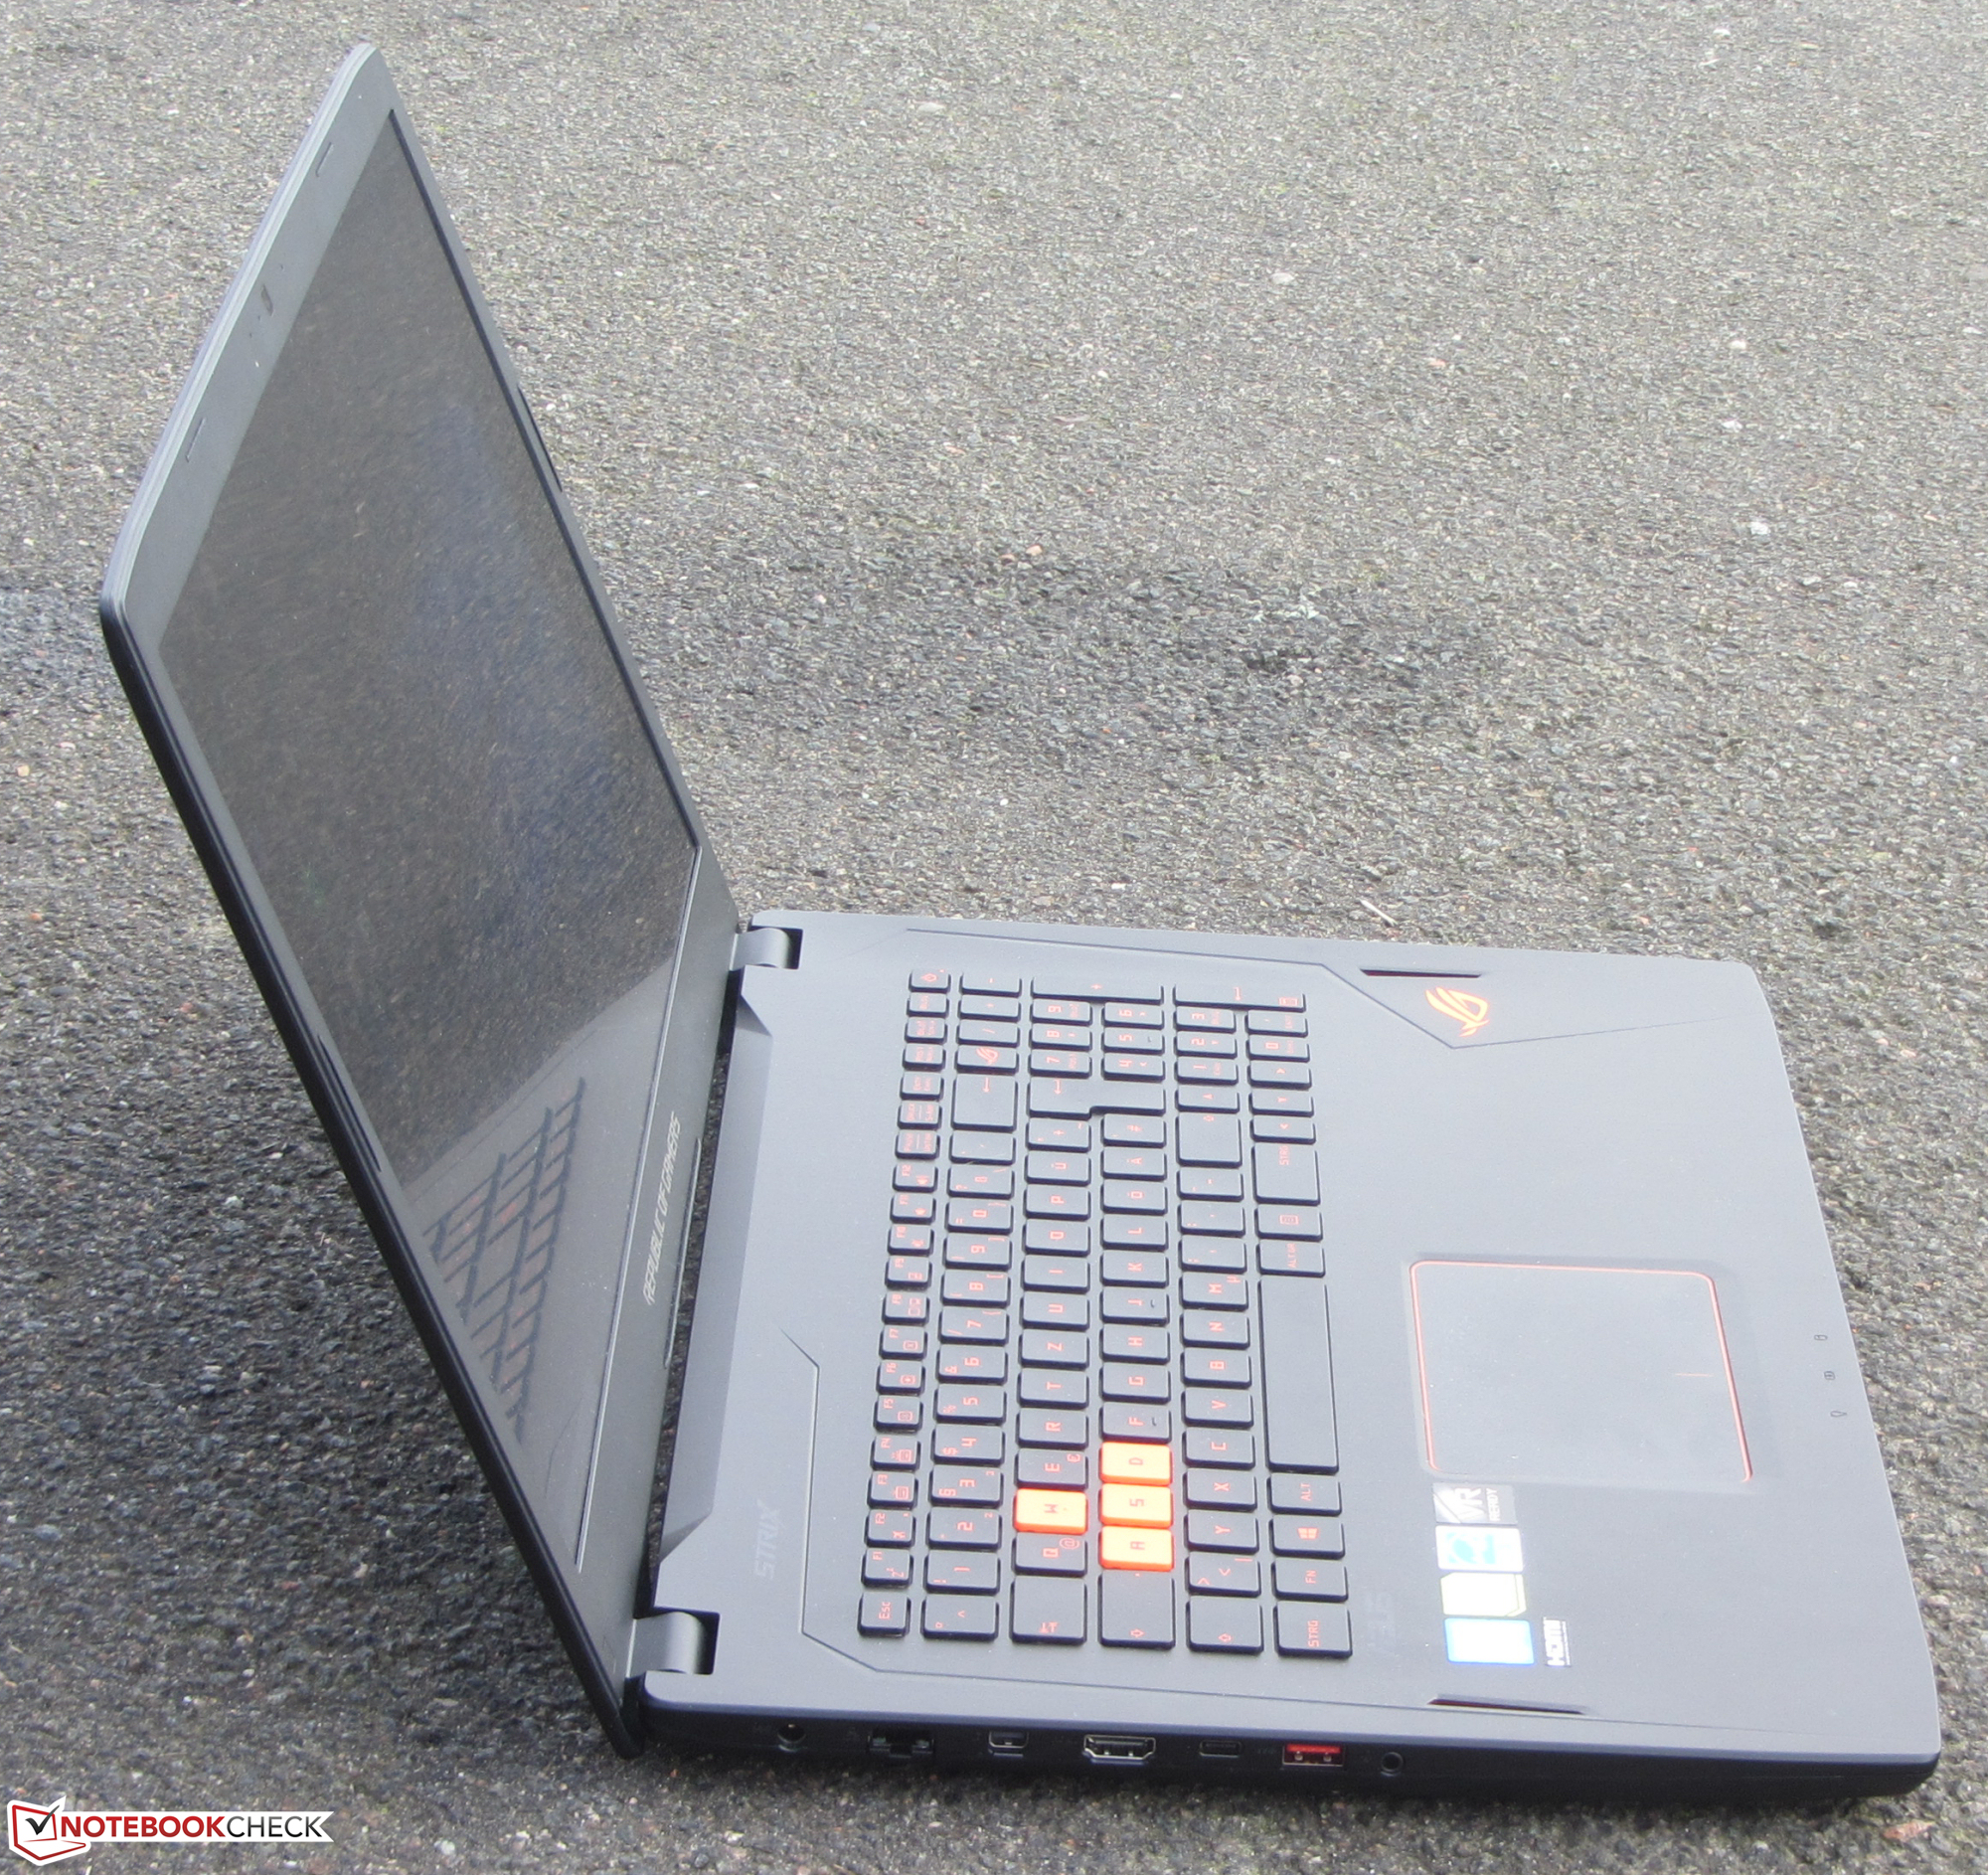
Con el GL702VM, Asus ofrece un portátil de juegos de 17.3 pulgadas bastante delgado. Pero no te dejes engañar por el exterior; el portátil esconde en su interior unos componentes muy potentes. Un Core i7 de cuatro núcleos y una gráfica GeForce GTX 1060 de Nvidia permiten ejecutar todos los juegos actuales en resolución Full HD con ajustes entre altos y máximos. La tecnología G-Sync de Nvidia se encarga de mostrar movimientos suaves. A pesar del potente hardware, la temperatura que se genera es bastante escasa. El ruido emitido por el portátil es también aceptable.
Con el GL702VM, Asus ha fabricado un portátil de 17.3 pulgadas muy adecuado para juegos.
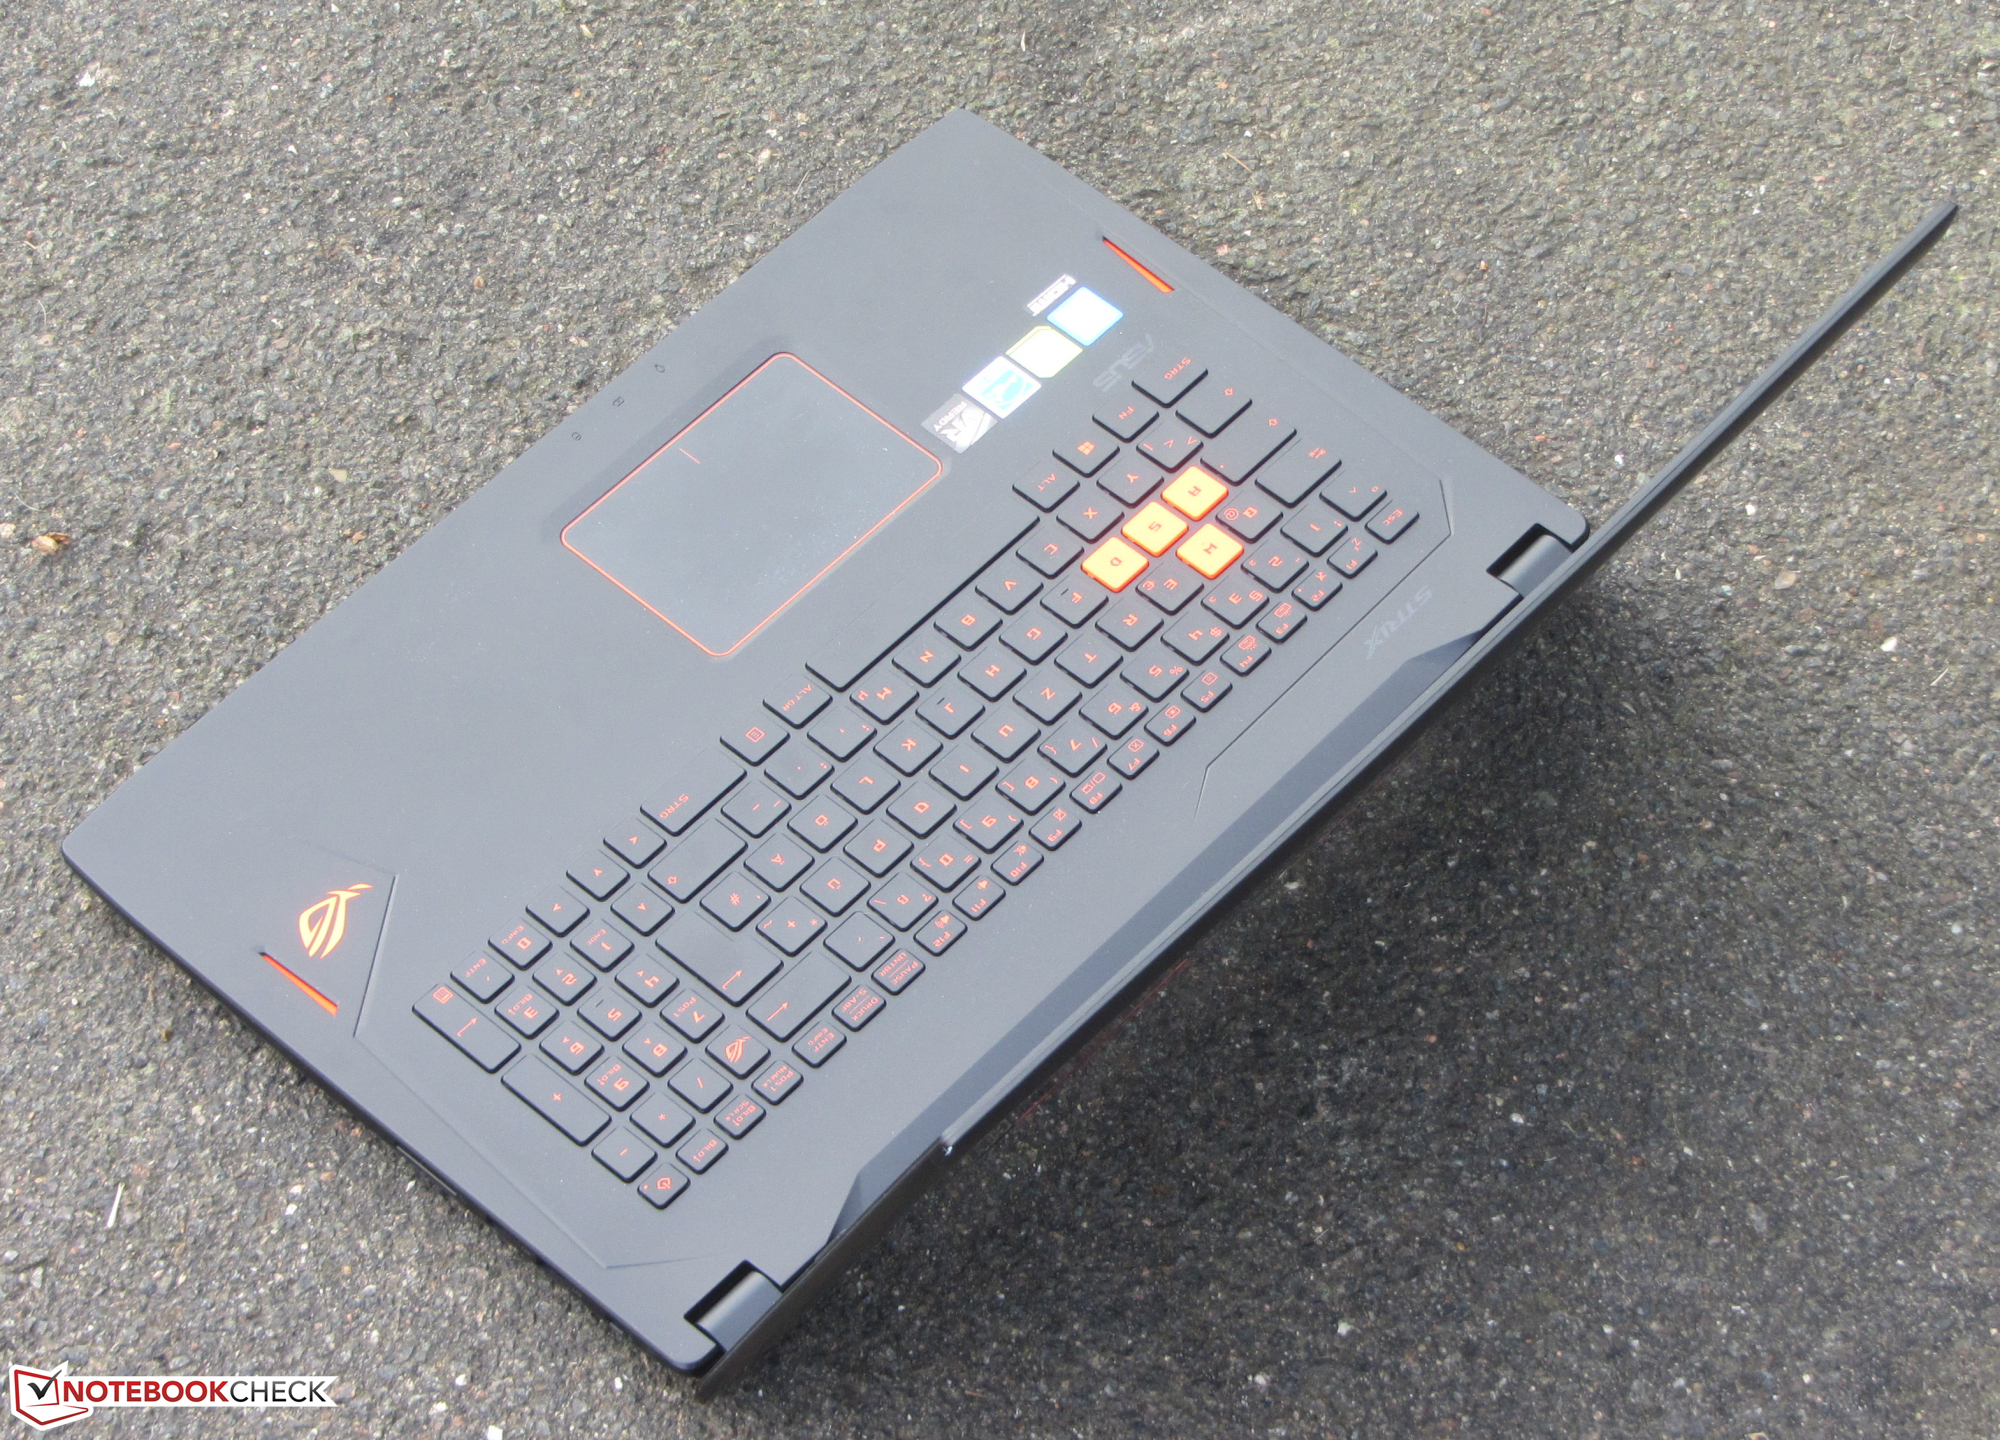
Gracias al disco duro de 1TB no nos quedaremos cortos de almacenamiento a pesar de que podríamos cambiarlo. Esto requiere extraer la parte inferior de la carcasa, lo que puede ser una buena oportunidad para equipar el portátil con un SSD a través de la ranura M.2 (SATA o NVMe). La pantalla IPS mate proporciona muy buenos ángulos de visualización y brillo suficiente. El contraste podría ser más alto. El teclado incluido satisface las demandas exigibles en un uso doméstico. No obstante si tecleas mucho deberías buscar otro modelo. Debido a que la GPU integrada está desactivada, el consumo en reposo es bastante alto. En consecuencia, la duración de batería es menor de la que debería ser. Sin embargo esto no supone un problema en dispositivos para juegos.
Ésta es una versión acortada del análisis original. Puedes leer el análisis completo en inglés aquí.
Asus GL702VM-GC102D
- 12/05/2016 v5.1 (old)
Sascha Mölck