 Deutsch
 English
 Español
 Français
 Italiano
 Nederlands
 Polski
 Português
 Русский
 Türkçe
 Svenska
 Chinese
 Magyar
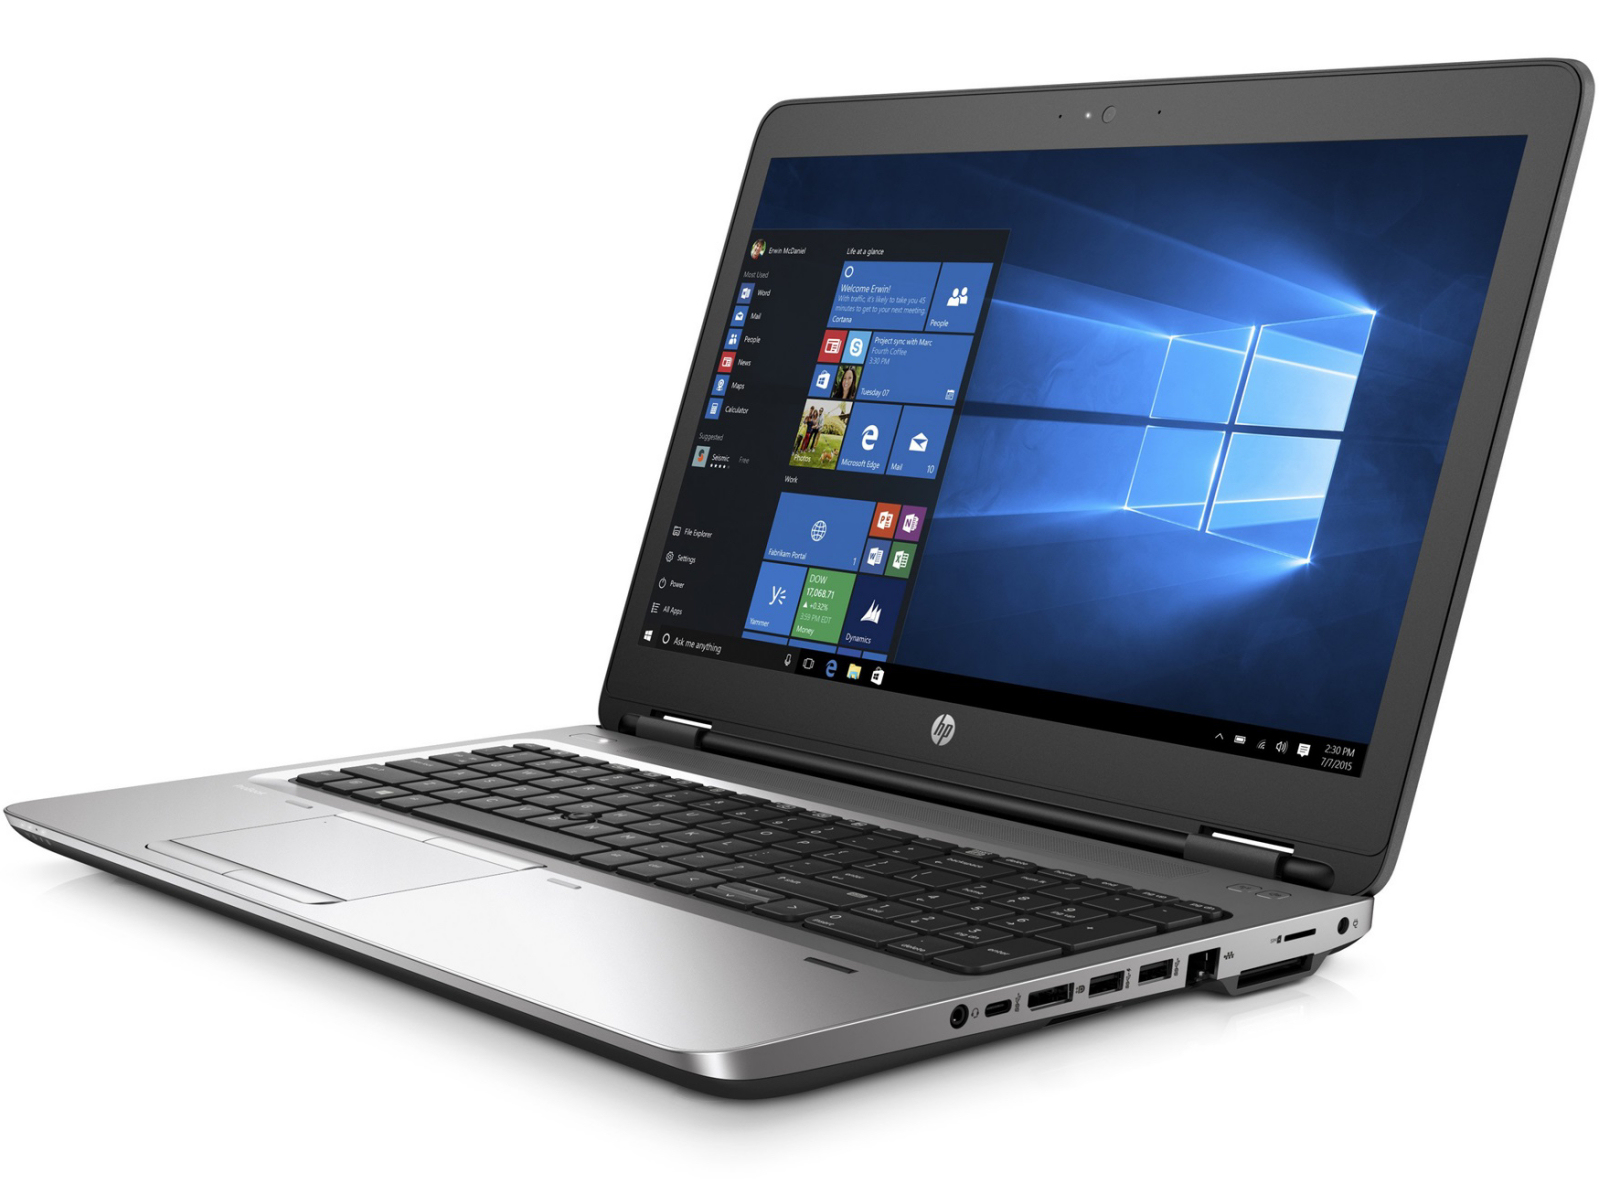
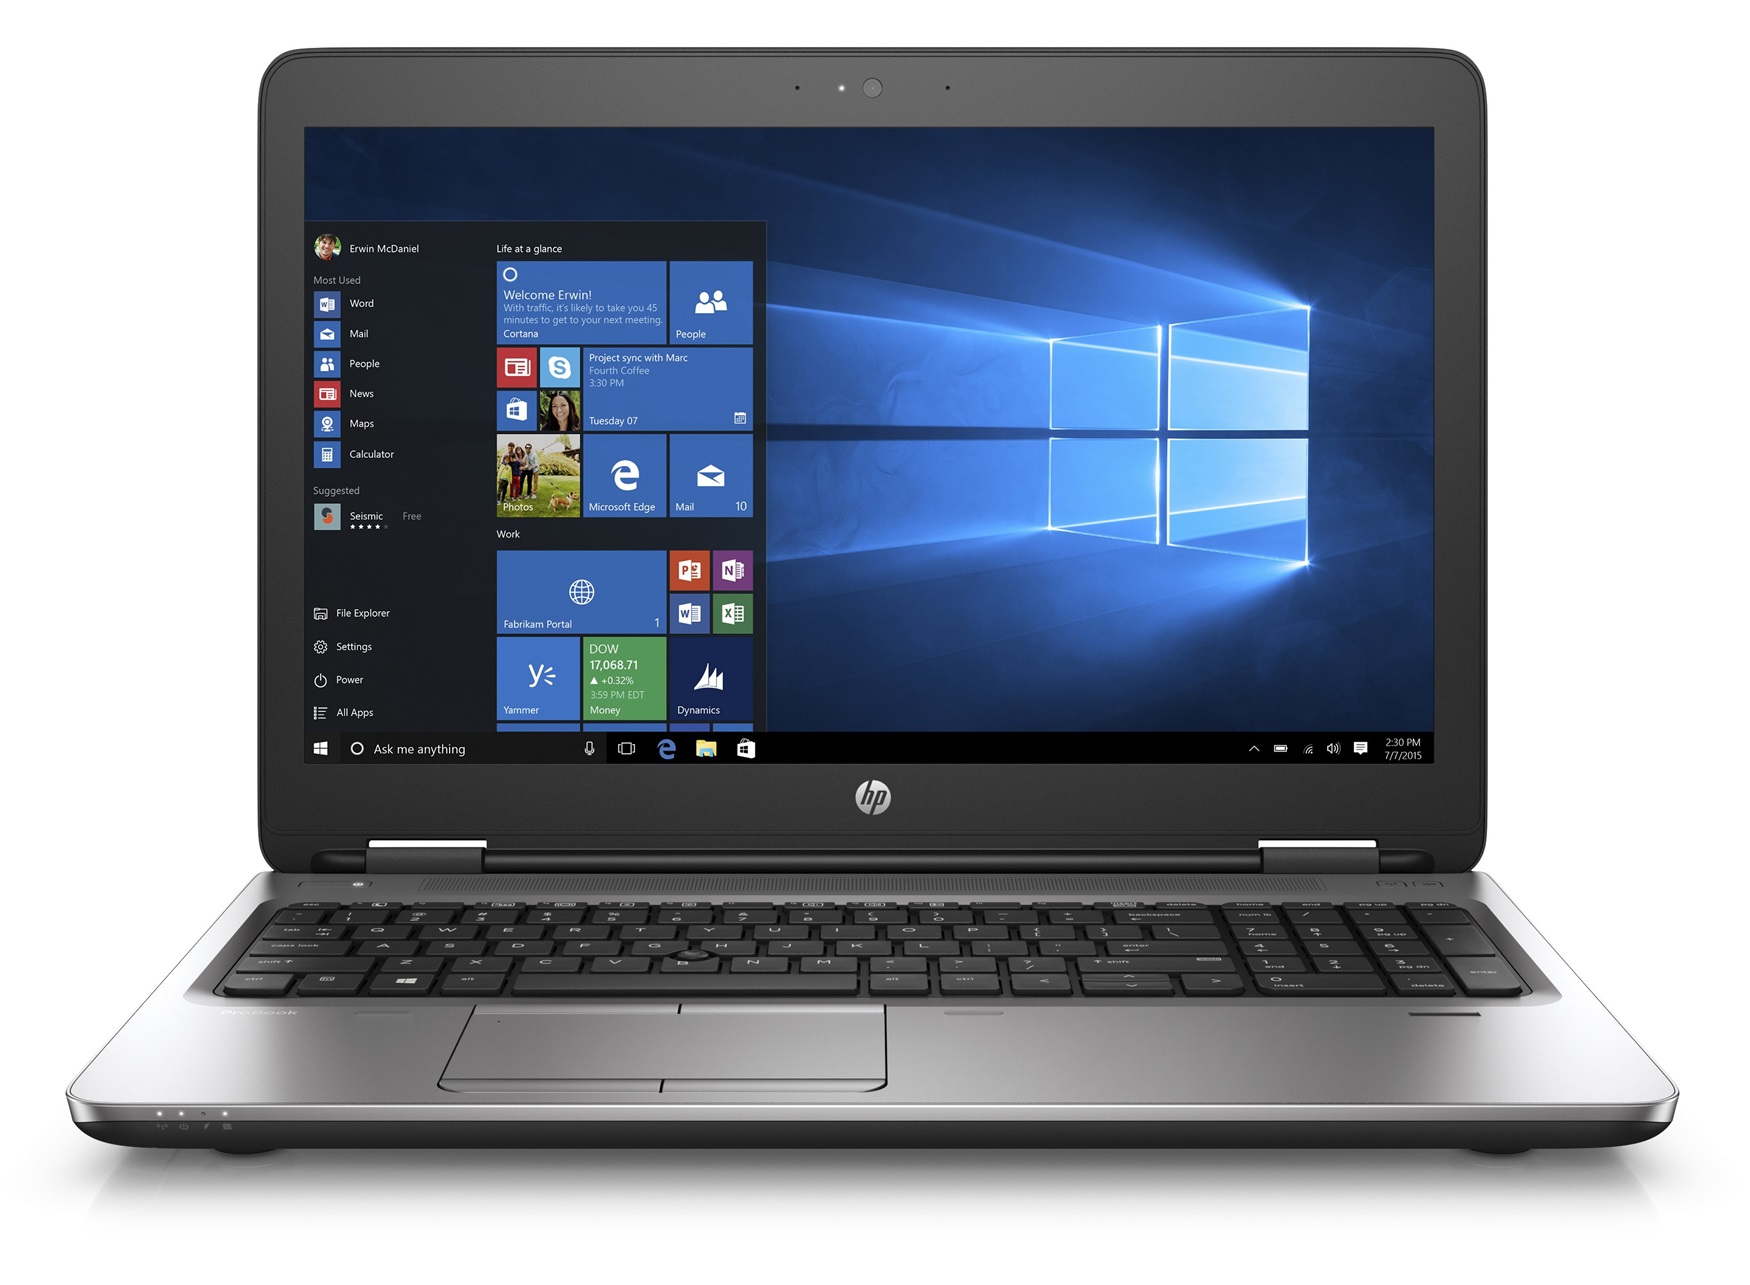
Breve análisis del HP ProBook 650 G2 Notebook (Full HD)
Connectivity
| SD Card Reader | |
| average JPG Copy Test (av. of 3 runs) | |
| Dell Latitude 15 E5570 | |
| Lenovo ThinkPad L560-20F10026GE | |
| Acer TravelMate P658-M-537B | |
| HP ProBook 650 G2-T9X61ET | |
| HP ProBook 650 G2 V1A44ET | |
| maximum AS SSD Seq Read Test (1GB) | |
| HP ProBook 650 G2-T9X61ET | |
| Lenovo ThinkPad L560-20F10026GE | |
| Networking | |
| iperf Server (receive) TCP 1 m | |
| HP ProBook 650 G2 V1A44ET (jseb) | |
| Dell Latitude 15 E5570 | |
| iperf Client (transmit) TCP 1 m | |
| HP ProBook 650 G2 V1A44ET (jseb) | |
| Dell Latitude 15 E5570 | |
| |||||||||||||||||||||||||
iluminación: 90 %
Brillo con batería: 313 cd/m²
Contraste: 531:1 (Negro: 0.59 cd/m²)
ΔE Color 11.89 | 0.5-29.43 Ø5
ΔE Greyscale 12.95 | 0.57-98 Ø5.3
78% sRGB (Argyll 1.6.3 3D)
50% AdobeRGB 1998 (Argyll 1.6.3 3D)
53.7% AdobeRGB 1998 (Argyll 2.2.0 3D)
78.3% sRGB (Argyll 2.2.0 3D)
52.1% Display P3 (Argyll 2.2.0 3D)
Gamma: 2.4
| HP ProBook 650 G2 V1A44ET TN LED, 1920x1080 | HP ProBook 650 G2-T9X61ET TN LED, 1366x768 | Acer TravelMate P658-M-537B IPS, 1920x1080 | Dell Latitude 15 E5570 TN LED, 1366x768 | Lenovo ThinkPad L560-20F10026GE AH-IPS, 1920x1080 | |
|---|---|---|---|---|---|
| Display | -20% | 18% | -22% | -25% | |
| Display P3 Coverage | 52.1 | 41.59 -20% | 66.6 28% | 40.48 -22% | 39 -25% |
| sRGB Coverage | 78.3 | 62.3 -20% | 85.7 9% | 60.9 -22% | 58.3 -26% |
| AdobeRGB 1998 Coverage | 53.7 | 43 -20% | 62.8 17% | 41.82 -22% | 40.33 -25% |
| Response Times | -6% | 7% | -8% | 0% | |
| Response Time Grey 50% / Grey 80% * | 41 ? | 40.4 ? 1% | 38 ? 7% | 47 ? -15% | 39.2 ? 4% |
| Response Time Black / White * | 27 ? | 32 ? -19% | 25 ? 7% | 27 ? -0% | 28 ? -4% |
| PWM Frequency | 200 ? | 200 ? 0% | |||
| Screen | -5% | 19% | -5% | 12% | |
| Brightness middle | 313 | 247 -21% | 308 -2% | 228 -27% | 262 -16% |
| Brightness | 296 | 223 -25% | 319 8% | 236 -20% | 250 -16% |
| Brightness Distribution | 90 | 85 -6% | 71 -21% | 90 0% | 92 2% |
| Black Level * | 0.59 | 0.61 -3% | 0.61 -3% | 0.56 5% | 0.29 51% |
| Contrast | 531 | 405 -24% | 505 -5% | 407 -23% | 903 70% |
| Colorchecker dE 2000 * | 11.89 | 8.8 26% | 4.51 62% | 10.02 16% | 8.49 29% |
| Colorchecker dE 2000 max. * | 20.81 | 15.98 23% | 10.19 51% | 15.93 23% | 17.99 14% |
| Greyscale dE 2000 * | 12.95 | 10.13 22% | 2.91 78% | 10.66 18% | 8.11 37% |
| Gamma | 2.4 92% | 2.34 94% | 2.4 92% | 2.48 89% | 2.37 93% |
| CCT | 15063 43% | 12581 52% | 6740 96% | 11800 55% | 6300 103% |
| Color Space (Percent of AdobeRGB 1998) | 50 | 39.6 -21% | 56 12% | 39 -22% | 37.07 -26% |
| Color Space (Percent of sRGB) | 78 | 62.2 -20% | 86 10% | 61 -22% | 57.94 -26% |
| Media total (Programa/Opciones) | -10% /
-8% | 15% /
17% | -12% /
-9% | -4% /
3% |
* ... más pequeño es mejor
Parpadeo de Pantalla / PWM (Pulse-Width Modulation)
| Parpadeo de Pantalla / PWM detectado | 200 Hz | ≤ 90 % de brillo | 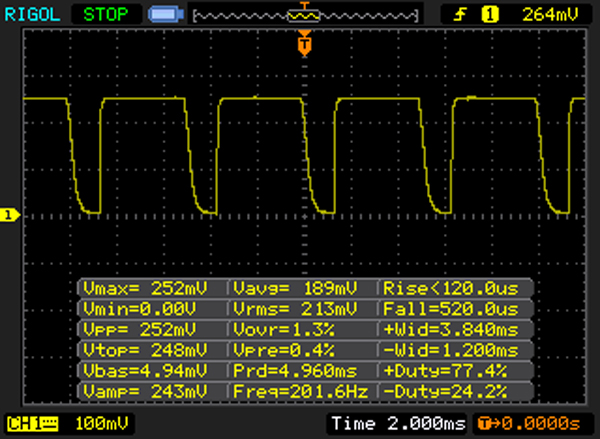 |
La retroiluminación del display parpadea a 200 Hz (seguramente usa PWM - Pulse-Width Modulation) a un brillo del 90 % e inferior. Sobre este nivel de brillo no debería darse parpadeo / PWM. La frecuencia de 200 Hz es relativamente baja, por lo que la gente sensible debería ver parpadeos y padecer fatiga visual por la pantalla (usado al brillo indicado a continuación). Comparación: 53 % de todos los dispositivos testados no usaron PWM para atenuar el display. Si se usó, medimos una media de 17900 (mínimo: 5 - máxmo: 3846000) Hz. | |||
Tiempos de respuesta del display
| ↔ Tiempo de respuesta de Negro a Blanco | ||
|---|---|---|
| 27 ms ... subida ↗ y bajada ↘ combinada | ↗ 10 ms subida | 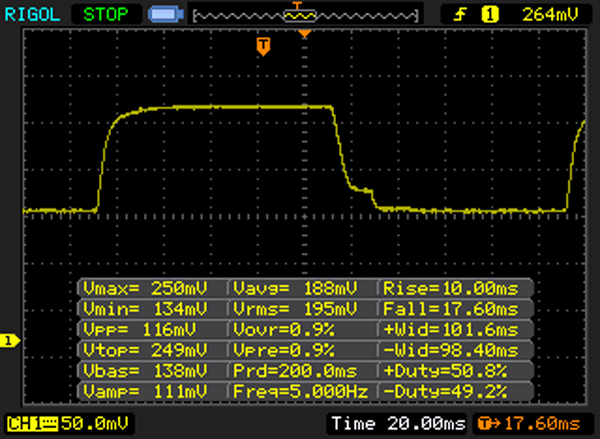 |
| ↘ 17 ms bajada | ||
| La pantalla mostró tiempos de respuesta relativamente lentos en nuestros tests pero podría ser demasiado lenta para los jugones. En comparación, todos los dispositivos de prueba van de ##min### (mínimo) a 240 (máximo) ms. » 63 % de todos los dispositivos son mejores. Eso quiere decir que el tiempo de respuesta es peor que la media (21.5 ms) de todos los dispositivos testados. | ||
| ↔ Tiempo de respuesta 50% Gris a 80% Gris | ||
| 41 ms ... subida ↗ y bajada ↘ combinada | ↗ 23 ms subida | 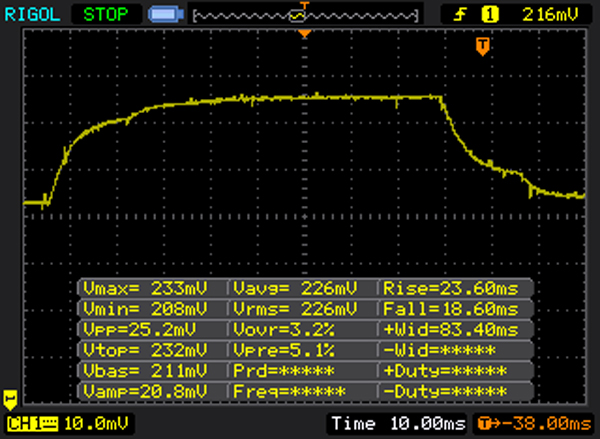 |
| ↘ 18 ms bajada | ||
| La pantalla mostró tiempos de respuesta lentos en nuestros tests y podría ser demasiado lenta para los jugones. En comparación, todos los dispositivos de prueba van de ##min### (mínimo) a 636 (máximo) ms. » 60 % de todos los dispositivos son mejores. Eso quiere decir que el tiempo de respuesta es peor que la media (33.7 ms) de todos los dispositivos testados. | ||
| Cinebench R15 | |
| CPU Single 64Bit | |
| Dell Latitude 15 E5570 | |
| Lenovo ThinkPad L560-20F10026GE | |
| HP ProBook 650 G2 V1A44ET | |
| HP ProBook 650 G2-T9X61ET | |
| Acer TravelMate P658-M-537B | |
| CPU Multi 64Bit | |
| Dell Latitude 15 E5570 | |
| HP ProBook 650 G2 V1A44ET | |
| Lenovo ThinkPad L560-20F10026GE | |
| HP ProBook 650 G2-T9X61ET | |
| Acer TravelMate P658-M-537B | |
| Geekbench 3 | |
| 32 Bit Single-Core Score | |
| Dell Latitude 15 E5570 | |
| HP ProBook 650 G2 V1A44ET | |
| 32 Bit Multi-Core Score | |
| Dell Latitude 15 E5570 | |
| HP ProBook 650 G2 V1A44ET | |
| JetStream 1.1 - Total Score | |
| HP ProBook 650 G2-T9X61ET | |
| Dell Latitude 15 E5570 | |
| HP ProBook 650 G2 V1A44ET | |
| Lenovo ThinkPad L560-20F10026GE | |
| PCMark 8 Home Score Accelerated v2 | 3234 puntos | |
ayuda | ||
| PCMark 8 - Home Score Accelerated v2 | |
| Acer TravelMate P658-M-537B | |
| Dell Latitude 15 E5570 | |
| HP ProBook 650 G2 V1A44ET | |
| HP ProBook 650 G2-T9X61ET | |
| Lenovo ThinkPad L560-20F10026GE | |

| HP ProBook 650 G2 V1A44ET Sandisk X300 SD7SN6S-256G-1006 | HP ProBook 650 G2-T9X61ET Hitachi Travelstar Z7K500 HTS725050A7E630 | Acer TravelMate P658-M-537B Kingston RBU-SNS8152S3256GG2 | Dell Latitude 15 E5570 Samsung SSD PM871 MZ7LN128HCHP | Lenovo ThinkPad L560-20F10026GE WDC Slim WD10SPCX-21KHST0 | |
|---|---|---|---|---|---|
| CrystalDiskMark 3.0 | -90% | -1% | -13% | -89% | |
| Read Seq | 475 | 109.6 -77% | 479.1 1% | 474.7 0% | 113.6 -76% |
| Write Seq | 435 | 109.1 -75% | 333.1 -23% | 155 -64% | 111.7 -74% |
| Read 512 | 280.4 | 30.66 -89% | 418 49% | 393.6 40% | 39.65 -86% |
| Write 512 | 265.5 | 45.71 -83% | 320.5 21% | 119.7 -55% | 55.3 -79% |
| Read 4k | 32.71 | 0.351 -99% | 25.66 -22% | 34 4% | 0.488 -99% |
| Write 4k | 98.7 | 0.798 -99% | 64.7 -34% | 96.6 -2% | 1.022 -99% |
| Read 4k QD32 | 347.2 | 0.656 -100% | 226.2 -35% | 383.3 10% | 1.367 -100% |
| Write 4k QD32 | 154.1 | 0.787 -99% | 211.4 37% | 100.2 -35% | 1.036 -99% |
| 3DMark 11 Performance | 1344 puntos | |
ayuda | ||
| 3DMark 11 - 1280x720 Performance GPU | |
| Acer TravelMate P658-M-537B | |
| HP ProBook 650 G2-T9X61ET | |
| Dell Latitude 15 E5570 | |
| Lenovo ThinkPad L560-20F10026GE | |
| HP ProBook 650 G2 V1A44ET | |
| bajo | medio | alto | ultra | |
| BioShock Infinite (2013) | 38.3 | 21.7 | 17.9 |
Ruido
| Ocioso |
| 30.5 / 31.6 / 31.9 dB(A) |
| Carga |
| 34.7 / 34.5 dB(A) |
 | ||
30 dB silencioso 40 dB(A) audible 50 dB(A) ruidosamente alto |
||
min: | ||
(+) The maximum temperature on the upper side is 39.6 °C / 103 F, compared to the average of 34.2 °C / 94 F, ranging from 21.2 to 62.5 °C for the class Office.
(±) The bottom heats up to a maximum of 41.8 °C / 107 F, compared to the average of 36.7 °C / 98 F
(+) In idle usage, the average temperature for the upper side is 26.4 °C / 80 F, compared to the device average of 29.5 °C / 85 F.
(+) The palmrests and touchpad are cooler than skin temperature with a maximum of 29.7 °C / 85.5 F and are therefore cool to the touch.
(±) The average temperature of the palmrest area of similar devices was 27.7 °C / 81.9 F (-2 °C / -3.6 F).
HP ProBook 650 G2 V1A44ET audio analysis
(±) | speaker loudness is average but good (72 dB)
Bass 100 - 315 Hz
(-) | nearly no bass - on average 36.7% lower than median
(±) | linearity of bass is average (7.4% delta to prev. frequency)
Mids 400 - 2000 Hz
(±) | reduced mids - on average 6.7% lower than median
(±) | linearity of mids is average (11.4% delta to prev. frequency)
Highs 2 - 16 kHz
(+) | balanced highs - only 2.6% away from median
(+) | highs are linear (4.7% delta to prev. frequency)
Overall 100 - 16.000 Hz
(±) | linearity of overall sound is average (26.4% difference to median)
Compared to same class
» 79% of all tested devices in this class were better, 7% similar, 14% worse
» The best had a delta of 7%, average was 22%, worst was 53%
Compared to all devices tested
» 78% of all tested devices were better, 4% similar, 18% worse
» The best had a delta of 4%, average was 25%, worst was 134%
Apple MacBook 12 (Early 2016) 1.1 GHz audio analysis
(+) | speakers can play relatively loud (83.6 dB)
Bass 100 - 315 Hz
(±) | reduced bass - on average 11.3% lower than median
(±) | linearity of bass is average (14.2% delta to prev. frequency)
Mids 400 - 2000 Hz
(+) | balanced mids - only 2.4% away from median
(+) | mids are linear (5.5% delta to prev. frequency)
Highs 2 - 16 kHz
(+) | balanced highs - only 2% away from median
(+) | highs are linear (4.5% delta to prev. frequency)
Overall 100 - 16.000 Hz
(+) | overall sound is linear (10.2% difference to median)
Compared to same class
» 5% of all tested devices in this class were better, 2% similar, 93% worse
» The best had a delta of 5%, average was 19%, worst was 53%
Compared to all devices tested
» 3% of all tested devices were better, 1% similar, 96% worse
» The best had a delta of 4%, average was 25%, worst was 134%
| Off / Standby | |
| Ocioso | |
| Carga |
|
| Battery Runtime - WiFi Websurfing | |
| Dell Latitude 15 E5570 | |
| Acer TravelMate P658-M-537B | |
| HP ProBook 650 G2 V1A44ET | |
| HP ProBook 650 G2-T9X61ET | |
| Lenovo ThinkPad L560-20F10026GE | |
Pro
Contra
HP ofrece un portátil business de gama media con el Probook 650 G2. Tiene bastante potencia de cálculo para todos los escenarios de uso comunes. El portátil siempre funciona quedo y apenas se calienta. Un veloz SSD resulta en un sistema veloz. Se puede cambiar el sSD tras retirar la bandeja base del portátil. Esto es bastante fácil de hacer. El teclado instalado es agradable aunque no tiene iluminación. Debería venir como estándar en un dispositivo como el Probook. El aguante de batería está bien.
HP pone en cuestión la existencia misma de esta serie con el Probook 650 G2 ya que la diferencia de precios con la línea Probook 450 más barata es baja. Esperábamos más en total del Probook 650.
No podemos decir mucho bueno sobre el panel FHD instalado. Su contraste es bajo, depende del ángulo de visión, muestra una mala reproducción de color, y ofrece poca cobertura del espacio de color. No es adecuado instalar tal pantalla. Contradice el espíritu de la serie Probook 650 y, además, es completamente inapropiado a la vista del precio del portátil.
Ésta es una versión acortada del análisis original. Puedes leer el análisis completo en inglés aquí.
HP ProBook 650 G2 V1A44ET
-
10/02/2016 v5.1(old)
Sascha Mölck