Breve análisis del Lenovo ThinkPad L560 (Core i5, HDD)
| |||||||||||||||||||||||||
iluminación: 92 %
Brillo con batería: 261 cd/m²
Contraste: 903:1 (Negro: 0.29 cd/m²)
ΔE ColorChecker Calman: 8.49 | ∀{0.5-29.43 Ø4.72}
ΔE Greyscale Calman: 8.11 | ∀{0.09-98 Ø4.97}
57.94% sRGB (Argyll 1.6.3 3D)
37.07% AdobeRGB 1998 (Argyll 1.6.3 3D)
40.33% AdobeRGB 1998 (Argyll 3D)
58.3% sRGB (Argyll 3D)
39% Display P3 (Argyll 3D)
Gamma: 2.37
CCT: 6300 K
| Lenovo ThinkPad L560-20F10026GE 1920x1080, AH-IPS | Lenovo ThinkPad L540 20AV002YGE 1920x1080, TN LED | Lenovo ThinkPad L460-20FVS01400 1920x1080, IPS | Lenovo ThinkPad E550-20DF00CNGE 1920x1080, TN-Panel | HP ProBook 450 G3 1920x1080, TN LED | Dell Inspiron 15-5558 1920x1080, IPS | |
|---|---|---|---|---|---|---|
| Display | 35% | 8% | 2% | -2% | 6% | |
| Display P3 Coverage (%) | 39 | 53.5 37% | 42.2 8% | 39.84 2% | 38.1 -2% | 41.22 6% |
| sRGB Coverage (%) | 58.3 | 76.7 32% | 62.3 7% | 59.3 2% | 57.3 -2% | 61.8 6% |
| AdobeRGB 1998 Coverage (%) | 40.33 | 54.8 36% | 43.72 8% | 41.2 2% | 39.37 -2% | 42.58 6% |
| Response Times | -10% | -3% | ||||
| Response Time Grey 50% / Grey 80% * (ms) | 39.2 ? | 44.4 ? -13% | 41.2 ? -5% | |||
| Response Time Black / White * (ms) | 28 ? | 29.6 ? -6% | 28 ? -0% | |||
| PWM Frequency (Hz) | ||||||
| Screen | -29% | 6% | -22% | -18% | -1% | |
| Brightness middle (cd/m²) | 262 | 303 16% | 245 -6% | 195 -26% | 211 -19% | 177 -32% |
| Brightness (cd/m²) | 250 | 290 16% | 225 -10% | 188 -25% | 214 -14% | 176 -30% |
| Brightness Distribution (%) | 92 | 85 -8% | 83 -10% | 90 -2% | 91 -1% | 78 -15% |
| Black Level * (cd/m²) | 0.29 | 0.7 -141% | 0.24 17% | 0.46 -59% | 0.43 -48% | 0.15 48% |
| Contrast (:1) | 903 | 433 -52% | 1021 13% | 424 -53% | 491 -46% | 1180 31% |
| Colorchecker dE 2000 * | 8.49 | 11.58 -36% | 6.89 19% | 9.92 -17% | 9.25 -9% | 8.52 -0% |
| Colorchecker dE 2000 max. * | 17.99 | 17.62 2% | ||||
| Greyscale dE 2000 * | 8.11 | 13.65 -68% | 6.45 20% | 10.06 -24% | 9.83 -21% | 9.72 -20% |
| Gamma | 2.37 93% | 2.59 85% | 2.46 89% | 2.37 93% | 2.82 78% | 1.85 119% |
| CCT | 6300 103% | 13248 49% | 6857 95% | 11552 56% | 10890 60% | 5036 129% |
| Color Space (Percent of AdobeRGB 1998) (%) | 37.07 | 51.12 38% | 40.1 8% | 38 3% | 36.4 -2% | 39 5% |
| Color Space (Percent of sRGB) (%) | 57.94 | 61.8 7% | 59.3 2% | 57.3 -1% | 61 5% | |
| Media total (Programa/Opciones) | 3% /
-12% | 1% /
4% | -10% /
-16% | -8% /
-12% | 3% /
1% |
* ... más pequeño es mejor
Tiempos de respuesta del display
| ↔ Tiempo de respuesta de Negro a Blanco | ||
|---|---|---|
| 28 ms ... subida ↗ y bajada ↘ combinada | ↗ 12.4 ms subida | 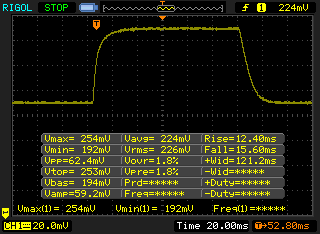 |
| ↘ 15.6 ms bajada | ||
| La pantalla mostró tiempos de respuesta relativamente lentos en nuestros tests pero podría ser demasiado lenta para los jugones. En comparación, todos los dispositivos de prueba van de ##min### (mínimo) a 240 (máximo) ms. » 71 % de todos los dispositivos son mejores. Eso quiere decir que el tiempo de respuesta es peor que la media (19.8 ms) de todos los dispositivos testados. | ||
| ↔ Tiempo de respuesta 50% Gris a 80% Gris | ||
| 39.2 ms ... subida ↗ y bajada ↘ combinada | ↗ 18.8 ms subida | 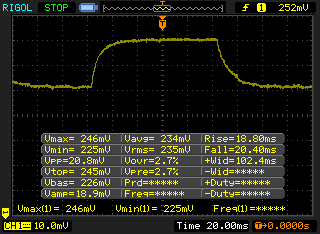 |
| ↘ 20.4 ms bajada | ||
| La pantalla mostró tiempos de respuesta lentos en nuestros tests y podría ser demasiado lenta para los jugones. En comparación, todos los dispositivos de prueba van de ##min### (mínimo) a 636 (máximo) ms. » 60 % de todos los dispositivos son mejores. Eso quiere decir que el tiempo de respuesta es peor que la media (31 ms) de todos los dispositivos testados. | ||
Parpadeo de Pantalla / PWM (Pulse-Width Modulation)
| Parpadeo de Pantalla / PWM no detectado | ||
Comparación: 52 % de todos los dispositivos testados no usaron PWM para atenuar el display. Si se usó, medimos una media de 7778 (mínimo: 5 - máxmo: 343500) Hz. | ||
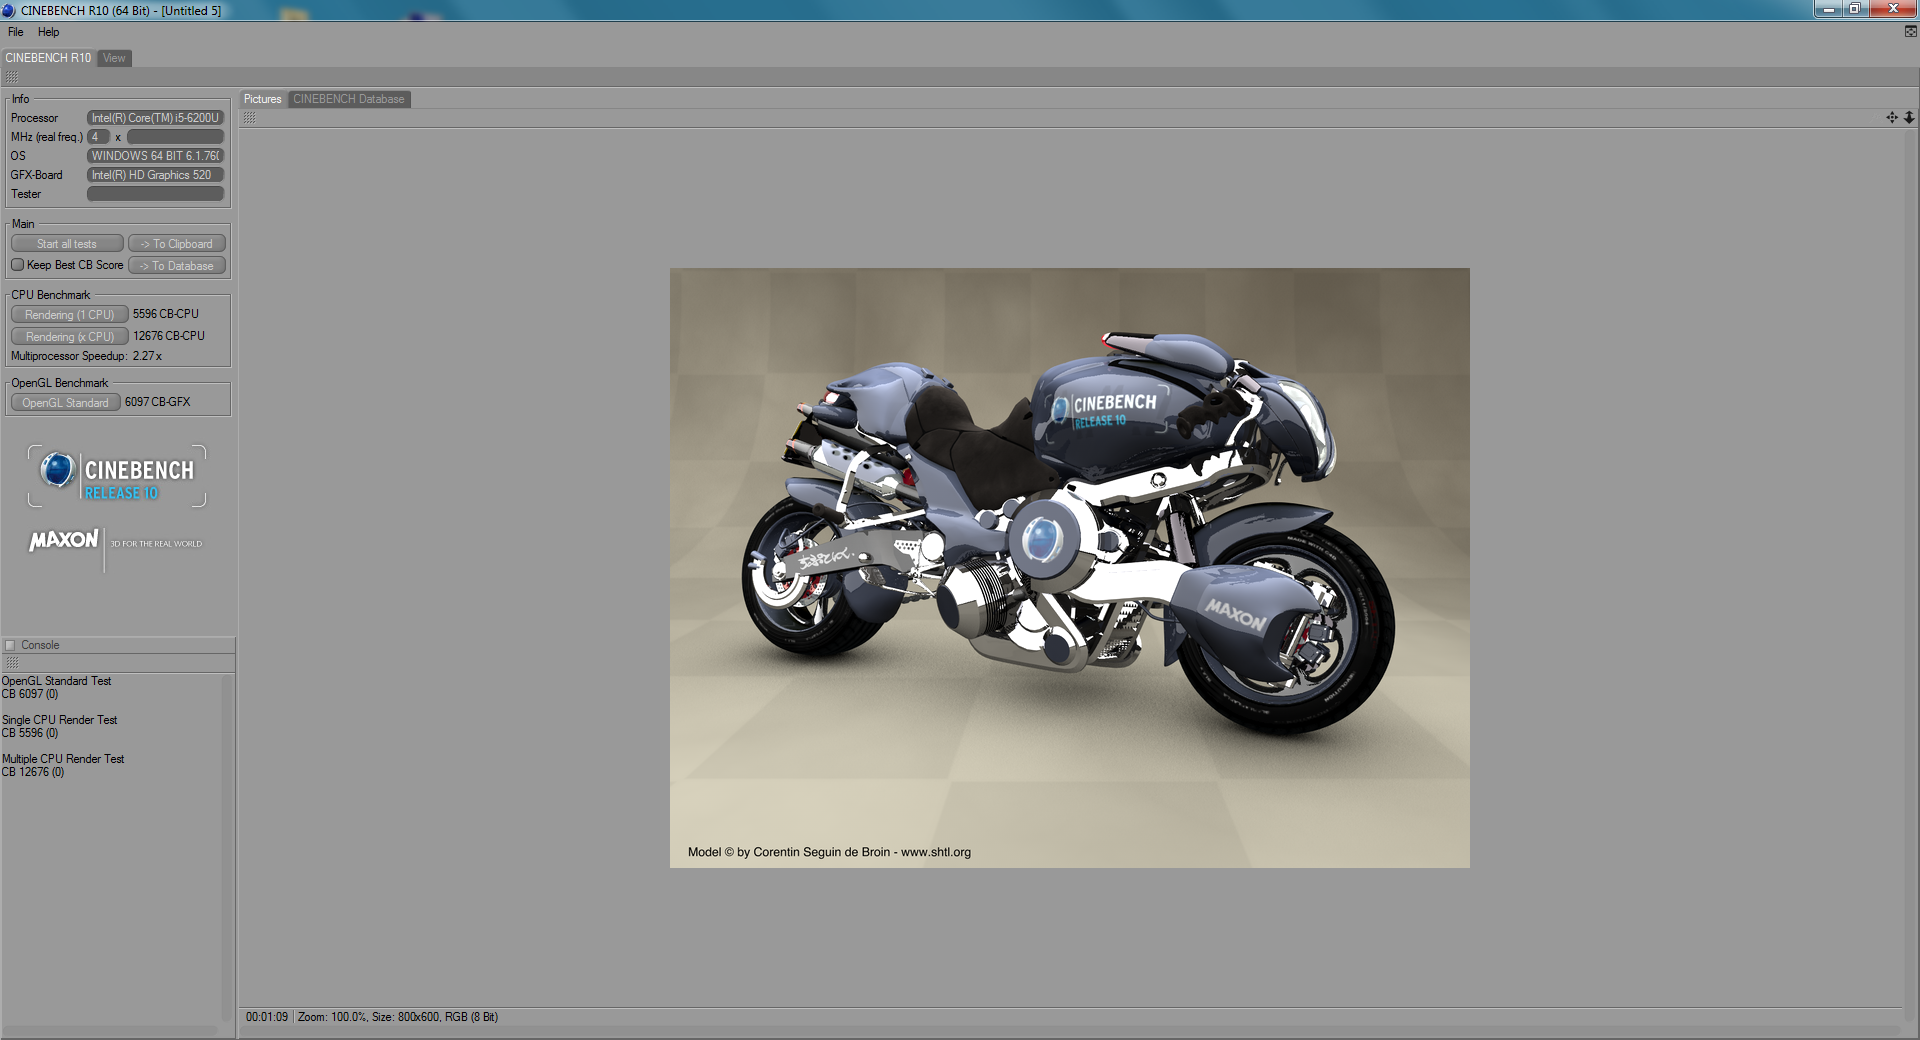
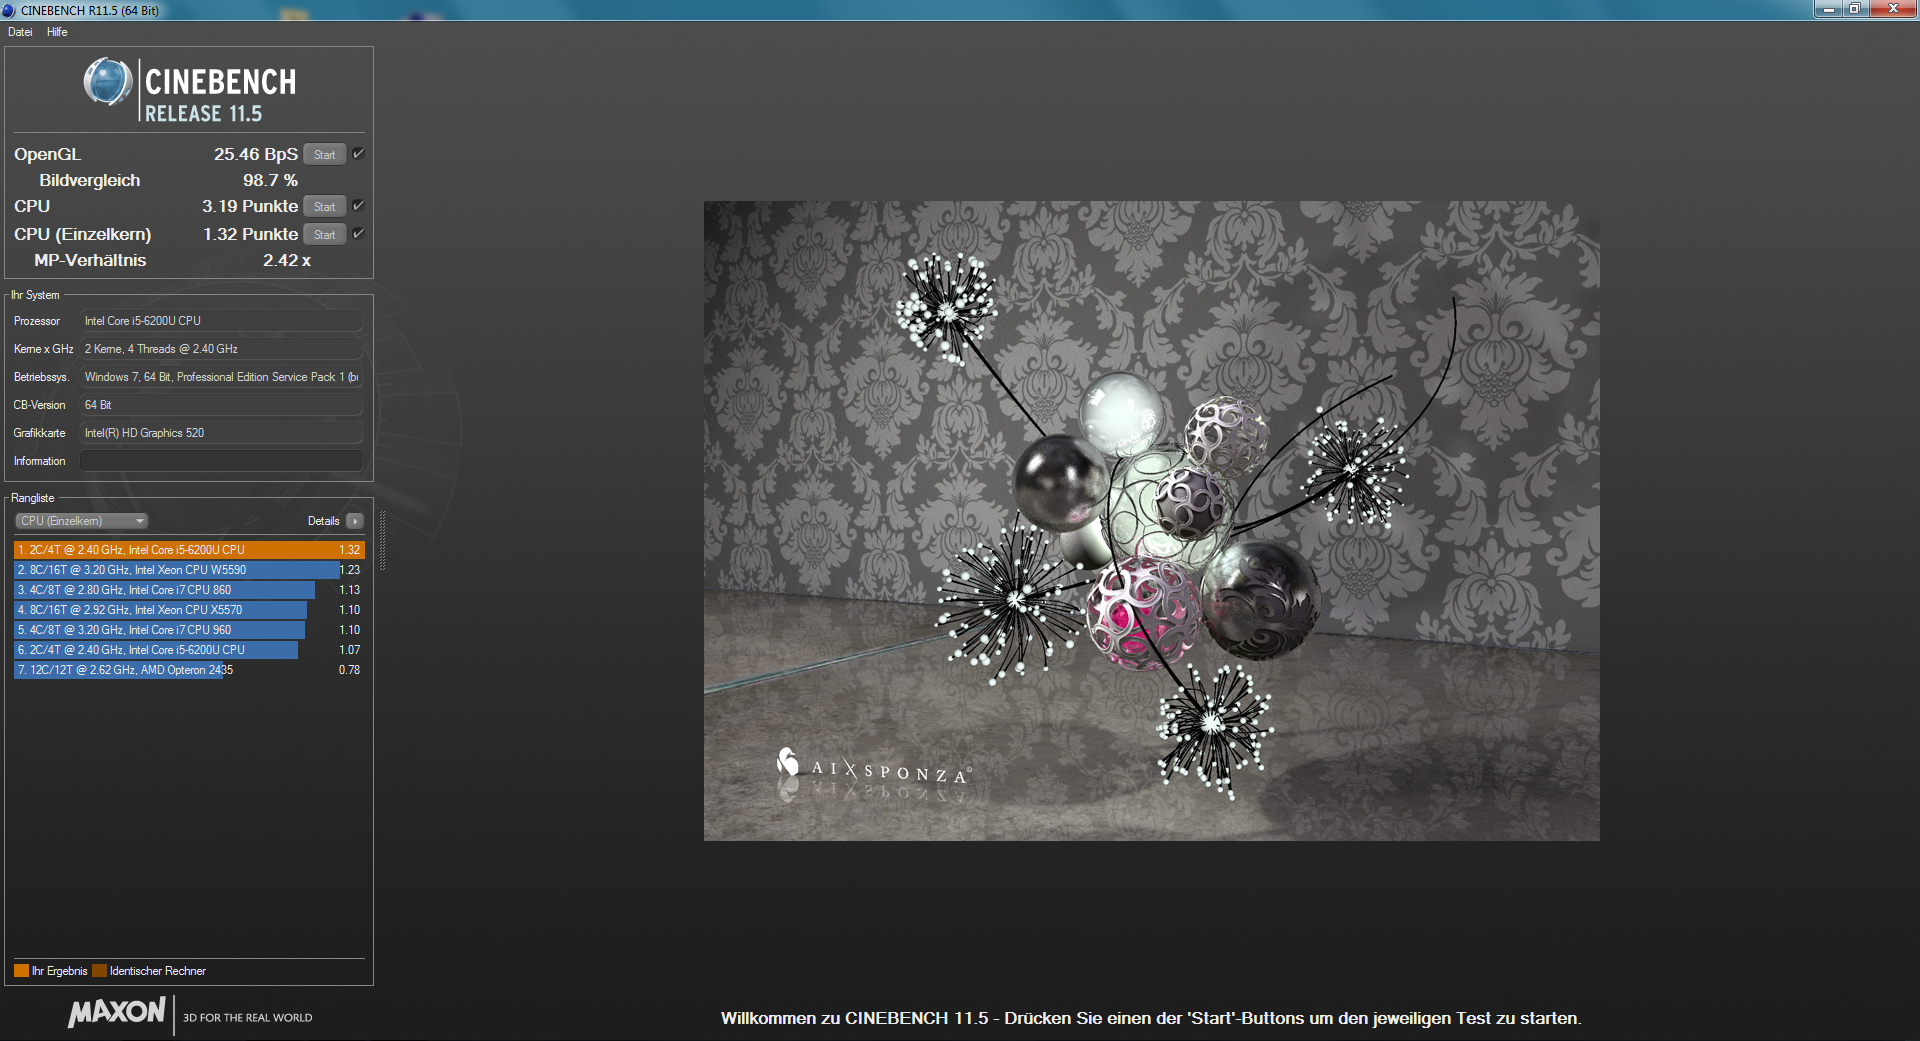
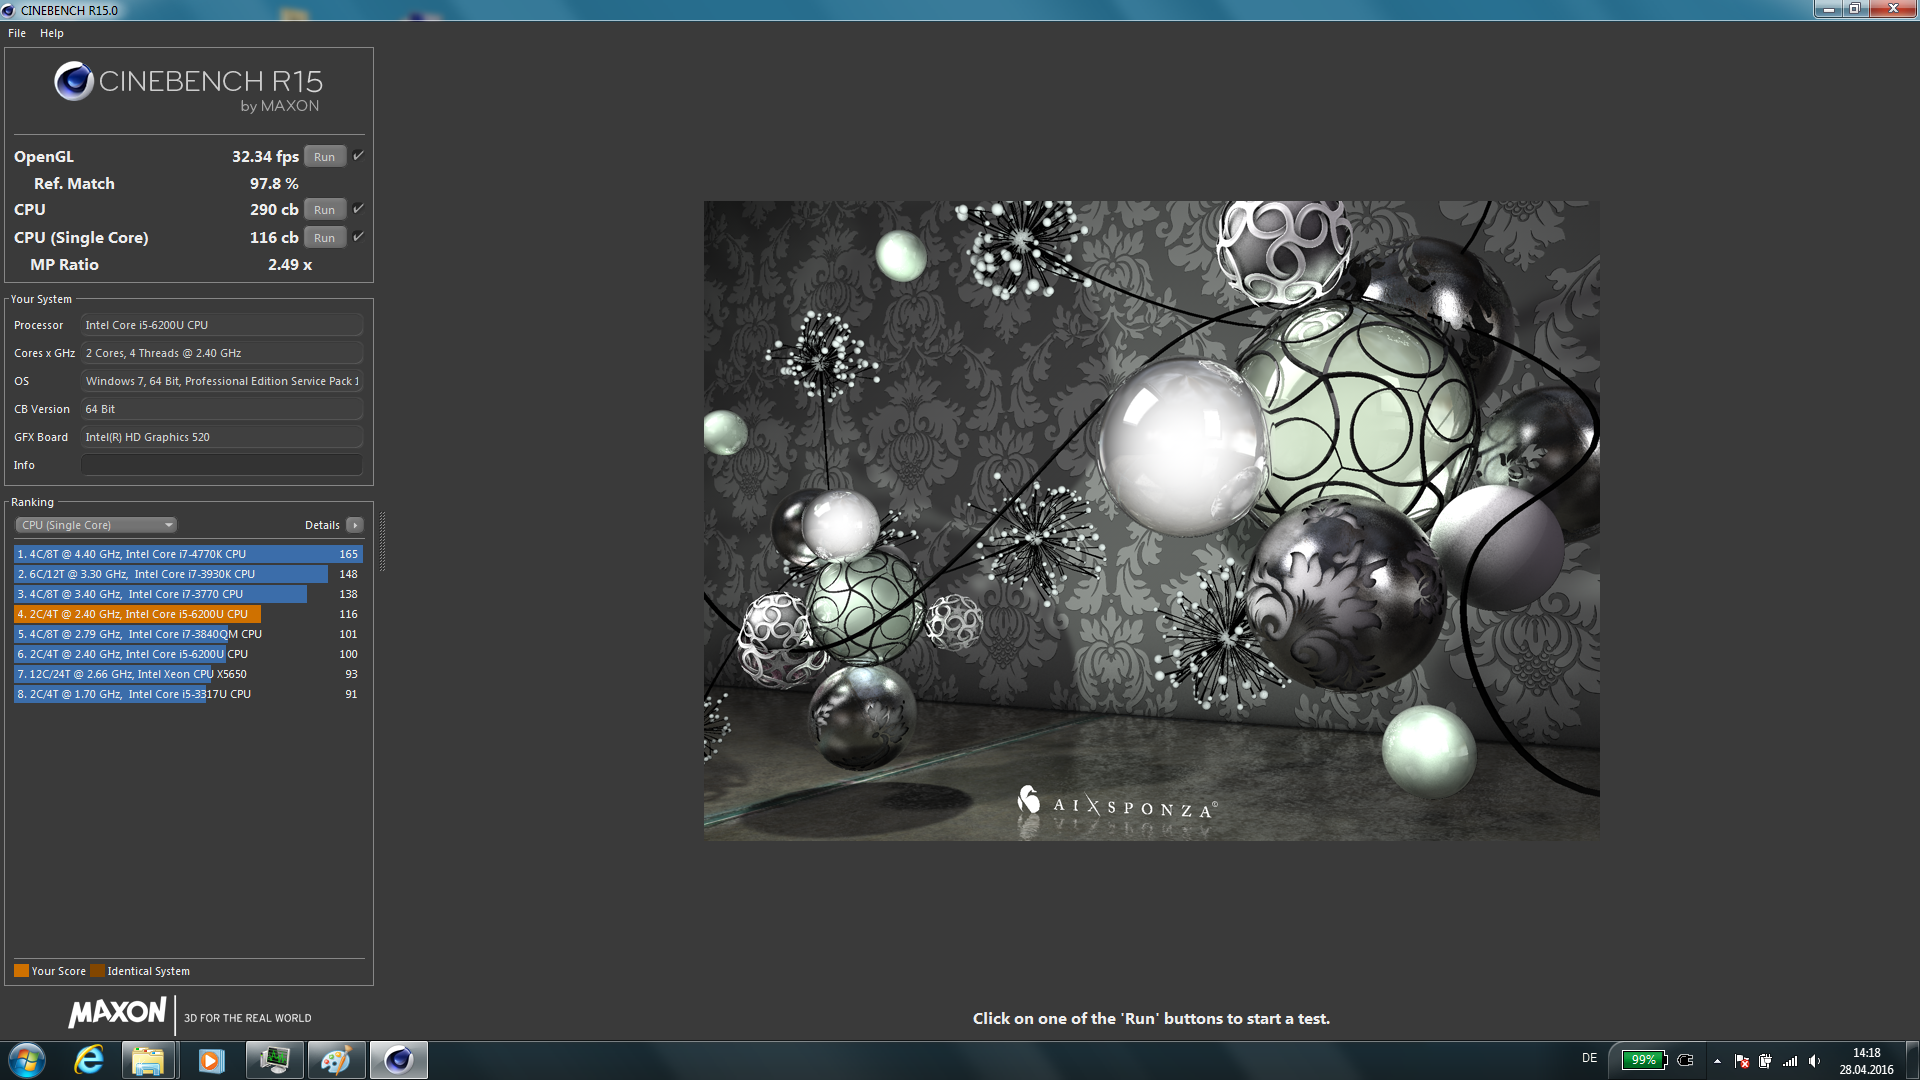
| Cinebench R10 | |
| Rendering Multiple CPUs 64Bit (ordenar por valor) | |
| Lenovo ThinkPad L560-20F10026GE | |
| Lenovo ThinkPad E550-20DF00CNGE | |
| Rendering Single CPUs 64Bit (ordenar por valor) | |
| Lenovo ThinkPad L560-20F10026GE | |
| Lenovo ThinkPad E550-20DF00CNGE | |
| JetStream 1.1 - 1.1 Total (ordenar por valor) | |
| Lenovo ThinkPad L560-20F10026GE | |
| Lenovo ThinkPad L460-20FVS01400 | |
| Lenovo ThinkPad E550-20DF00CNGE | |
| HP ProBook 450 G3 | |
| Octane V2 - Total Score (ordenar por valor) | |
| Lenovo ThinkPad L560-20F10026GE | |
| Lenovo ThinkPad L460-20FVS01400 | |
| Lenovo ThinkPad E550-20DF00CNGE | |
| HP ProBook 450 G3 | |
| Dell Inspiron 15-5558 | |
| Mozilla Kraken 1.1 - Total (ordenar por valor) | |
| Lenovo ThinkPad L560-20F10026GE | |
| Lenovo ThinkPad L460-20FVS01400 | |
| Lenovo ThinkPad E550-20DF00CNGE | |
| HP ProBook 450 G3 | |
| Dell Inspiron 15-5558 | |
* ... más pequeño es mejor
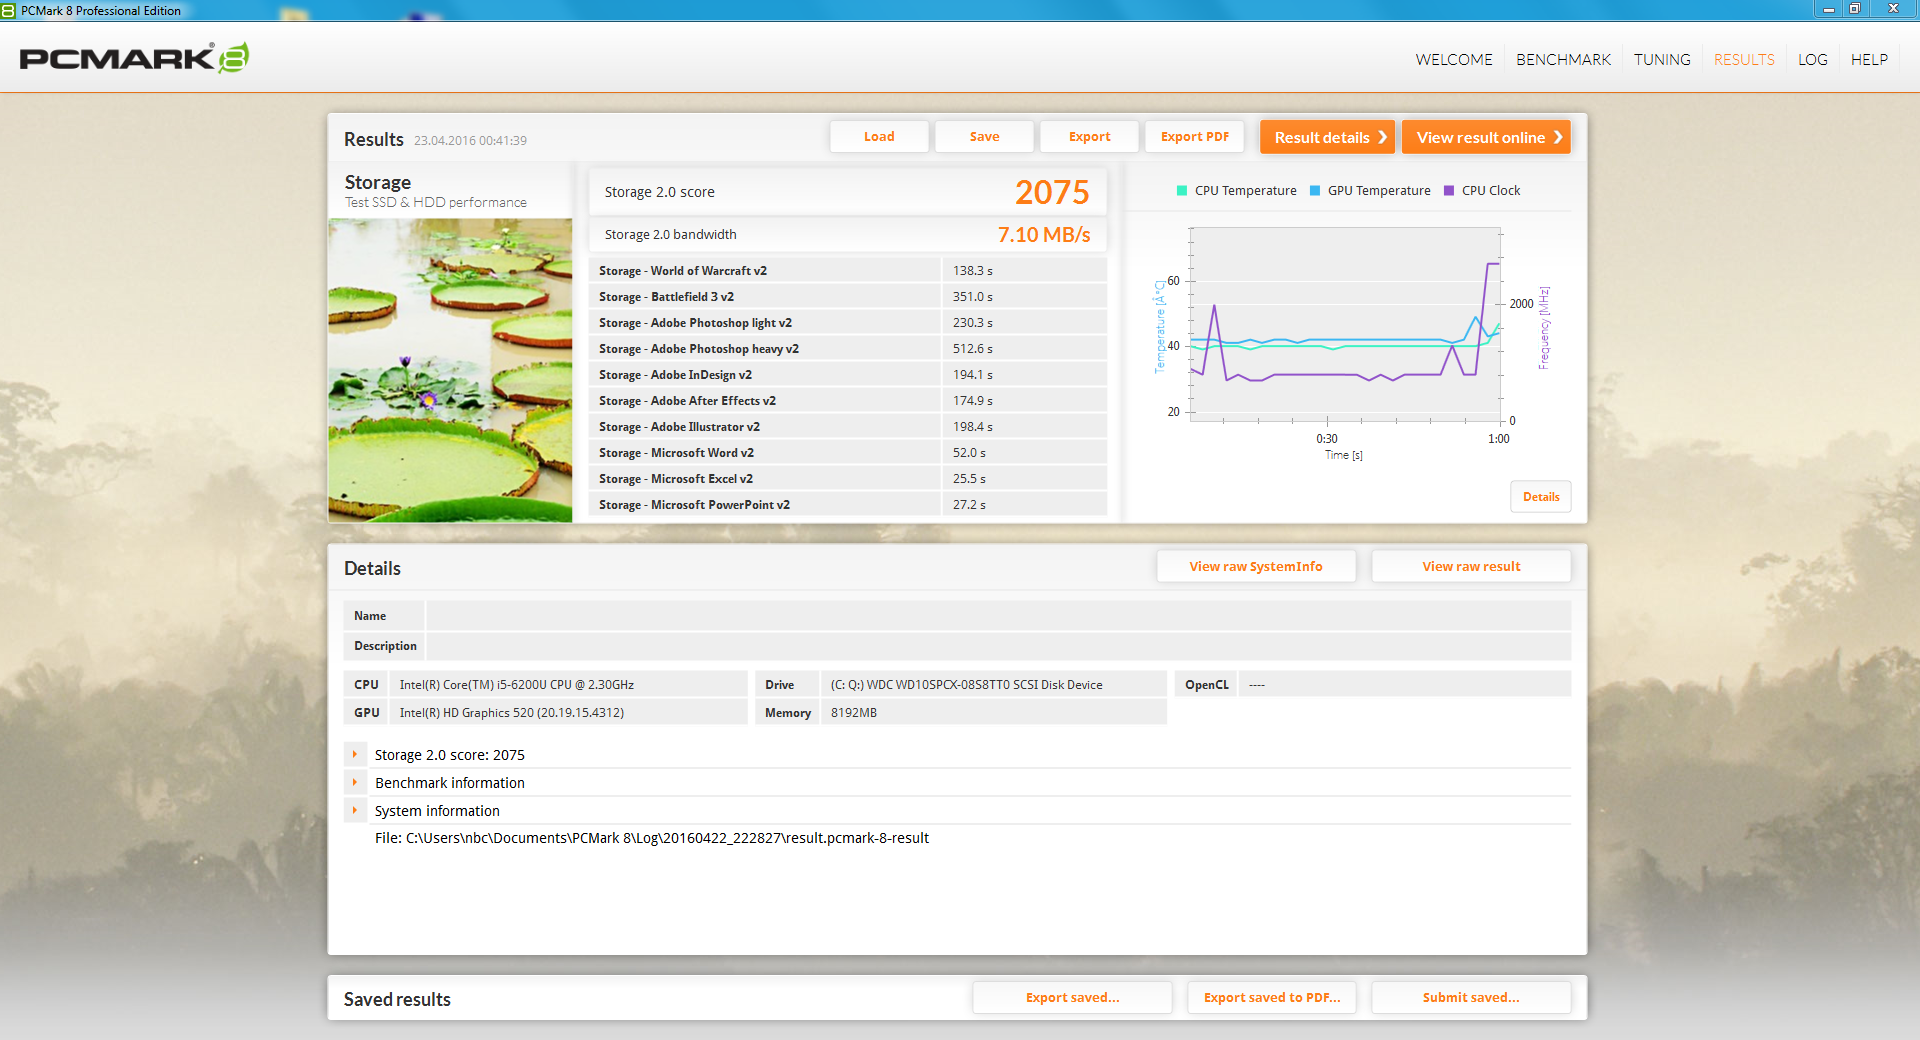
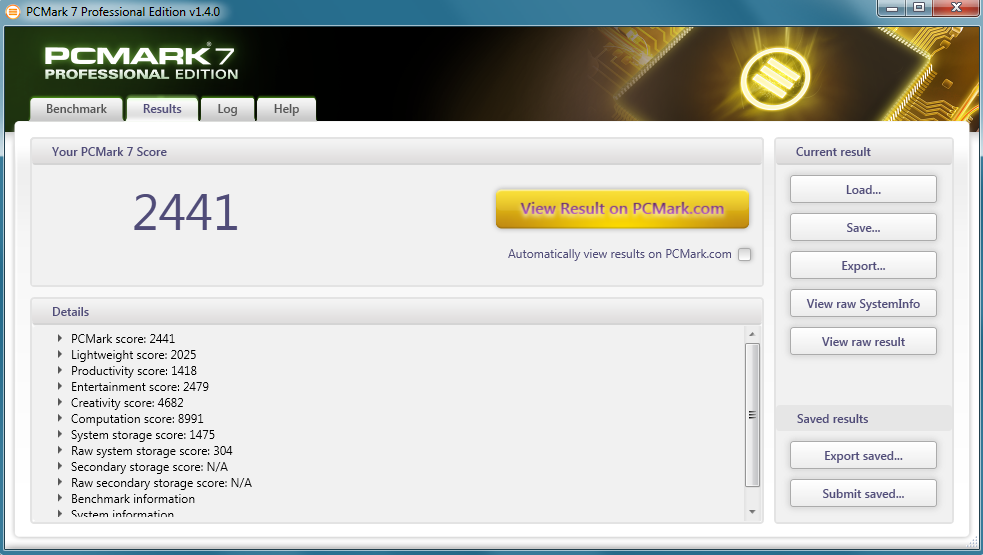
| PCMark 7 Score | 2441 puntos | |
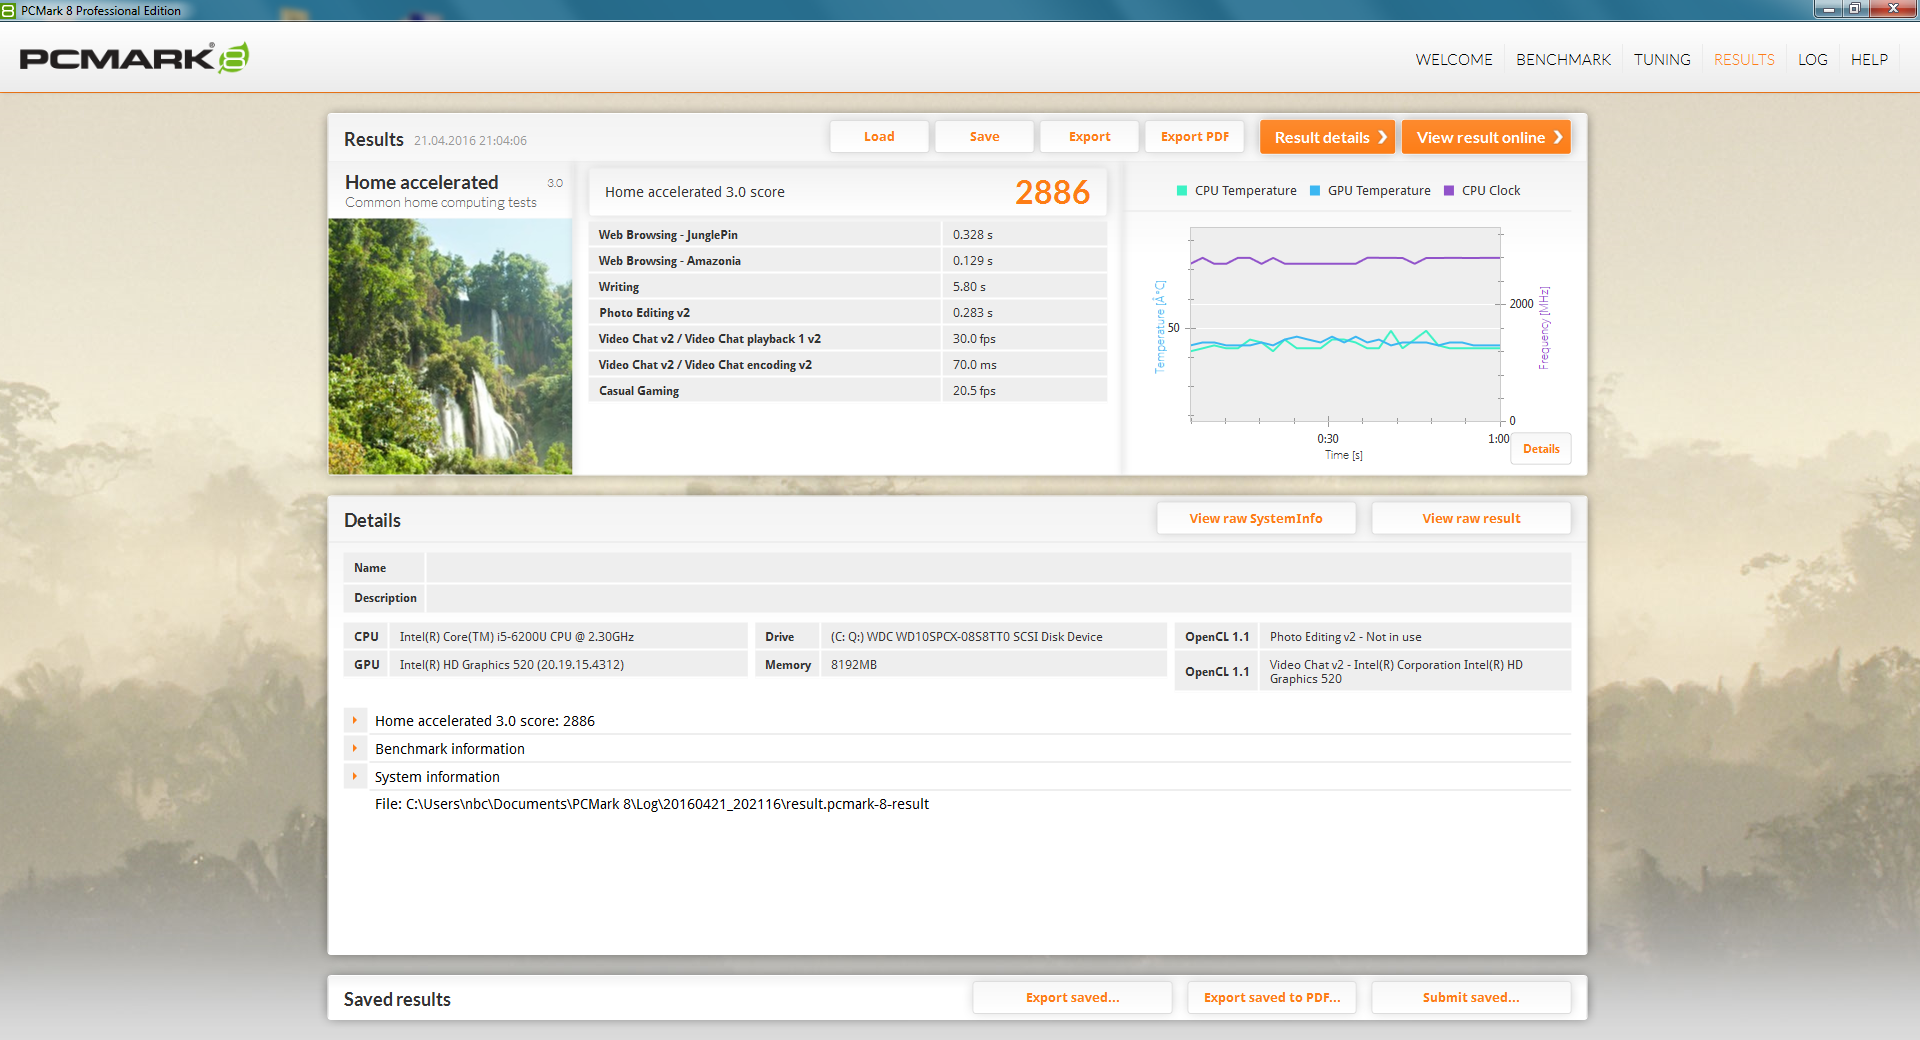
| PCMark 8 Home Score Accelerated v2 | 2886 puntos | |
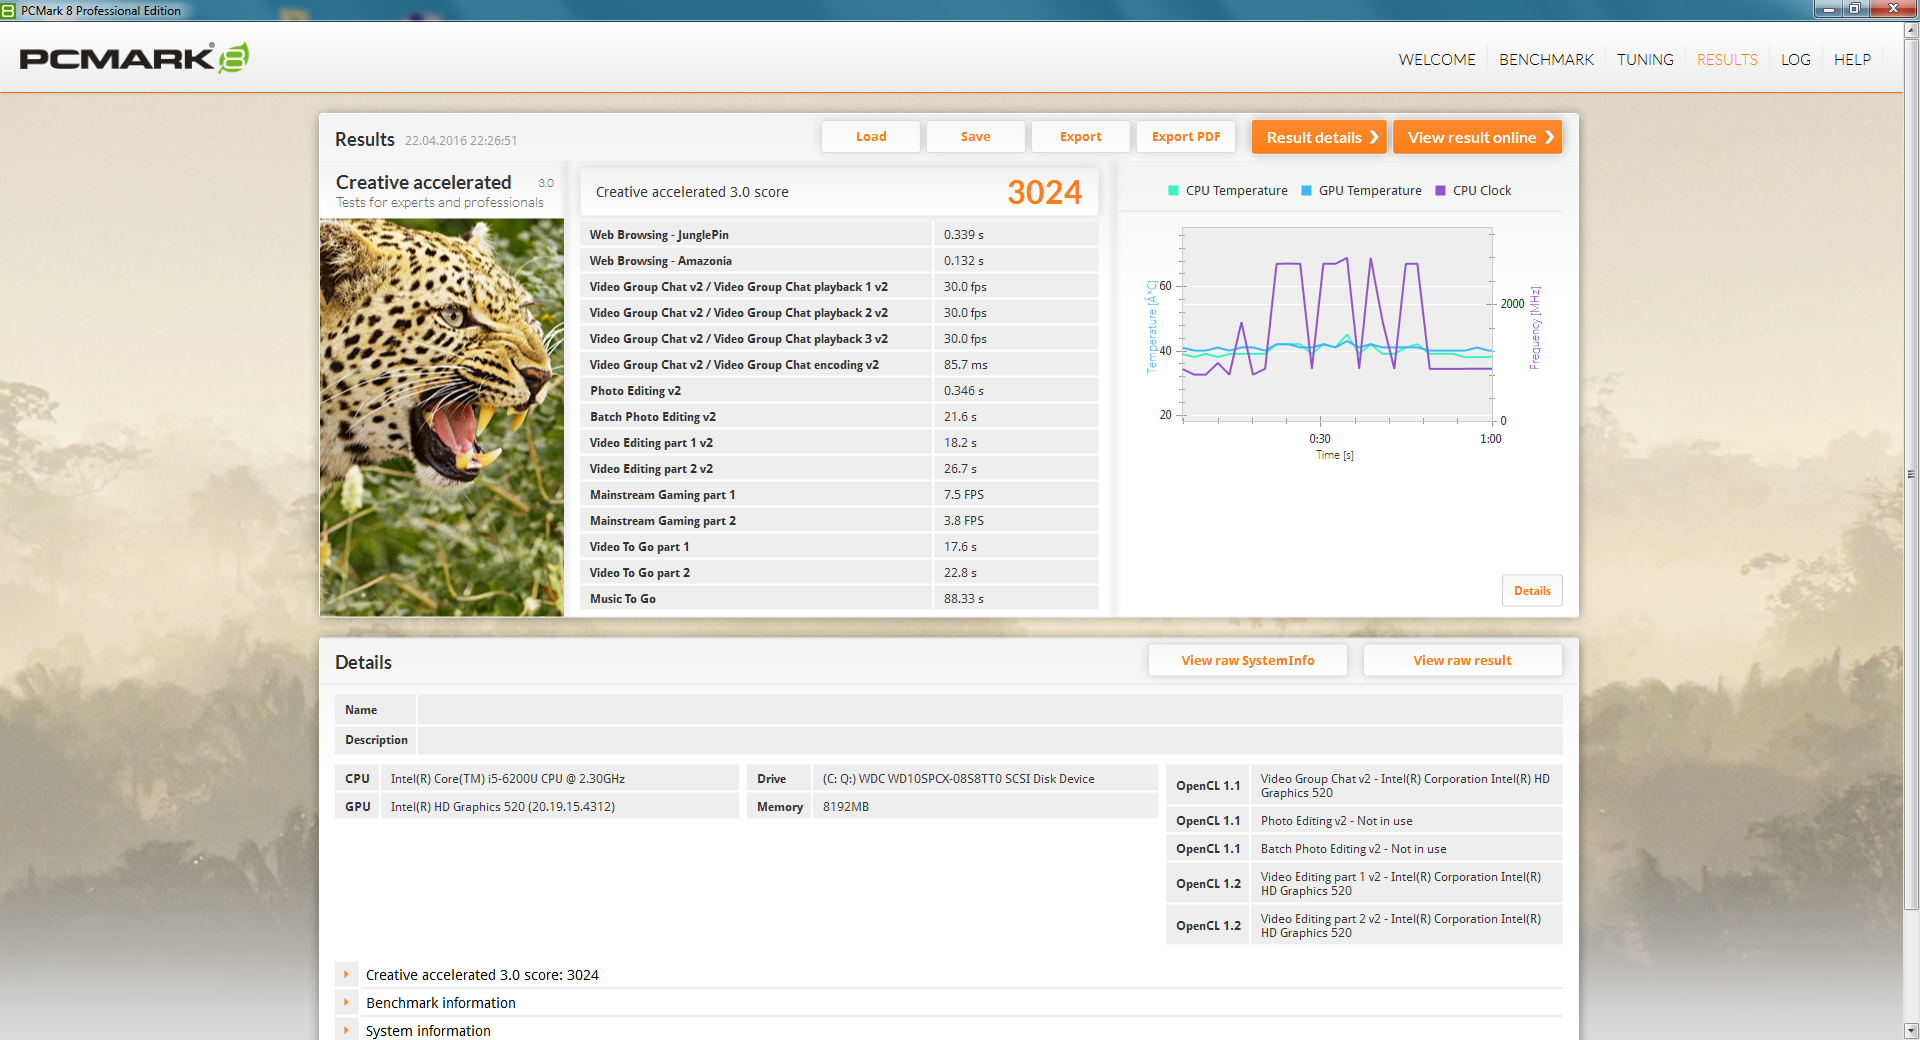
| PCMark 8 Creative Score Accelerated v2 | 3024 puntos | |
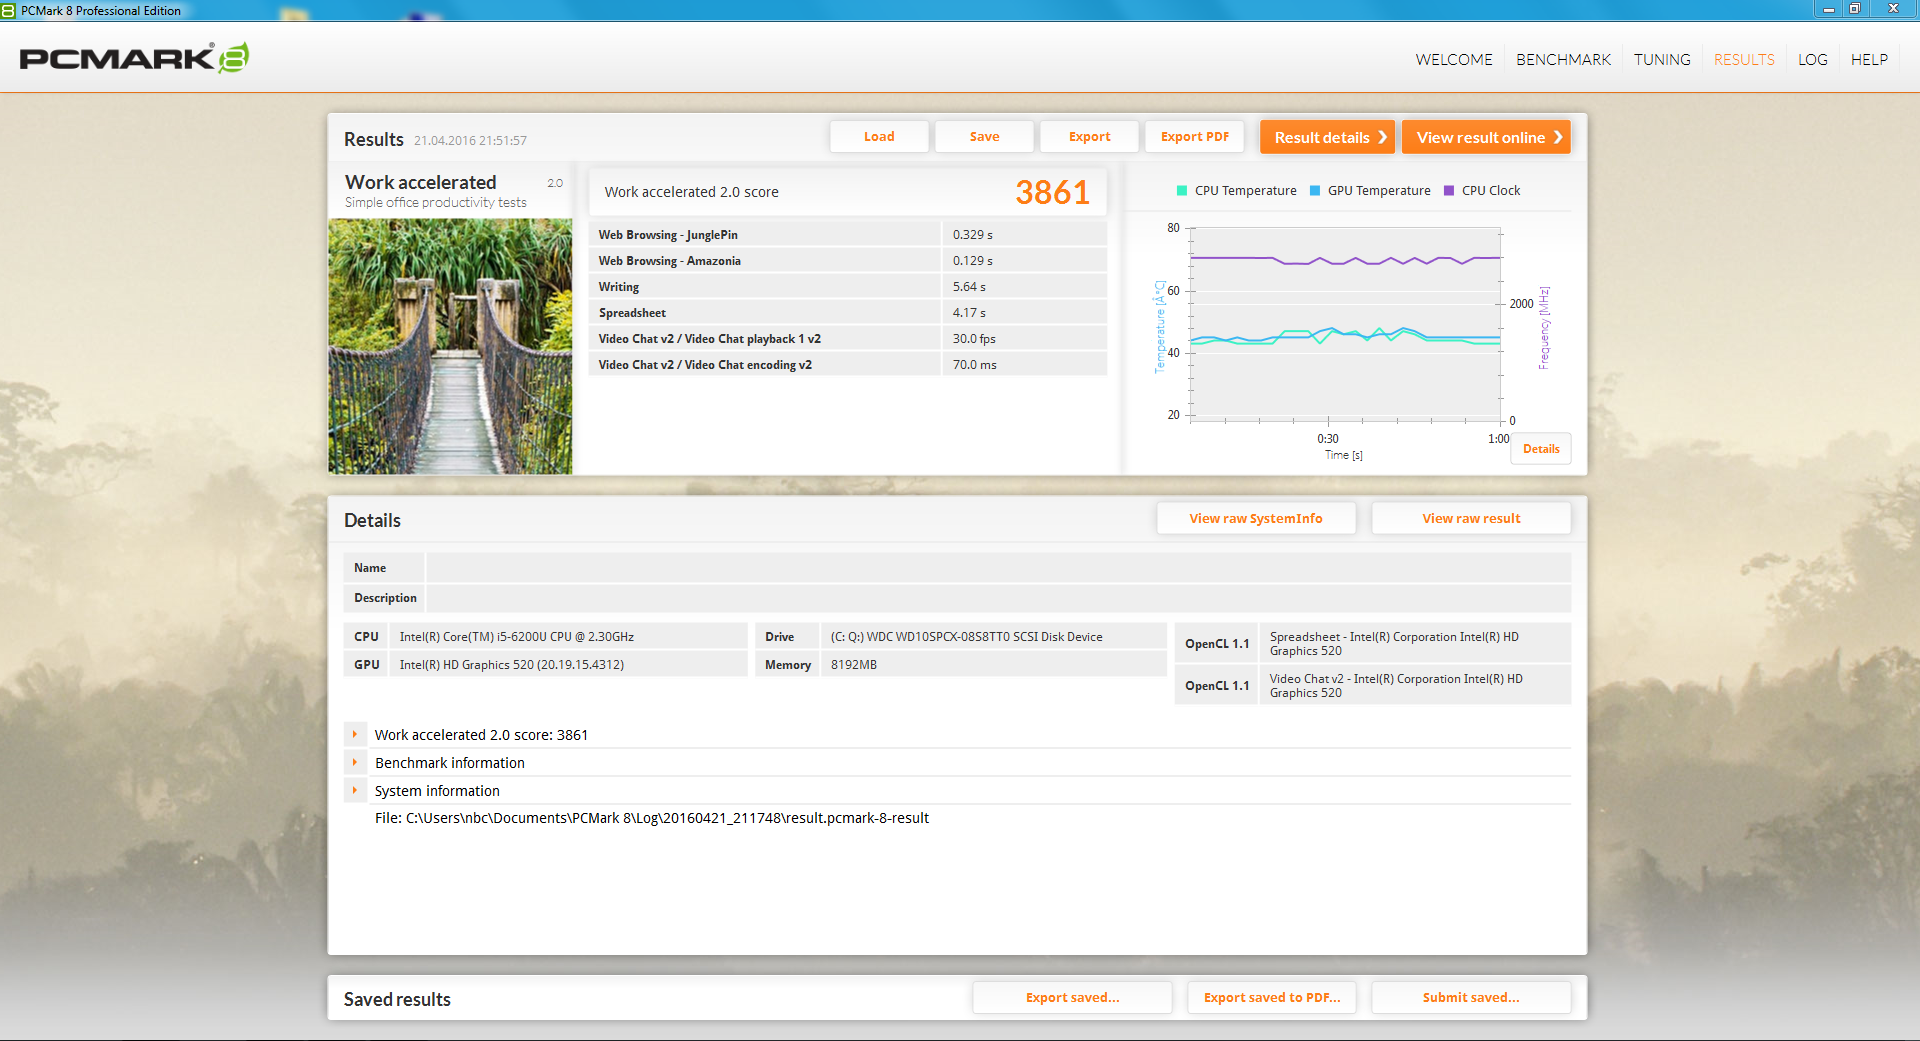
| PCMark 8 Work Score Accelerated v2 | 3861 puntos | |
ayuda | ||

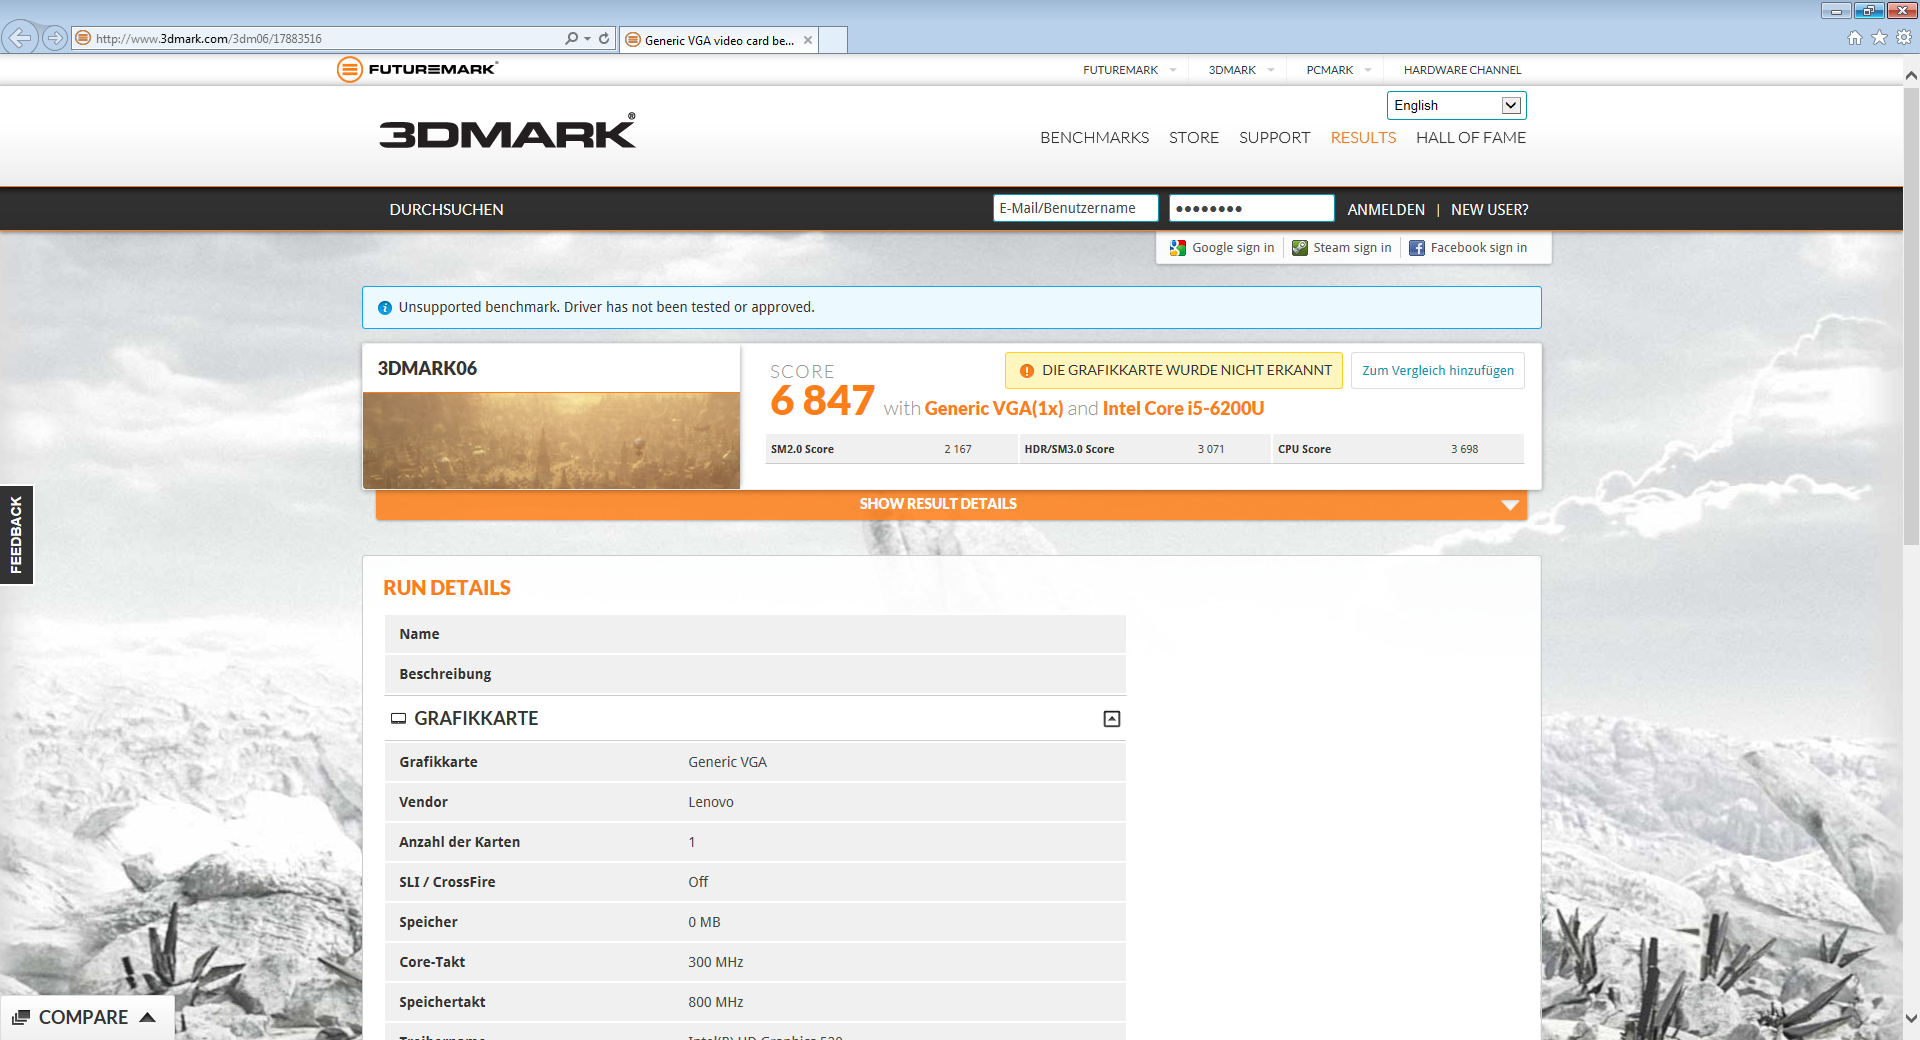
| 3DMark 06 1280x720 Score | 6847 puntos | |
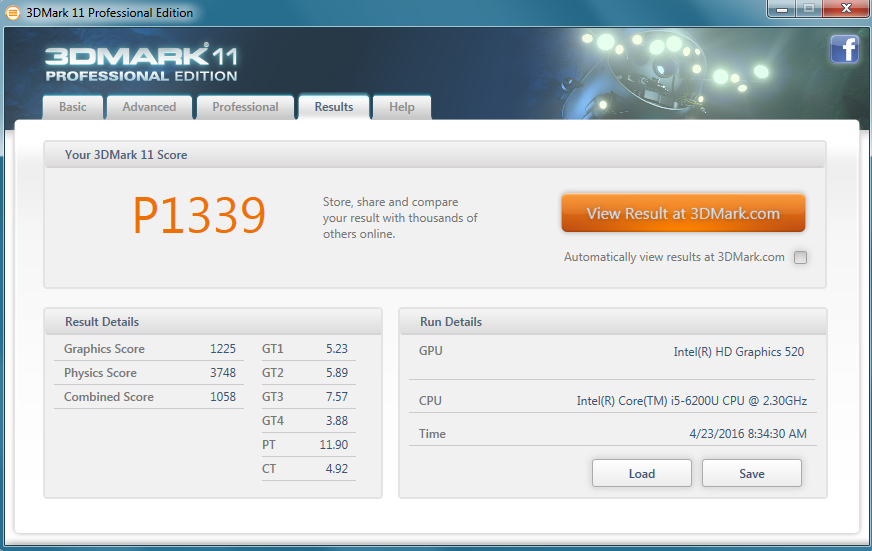
| 3DMark 11 Performance | 1339 puntos | |
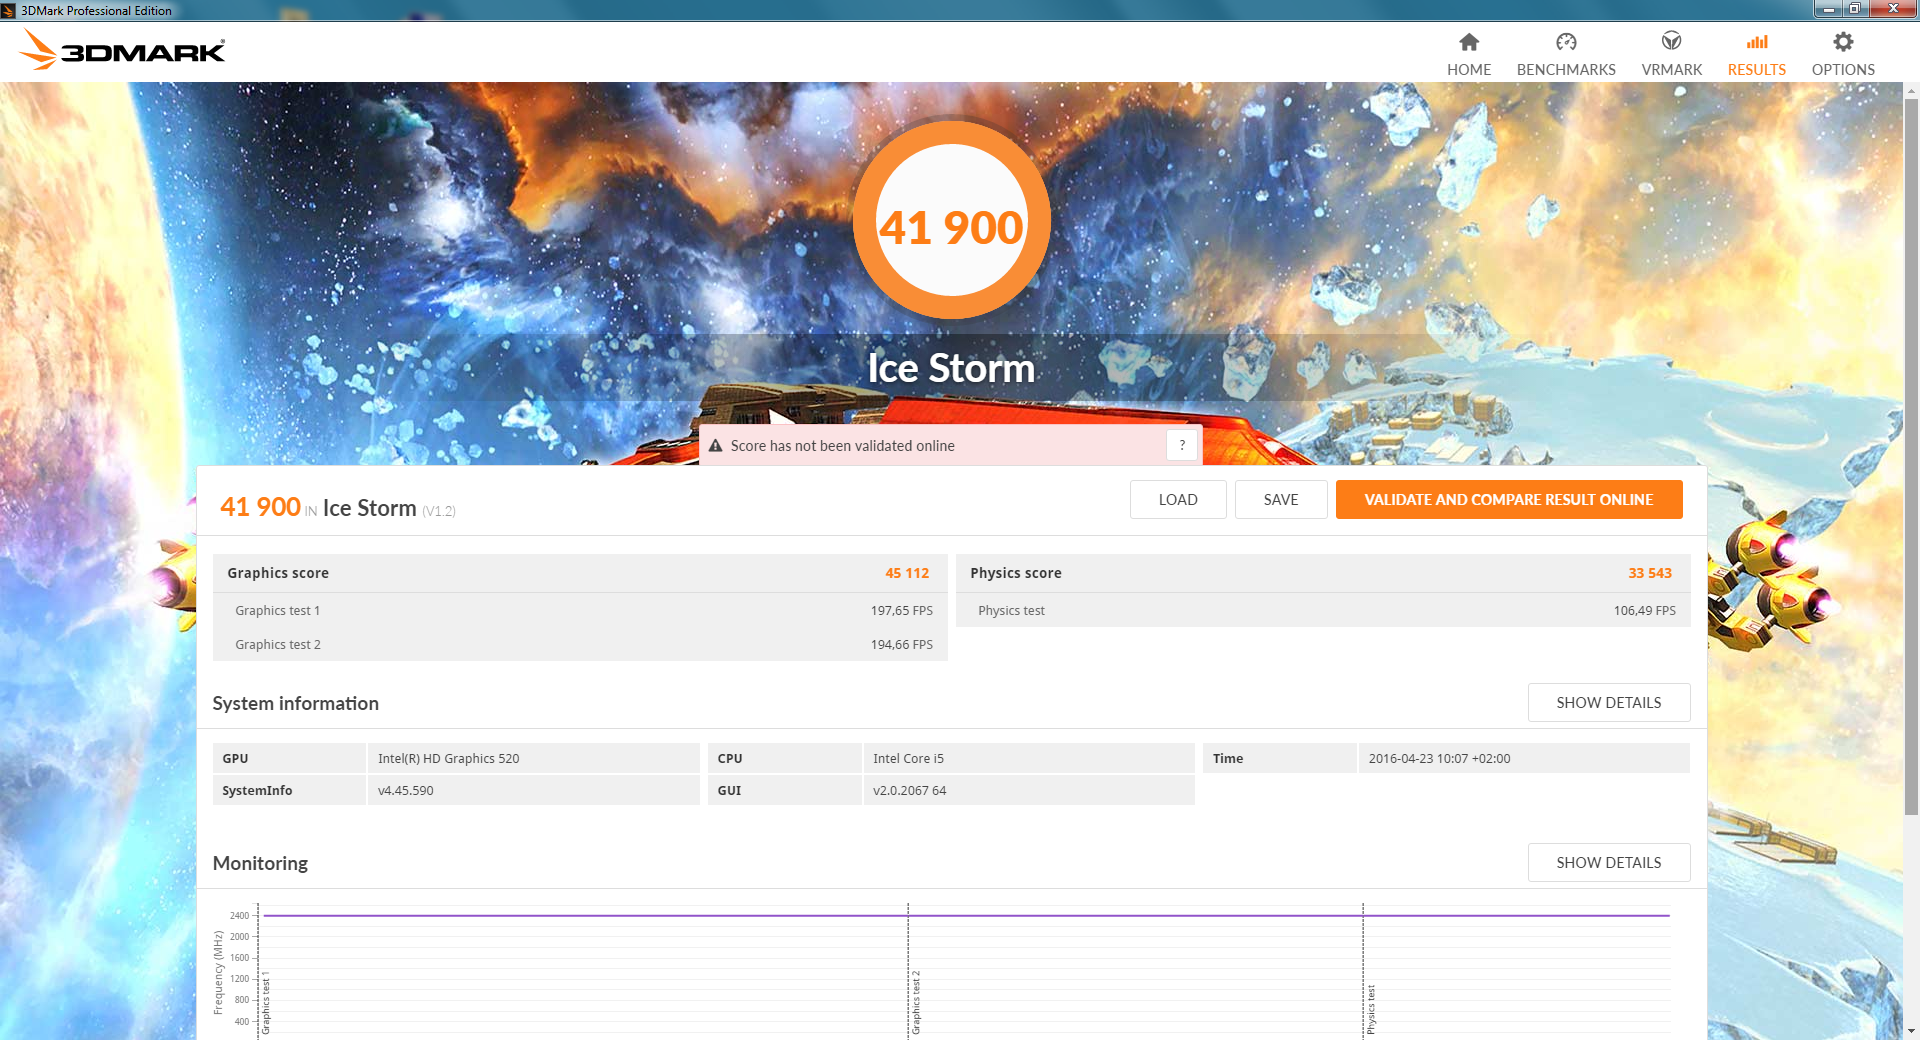
| 3DMark Ice Storm Standard Score | 41900 puntos | |
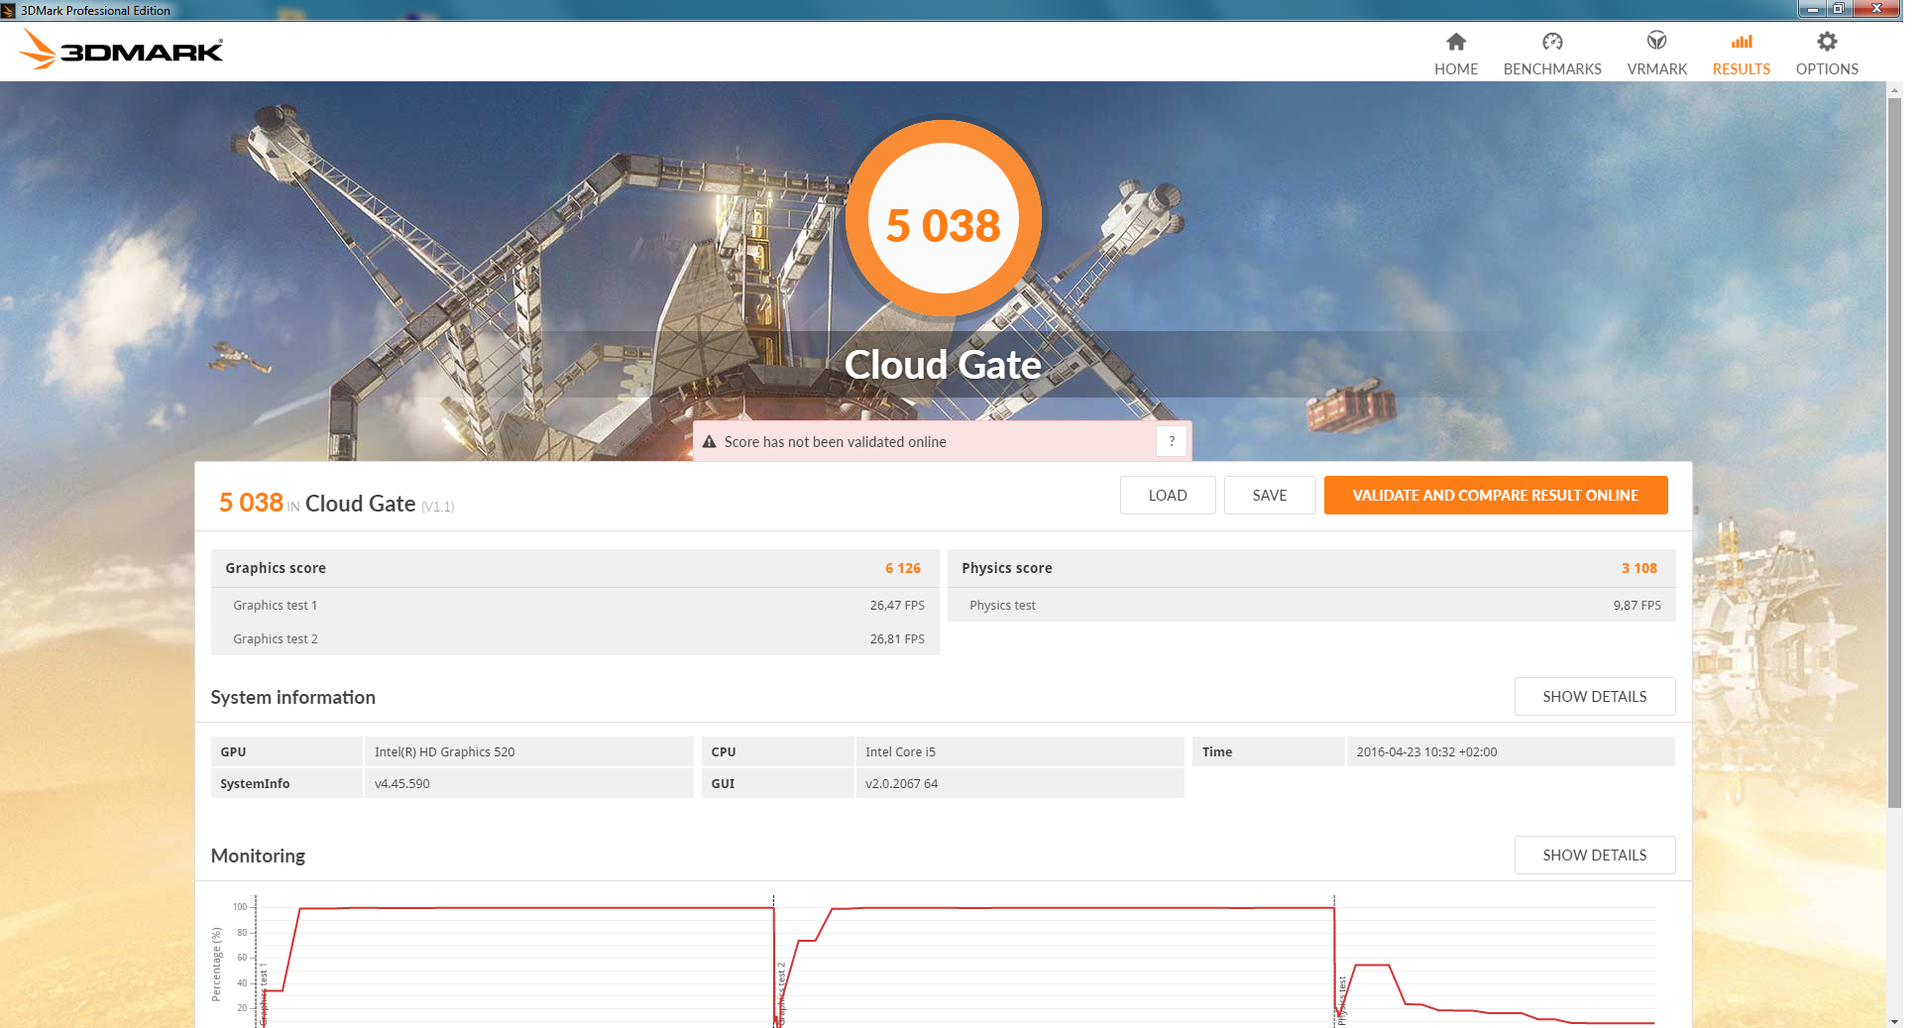
| 3DMark Cloud Gate Standard Score | 5038 puntos | |
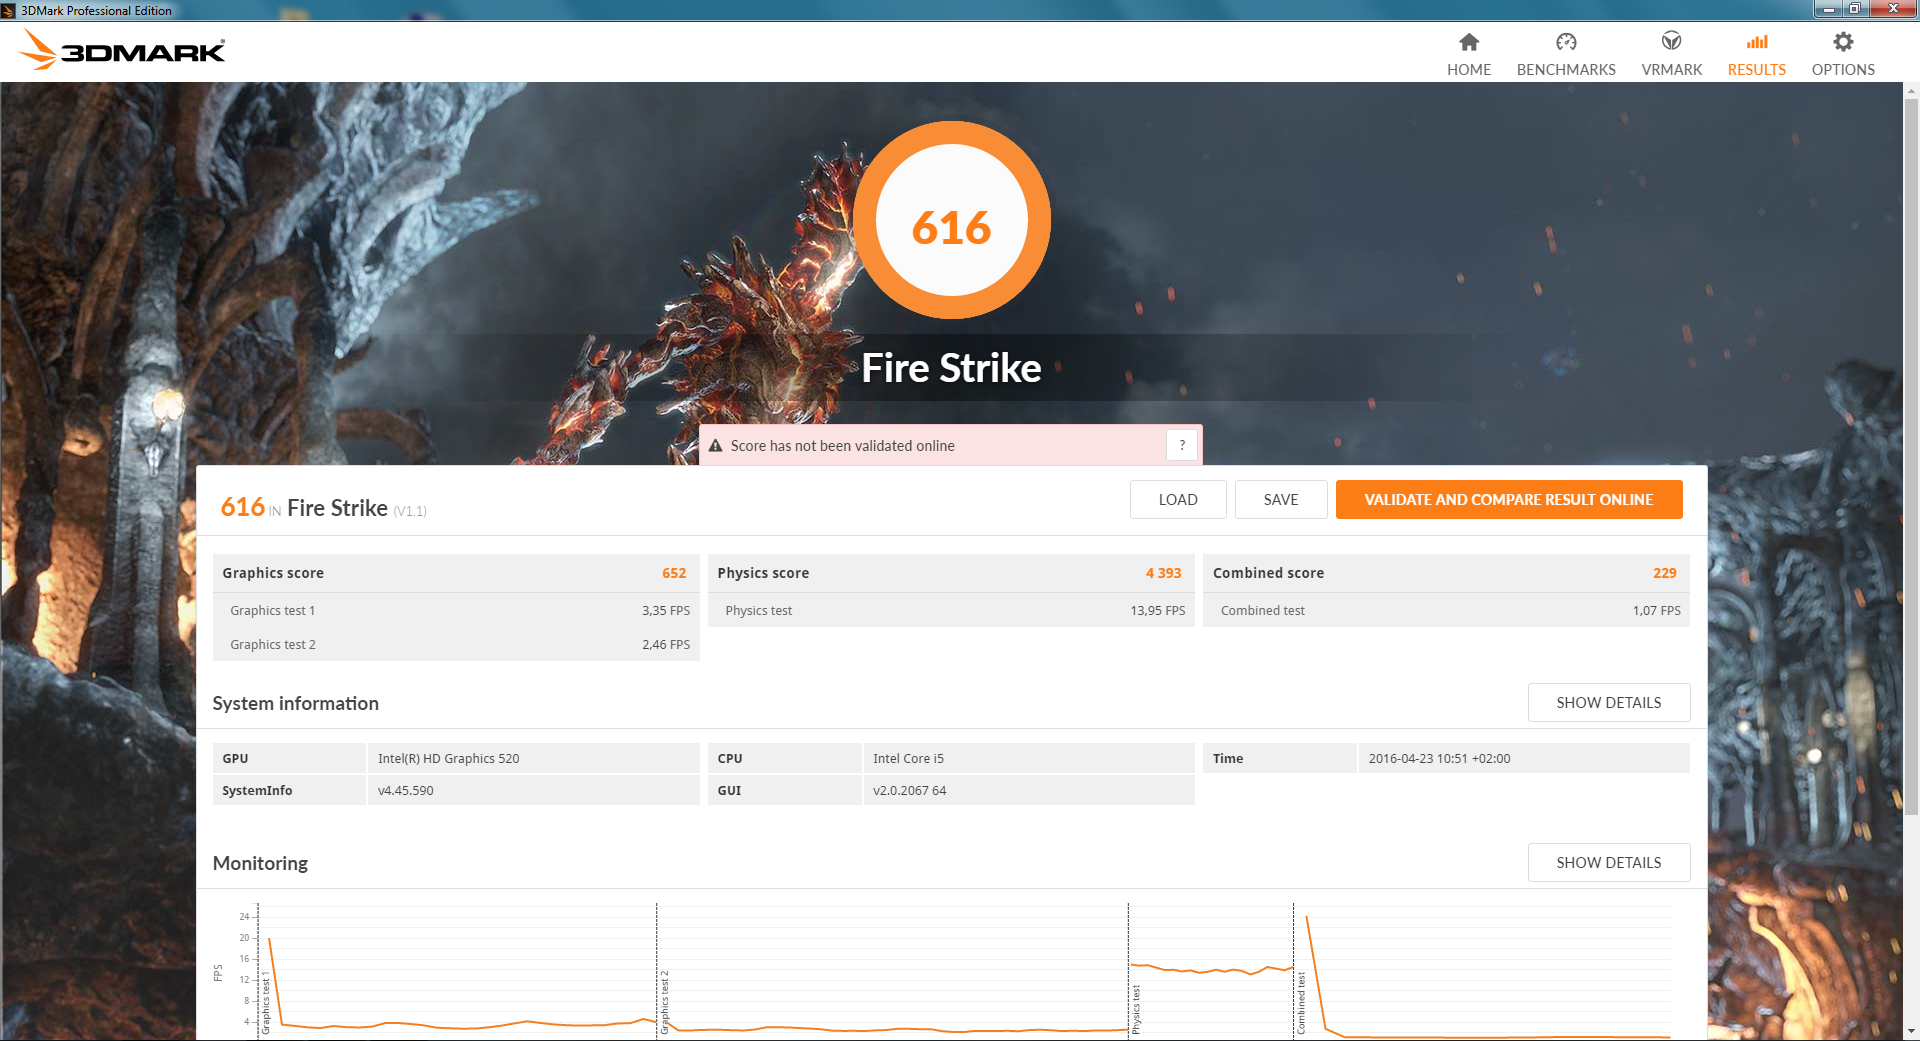
| 3DMark Fire Strike Score | 616 puntos | |
| 3DMark Fire Strike Extreme Score | 286 puntos | |
ayuda | ||
| bajo | medio | alto | ultra | |
|---|---|---|---|---|
| BioShock Infinite (2013) | 35.9 | 20.6 | 16.8 | 5.1 |
| Battlefield 4 (2013) | 32.3 | 24.8 | 14.7 | 4.1 |
| Rise of the Tomb Raider (2016) | 11.2 | 8.7 | 4.2 |
| Lenovo ThinkPad L560-20F10026GE HD Graphics 520, 6200U, WDC Slim WD10SPCX-21KHST0 | Lenovo ThinkPad L540 20AV002YGE HD Graphics 4600, 4200M, Hitachi Travelstar Z7K500 HTS725050A7E630 | Lenovo ThinkPad L460-20FVS01400 Radeon R5 M330, 6500U, Toshiba HG6 THNSFJ256GCSU | Lenovo ThinkPad E550-20DF00CNGE Radeon R7 M265, 5500U, WDC Slim WD10SPCX-22HWST0 | HP ProBook 450 G3 HD Graphics 520, 6200U, Seagate ST500LM021-1KJ15 | Dell Inspiron 15-5558 GeForce 920M, 5200U, Toshiba MQ01ABD100 | |
|---|---|---|---|---|---|---|
| Noise | -6% | 1% | -1% | 1% | -20% | |
| apagado / medio ambiente * (dB) | 29.4 | 29.2 1% | ||||
| Idle Minimum * (dB) | 30.1 | 31.9 -6% | 29.2 3% | 29.8 1% | 29.7 1% | 33.5 -11% |
| Idle Average * (dB) | 30.1 | 32.4 -8% | 29.2 3% | 29.8 1% | 29.7 1% | 33.5 -11% |
| Idle Maximum * (dB) | 30.1 | 32.4 -8% | 29.2 3% | 31.1 -3% | 29.7 1% | 33.5 -11% |
| Load Average * (dB) | 33.4 | 34.8 -4% | 32.5 3% | 33.1 1% | 33.1 1% | 45.9 -37% |
| Load Maximum * (dB) | 34.7 | 36.1 -4% | 37.2 -7% | 35.6 -3% | 34.2 1% | 45.3 -31% |
* ... más pequeño es mejor
Ruido
| Ocioso |
| 30.1 / 30.1 / 30.1 dB(A) |
| Carga |
| 33.4 / 34.7 dB(A) |
 | ||
30 dB silencioso 40 dB(A) audible 50 dB(A) ruidosamente alto |
||
min: | ||
(+) La temperatura máxima en la parte superior es de 37.2 °C / 99 F, frente a la media de 34.3 °C / 94 F, que oscila entre 21.2 y 62.5 °C para la clase Office.
(+) El fondo se calienta hasta un máximo de 36 °C / 97 F, frente a la media de 36.8 °C / 98 F
(+) En reposo, la temperatura media de la parte superior es de 28.6 °C / 83# F, frente a la media del dispositivo de 29.5 °C / 85 F.
(+) El reposamanos y el panel táctil están a una temperatura inferior a la de la piel, con un máximo de 29.2 °C / 84.6 F y, por tanto, son fríos al tacto.
(±) La temperatura media de la zona del reposamanos de dispositivos similares fue de 27.5 °C / 81.5 F (-1.7 °C / -3.1 F).
| Lenovo ThinkPad L560-20F10026GE HD Graphics 520, 6200U, WDC Slim WD10SPCX-21KHST0 | Lenovo ThinkPad L540 20AV002YGE HD Graphics 4600, 4200M, Hitachi Travelstar Z7K500 HTS725050A7E630 | Lenovo ThinkPad L460-20FVS01400 Radeon R5 M330, 6500U, Toshiba HG6 THNSFJ256GCSU | Lenovo ThinkPad E550-20DF00CNGE Radeon R7 M265, 5500U, WDC Slim WD10SPCX-22HWST0 | HP ProBook 450 G3 HD Graphics 520, 6200U, Seagate ST500LM021-1KJ15 | Dell Inspiron 15-5558 GeForce 920M, 5200U, Toshiba MQ01ABD100 | Acer TravelMate P278-MG-76L2 GeForce 940M, 6500U, Lite-On CV1-8B256 | |
|---|---|---|---|---|---|---|---|
| Power Consumption | -60% | -2% | -11% | -5% | 3% | -62% | |
| Idle Minimum * (Watt) | 5 | 9.5 -90% | 3.1 38% | 4.1 18% | 4.9 2% | 4.3 14% | 5.8 -16% |
| Idle Average * (Watt) | 7.9 | 13.1 -66% | 6.3 20% | 6.7 15% | 8.2 -4% | 6.5 18% | 11.6 -47% |
| Idle Maximum * (Watt) | 8.6 | 13.4 -56% | 7.9 8% | 7.7 10% | 9 -5% | 7.4 14% | 13.6 -58% |
| Load Average * (Watt) | 27.5 | 38.6 -40% | 29.5 -7% | 37.6 -37% | 30.1 -9% | 33.3 -21% | 51 -85% |
| Load Maximum * (Watt) | 33.7 | 49.5 -47% | 57.3 -70% | 54.7 -62% | 36.1 -7% | 36.3 -8% | 69 -105% |
* ... más pequeño es mejor
| Off / Standby | |
| Ocioso | |
| Carga |
|
Clave:
min: | |

| Lenovo ThinkPad L560-20F10026GE 48 Wh | Lenovo ThinkPad L540 20AV002YGE 56 Wh | Lenovo ThinkPad L460-20FVS01400 48 Wh | Lenovo ThinkPad E550-20DF00CNGE 48 Wh | HP ProBook 450 G3 44 Wh | Dell Inspiron 15-5558 40 Wh | Acer TravelMate P278-MG-76L2 37 Wh | |
|---|---|---|---|---|---|---|---|
| Duración de Batería | -28% | 29% | -10% | -9% | -3% | -11% | |
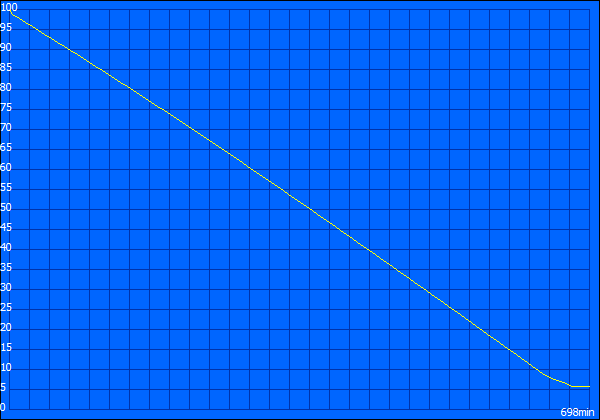
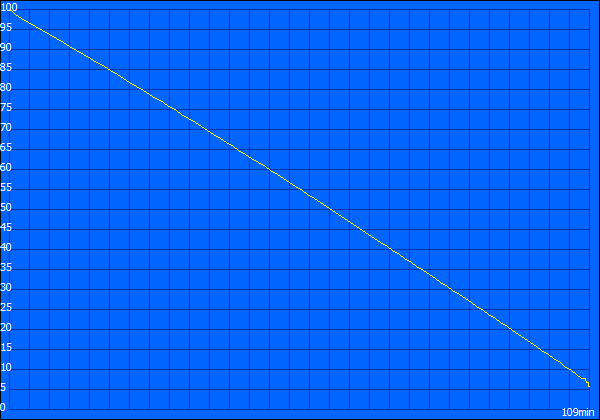
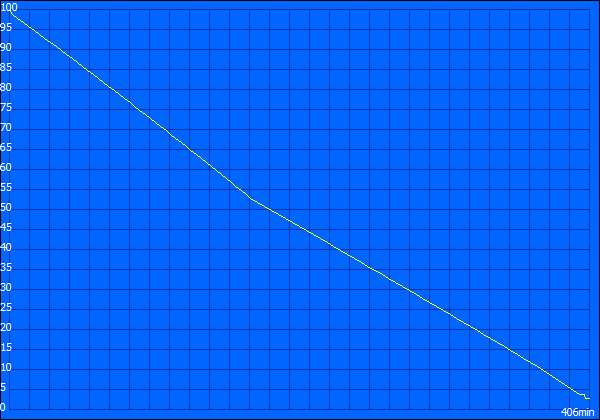
| Reader / Idle (h) | 11.6 | 6.5 -44% | 19.2 66% | 11.1 -4% | 9.6 -17% | 11.1 -4% | 10 -14% |
| H.264 (h) | 4.6 | 7.2 57% | 5.2 13% | 5.6 22% | 5.3 15% | 4.8 4% | |
| WiFi v1.3 (h) | 6.8 | 7.1 4% | 4.9 -28% | 5.2 -24% | 5.6 -18% | 5 -26% | |
| Load (h) | 1.8 | 1.6 -11% | 1.6 -11% | 1.4 -22% | 1.5 -17% | 1.7 -6% | 1.7 -6% |
| WiFi (h) | 5 |
Pro
Contra
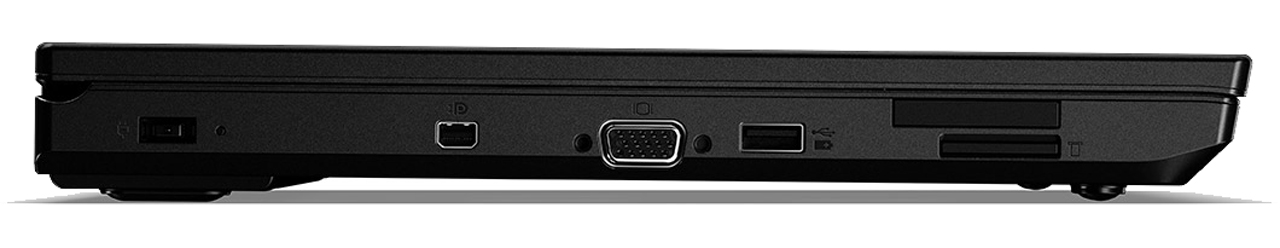
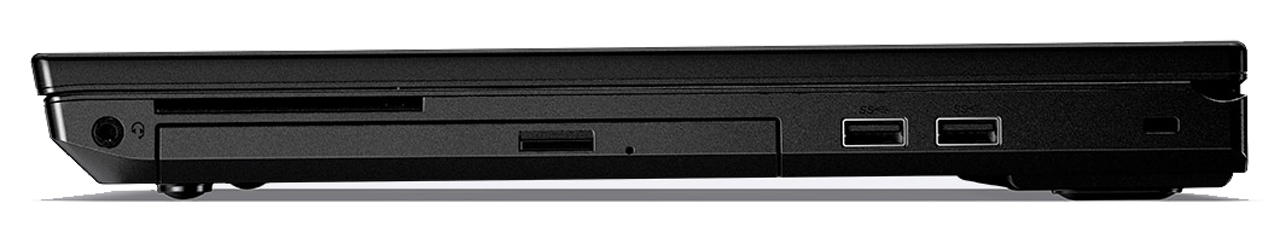
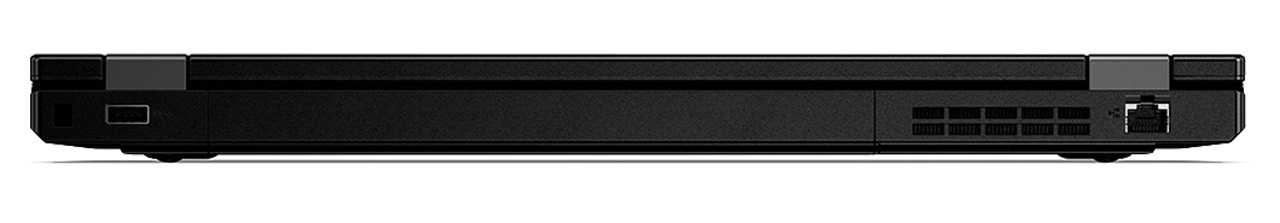
El Lenovo ThinkPad L560 es un digno sucesor del ThinkPad L540. Al usar procesadores ULV más frugales, Lenovo lo ha hecho todo bien en este dispositivo. El menor consumo de energía se refleja en el buen aguante de batería. El precio agresivo de menos de 1000 Euros debería atraer compradores. La ampliabilidad de los modelos ThinkPad es buena y no se han desatendido las características de seguridad. Difícilmente cabe quejarse de la buena distribución de interfaces. Lo que es más, la conectividad puede ampliarse usando una base anclable.
Con la mejora de Haswell a Skylake, Lenovo ha tomado la decisión adecuada, pero al ThinkPad L560 le faltan ciertos detalles menores para ser un portátil business realmente bueno.
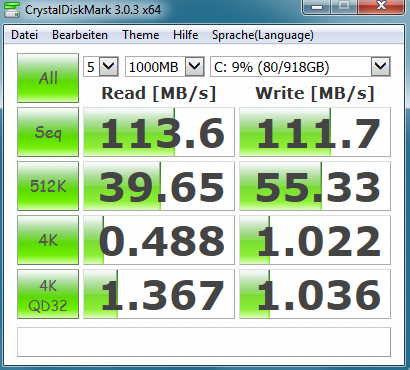
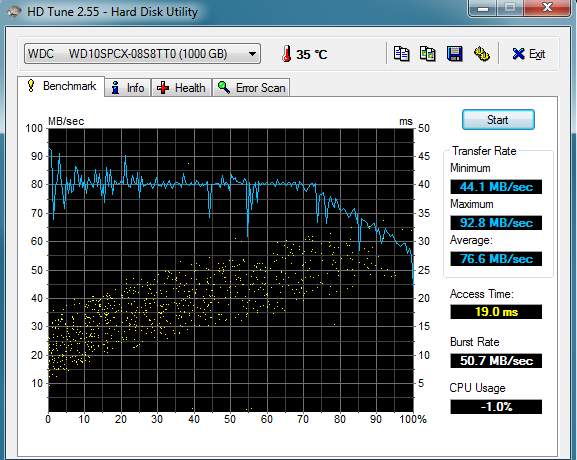
No obstante, hay varios puntos de crítica incluyendo el display relativamente malo. Si bien ofrece amplios ángulos de visión, su rendimiento en cobertura de color es meramente modesto. Además, el brillo del display esta en la media, lo que dificulta trabajar en ambientes muy luminosos. El uso de un SSD aumentaría el rendimiento del sistema. Nos babría gustado que el teclado tuviera una sutil retroiluminación para una mejor legibilidad en ambientes oscuros.
A pesar de las críticas, el Lenovo ThinkPad L560 es un buen portátil business. El rendimiento del frugal SoC Skylake es más que suficiente para las tareas ofimáticas diarias. Los que no puedan pasar sin una base anclable o el TrackPoint prácticamente no tendrán más alternativas que los modelos ThinkPad.
Ésta es una versión acortada del análisis original. Puedes leer el análisis completo en inglés aquí.
Lenovo ThinkPad L560-20F10026GE
- 05/03/2016 v5.1 (old)
Sebastian Bade