Análisis del MSI GE76 Raider 11UH: El portátil para juegos de gama alta ofrece una pantalla rápida de 360 Hz

Ya pudimos hacernos una idea del idéntico predecesor del GE76 Raider 11UH con el MSI GE76 Raider 10UH. Esperamos encontrar sus buenas características también en nuestra muestra de revisión actual, que está equipada con una CPU más actualizada en forma de unIntel Core i9-11980HK y la misma unidad gráfica en forma de la Nvidia GeForce RTX 3080. Además, hay 64 GB de RAM, y un SSD de 2 TB.
Dado que nada ha cambiado externamente, apuntamos al análisis delMSI GE76 Raider 10UH en las secciones correspondientes del análisis. Además, elegimos los dispositivos de la competencia listados a continuación para la comparación, a los que se pueden añadir portátiles adicionales de nuestra base de datos en cada sección.
Actualización el 16/08/2021: Evaluación del rendimiento de la CPU del modelo de producción en la sección "Rendimiento"
Possible contenders in comparison
Valoración | Fecha | Modelo | Peso | Altura | Tamaño | Resolución | Precio |
|---|---|---|---|---|---|---|---|
| 86.2 % v7 (old) | 09/2021 | MSI GE76 Raider 11UH-472US i9-11980HK, GeForce RTX 3080 Laptop GPU | 3 kg | 27.4 mm | 17.30" | 1920x1080 | |
| 87.1 % v7 (old) | 03/2021 | MSI GE76 Raider 10UH i7-10870H, GeForce RTX 3080 Laptop GPU | 3 kg | 27.4 mm | 17.30" | 1920x1080 | |
| 88 % v7 (old) | 05/2021 | Gigabyte Aero 17 HDR YD i9-11980HK, GeForce RTX 3080 Laptop GPU | 2.8 kg | 22 mm | 17.30" | 3840x2160 | |
| 85.3 % v7 (old) | 04/2021 | Alienware m17 R4 i9-10980HK, GeForce RTX 3080 Laptop GPU | 3 kg | 22 mm | 17.30" | 1920x1080 |
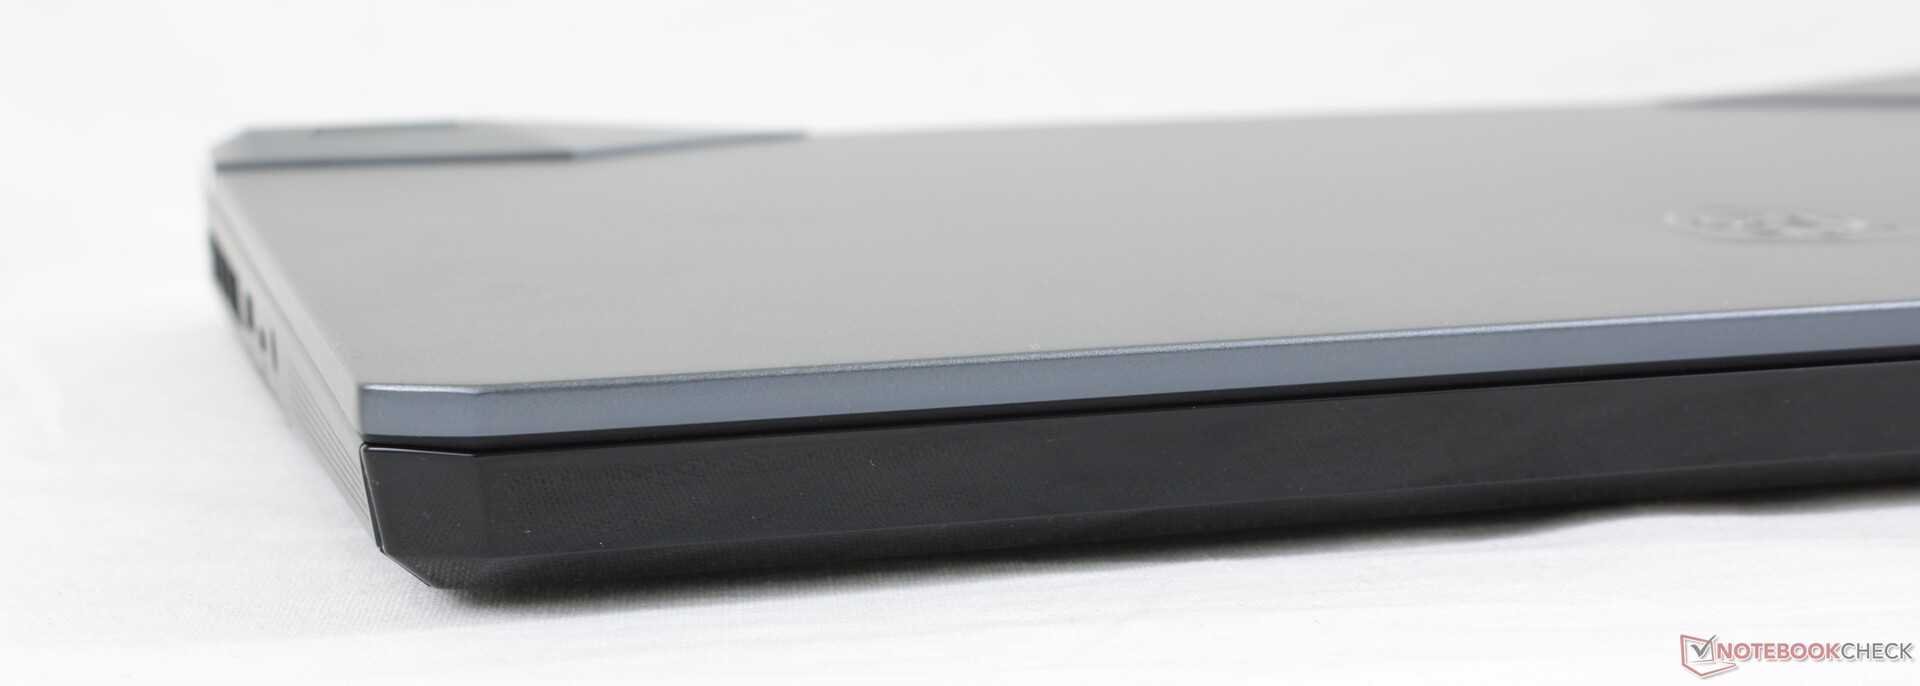
Maletín - Portátil para juegos grande y resistente
Puede encontrar una descripción detallada de la carcasa en el análisis de la MSI GE76 Raider 10UH
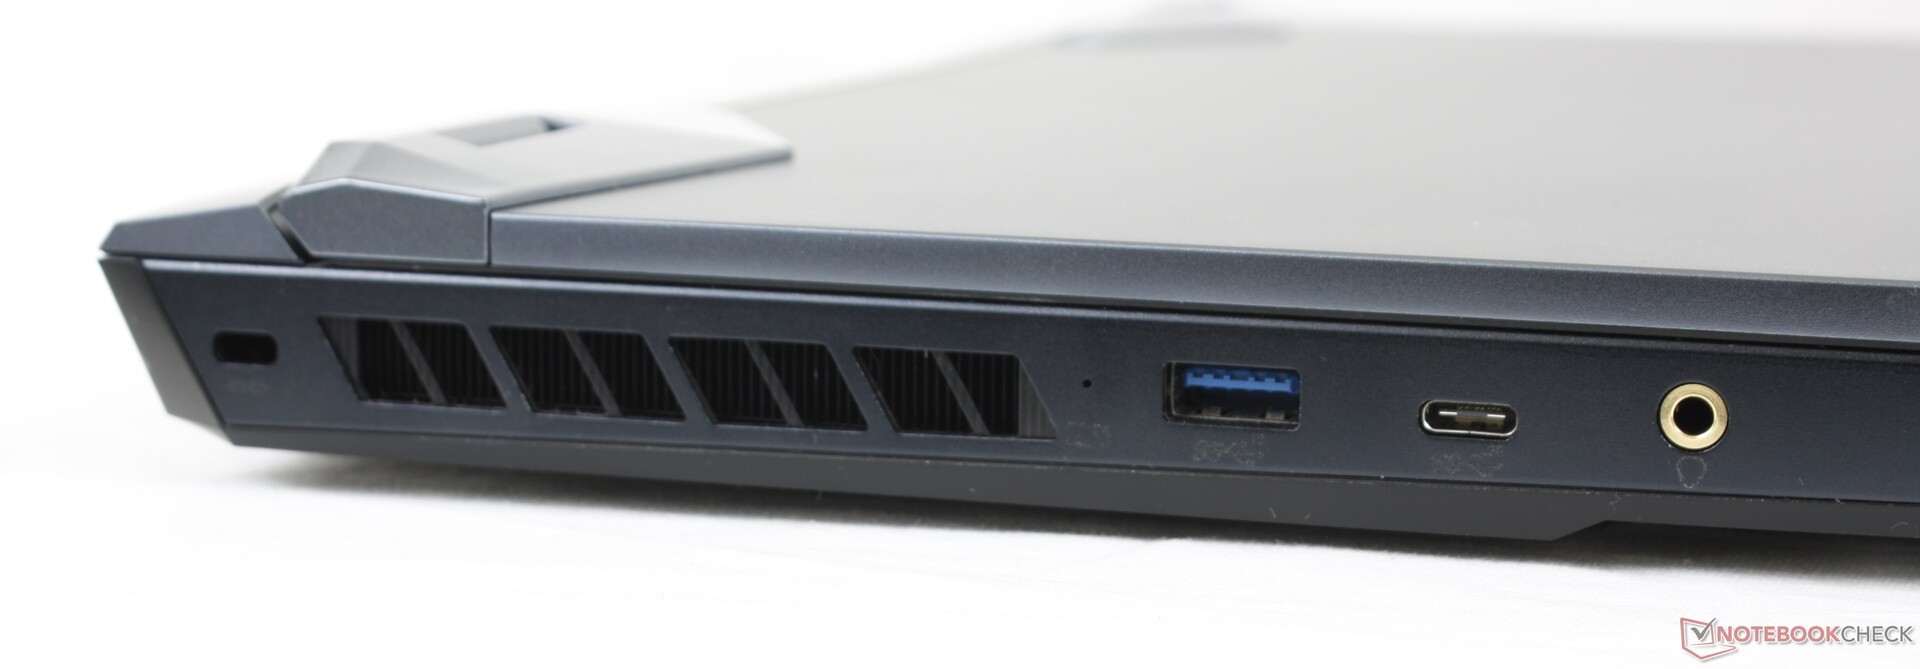
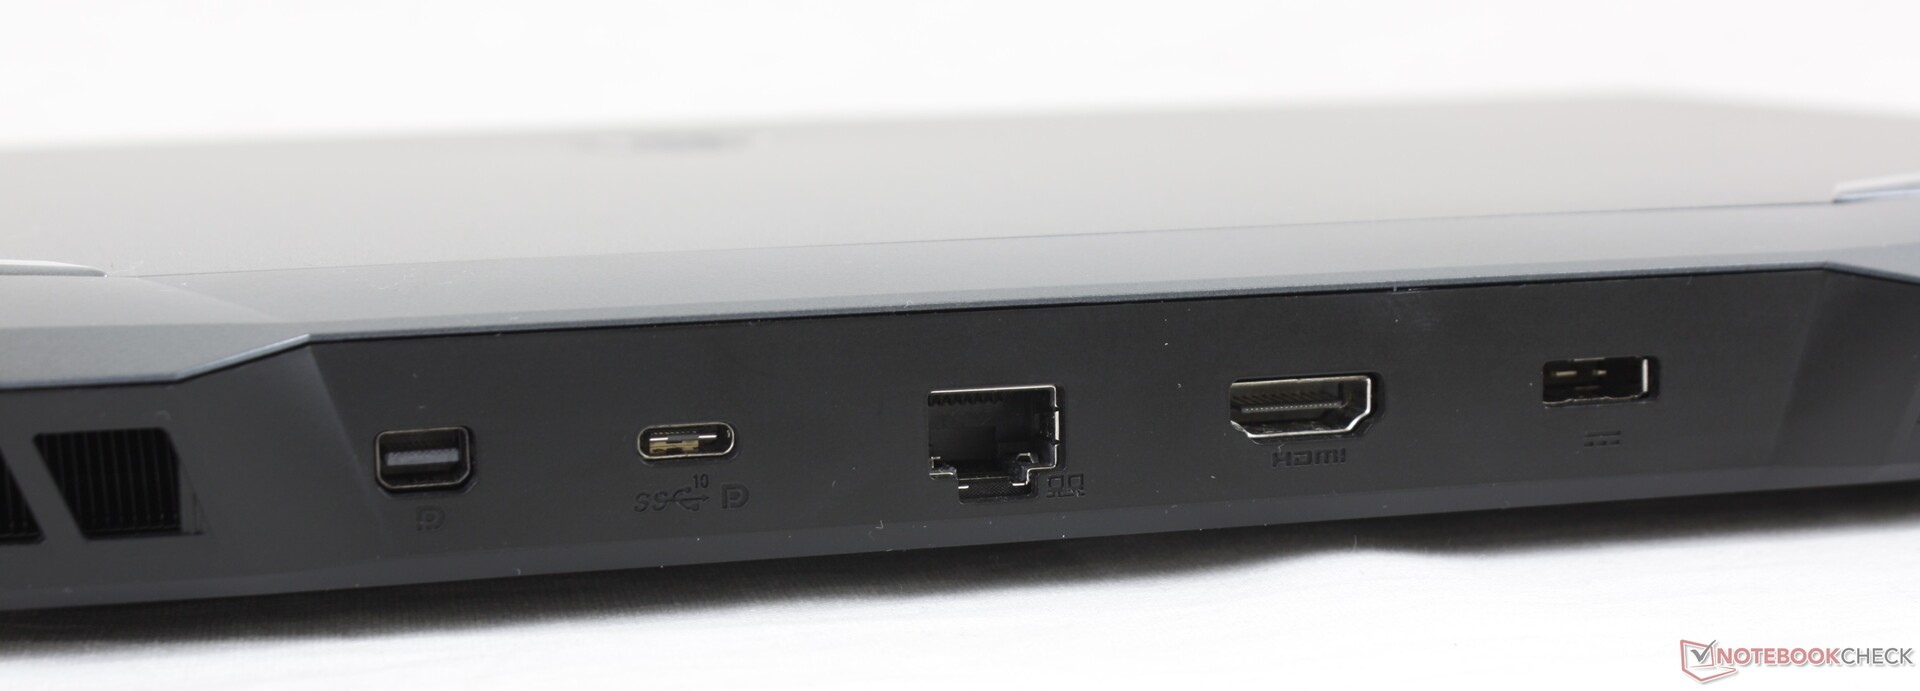
Conectividad - GE76 Raider ofrece Thunderbolt 4 y Wi-Fi 6E
Aunque la selección de puertos se ha mantenido igual en comparación con el GE76 Raider 10UH, el puerto USB-C trasero ahora cuenta con el estándar Thunderbolt 4
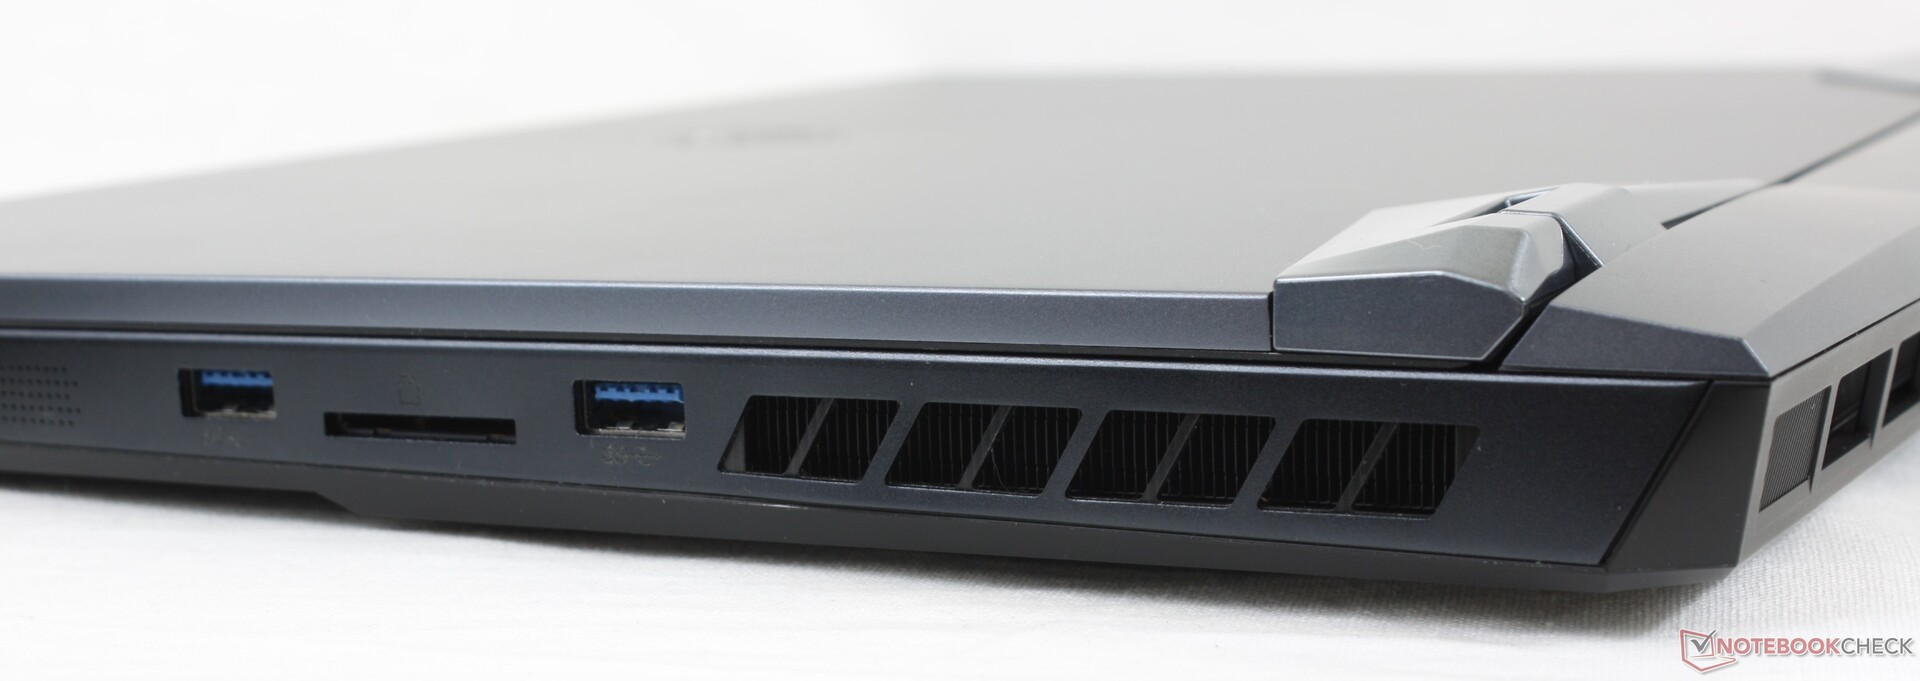
Lector de tarjetas SD
El lector de tarjetas SD del GE76 Raider 11UH alcanza 77 MB/s para copiar y 88 MB/s para leer datos con nuestra tarjeta de memoria de referencia, la microSD AV Pro V60 de 128 GB. Aunque estas tasas son pasables, son significativamente inferiores a las del predecesor
| SD Card Reader | |
| average JPG Copy Test (av. of 3 runs) | |
| MSI GE76 Raider 10UH (Toshiba Exceria Pro SDXC 64 GB UHS-II) | |
| Alienware m17 R4 (AV PRO microSD 128 GB V60) | |
| Gigabyte Aero 17 HDR YD (AV PRO microSD 128 GB V60) | |
| Media de la clase Gaming (20.9 - 210, n=54, últimos 2 años) | |
| MSI GE76 Raider 11UH-472US (AV PRO microSD 128 GB V60) | |
| maximum AS SSD Seq Read Test (1GB) | |
| Alienware m17 R4 (AV PRO microSD 128 GB V60) | |
| MSI GE76 Raider 10UH (Toshiba Exceria Pro SDXC 64 GB UHS-II) | |
| Gigabyte Aero 17 HDR YD (AV PRO microSD 128 GB V60) | |
| Media de la clase Gaming (25.5 - 261, n=51, últimos 2 años) | |
| MSI GE76 Raider 11UH-472US (AV PRO microSD 128 GB V60) | |
Comunicación
El MSI GE76 Raider 11UH puede establecer conexiones inalámbricas a través de Bluetooth 5.2 y Wi-Fi 6E. Con nuestro router de referencia Netgear Nighthawk AX12, se logran muy buenas velocidades de 1,396 Mb/s para transmitir datos y 1,343 Mb/s para recibirlos. Esto hace que el portátil de juegos MSI sea ligeramente más rápido que su predecesor
Cámara web
Con una resolución de 2,1 MP, MSI ha instalado una webcam ligeramente más potente que la mayoría de los fabricantes de portátiles, pero la calidad de la imagen es bastante mediocre incluso en condiciones de buena iluminación


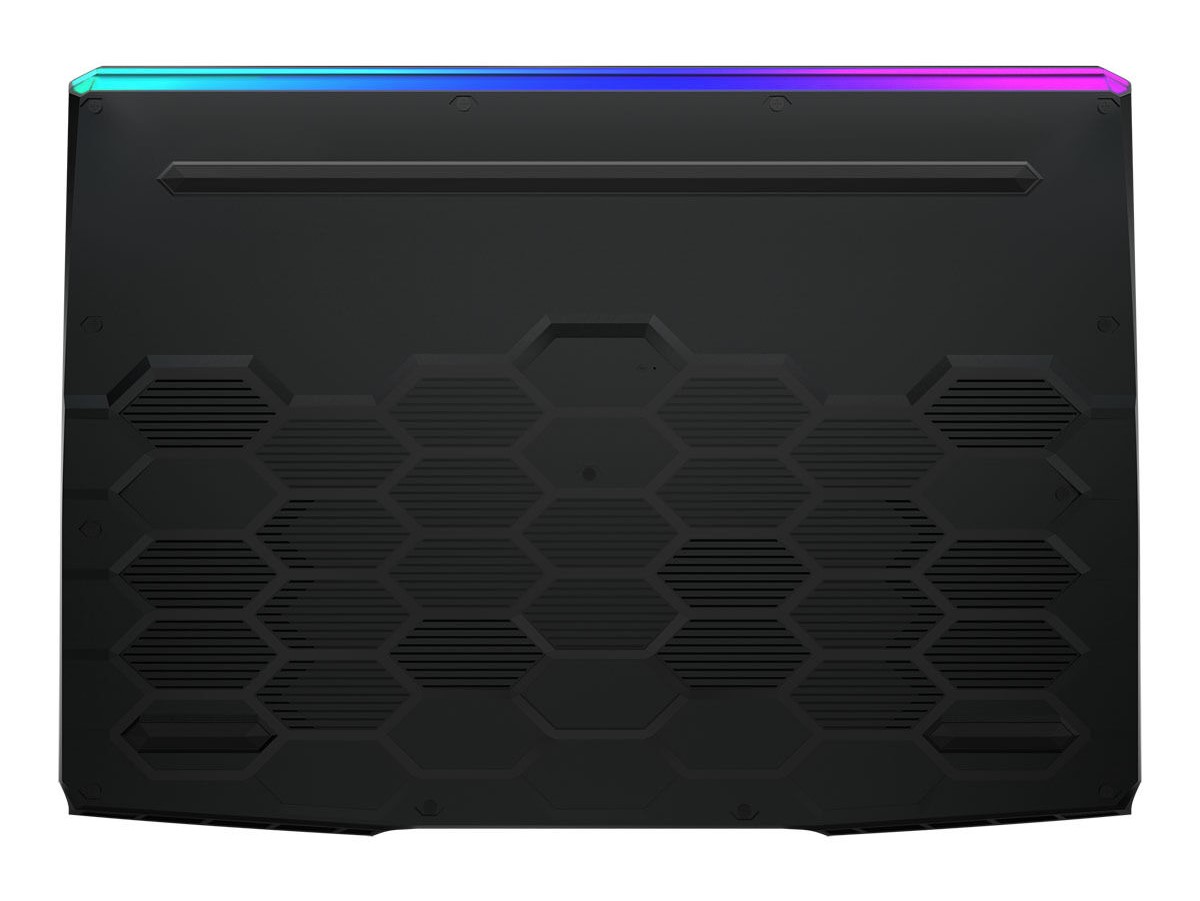
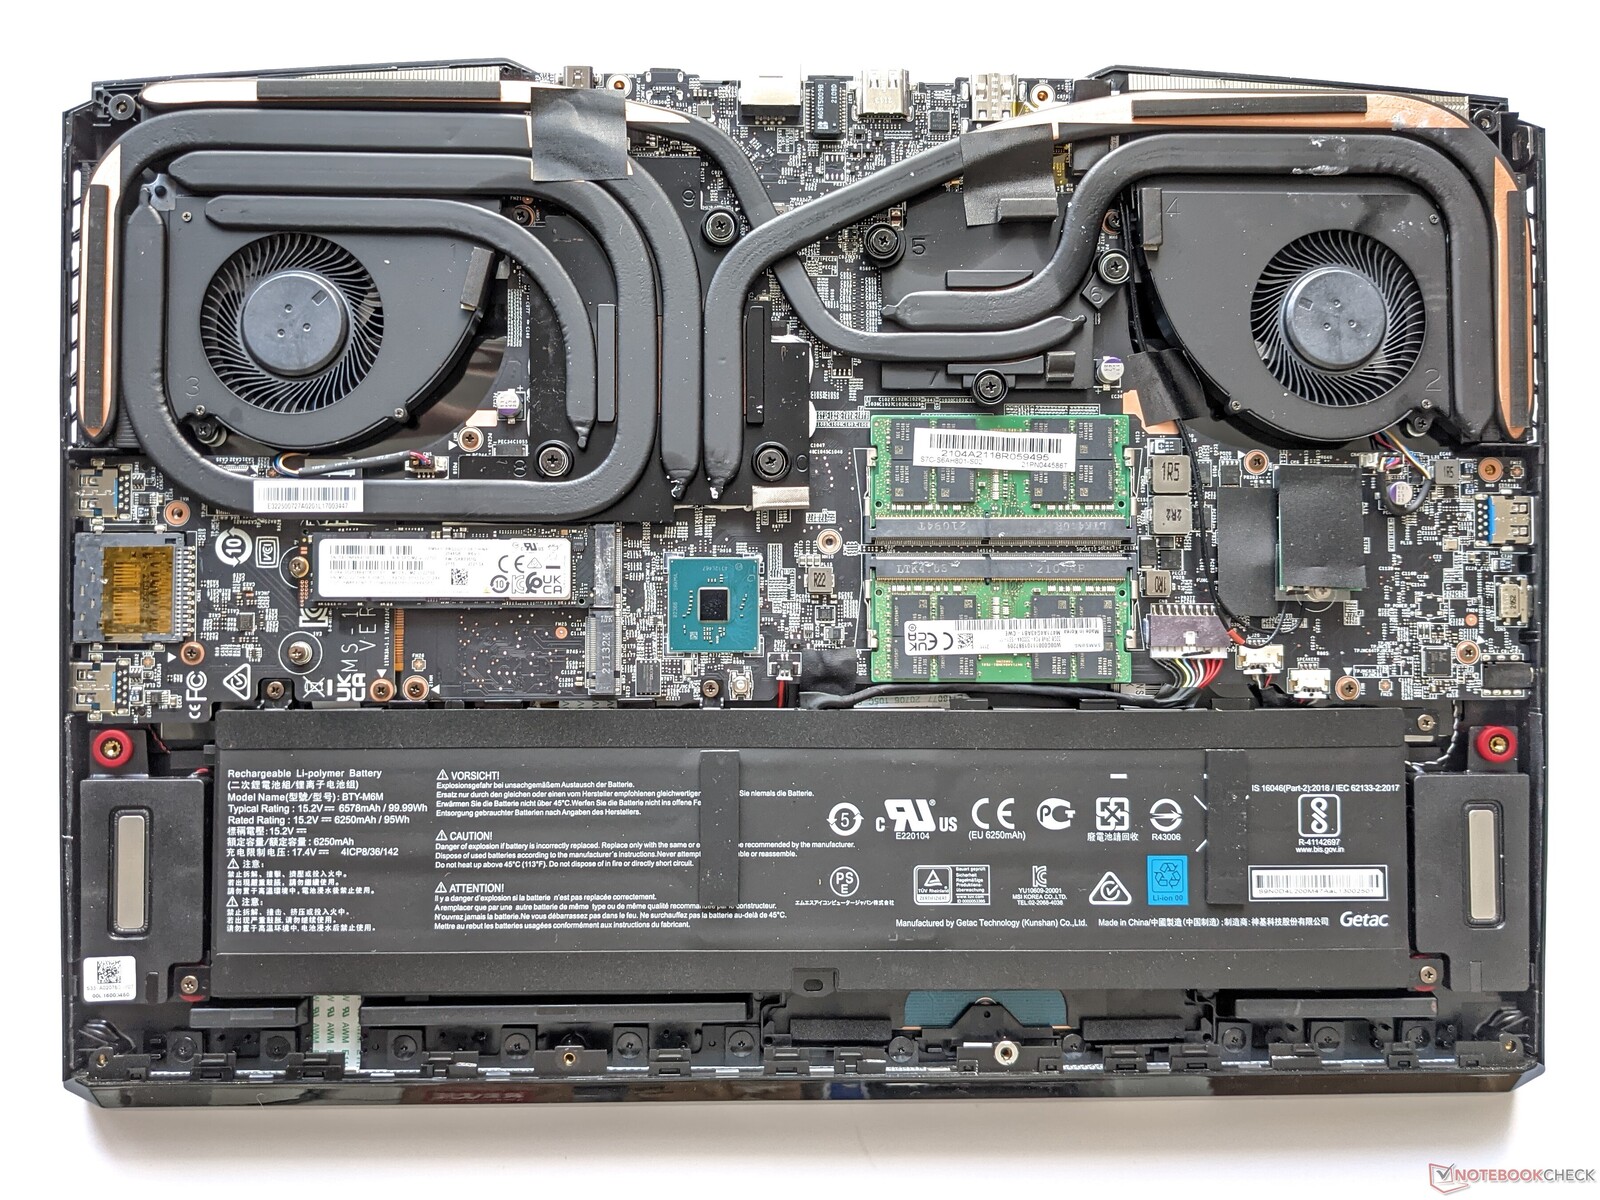
Mantenimiento
El MSI GE76 Raider 11UH se puede abrir tras quitar todos los tornillos de la parte inferior. Esto da acceso a dos SSD y dos ranuras de RAM
Garantía
Además del propio portátil, el GE76 Raider 11UH viene con el adaptador de corriente adecuado. El fabricante también ofrece un periodo de garantía de 24 meses
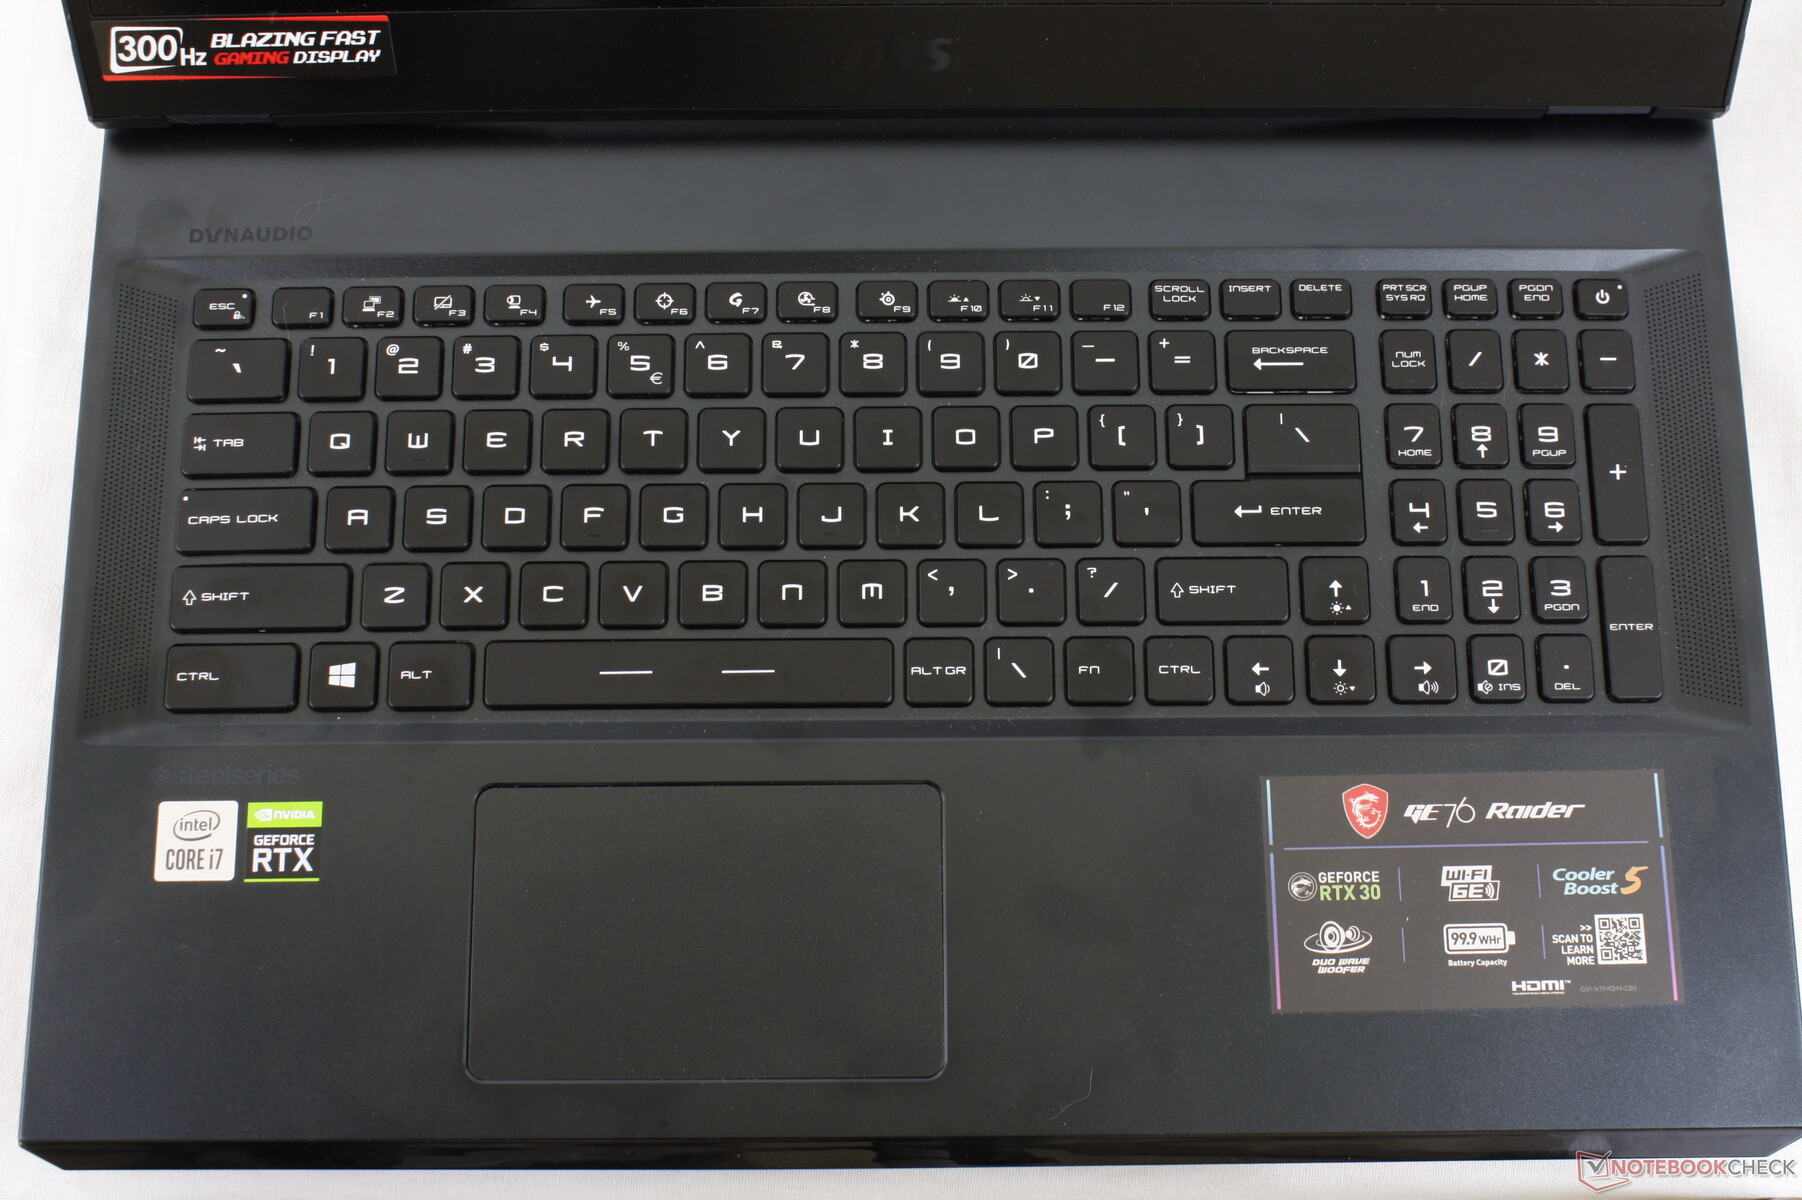
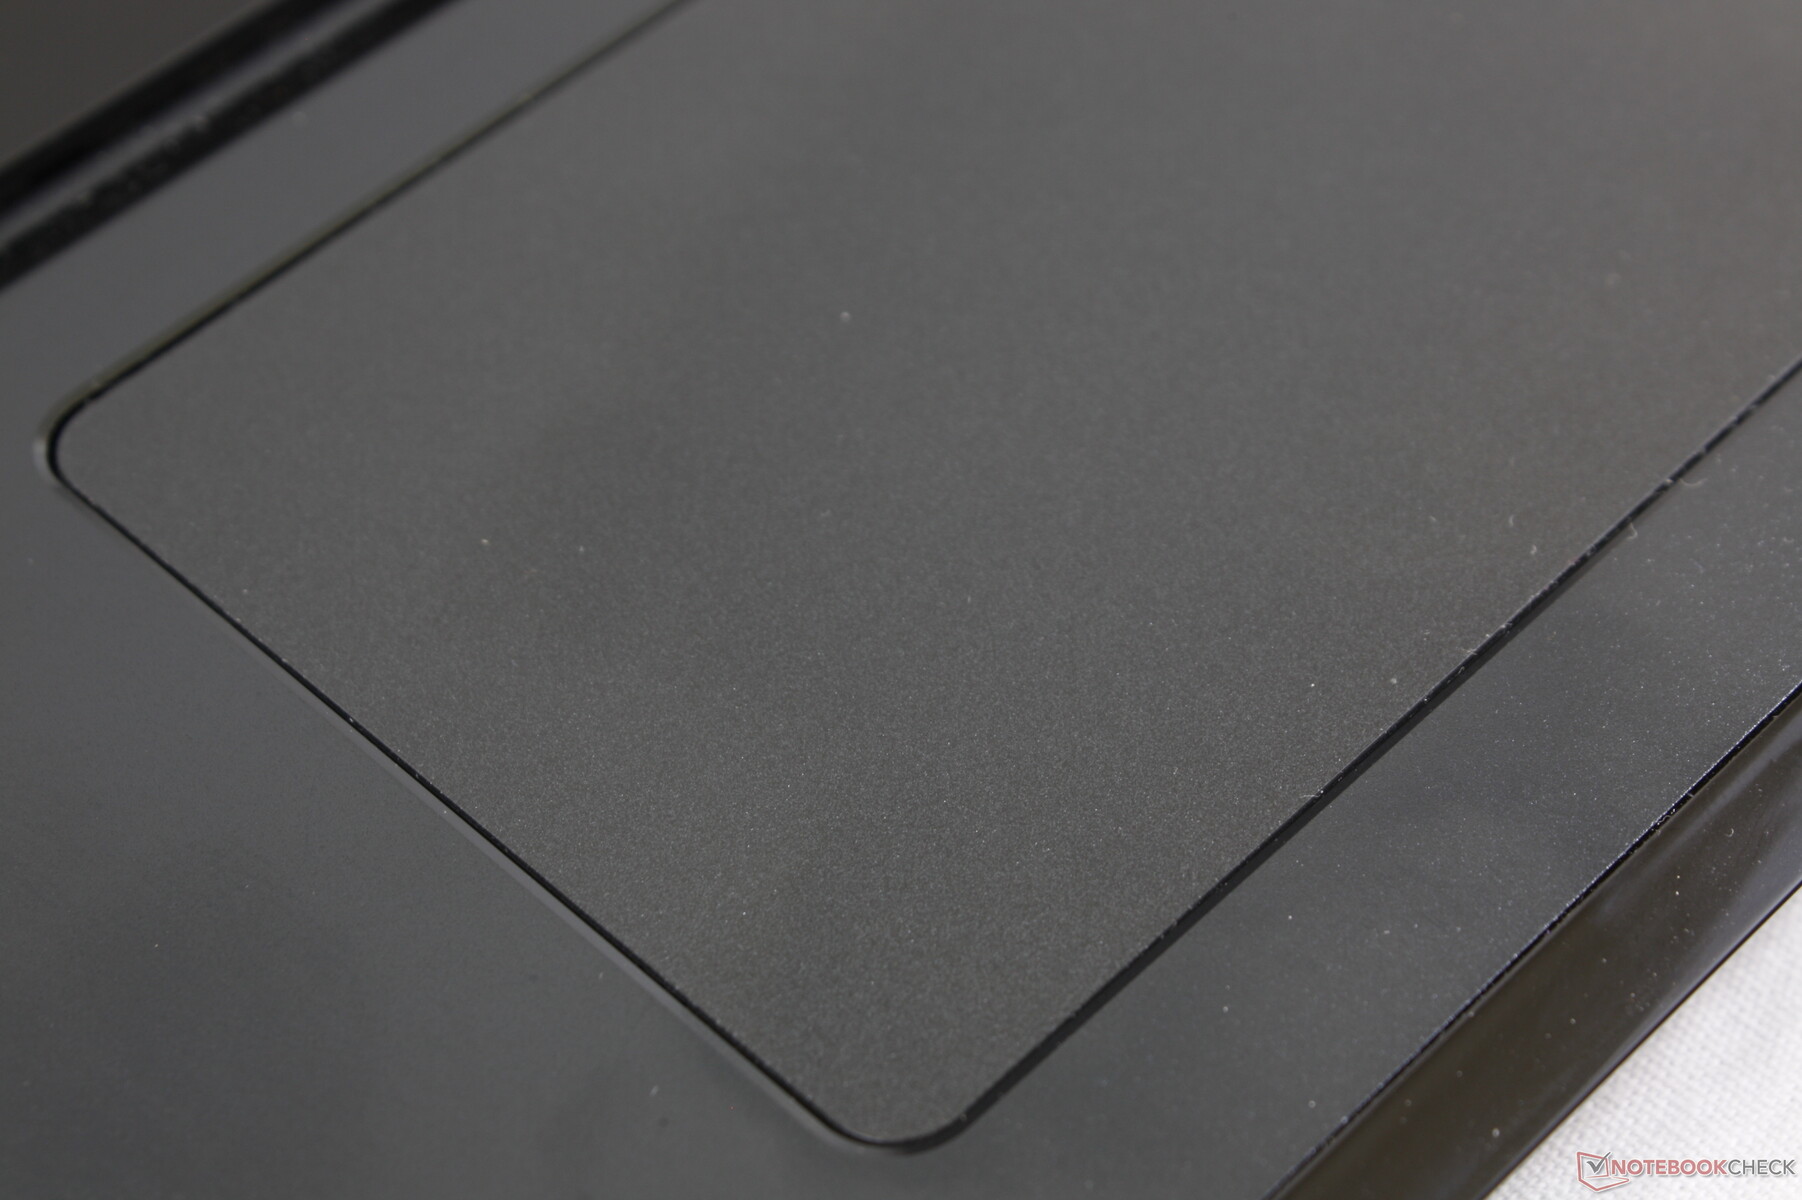
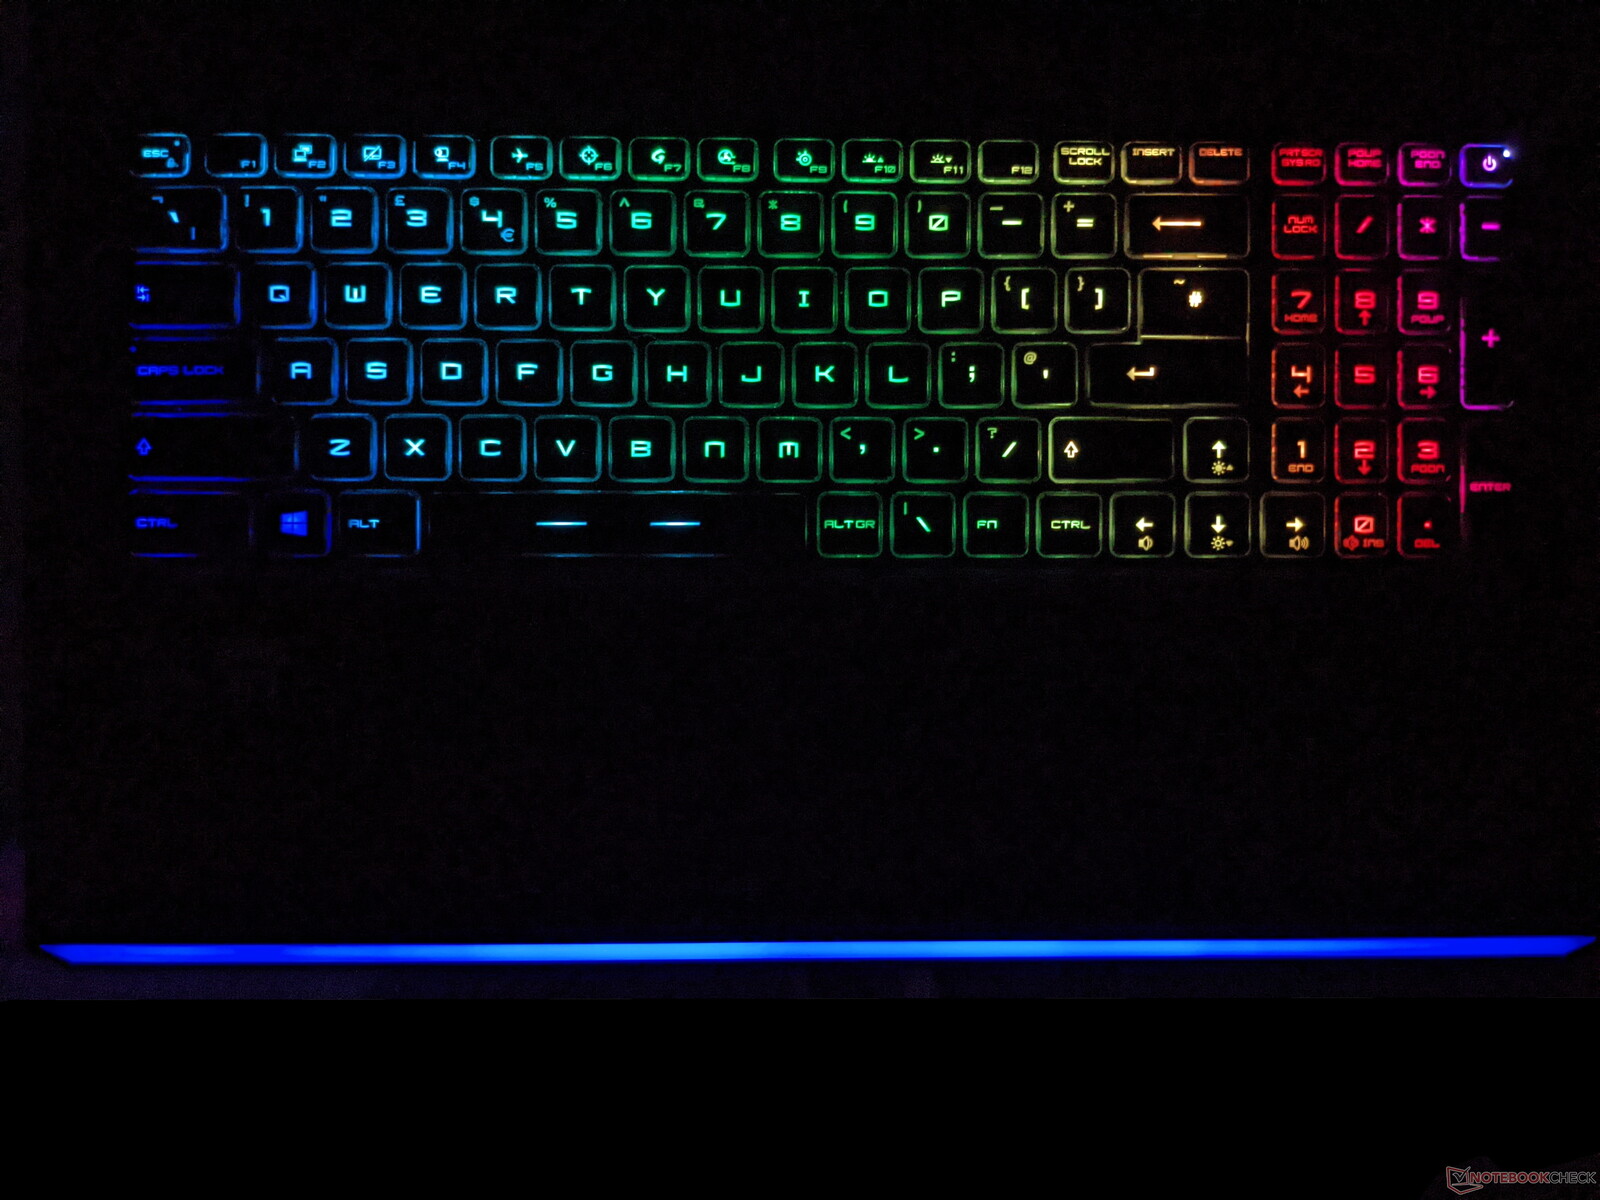
Dispositivos de entrada - Un buen teclado y un ClickPad preciso
Puede encontrar una descripción detallada de los dispositivos de entrada en el análisis del MSI GE76 Raider 10UH
Pantalla - Panel IPS con 360 Hz
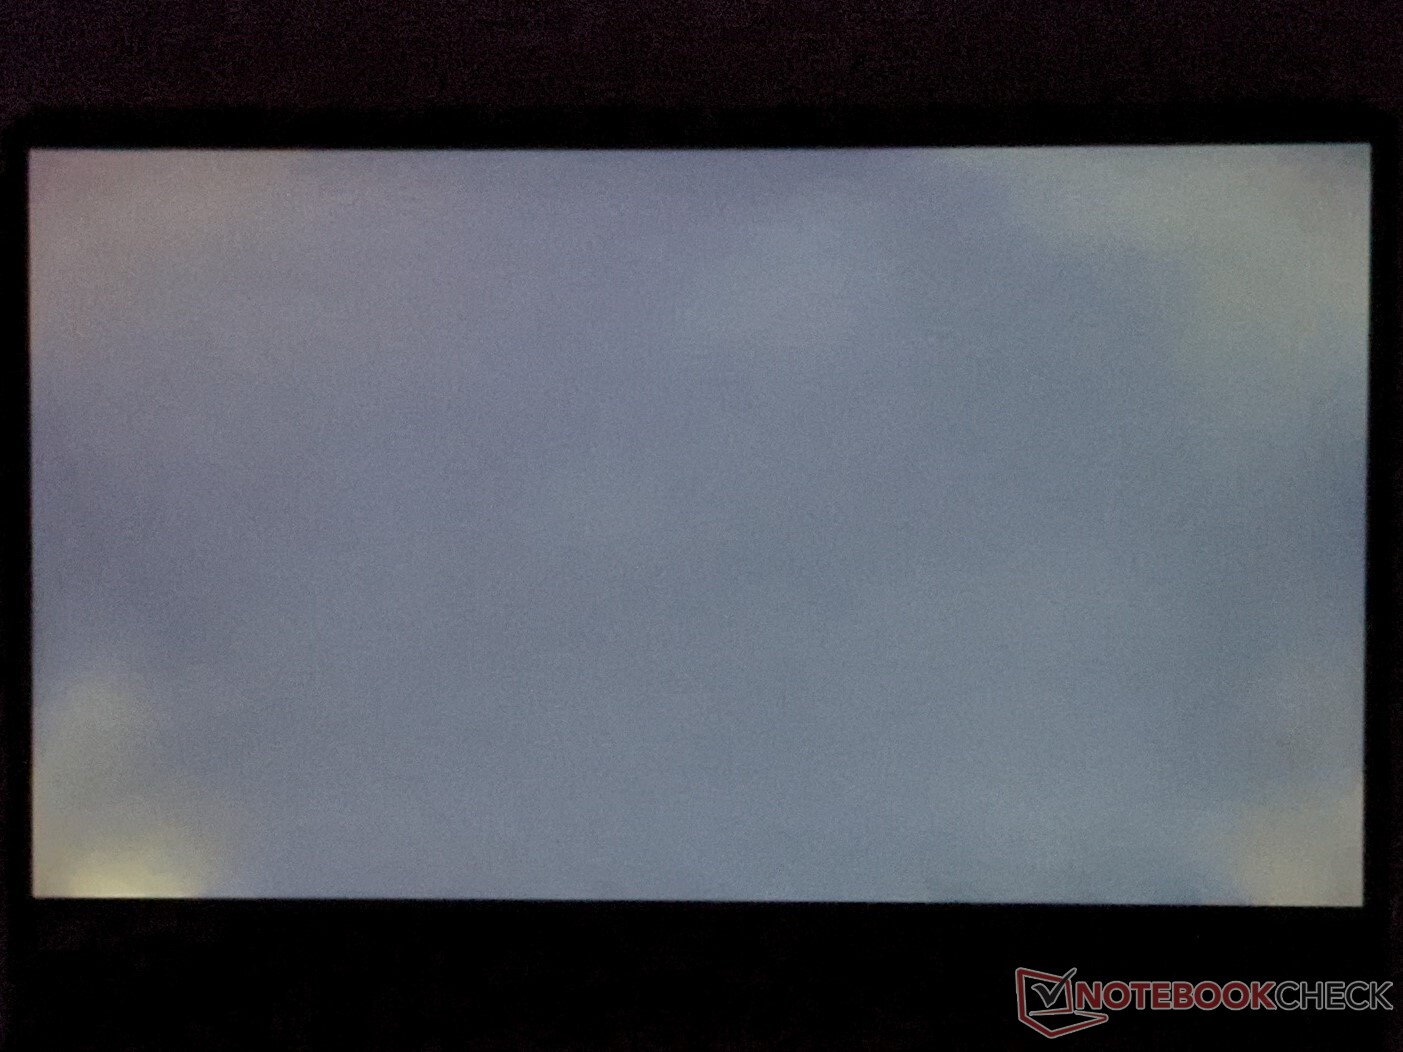
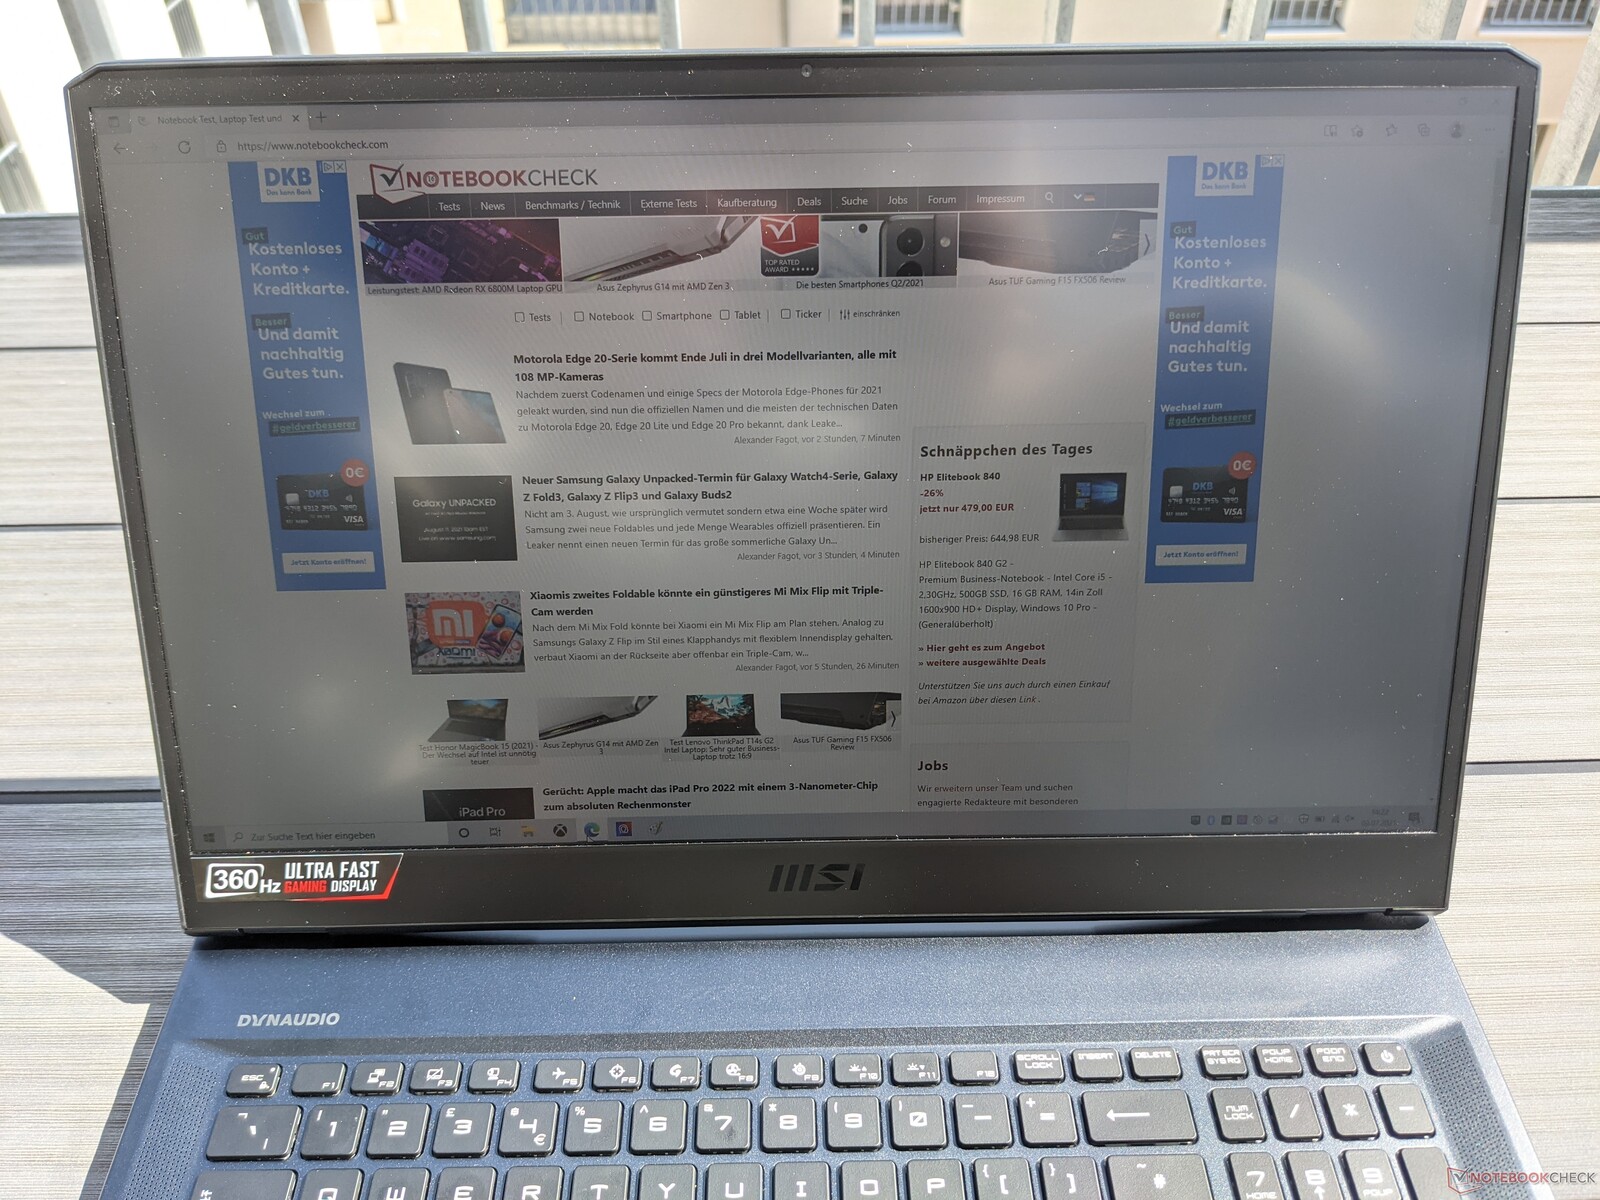
La pantalla del MSI GE76 Raider 11UH consiste en un panel IPS de 17.3 pulgadas con una resolución de 1920x1080 pixeles y una tasa de refresco de 360 Hz. Aunque el brillo máximo de 295 cd/m² es decente, sigue siendo el más bajo de nuestro campo de pruebas. La distribución del brillo del 96% es muy buena. Además, MSI se abstiene de usarPWM para el control del brillo.
Además del panel instalado aquí, el GE76 Raider 11UH también se ofrece con resolución UHD (3840x2160 pixels) y 120 Hz, así como con resolución QHD (2560x1440 pixels) y 165 Hz o 240 Hz
| |||||||||||||||||||||||||
iluminación: 96 %
Brillo con batería: 301 cd/m²
Contraste: 1204:1 (Negro: 0.25 cd/m²)
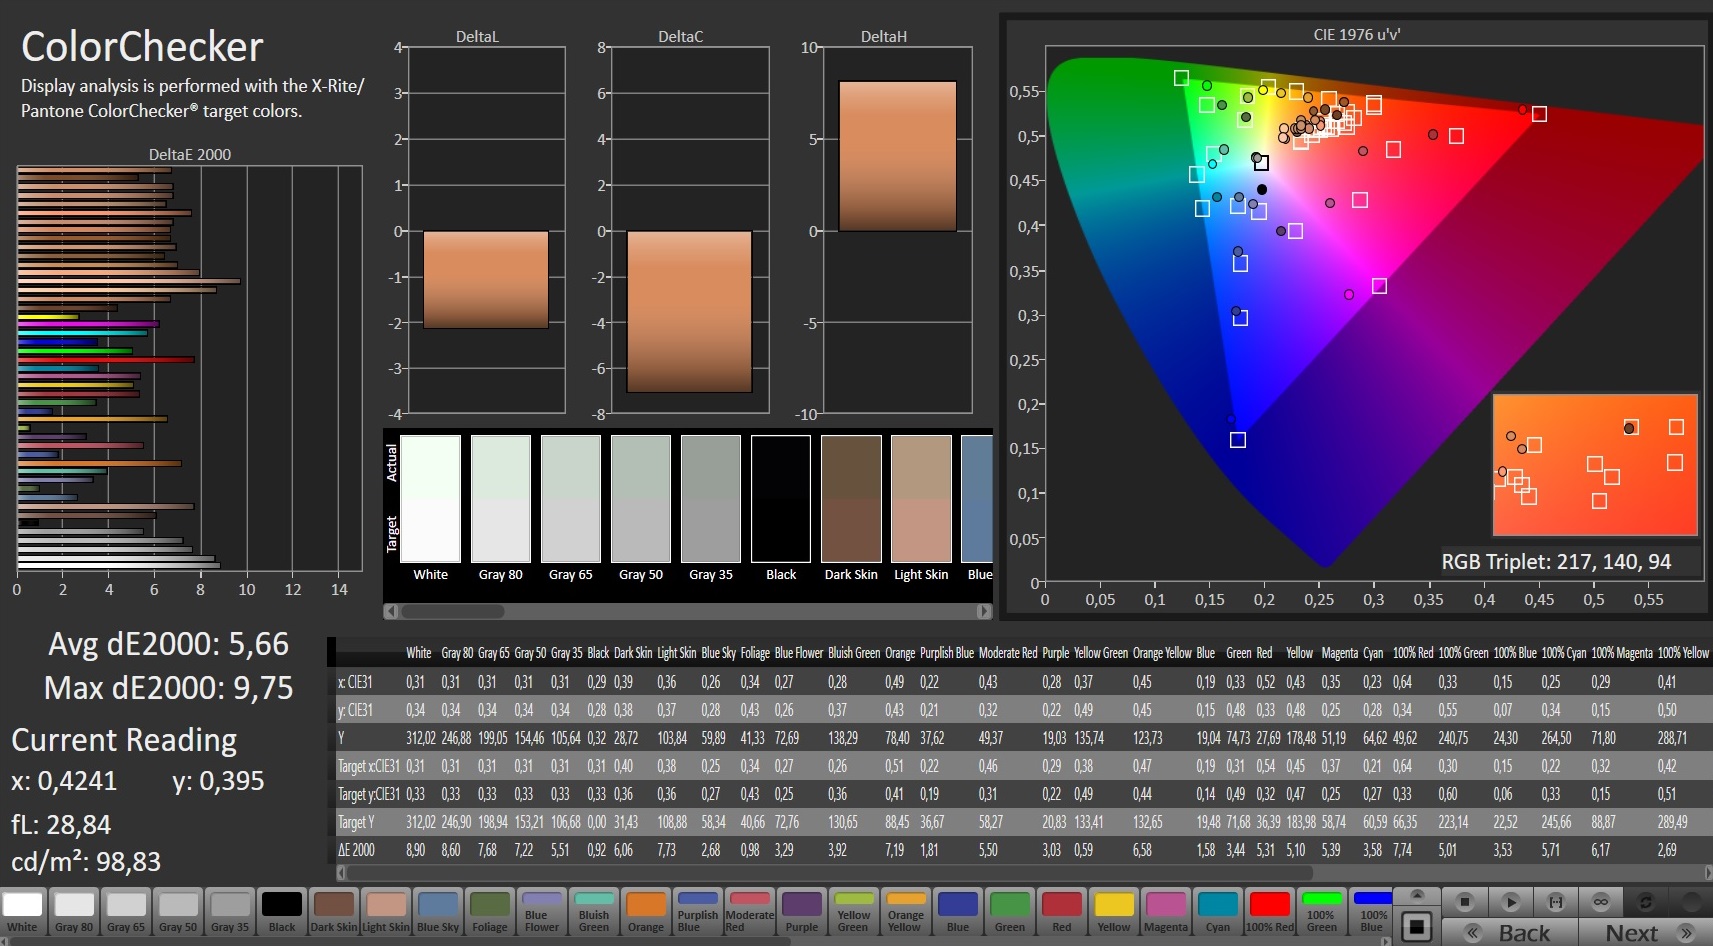
ΔE ColorChecker Calman: 5.66 | ∀{0.5-29.43 Ø4.72}
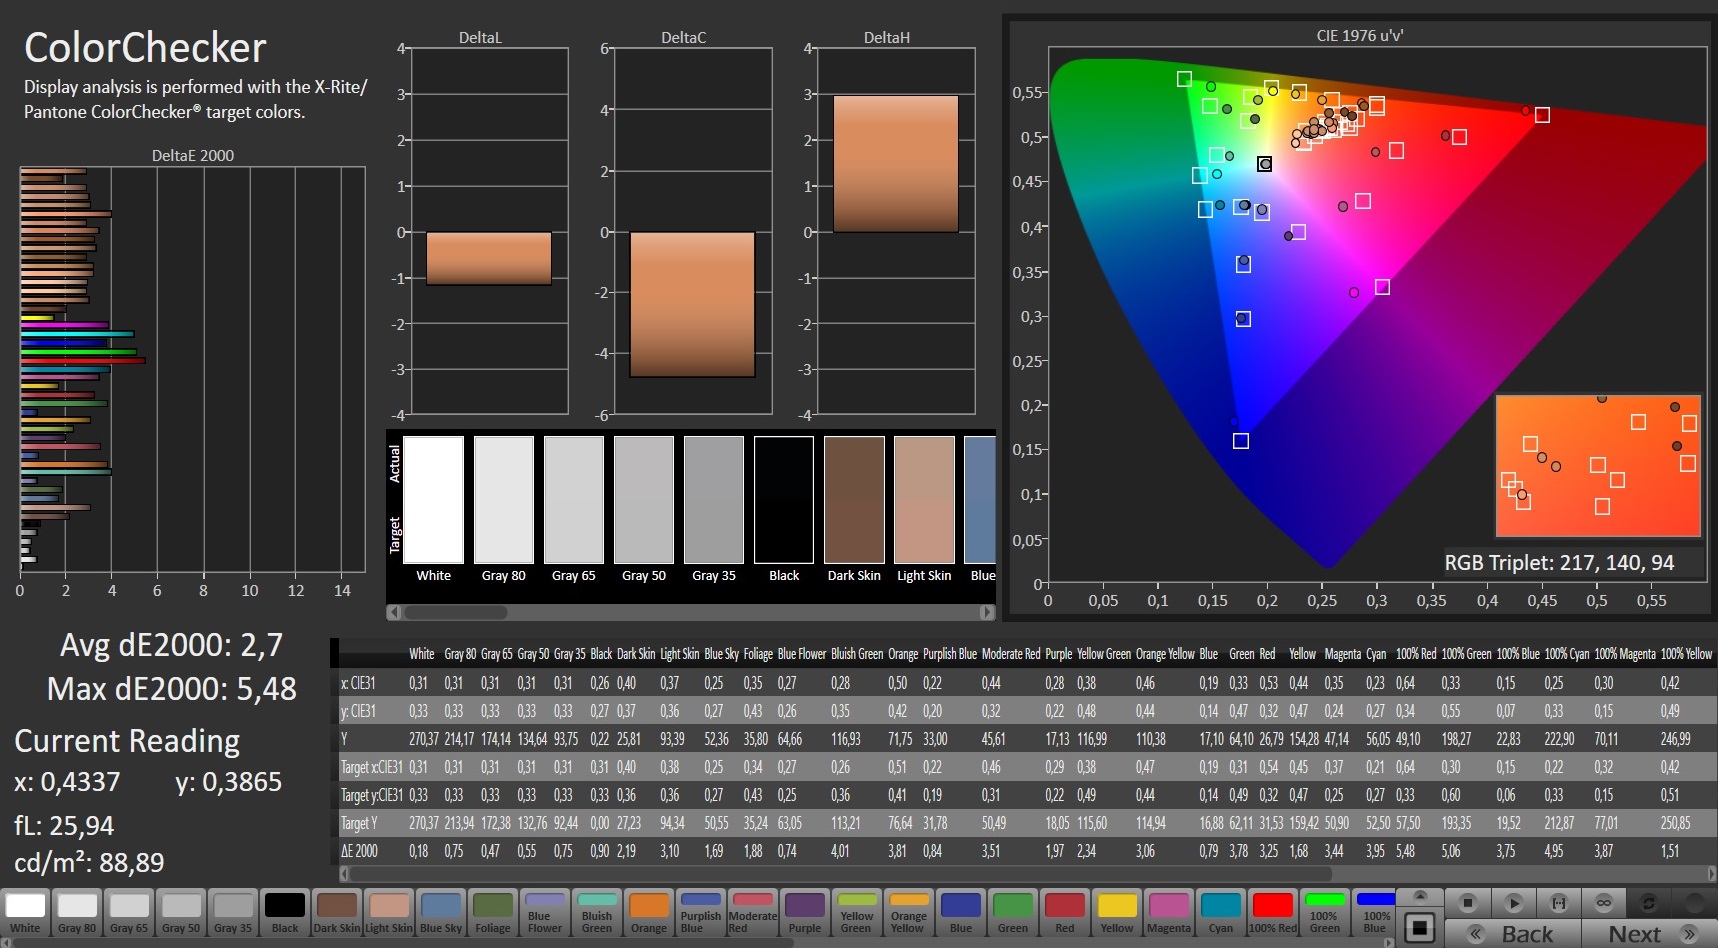
calibrated: 2.7
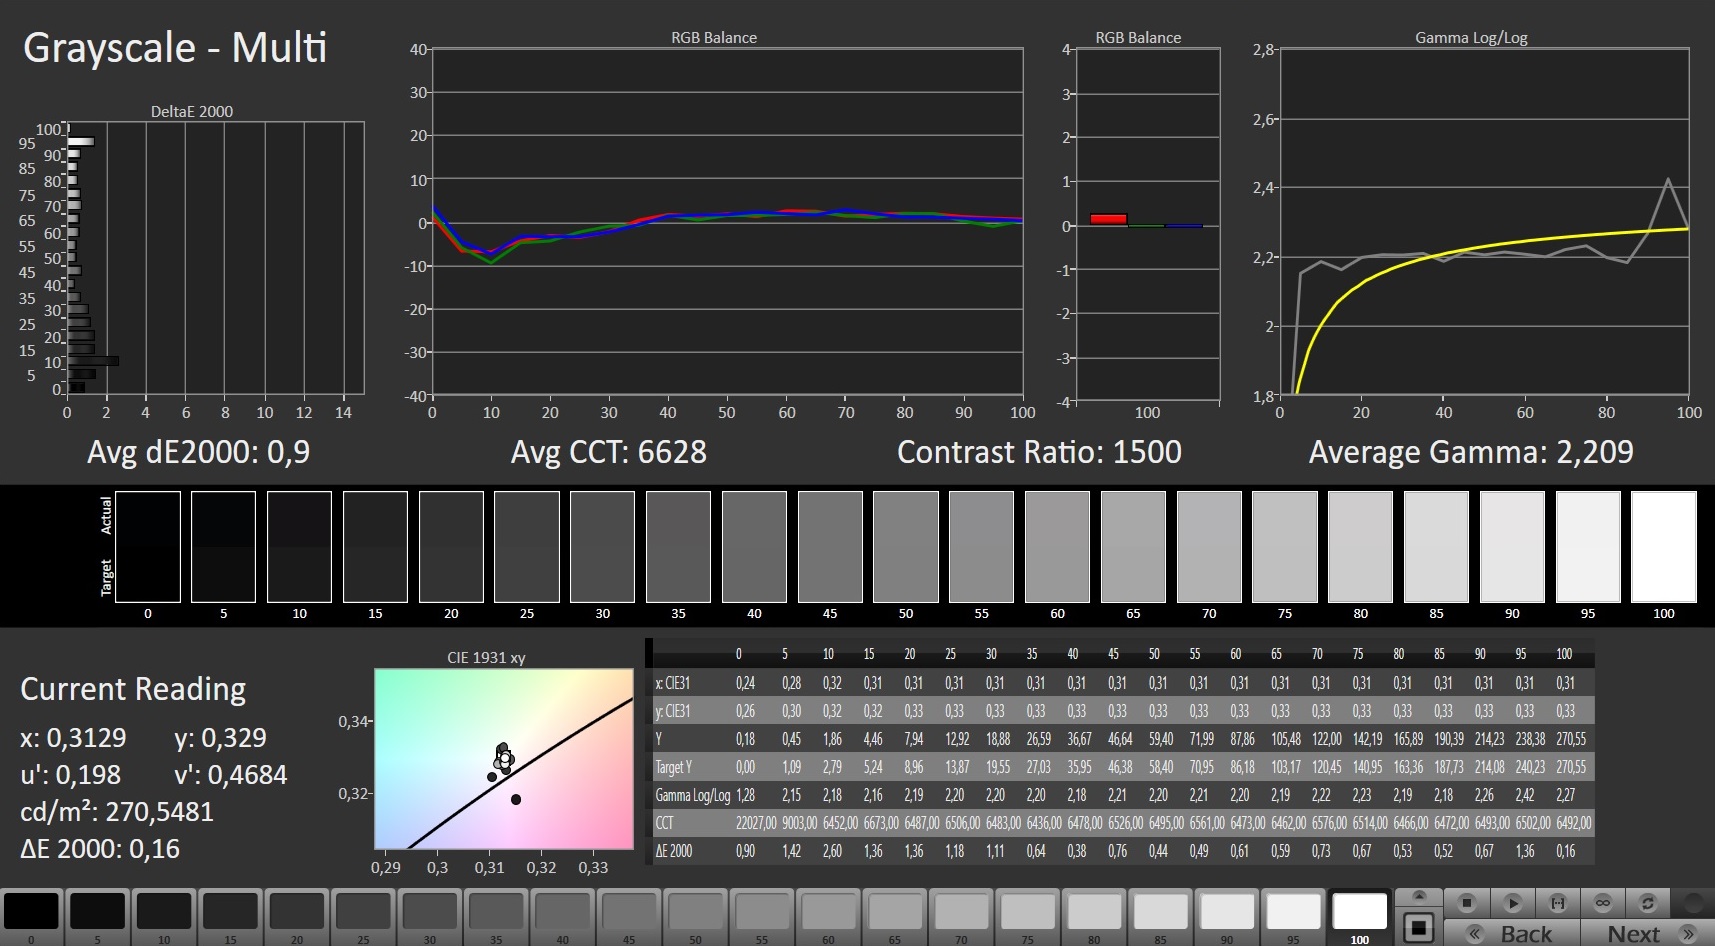
ΔE Greyscale Calman: 5.2 | ∀{0.09-98 Ø4.97}
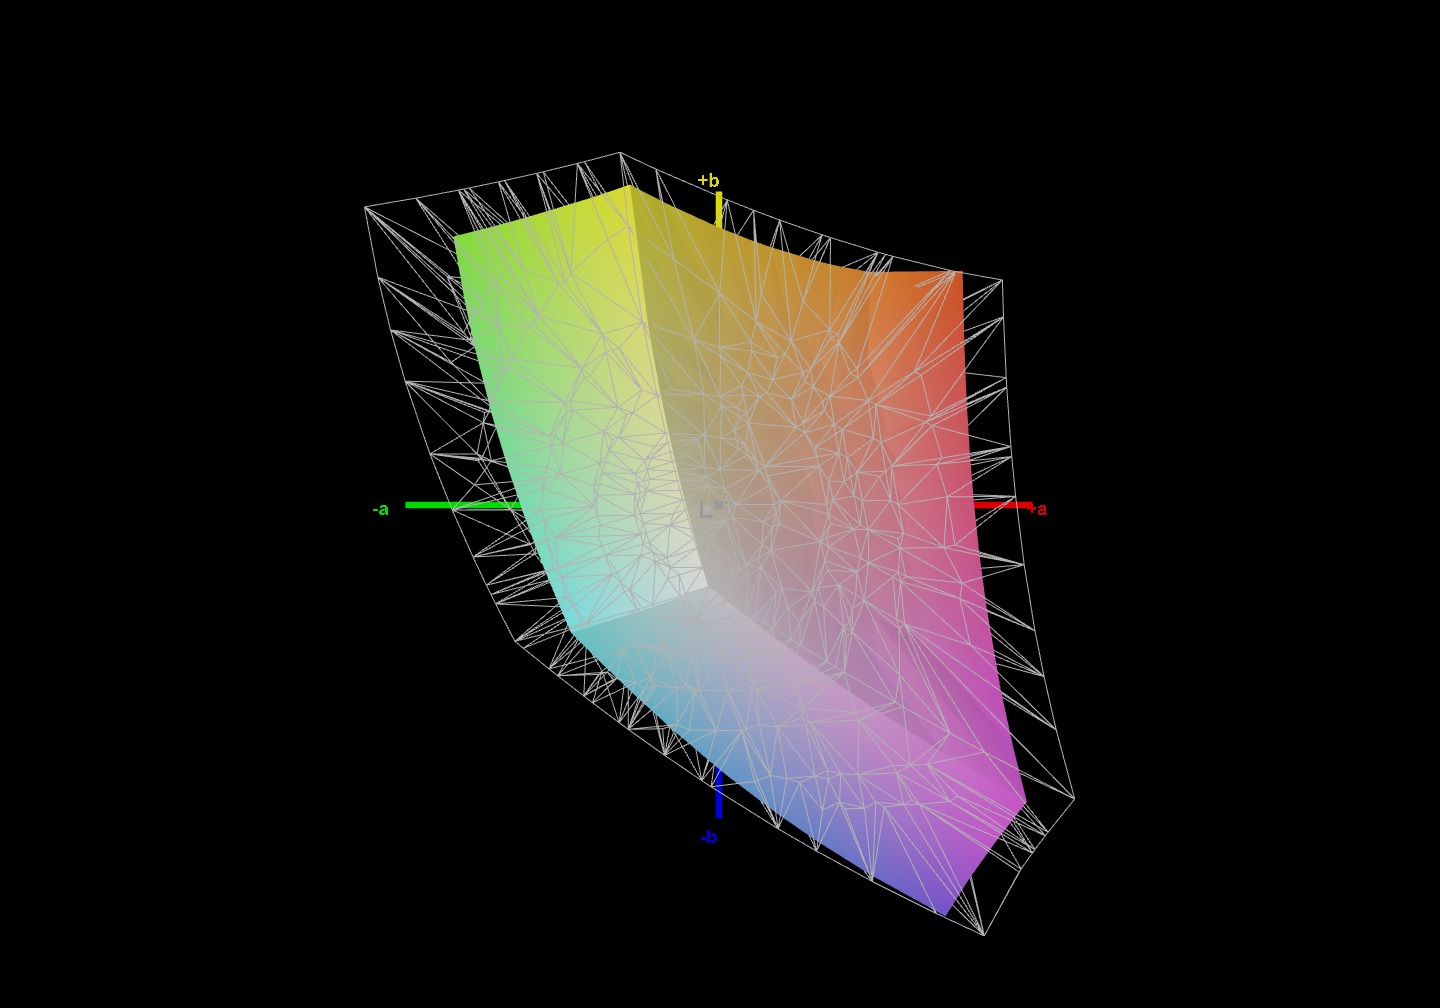
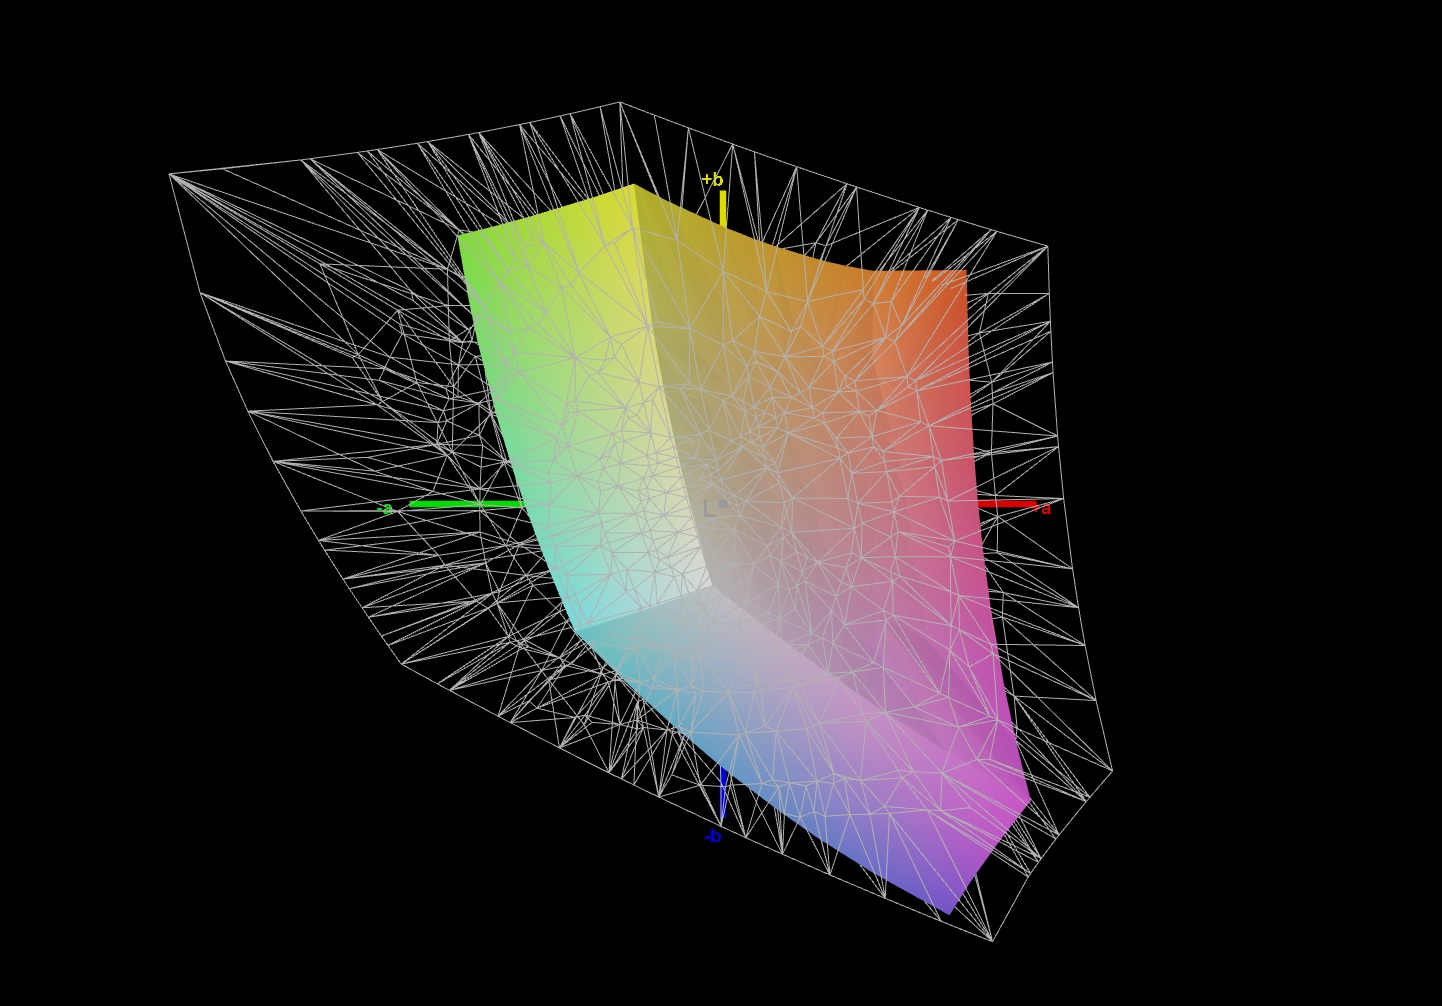
51.2% AdobeRGB 1998 (Argyll 3D)
74.4% sRGB (Argyll 3D)
49.6% Display P3 (Argyll 3D)
Gamma: 2.225
CCT: 6566 K
| MSI GE76 Raider 11UH-472US AU Optronics AUOE295, IPS, 1920x1080, 17.3" | MSI GE76 Raider 10UH AU Optronics B173HAN05.1, IPS, 1920x1080, 17.3" | Gigabyte Aero 17 HDR YD AU Optronics AUO329B, IPS, 3840x2160, 17.3" | Alienware m17 R4 AU Optronics AUOEC91, IPS, 1920x1080, 17.3" | |
|---|---|---|---|---|
| Display | 40% | 68% | 38% | |
| Display P3 Coverage (%) | 49.6 | 71.8 45% | 86.9 75% | 69.8 41% |
| sRGB Coverage (%) | 74.4 | 98.1 32% | 100 34% | 99.7 34% |
| AdobeRGB 1998 Coverage (%) | 51.2 | 73.9 44% | 99.6 95% | 71.6 40% |
| Response Times | -108% | -432% | -47% | |
| Response Time Grey 50% / Grey 80% * (ms) | 6.4 ? | 20.4 ? -219% | 52 ? -713% | 13.2 ? -106% |
| Response Time Black / White * (ms) | 10.4 ? | 10 ? 4% | 26 ? -150% | 9.2 ? 12% |
| PWM Frequency (Hz) | 151500 | |||
| Screen | 5% | 43% | 37% | |
| Brightness middle (cd/m²) | 301 | 324.6 8% | 488 62% | 305 1% |
| Brightness (cd/m²) | 295 | 312 6% | 467 58% | 301 2% |
| Brightness Distribution (%) | 96 | 87 -9% | 86 -10% | 93 -3% |
| Black Level * (cd/m²) | 0.25 | 0.28 -12% | 0.33 -32% | 0.19 24% |
| Contrast (:1) | 1204 | 1159 -4% | 1479 23% | 1605 33% |
| Colorchecker dE 2000 * | 5.66 | 3.87 32% | 1.23 78% | 1.31 77% |
| Colorchecker dE 2000 max. * | 9.75 | 9.35 4% | 2.94 70% | 2.32 76% |
| Colorchecker dE 2000 calibrated * | 2.7 | 1.42 47% | 0.77 71% | 0.91 66% |
| Greyscale dE 2000 * | 5.2 | 6.5 -25% | 1.5 71% | 2.3 56% |
| Gamma | 2.225 99% | 2.23 99% | 2.169 101% | 2.281 96% |
| CCT | 6566 99% | 5702 114% | 6614 98% | 6449 101% |
| Color Space (Percent of AdobeRGB 1998) (%) | 66.3 | 99 | 72 | |
| Color Space (Percent of sRGB) (%) | 98 | 99 | 94 | |
| Media total (Programa/Opciones) | -21% /
-3% | -107% /
-19% | 9% /
25% |
* ... más pequeño es mejor
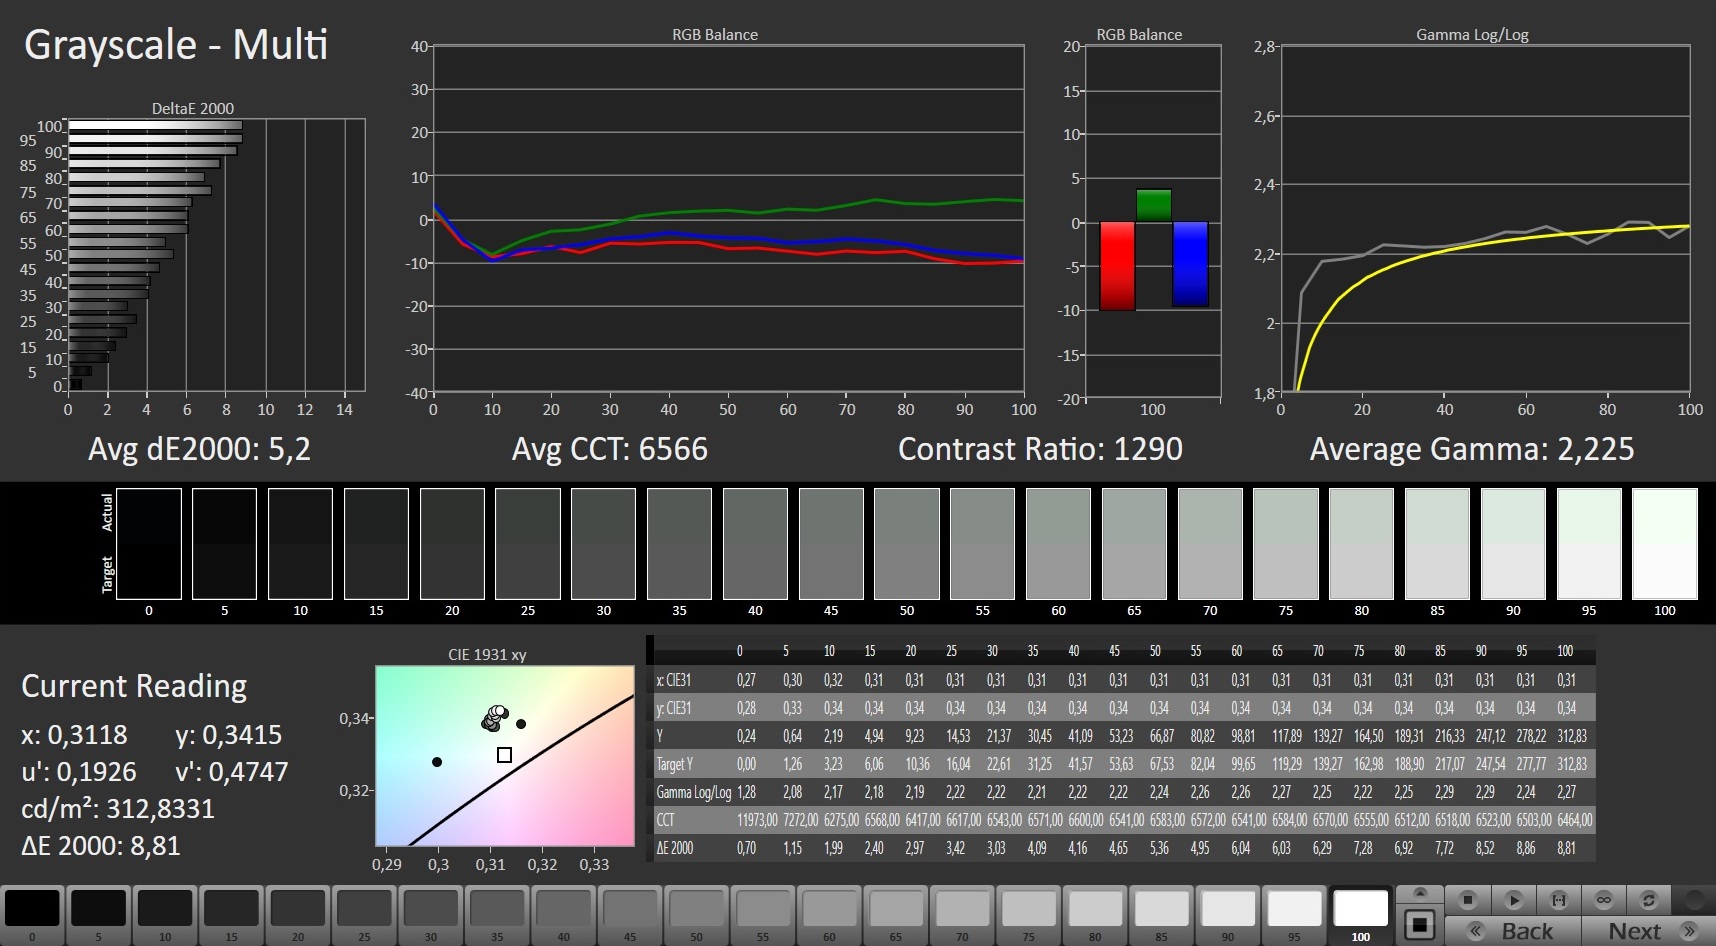
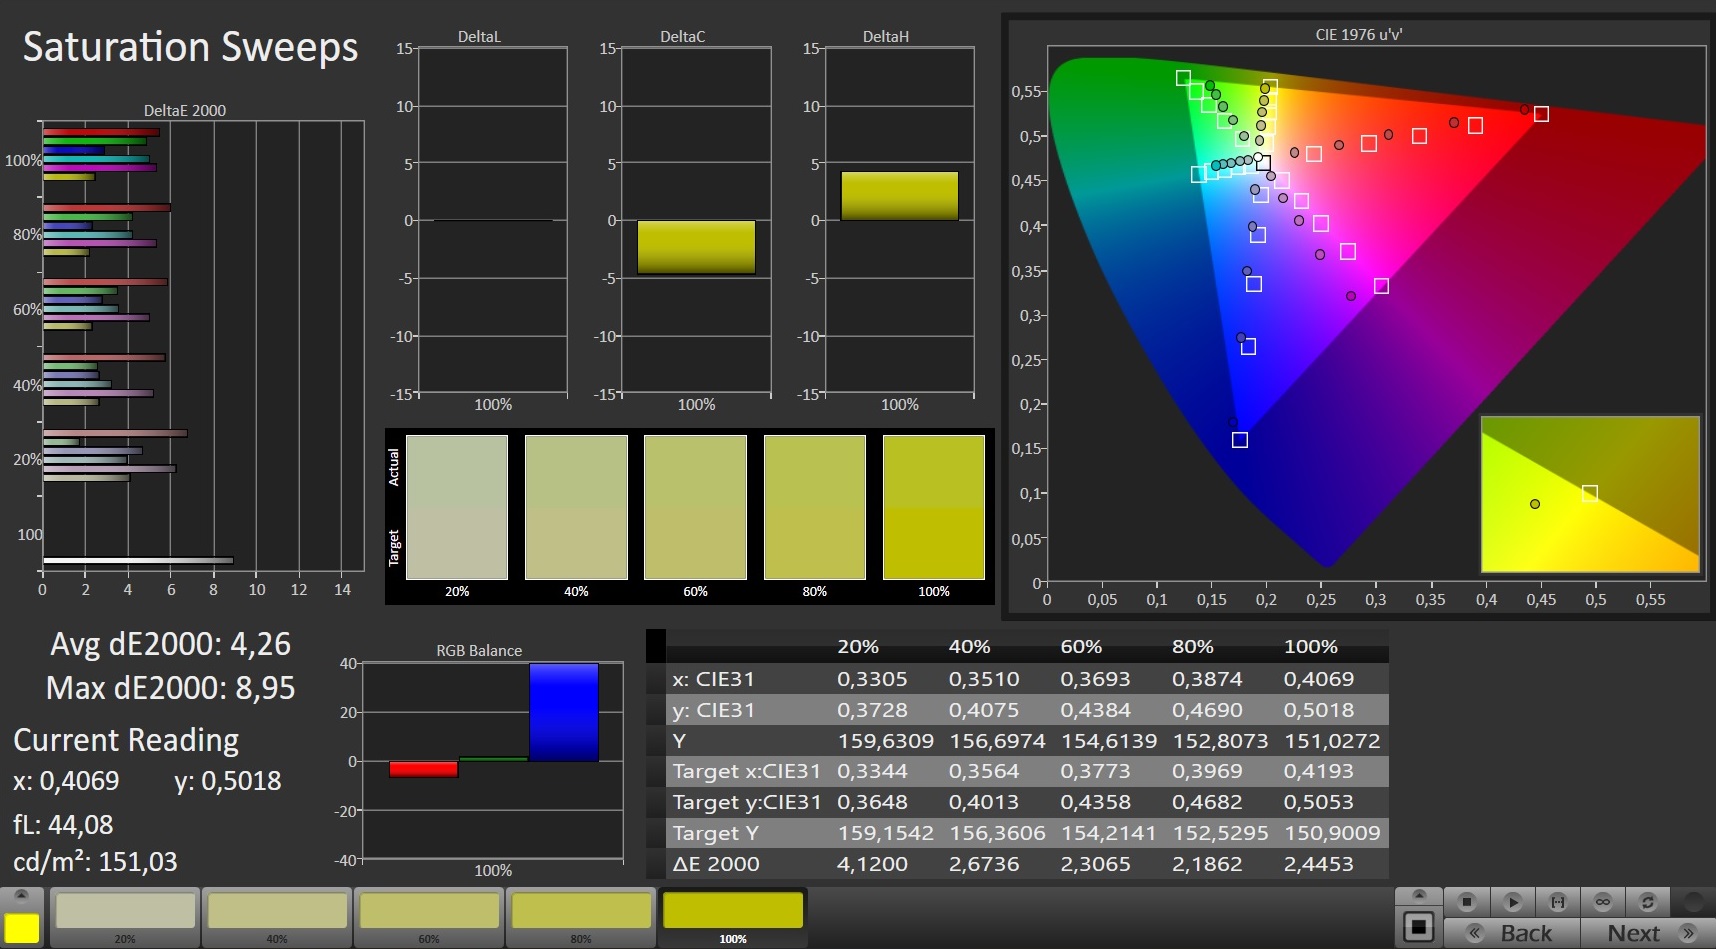
Nuestras mediciones muestran que la pantalla del GE76 Raider 11UH tiene un buen ratio de contraste de 1.204:1 y un nivel de negro igualmente bueno de 0,25 cd/m². La cobertura del espacio de color de 74,4% (sRGB) y 51,2% (AdobeRGB) es bastante decepcionante y está por debajo de los índices del resto de dispositivos de nuestro campo de pruebas.
El análisis CalMAN también muestra que los colores se muestran con una desviación DeltaE 2000 de 5,66. Este valor puede reducirse a 2,7 mediante la calibración. El archivo ICC correspondiente puede descargarse en la ventana superior derecha, junto al gráfico de iluminación de la pantalla
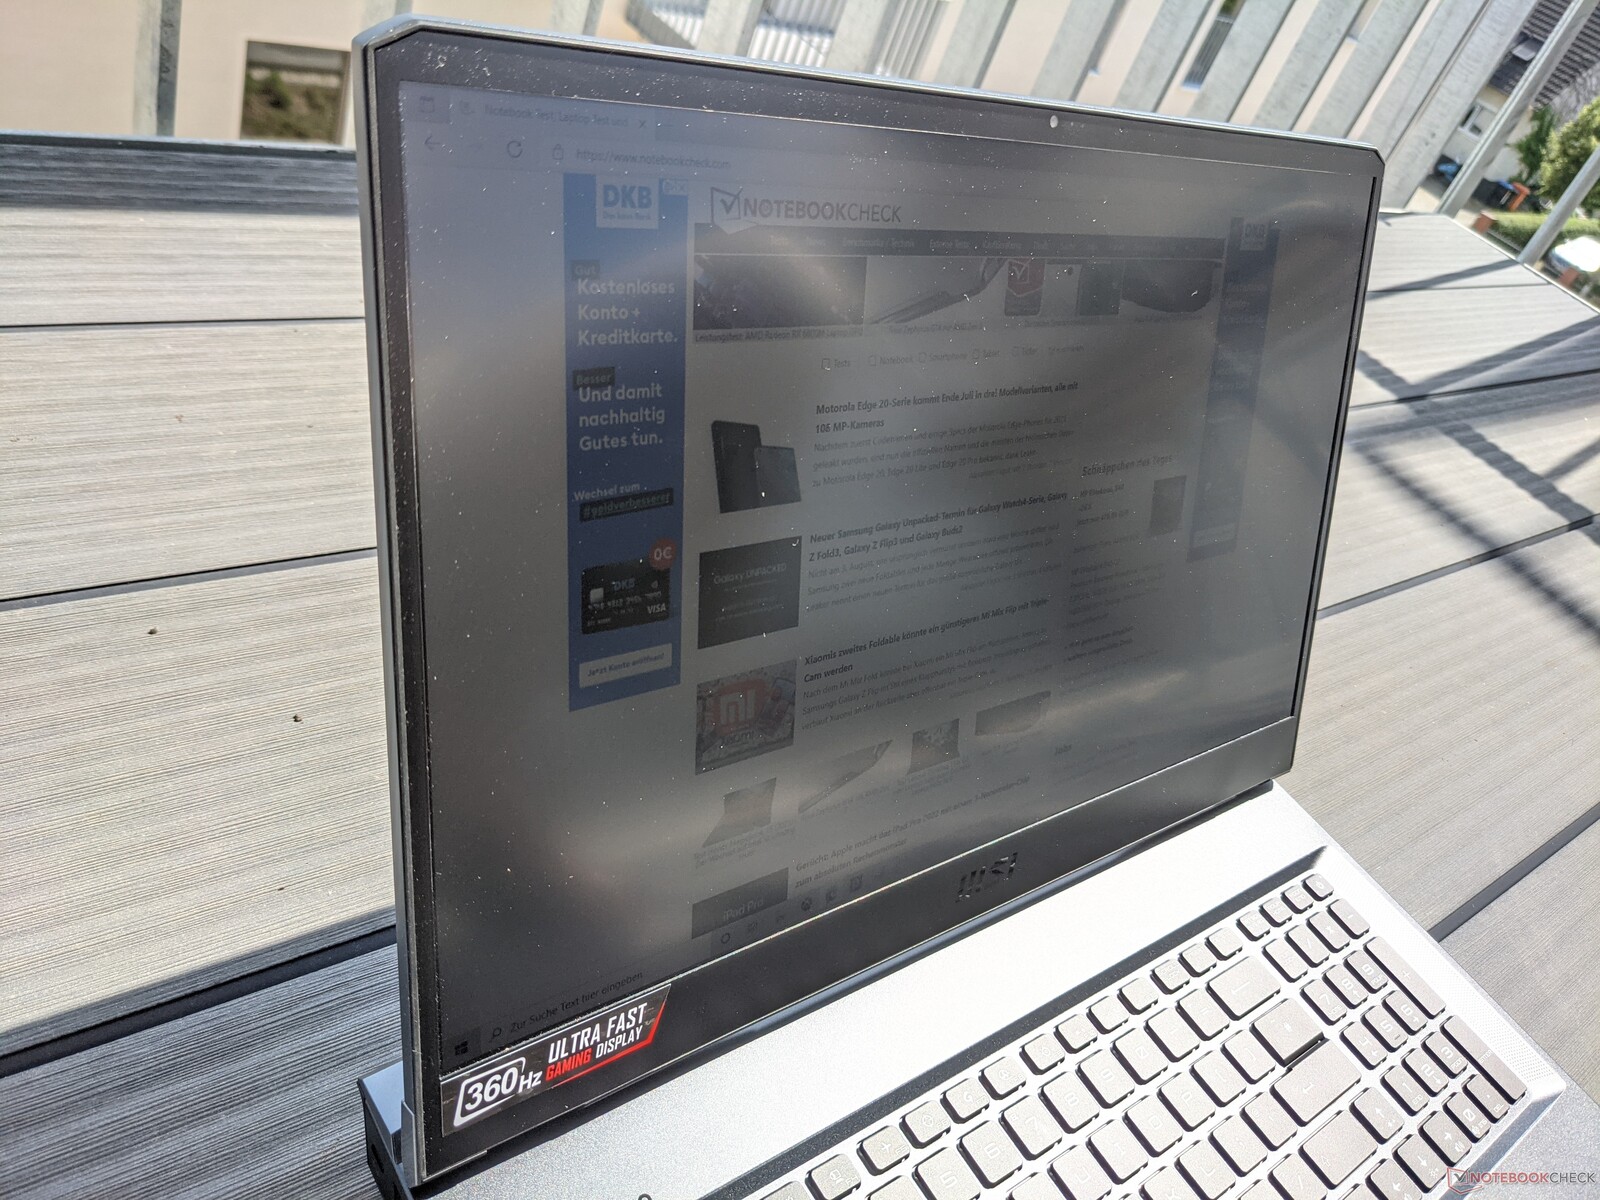
El MSI GE76 Raider 11UH puede usarse en exteriores siempre que se prefieran lugares a la sombra. El contenido de la pantalla se puede leer, pero el brillo no es lo suficientemente alto como para jugar en exteriores durante mucho tiempo
Tiempos de respuesta del display
| ↔ Tiempo de respuesta de Negro a Blanco | ||
|---|---|---|
| 10.4 ms ... subida ↗ y bajada ↘ combinada | ↗ 6 ms subida | 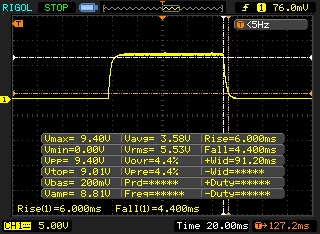 |
| ↘ 4.4 ms bajada | ||
| La pantalla mostró buenos tiempos de respuesta en nuestros tests pero podría ser demasiado lenta para los jugones competitivos. En comparación, todos los dispositivos de prueba van de ##min### (mínimo) a 240 (máximo) ms. » 28 % de todos los dispositivos son mejores. Esto quiere decir que el tiempo de respuesta medido es mejor que la media (19.8 ms) de todos los dispositivos testados. | ||
| ↔ Tiempo de respuesta 50% Gris a 80% Gris | ||
| 6.4 ms ... subida ↗ y bajada ↘ combinada | ↗ 2.8 ms subida | 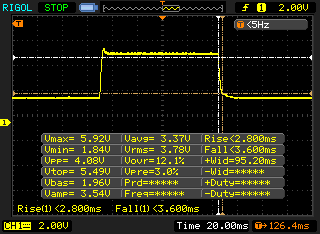 |
| ↘ 3.6 ms bajada | ||
| La pantalla mostró tiempos de respuesta muy rápidos en nuestros tests y debería ser adecuada para juegos frenéticos. En comparación, todos los dispositivos de prueba van de ##min### (mínimo) a 636 (máximo) ms. » 19 % de todos los dispositivos son mejores. Esto quiere decir que el tiempo de respuesta medido es mejor que la media (31 ms) de todos los dispositivos testados. | ||
Parpadeo de Pantalla / PWM (Pulse-Width Modulation)
| Parpadeo de Pantalla / PWM no detectado | 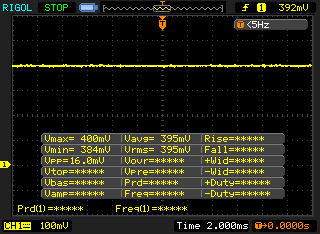 | ||
Comparación: 52 % de todos los dispositivos testados no usaron PWM para atenuar el display. Si se usó, medimos una media de 7772 (mínimo: 5 - máxmo: 343500) Hz. | |||
El panel IPS del MSI GE76 Raider es muy estable en cuanto al ángulo de visión. El contenido de la imagen se puede leer desde casi todos los ángulos sin que se distorsione o se muestre con colores imprecisos

Rendimiento - Equipado para todos los juegos
Con el GE76 Raider 11UH, MSI se dirige a los jugadores ambiciosos que buscan un potente portátil de juegos equipado con el mejor hardware posible del momento. Sin embargo, además de nuestra configuración de prueba, el Raider 11UH también está disponible con laNvidia GeForce RTX 3070 y diversas configuraciones de memoria.
Los siguientes benchmarks se ejecutaron usando la configuración de nivel de rendimiento "Alto" y el perfil de ventilador "Auto". Además, nuestro dispositivo de pruebas es un modelo de preproducción, por lo que podríamos ver un aumento de rendimiento en la versión de producción.
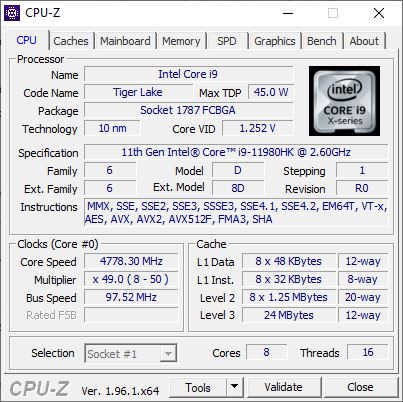
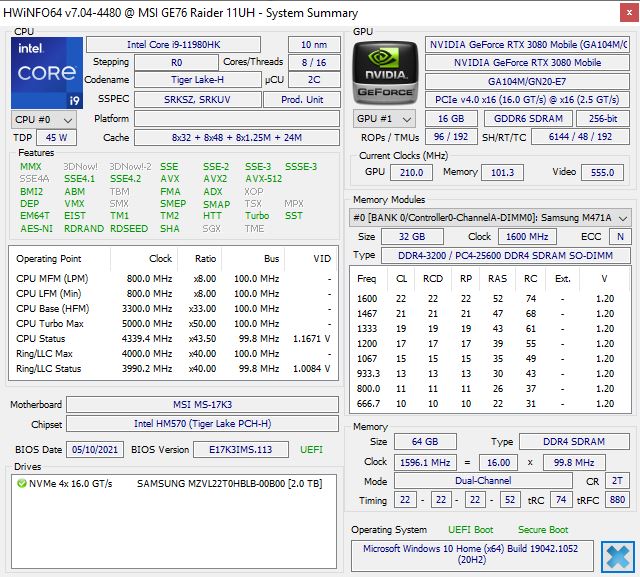
Procesador
ElIntel Core i9-11980HK utilizado aquí es un procesador con ocho núcleos que puede procesar hasta 16 tareas simultáneamente. Las velocidades de reloj están entre 2,6 y 5 GHz, y el rendimiento real depende del sistema de refrigeración y del TDP predefinido. MSI configura este último con un valor a corto plazo (PL2) de 200 vatios y un valor a largo plazo (PL1) de 91,75 vatios.
Usando estos parámetros, el rendimiento a largo plazo en Cinebench R15 está a la par con el GE76 Raider 10UH, y no se observan caídas de rendimiento. Sin embargo, hay que tener en cuenta que el predecesor se probó usando la configuración de rendimiento "Extremo" en nuestro análisis, y que el 11UH es todavía un dispositivo de preproducción. Por lo tanto, el rendimiento en la versión de producción puede ser todavía un poco mejor.
En las pruebas individuales, la CPU del GE76 Raider 11UH logra muy buenos índices de un solo núcleo, lo que hace que el dispositivo se sitúe en el rango superior del campo de pruebas. Por otro lado, los resultados multinúcleo están por debajo de la media.
Actualización: MSI pudo aumentar el rendimiento multinúcleo del portátil de juegos considerablemente en algunos aspectos en el modelo de producción del GE76 Raider 11UH. En los benchmarks individuales de Cinebench R15, Cinebench R20, 7zip, x265, y Blender, los resultados fueron mejorados en cerca de 20%. En Geekbench 5.3, hay un aumento del 12%. En cambio, el rendimiento de un solo núcleo sólo cambia dentro de las tolerancias habituales. El rendimiento bajo carga prolongada también es significativamente mayor ahora, como muestra nuestro gráfico de carga continua de Cinebench R15.
Como resultado, el rendimiento delIntel Core i9-11980HK en el MSI GE76 Raider 11UH está ahora a un nivel superior a la media y puede seguir el ritmo o superar a competidores como el Gigabyte Aero 17 HDR YD.
| Cinebench R20 | |
| CPU (Single Core) | |
| Media de la clase Gaming (442 - 895, n=110, últimos 2 años) | |
| MSI GE76 Raider 11UH-472US (Vorserie) | |
| MSI GE76 Raider 11UH-472US (Serienmodell) | |
| Medio Intel Core i9-11980HK (572 - 622, n=7) | |
| Gigabyte Aero 17 HDR YD | |
| Alienware m17 R4 | |
| MSI GE76 Raider 10UH | |
| CPU (Multi Core) | |
| Media de la clase Gaming (4029 - 16108, n=110, últimos 2 años) | |
| Gigabyte Aero 17 HDR YD | |
| MSI GE76 Raider 11UH-472US (Serienmodell) | |
| MSI GE76 Raider 11UH-472US (Vorserie) | |
| Medio Intel Core i9-11980HK (3779 - 5256, n=8) | |
| Alienware m17 R4 | |
| MSI GE76 Raider 10UH | |
| Cinebench R15 | |
| CPU Single 64Bit | |
| Media de la clase Gaming (188.8 - 343, n=110, últimos 2 años) | |
| Medio Intel Core i9-11980HK (224 - 244, n=6) | |
| Gigabyte Aero 17 HDR YD | |
| MSI GE76 Raider 11UH-472US (Vorserie) | |
| MSI GE76 Raider 11UH-472US (Serienmodell) | |
| Alienware m17 R4 | |
| MSI GE76 Raider 10UH | |
| CPU Multi 64Bit | |
| Media de la clase Gaming (1578 - 6271, n=109, últimos 2 años) | |
| MSI GE76 Raider 11UH-472US (Serienmodell) | |
| MSI GE76 Raider 11UH-472US (Vorserie) | |
| Gigabyte Aero 17 HDR YD | |
| Medio Intel Core i9-11980HK (1696 - 2287, n=7) | |
| Alienware m17 R4 | |
| MSI GE76 Raider 10UH | |
| Blender - v2.79 BMW27 CPU | |
| MSI GE76 Raider 11UH-472US (Vorserie) | |
| MSI GE76 Raider 11UH-472US (Serienmodell) | |
| MSI GE76 Raider 10UH | |
| Medio Intel Core i9-11980HK (231 - 284, n=4) | |
| Alienware m17 R4 | |
| Gigabyte Aero 17 HDR YD | |
| Media de la clase Gaming (80 - 330, n=108, últimos 2 años) | |
| HWBOT x265 Benchmark v2.2 - 4k Preset | |
| Media de la clase Gaming (11.5 - 44.3, n=109, últimos 2 años) | |
| MSI GE76 Raider 11UH-472US (Serienmodell) | |
| MSI GE76 Raider 11UH-472US (Vorserie) | |
| Gigabyte Aero 17 HDR YD | |
| Medio Intel Core i9-11980HK (13.1 - 16.3, n=5) | |
| Alienware m17 R4 | |
| MSI GE76 Raider 10UH | |
| LibreOffice - 20 Documents To PDF | |
| Alienware m17 R4 | |
| Media de la clase Gaming (19 - 88.8, n=109, últimos 2 años) | |
| MSI GE76 Raider 10UH | |
| Medio Intel Core i9-11980HK (40.6 - 47.7, n=5) | |
| Gigabyte Aero 17 HDR YD | |
| MSI GE76 Raider 11UH-472US (Serienmodell) | |
| MSI GE76 Raider 11UH-472US (Vorserie) | |
| R Benchmark 2.5 - Overall mean | |
| MSI GE76 Raider 10UH | |
| Alienware m17 R4 | |
| MSI GE76 Raider 11UH-472US (Serienmodell) | |
| MSI GE76 Raider 11UH-472US (Vorserie) | |
| Gigabyte Aero 17 HDR YD | |
| Medio Intel Core i9-11980HK (0.545 - 0.565, n=5) | |
| Media de la clase Gaming (0.3439 - 0.759, n=110, últimos 2 años) | |
* ... más pequeño es mejor
Rendimiento del sistema
En la prueba PCMark 10 para evaluar el rendimiento del sistema, el MSI GE76 Raider 11UH logra un buen resultado y el segundo lugar en nuestro campo de pruebas. Aquí destaca sobre todo la puntuación individual "Essentials". El mayor competidor es el Gigabyte Aero 17 HDR YD.
El portátil para juegos se maneja con mucha fluidez en el uso diario. Los programas se lanzan rápidamente y el acceso a los archivos es posible sin retrasos. El rendimiento de otros portátiles en comparación se puede encontrar en nuestro artículoCPU Benchmarks.
| PCMark 10 / Score | |
| Media de la clase Gaming (5828 - 11574, n=96, últimos 2 años) | |
| Gigabyte Aero 17 HDR YD | |
| MSI GE76 Raider 11UH-472US (Serienmodell) | |
| MSI GE76 Raider 11UH-472US | |
| Medio Intel Core i9-11980HK, NVIDIA GeForce RTX 3080 Laptop GPU (6937 - 7088, n=3) | |
| Alienware m17 R4 | |
| MSI GE76 Raider 10UH | |
| PCMark 10 / Essentials | |
| Media de la clase Gaming (8810 - 12600, n=100, últimos 2 años) | |
| MSI GE76 Raider 11UH-472US | |
| MSI GE76 Raider 11UH-472US (Serienmodell) | |
| Gigabyte Aero 17 HDR YD | |
| Medio Intel Core i9-11980HK, NVIDIA GeForce RTX 3080 Laptop GPU (9665 - 10291, n=3) | |
| MSI GE76 Raider 10UH | |
| Alienware m17 R4 | |
| PCMark 10 / Productivity | |
| Media de la clase Gaming (6845 - 21327, n=98, últimos 2 años) | |
| MSI GE76 Raider 11UH-472US (Serienmodell) | |
| MSI GE76 Raider 11UH-472US | |
| Gigabyte Aero 17 HDR YD | |
| Medio Intel Core i9-11980HK, NVIDIA GeForce RTX 3080 Laptop GPU (8934 - 9107, n=3) | |
| Alienware m17 R4 | |
| MSI GE76 Raider 10UH | |
| PCMark 10 / Digital Content Creation | |
| Media de la clase Gaming (7602 - 19657, n=98, últimos 2 años) | |
| MSI GE76 Raider 11UH-472US (Serienmodell) | |
| MSI GE76 Raider 11UH-472US | |
| Gigabyte Aero 17 HDR YD | |
| Medio Intel Core i9-11980HK, NVIDIA GeForce RTX 3080 Laptop GPU (9855 - 10823, n=3) | |
| MSI GE76 Raider 10UH | |
| Alienware m17 R4 | |
| PCMark 10 Score | 7054 puntos | |
ayuda | ||
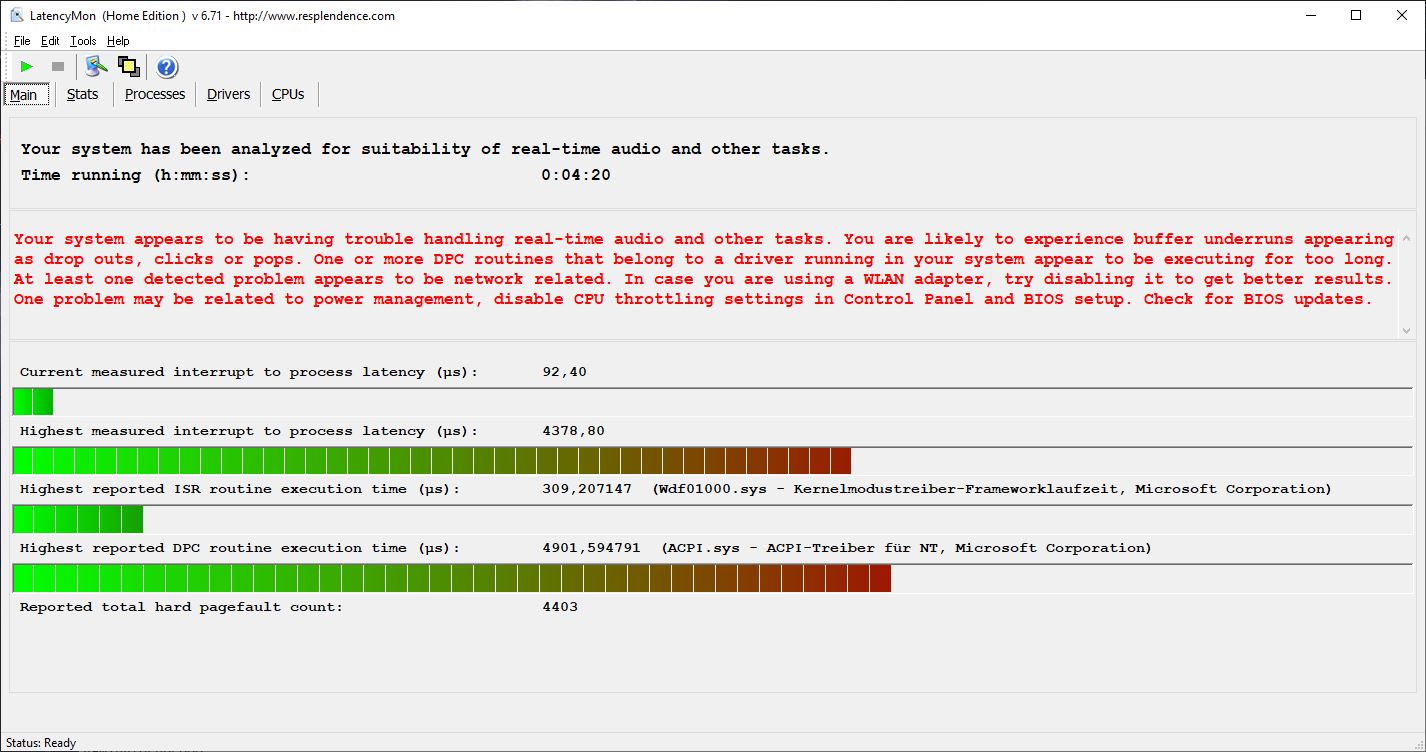
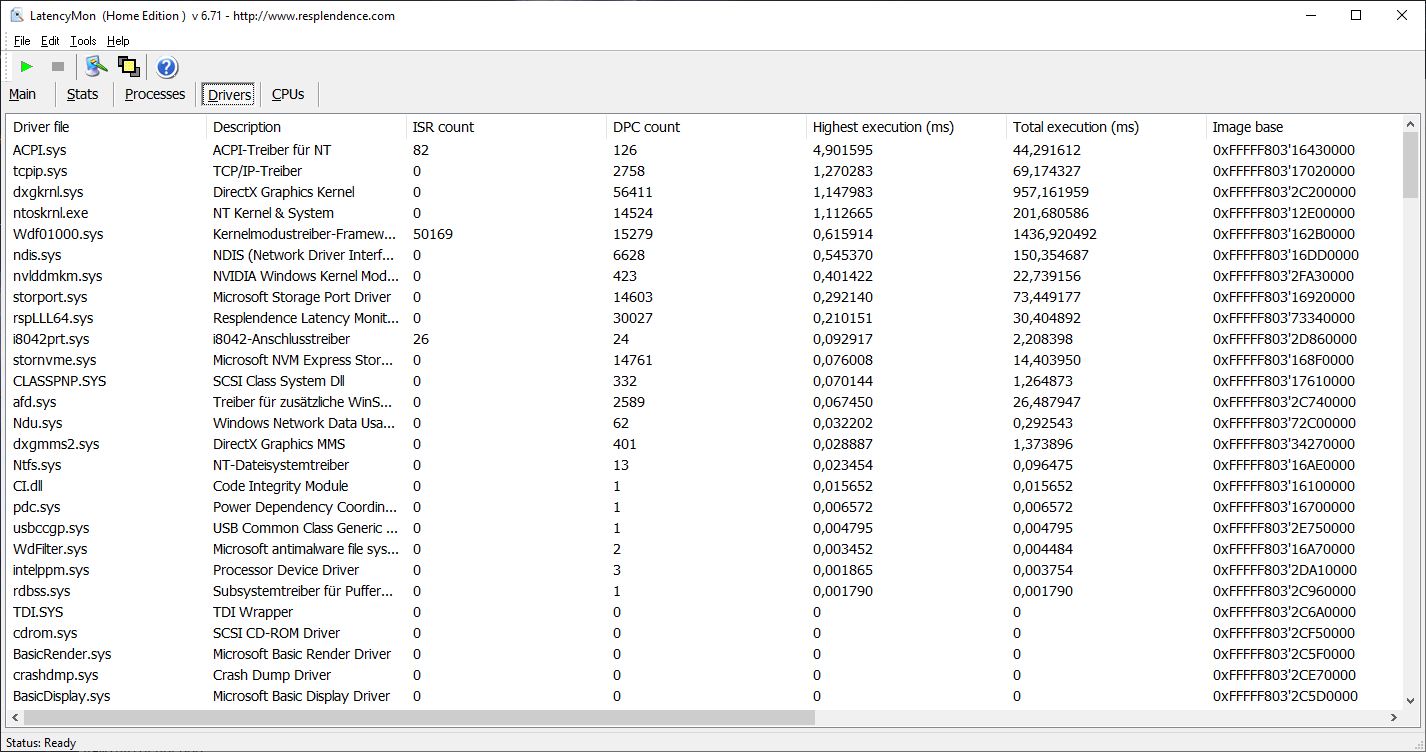
Latencias del CPD
En la prueba con LatencyMon, el MSI GE76 Raider 11UH muestra altos tiempos de interrupción. Esto significa que no es adecuado para aplicaciones de audio en tiempo real o similares
| DPC Latencies / LatencyMon - interrupt to process latency (max), Web, Youtube, Prime95 | |
| MSI GE76 Raider 10UH | |
| MSI GE76 Raider 11UH-472US | |
| Gigabyte Aero 17 HDR YD | |
| Alienware m17 R4 | |
* ... más pequeño es mejor
Almacenamiento
MSI instala un SSD de 2 TB de Samsung en nuestra configuración de prueba del GE76 Raider 11UH. Logra muy buenas tasas de escritura y lectura en las pruebas de almacenamiento, que suelen estar por encima del nivel del resto de nuestro campo de pruebas.
El rendimiento que se puede esperar de otros dispositivos de almacenamiento masivo se puede encontrar en nuestro artículoHDD/SSD Benchmarks.
| MSI GE76 Raider 11UH-472US Samsung PM9A1 MZVL21T0HCLR | MSI GE76 Raider 10UH WDC PC SN730 SDBPNTY-1T00 | Gigabyte Aero 17 HDR YD Samsung PM9A1 MZVL2512HCJQ | Alienware m17 R4 2x Micron 2300 512 GB (RAID 0) | Medio Samsung PM9A1 MZVL21T0HCLR | |
|---|---|---|---|---|---|
| CrystalDiskMark 5.2 / 6 | -42% | -2% | -42% | -14% | |
| Write 4K (MB/s) | 238.8 | 157.1 -34% | 230.4 -4% | 93.1 -61% | 194.2 ? -19% |
| Read 4K (MB/s) | 88 | 46.3 -47% | 91.6 4% | 46.79 -47% | 80.6 ? -8% |
| Write Seq (MB/s) | 4306 | 2396 -44% | 4216 -2% | 2853 -34% | 3638 ? -16% |
| Read Seq (MB/s) | 4549 | 2245 -51% | 4543 0% | 2556 -44% | 3838 ? -16% |
| Write 4K Q32T1 (MB/s) | 699 | 436.1 -38% | 667 -5% | 475 -32% | 500 ? -28% |
| Read 4K Q32T1 (MB/s) | 752 | 524 -30% | 728 -3% | 529 -30% | 605 ? -20% |
| Write Seq Q32T1 (MB/s) | 5119 | 3086 -40% | 5043 -1% | 3331 -35% | 4898 ? -4% |
| Read Seq Q32T1 (MB/s) | 7086 | 3363 -53% | 6821 -4% | 3319 -53% | 6775 ? -4% |
| AS SSD | -70% | 0% | -68% | -7% | |
| Seq Read (MB/s) | 5435 | 2967 -45% | 5438 0% | 2733 -50% | 4901 ? -10% |
| Seq Write (MB/s) | 3954 | 2604 -34% | 3904 -1% | 2822 -29% | 3334 ? -16% |
| 4K Read (MB/s) | 52.9 | 42.97 -19% | 56.2 6% | 45.04 -15% | 72.4 ? 37% |
| 4K Write (MB/s) | 158.8 | 107.8 -32% | 165.8 4% | 88.4 -44% | 186 ? 17% |
| 4K-64 Read (MB/s) | 2551 | 1684 -34% | 2489 -2% | 1388 -46% | 1871 ? -27% |
| 4K-64 Write (MB/s) | 3155 | 2164 -31% | 3480 10% | 1227 -61% | 2764 ? -12% |
| Access Time Read * (ms) | 0.044 | 0.116 -164% | 0.054 -23% | 0.079 -80% | 0.0377 ? 14% |
| Access Time Write * (ms) | 0.026 | 0.106 -308% | 0.026 -0% | 0.095 -265% | 0.03431 ? -32% |
| Score Read (Points) | 3148 | 2023 -36% | 3089 -2% | 1706 -46% | 2433 ? -23% |
| Score Write (Points) | 3709 | 2532 -32% | 4036 9% | 1598 -57% | 3284 ? -11% |
| Score Total (Points) | 8383 | 5571 -34% | 8620 3% | 4184 -50% | 6892 ? -18% |
| Media total (Programa/Opciones) | -56% /
-58% | -1% /
-1% | -55% /
-57% | -11% /
-10% |
* ... más pequeño es mejor

Continuous load read: DiskSpd Read Loop, Queue Depth 8
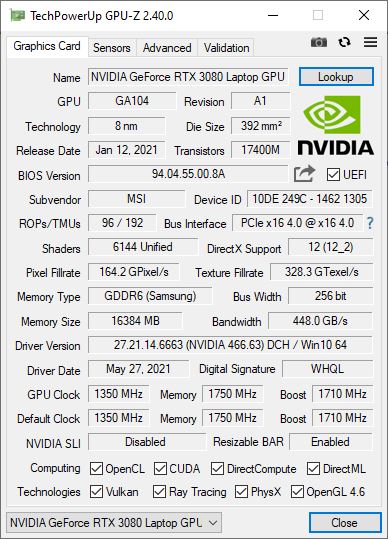
Tarjeta gráfica
LaNvidia GeForce RTX 3080 utilizada aquí es actualmente la tarjeta gráfica móvil más potente. No obstante, su rendimiento depende de la configuración TGP, que MSI ha fijado en el valor máximo posible de 165 vatios. Los resultados de rendimiento en los benchmarks son correspondientemente buenos. Una vez más, hay que tener en cuenta que la GE76 Raider 10UH se probó con la configuración "Extrema" y la GE76 Raider 11UH con la configuración "Alto rendimiento".
NuestroartículoGPU Benchmarks muestra el rendimiento de otras tarjetas gráficas en comparación.
| 3DMark 11 Performance | 30194 puntos | |
| 3DMark Cloud Gate Standard Score | 47525 puntos | |
| 3DMark Fire Strike Score | 21608 puntos | |
ayuda | ||
Rendimiento de los juegos
El MSI GE76 Raider 11UH es extraordinariamente adecuado para los juegos. LaNvidia GeForce RTX 3080
incorporada proporciona velocidades de fotogramas muy altas e incluso muestra títulos exigentes con fluidez a altas resoluciones y niveles de detalle máximos. En comparación con nuestra competencia elegida, el portátil para juegos de MSI rinde a un nivel similar.El rendimiento que se puede esperar de laNvidia GeForce RTX 3080 en otros títulos está recogido en nuestro artículoJuegos de GPU.
| The Witcher 3 - 1920x1080 Ultra Graphics & Postprocessing (HBAO+) | |
| Media de la clase Gaming (95 - 240, n=8, últimos 2 años) | |
| MSI GE76 Raider 10UH | |
| Alienware m17 R4 | |
| MSI GE76 Raider 11UH-472US | |
| Medio NVIDIA GeForce RTX 3080 Laptop GPU (85.1 - 123, n=40) | |
| Gigabyte Aero 17 HDR YD | |
| Cyberpunk 2077 1.0 - 1920x1080 Ultra Preset | |
| Alienware m17 R4 | |
| MSI GE76 Raider 11UH-472US | |
| Medio NVIDIA GeForce RTX 3080 Laptop GPU (52.9 - 84.3, n=9) | |
| Gigabyte Aero 17 HDR YD | |
| X-Plane 11.11 - 1920x1080 high (fps_test=3) | |
| Media de la clase Gaming (52.1 - 143.5, n=114, últimos 2 años) | |
| Gigabyte Aero 17 HDR YD | |
| Alienware m17 R4 | |
| MSI GE76 Raider 11UH-472US | |
| Medio NVIDIA GeForce RTX 3080 Laptop GPU (65.6 - 113, n=44) | |
| MSI GE76 Raider 10UH | |
| GTA V - 1920x1080 High/On (Advanced Graphics Off) AA:2xMSAA + FX AF:8x | |
| Media de la clase Gaming (110.7 - 189, n=70, últimos 2 años) | |
| Gigabyte Aero 17 HDR YD | |
| MSI GE76 Raider 11UH-472US | |
| Medio NVIDIA GeForce RTX 3080 Laptop GPU (137 - 176, n=30) | |
| MSI GE76 Raider 10UH | |
| Alienware m17 R4 | |
| Final Fantasy XV Benchmark - 1920x1080 High Quality | |
| Media de la clase Gaming (41 - 215, n=100, últimos 2 años) | |
| MSI GE76 Raider 10UH | |
| MSI GE76 Raider 11UH-472US | |
| Medio NVIDIA GeForce RTX 3080 Laptop GPU (55.5 - 115, n=34) | |
| Gigabyte Aero 17 HDR YD | |
| Alienware m17 R4 | |
| Dota 2 Reborn - 1920x1080 ultra (3/3) best looking | |
| Media de la clase Gaming (84.8 - 248, n=111, últimos 2 años) | |
| Gigabyte Aero 17 HDR YD | |
| MSI GE76 Raider 11UH-472US | |
| Alienware m17 R4 | |
| Medio NVIDIA GeForce RTX 3080 Laptop GPU (98 - 156, n=45) | |
| MSI GE76 Raider 10UH | |
Nuestra prueba de carga continua con The Witcher 3 utilizando la configuración de gráficos "Ultra" también muestra que las tasas de fotogramas se mantienen estables incluso durante periodos prolongados de tiempo, a pesar de que hay ligeras fluctuaciones. En consecuencia, no cabe esperar limitaciones de rendimiento durante sesiones de juego prolongadas
The Witcher 3 FPS diagram
| bajo | medio | alto | ultra | QHD | 4K | |
|---|---|---|---|---|---|---|
| GTA V (2015) | 182 | 177 | 164 | |||
| The Witcher 3 (2015) | 112 | |||||
| Dota 2 Reborn (2015) | 173 | 159 | 148 | 138 | ||
| Final Fantasy XV Benchmark (2018) | 183 | 136 | 108 | |||
| X-Plane 11.11 (2018) | 122 | 104 | 84.2 | |||
| Far Cry 5 (2018) | 136 | 115 | 113 | 110 | ||
| Strange Brigade (2018) | 446 | 265 | 219 | 196 | ||
| Cyberpunk 2077 1.0 (2020) | 105 | 99.2 | 90.6 | 80.1 | ||
| Diablo 4 (2023) | 184.6 | 124 | 65.5 |
Emisiones - Buenos altavoces en el portátil de 17 pulgadas
Emisiones acústicas
Los ventiladores del MSI GE76 Raider 11UH pueden volverse bastante ruidosos bajo carga con hasta 55 dB(A). En el perfil de ventilador "Auto", este nivel de ruido sólo se alcanza en títulos muy exigentes, pero el ruido uniforme del ventilador es claramente audible incluso bajo carga inferior. En comparación con otros portátiles para juegos, el GE76 Raider tiene un nivel de ruido medio.
No pudimos detectar otros ruidos de fondo, como el zumbido de la bobina o similares, en nuestro dispositivo de pruebas.
Ruido
| Ocioso |
| 25 / 27 / 35 dB(A) |
| Carga |
| 54 / 55 dB(A) |
 | ||
30 dB silencioso 40 dB(A) audible 50 dB(A) ruidosamente alto |
||
min: | ||
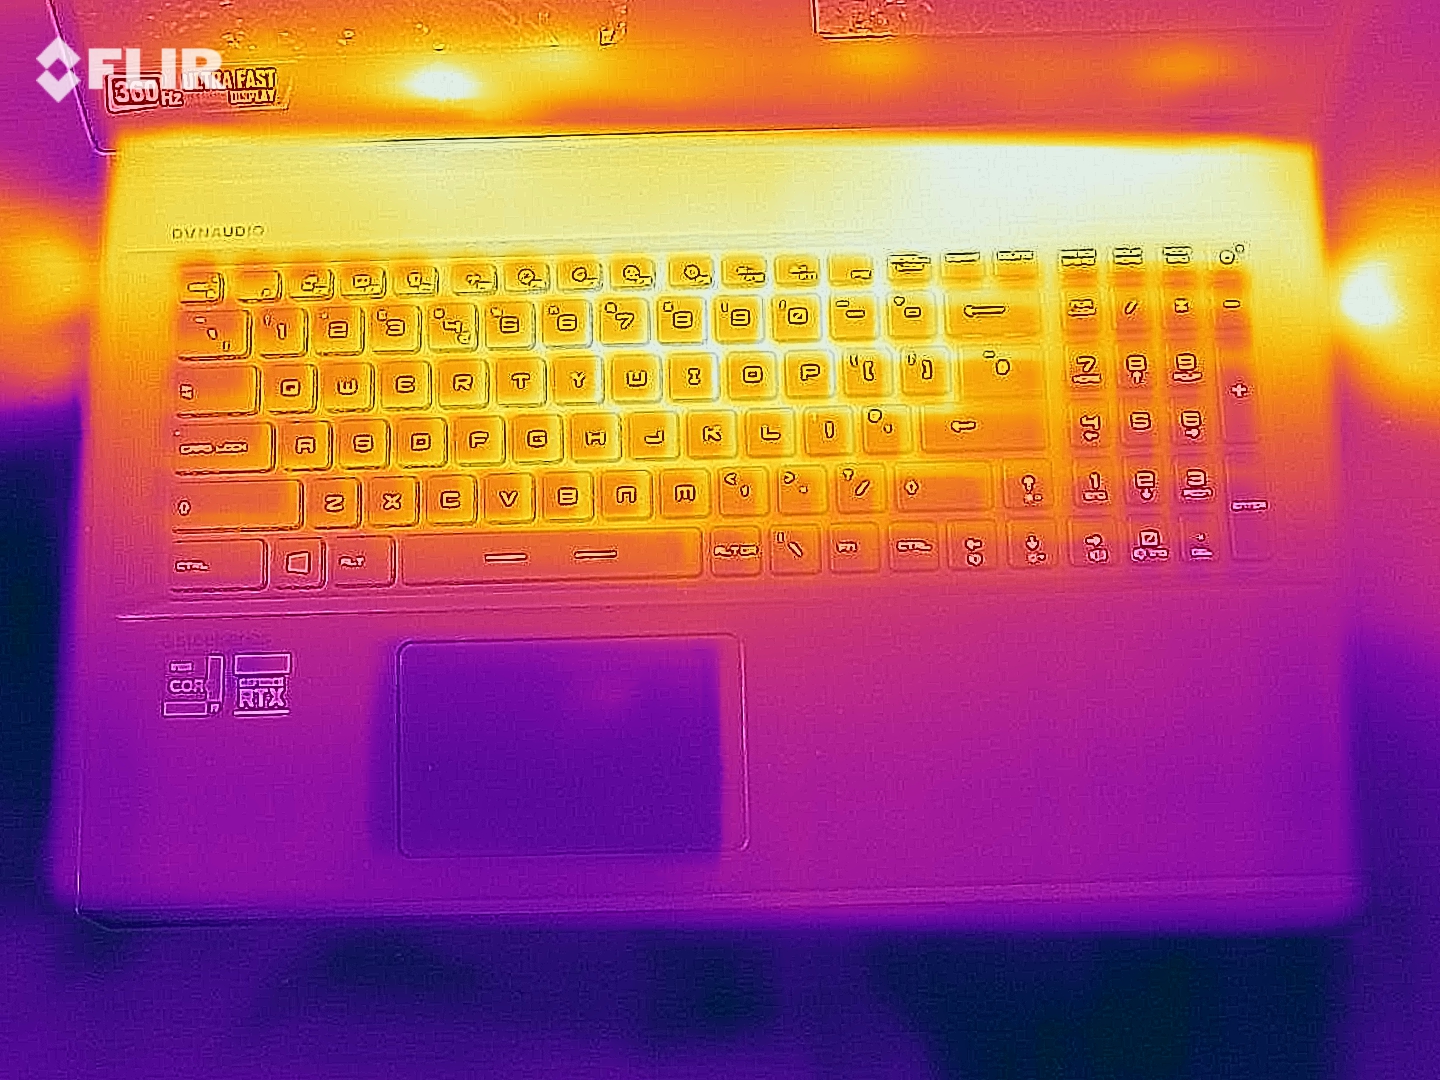
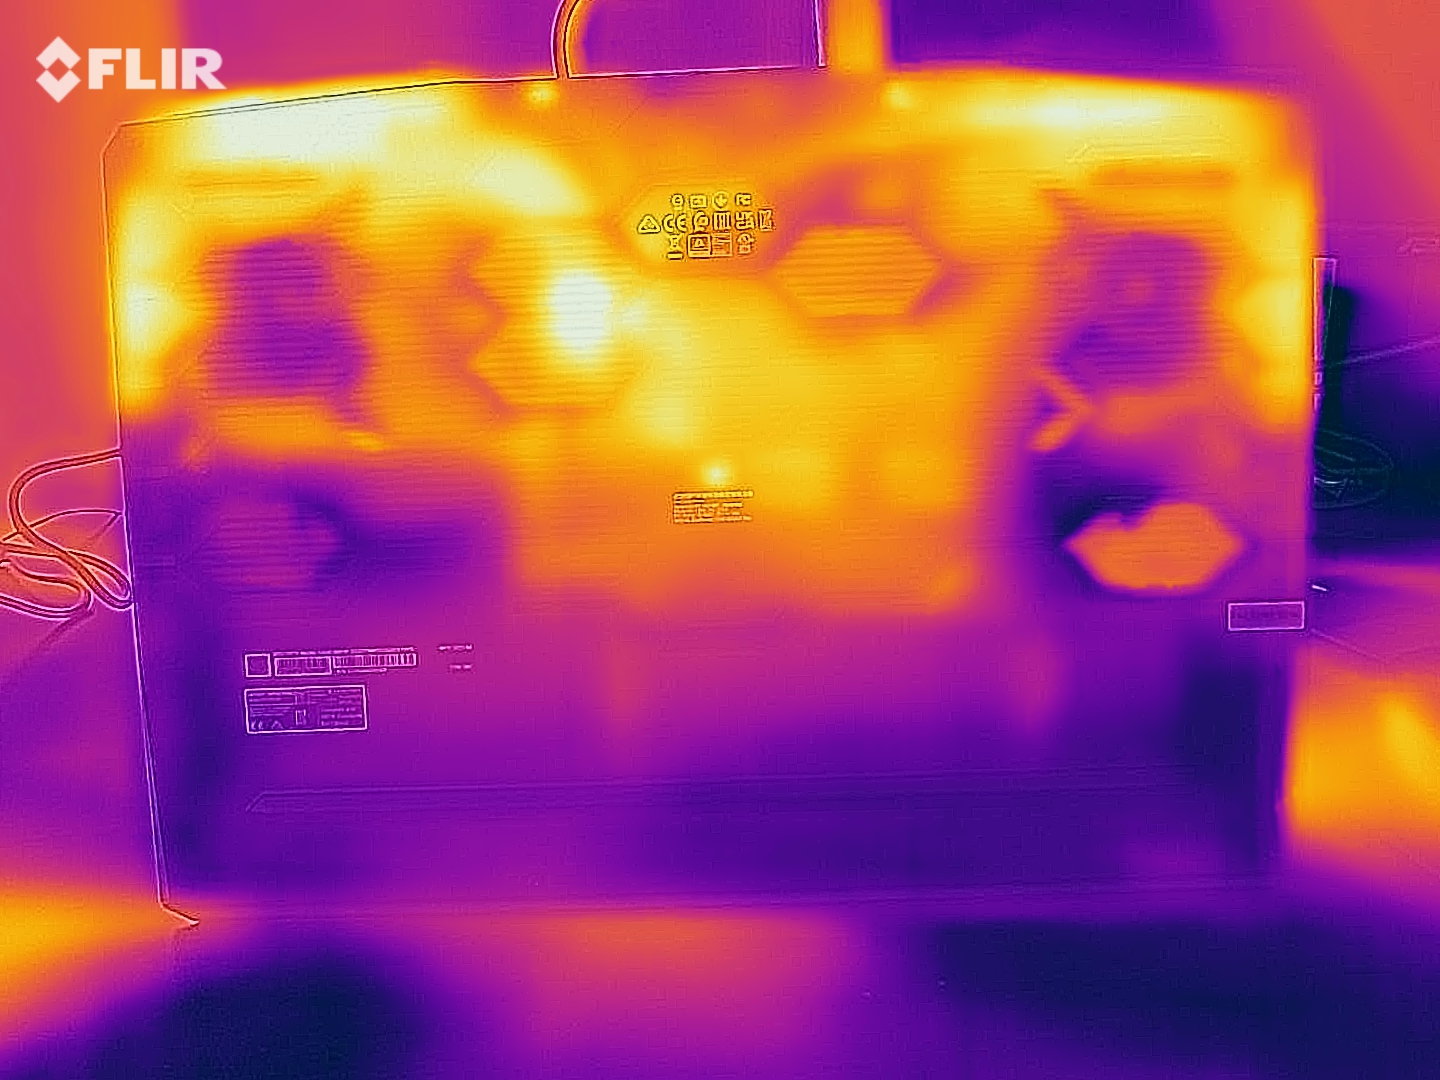
Temperatura
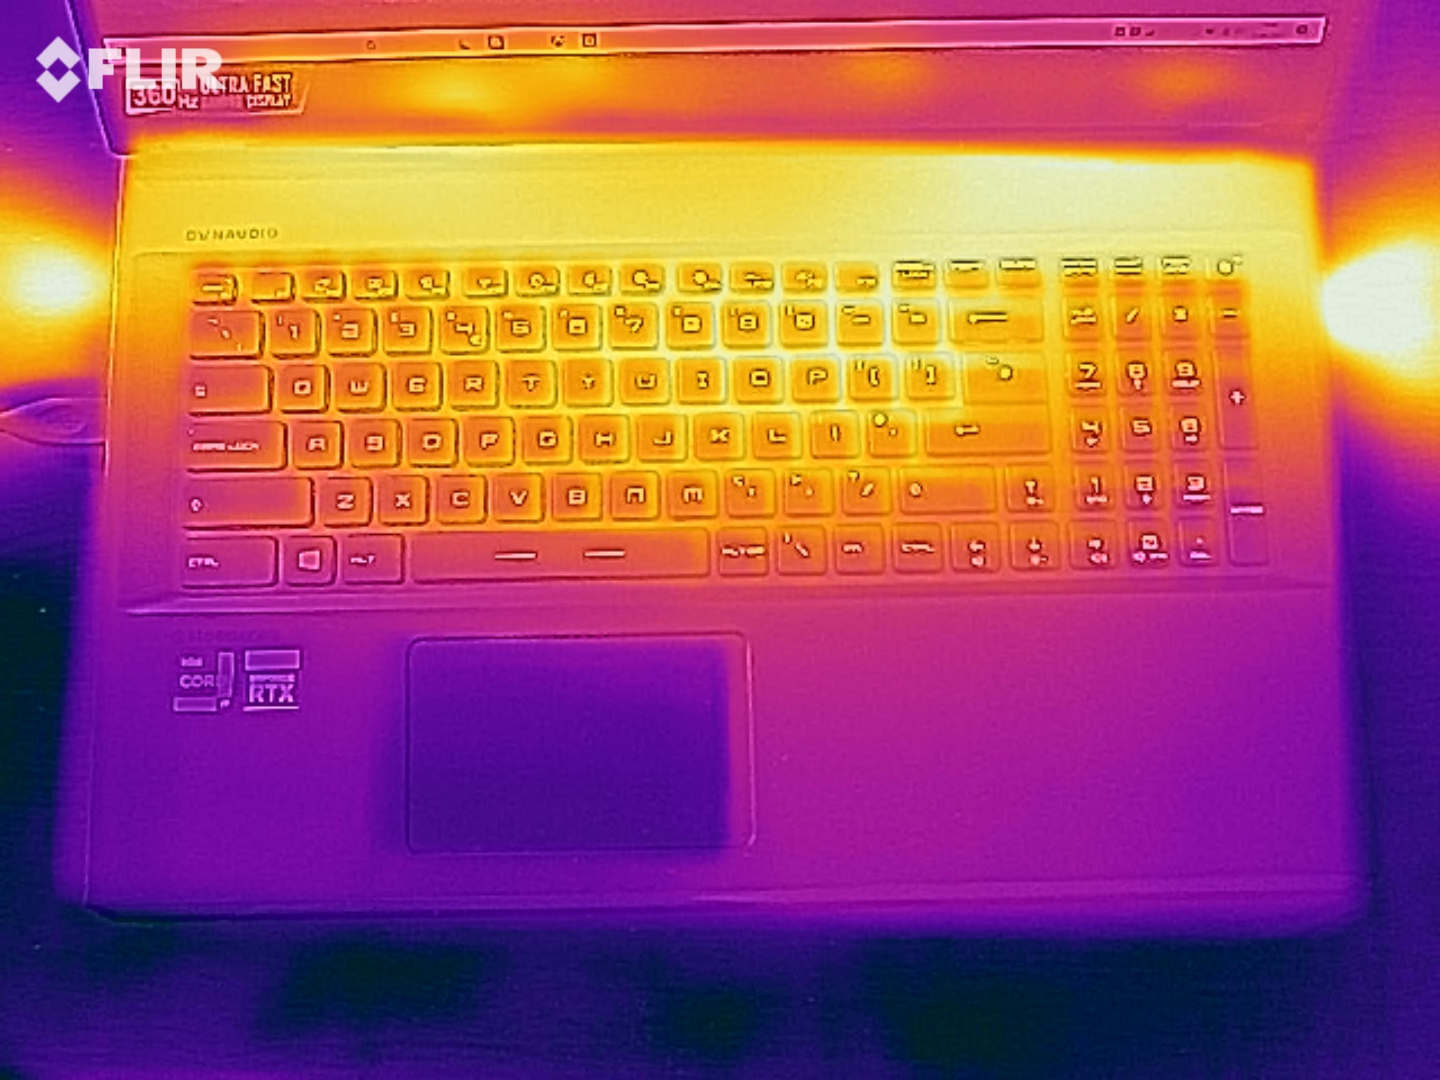
Según nuestras mediciones, las superficies del portátil MSI se calientan hasta 50 °C bajo carga. El punto más caliente está en la esquina trasera izquierda de la parte inferior. La temperatura del reposamanos se mantiene moderada en todo momento hasta los 34 °C (~93 °F)
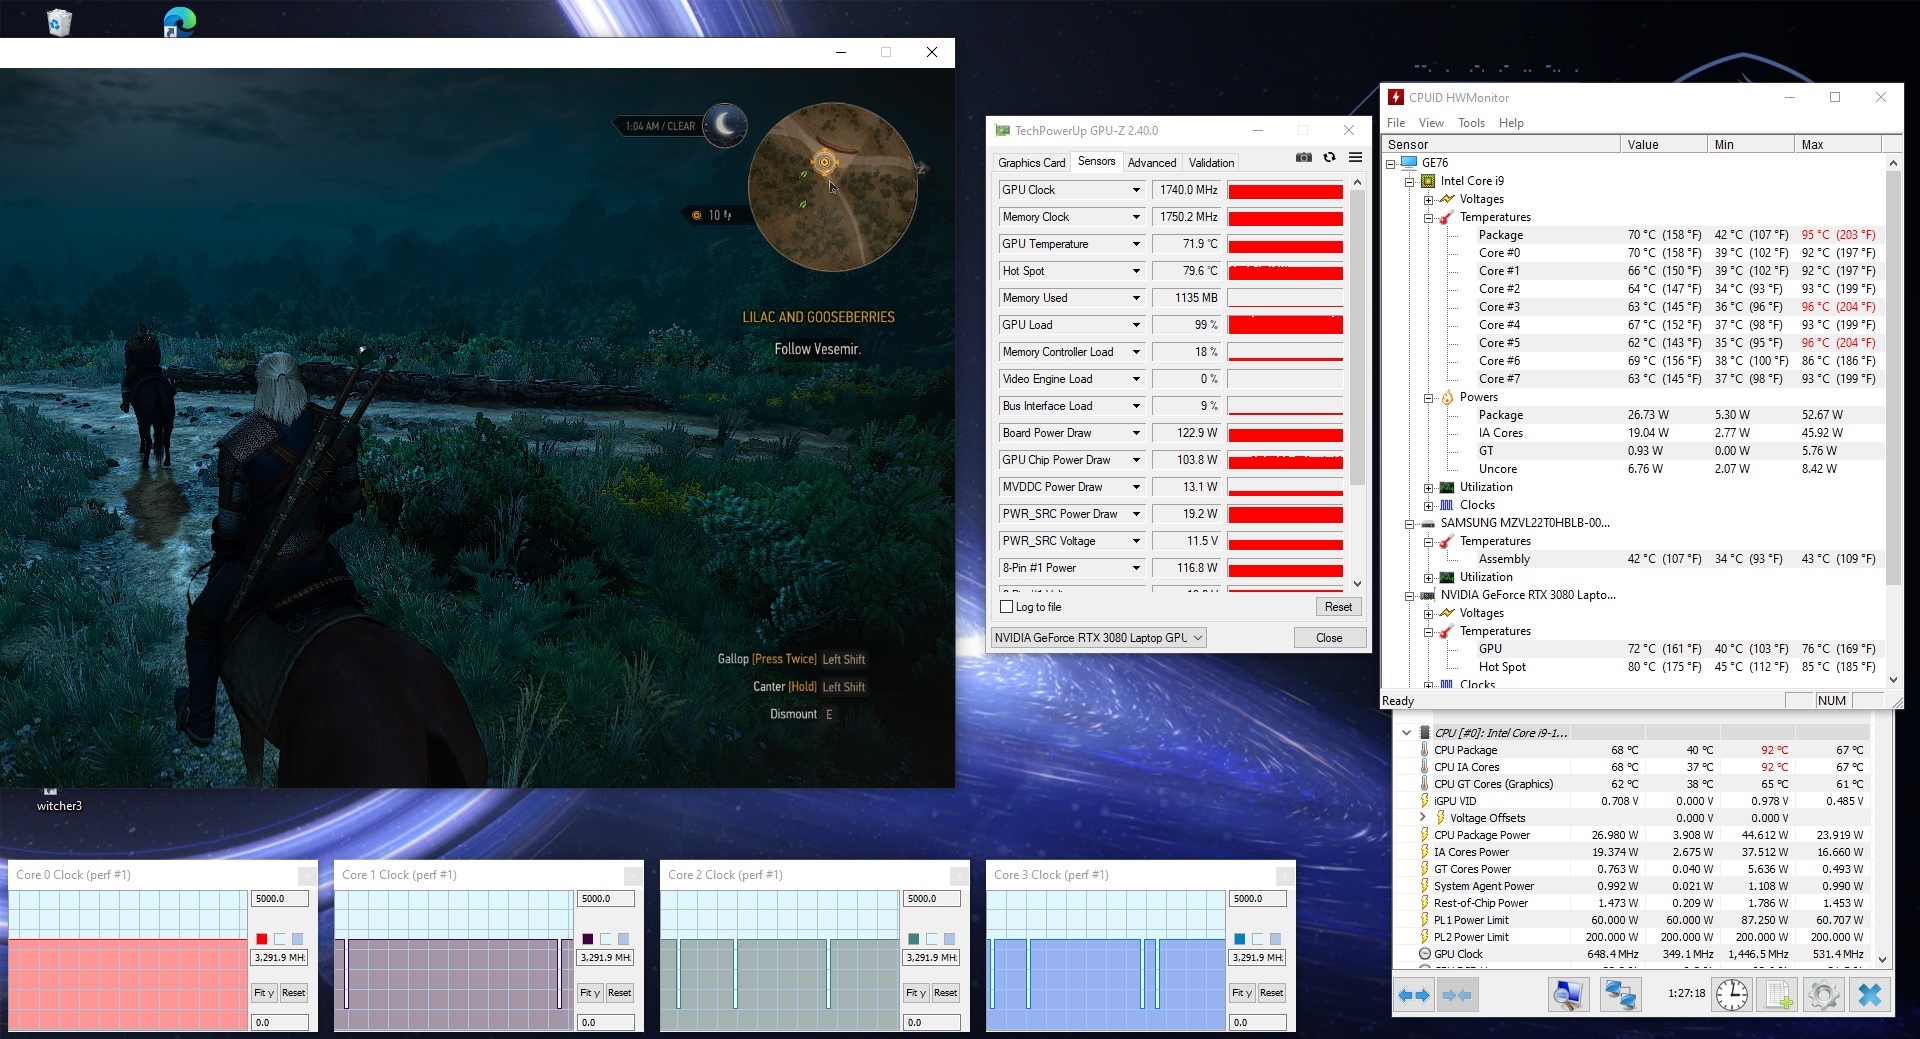
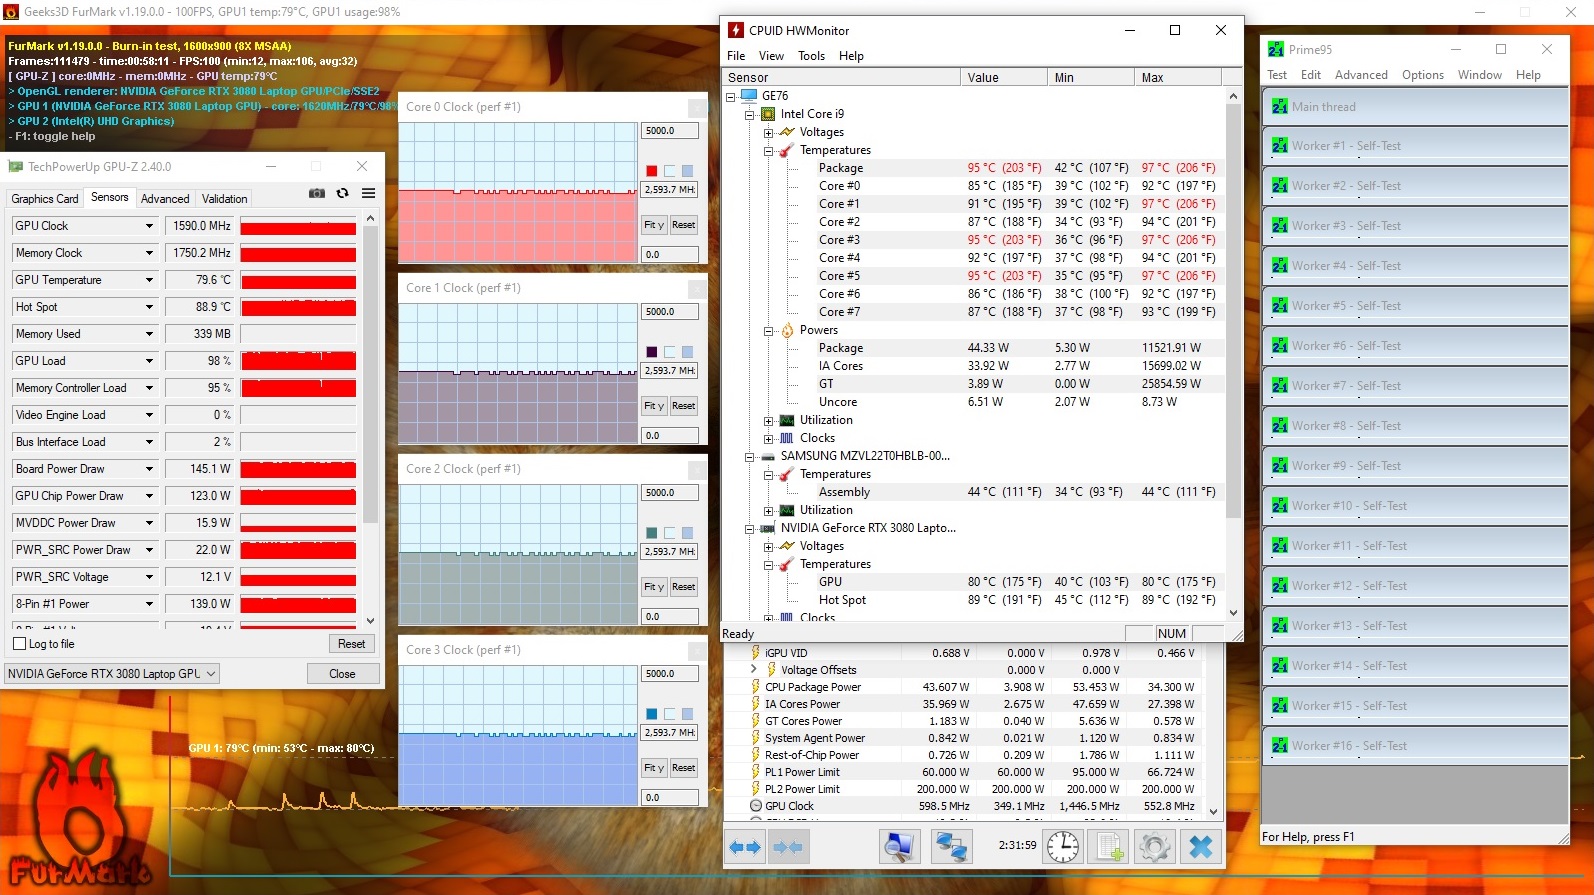
Durante nuestro test de estrés de resistencia, las temperaturas interiores subieron hasta los 97 °C, pero a unos 2.6 GHz, las frecuencias de la CPU no cayeron por debajo de la velocidad base. Se alcanzaron temperaturas de hasta 96 °C durante nuestro test de resistencia de The Witcher 3, pero las frecuencias no cayeron por debajo de los 3.3 GHz. Por tanto, no hay que esperar limitaciones de rendimiento o ralentización incluso bajo carga prolongada
(-) La temperatura máxima en la parte superior es de 46 °C / 115 F, frente a la media de 40.4 °C / 105 F, que oscila entre 21.2 y 68.8 °C para la clase Gaming.
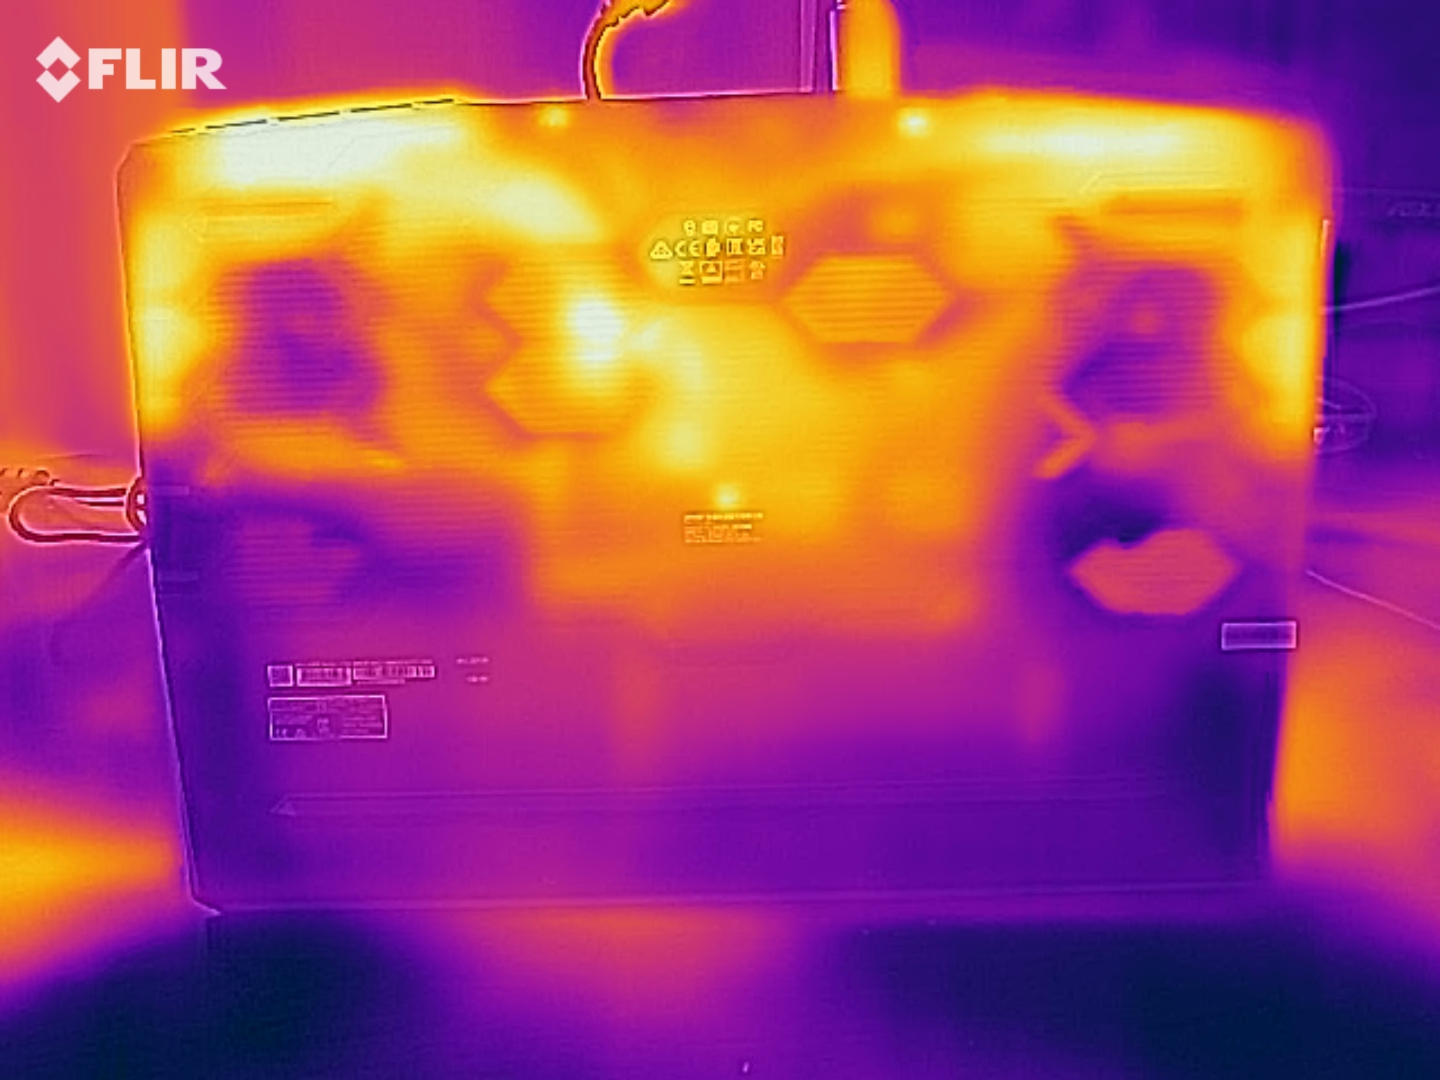
(-) El fondo se calienta hasta un máximo de 48 °C / 118 F, frente a la media de 43.2 °C / 110 F
(+) En reposo, la temperatura media de la parte superior es de 29.3 °C / 85# F, frente a la media del dispositivo de 33.9 °C / 93 F.
(-) Jugando a The Witcher 3, la temperatura media de la parte superior es de 40.7 °C / 105 F, frente a la media del dispositivo de 33.9 °C / 93 F.
(+) Los reposamanos y el panel táctil alcanzan como máximo la temperatura de la piel (34 °C / 93.2 F) y, por tanto, no están calientes.
(-) La temperatura media de la zona del reposamanos de dispositivos similares fue de 28.8 °C / 83.8 F (-5.2 °C / -9.4 F).
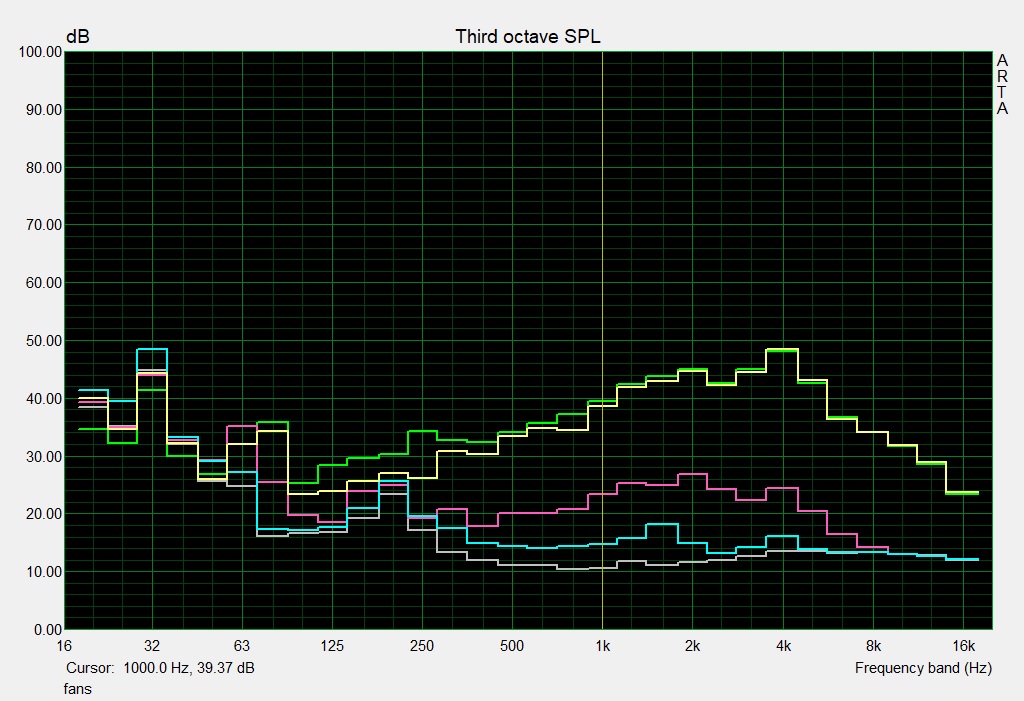
Altavoces
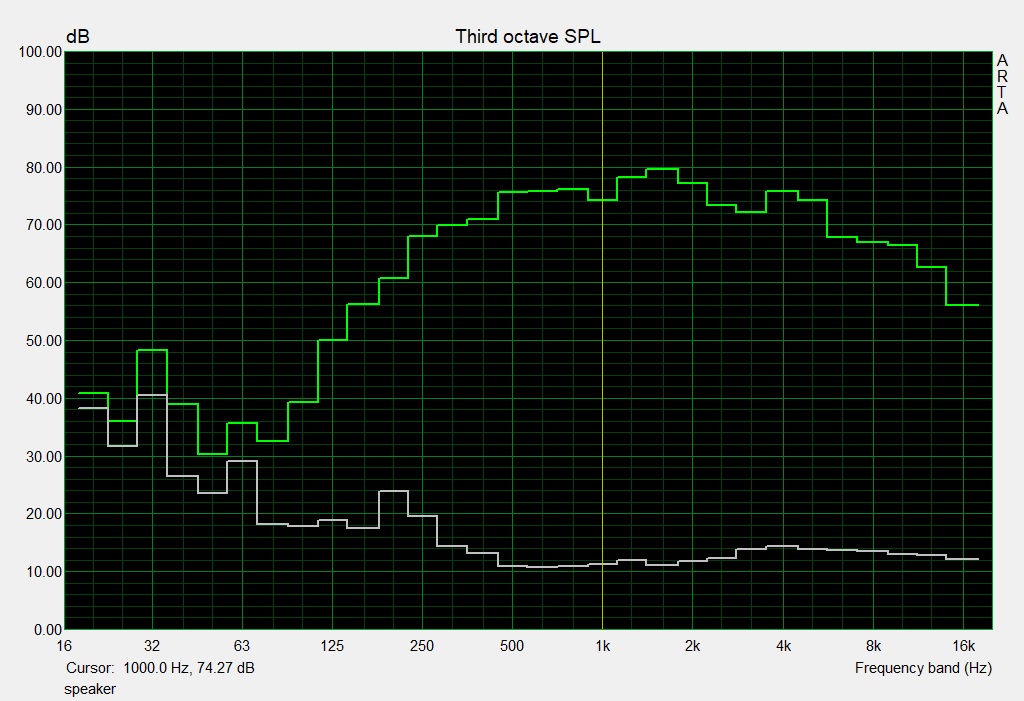
Los altavoces del MSI GE76 Raider UH11 ofrecen un volumen relativamente alto y un espectro de sonido bastante amplio. Esto los hace muy adecuados para reproducir contenido multimedia. No obstante, se recomiendan altavoces externos o auriculares cuando se juega debido al nivel de ruido algo fuerte de los ventiladores
MSI GE76 Raider 11UH-472US análisis de audio
(+) | los altavoces pueden reproducir a un volumen relativamente alto (#87 dB)
Graves 100 - 315 Hz
(±) | lubina reducida - en promedio 14.8% inferior a la mediana
(±) | la linealidad de los graves es media (10.5% delta a frecuencia anterior)
Medios 400 - 2000 Hz
(+) | medios equilibrados - a sólo 4.1% de la mediana
(+) | los medios son lineales (3.3% delta a la frecuencia anterior)
Altos 2 - 16 kHz
(+) | máximos equilibrados - a sólo 3.2% de la mediana
(+) | los máximos son lineales (4.3% delta a la frecuencia anterior)
Total 100 - 16.000 Hz
(+) | el sonido global es lineal (12.6% de diferencia con la mediana)
En comparación con la misma clase
» 16% de todos los dispositivos probados de esta clase eran mejores, 4% similares, 81% peores
» El mejor tuvo un delta de 6%, la media fue 18%, el peor fue ###max##%
En comparación con todos los dispositivos probados
» 11% de todos los dispositivos probados eran mejores, 3% similares, 86% peores
» El mejor tuvo un delta de 4%, la media fue 24%, el peor fue ###max##%
Gigabyte Aero 17 HDR YD análisis de audio
(+) | los altavoces pueden reproducir a un volumen relativamente alto (#88 dB)
Graves 100 - 315 Hz
(-) | casi sin bajos - de media 33.9% inferior a la mediana
(±) | la linealidad de los graves es media (9.6% delta a frecuencia anterior)
Medios 400 - 2000 Hz
(+) | medios equilibrados - a sólo 2.9% de la mediana
(+) | los medios son lineales (6.5% delta a la frecuencia anterior)
Altos 2 - 16 kHz
(±) | máximos más altos - de media 5.1% más altos que la mediana
(+) | los máximos son lineales (4.7% delta a la frecuencia anterior)
Total 100 - 16.000 Hz
(±) | la linealidad del sonido global es media (19.8% de diferencia con la mediana)
En comparación con la misma clase
» 70% de todos los dispositivos probados de esta clase eran mejores, 6% similares, 24% peores
» El mejor tuvo un delta de 6%, la media fue 18%, el peor fue ###max##%
En comparación con todos los dispositivos probados
» 50% de todos los dispositivos probados eran mejores, 7% similares, 42% peores
» El mejor tuvo un delta de 4%, la media fue 24%, el peor fue ###max##%
Gestión de la energía - Más de 5 horas de duración de la batería
Consumo de energía
Con un consumo medio de 16 vatios en reposo, el MSI GE76 Raider UH11 demuestra ser más frugal que nuestros competidores elegidos. Bajo carga, el consumo está entre 103 y 266 vatios.
El adaptador de corriente incluido ofrece una capacidad de salida de 280 vatios; por tanto, tiene una calificación suficientemente alta.
| Off / Standby | |
| Ocioso | |
| Carga |
|
Clave:
min: | |
| MSI GE76 Raider 11UH-472US i9-11980HK, GeForce RTX 3080 Laptop GPU | MSI GE76 Raider 10UH i7-10870H, GeForce RTX 3080 Laptop GPU | Gigabyte Aero 17 HDR YD i9-11980HK, GeForce RTX 3080 Laptop GPU | Alienware m17 R4 i9-10980HK, GeForce RTX 3080 Laptop GPU | Media de la clase Gaming | |
|---|---|---|---|---|---|
| Power Consumption | -29% | -44% | -116% | -9% | |
| Idle Minimum * (Watt) | 10 | 15.5 -55% | 25 -150% | 42 -320% | 13.1 ? -31% |
| Idle Average * (Watt) | 16 | 31.3 -96% | 28 -75% | 48 -200% | 18.8 ? -18% |
| Idle Maximum * (Watt) | 26 | 31.7 -22% | 40 -54% | 58 -123% | 24.4 ? 6% |
| Load Average * (Watt) | 103 | 93.6 9% | 114 -11% | 124 -20% | 108.5 ? -5% |
| Witcher 3 ultra * (Watt) | 204 | 233 -14% | 176 14% | 219 -7% | |
| Load Maximum * (Watt) | 266 | 260.3 2% | 236 11% | 337 -27% | 254 ? 5% |
* ... más pequeño es mejor
Energy consumption during The Witcher 3 / Stress test
Duración de la batería
El MSI GE76 Raider UH11 logra una duración de 5:30 horas en nuestro test Wi-Fi en el mundo real. Esto significa que usa su batería de 99.9 Wh de forma similar a la de dispositivos comparables
| MSI GE76 Raider 11UH-472US i9-11980HK, GeForce RTX 3080 Laptop GPU, 99.9 Wh | MSI GE76 Raider 10UH i7-10870H, GeForce RTX 3080 Laptop GPU, 99.9 Wh | Gigabyte Aero 17 HDR YD i9-11980HK, GeForce RTX 3080 Laptop GPU, 99 Wh | Alienware m17 R4 i9-10980HK, GeForce RTX 3080 Laptop GPU, 86 Wh | Media de la clase Gaming | |
|---|---|---|---|---|---|
| Duración de Batería | 11% | -9% | -38% | 12% | |
| Reader / Idle (h) | 7.8 | 8.2 5% | 8.71 ? 12% | ||
| WiFi v1.3 (h) | 5.5 | 6.3 15% | 5.6 2% | 2.4 -56% | 6.98 ? 27% |
| Load (h) | 1.5 | 1.7 13% | 1.2 -20% | 1.2 -20% | 1.47 ? -2% |
Pro
Contra
Veredicto - Un portátil para juegos de última generación

El MSI GE76 Raider 11UH ofrece casi todas las características de su predecesor. Con la nueva CPU y la misma Nvidia GeForce RTX 3080, el rendimiento está al menos a la par con elGE76 Raider 10UH y es, por tanto, muy adecuado para todos los juegos más recientes. La selección de puertos también sigue siendo la misma, pero uno de los puertos USB-C también soporta ahora Thunderbolt 4. Gracias a las buenas opciones de mantenimiento, tanto la RAM como el dispositivo de almacenamiento pueden actualizarse posteriormente.
Con el GE76 Raider UH11, MSI ofrece un portátil potente que se adapta de forma óptima a todos los juegos modernos.
A diferencia del GE76 Raider 10UH, el 11UH se ofrece ahora también con pantallas de mayor resolución. Nuestra configuración de prueba presenta la tasa de refresco más alta de 360 Hz, que sólo está disponible en Full HD. El limitado espacio de color del panel merece una crítica, ya que no es aceptable teniendo en cuenta el precio. En general, el GE76 es uno de los mejores portátiles para juegos con la RTX 3080.
El hecho de que la webcam de 2.1 MP capture imágenes a una resolución ligeramente superior apenas se nota en el uso diario, por desgracia. Sin embargo, el MSI GE76 Raider UH11 también difiere en términos de dimensiones en comparación con dispositivos como el Gigabyte Aero 17 HDR YD y el Alienware m17 R4. Si buscas una carcasa delgada, la competencia es una mejor opción.
Actualización: El rendimiento de la CPU del modelo de producción es ahora significativamente superior al del predecesor GE76 Raider 10UH.
Precio y disponibilidad
En el momento de escribir este artículo, elMSI GE76 Raider 11UH con el Core i9-11980HK parece estar casi agotado. No obstante, puedes echar un vistazo aAmazon, ynewegg, por ejemplo, o la tienda online de MSI donde el dispositivo muestra un precio de 3.399,99 dólares configurado con 32 GB de RAM y 1 TB de almacenamiento SSD. Si te parece bien tener un procesador menos potente, la versión con elCore i7-11800H está en stock en Amazon por 3.099 dólares.
MSI GE76 Raider 11UH-472US
- 08/16/2021 v7 (old)
Mike Wobker
Price comparison

