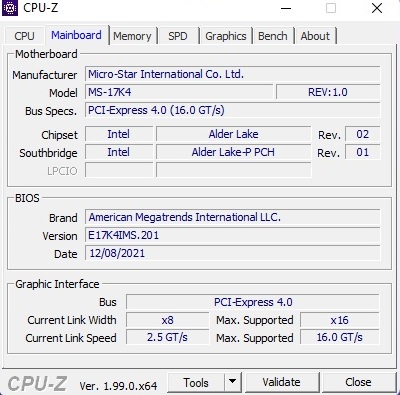
Análisis del portátil MSI GE76 Raider: Con Alder Lake y RTX 3080 Ti al cielo de los juegos

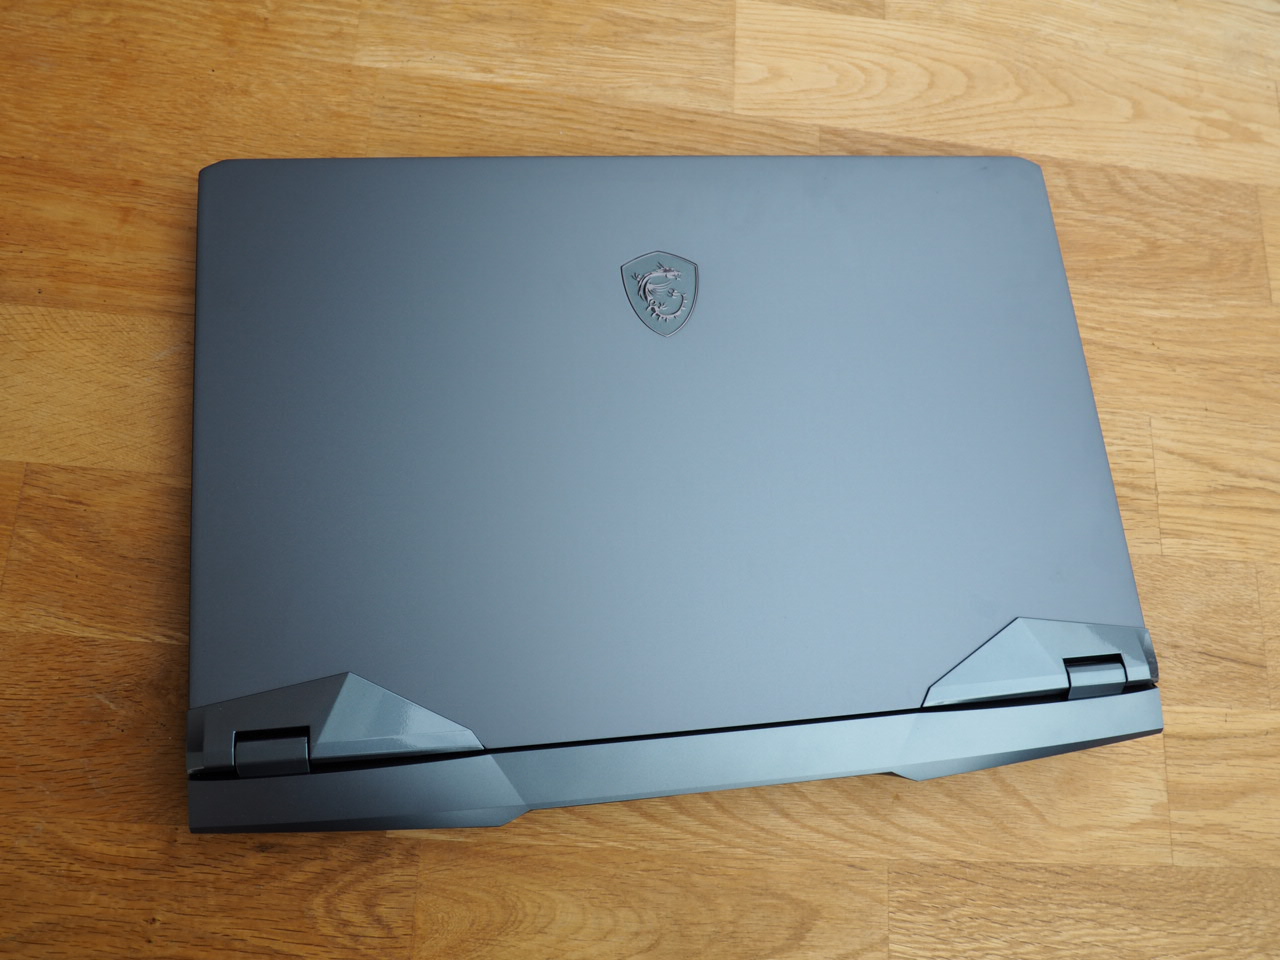
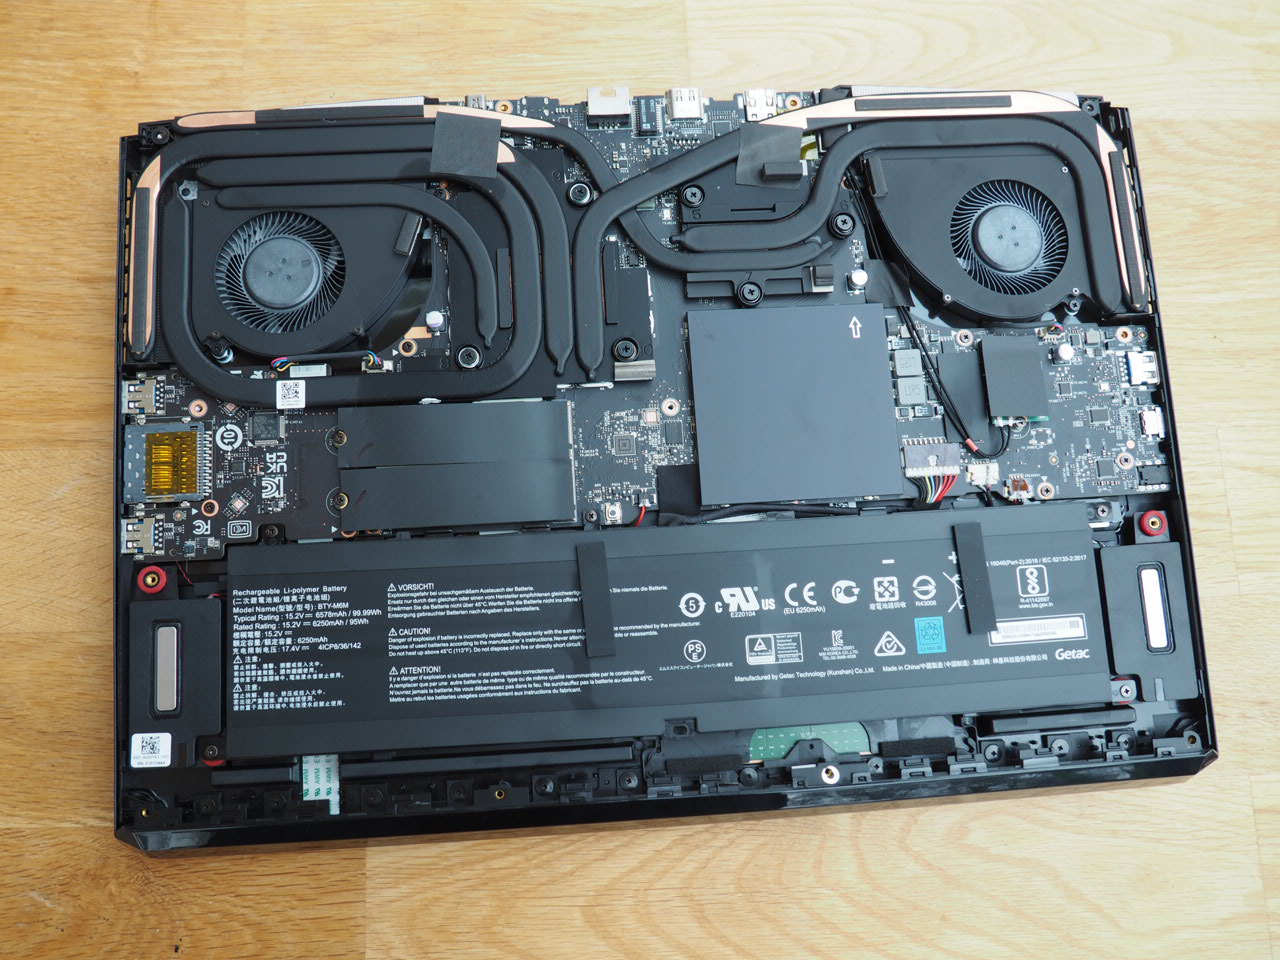
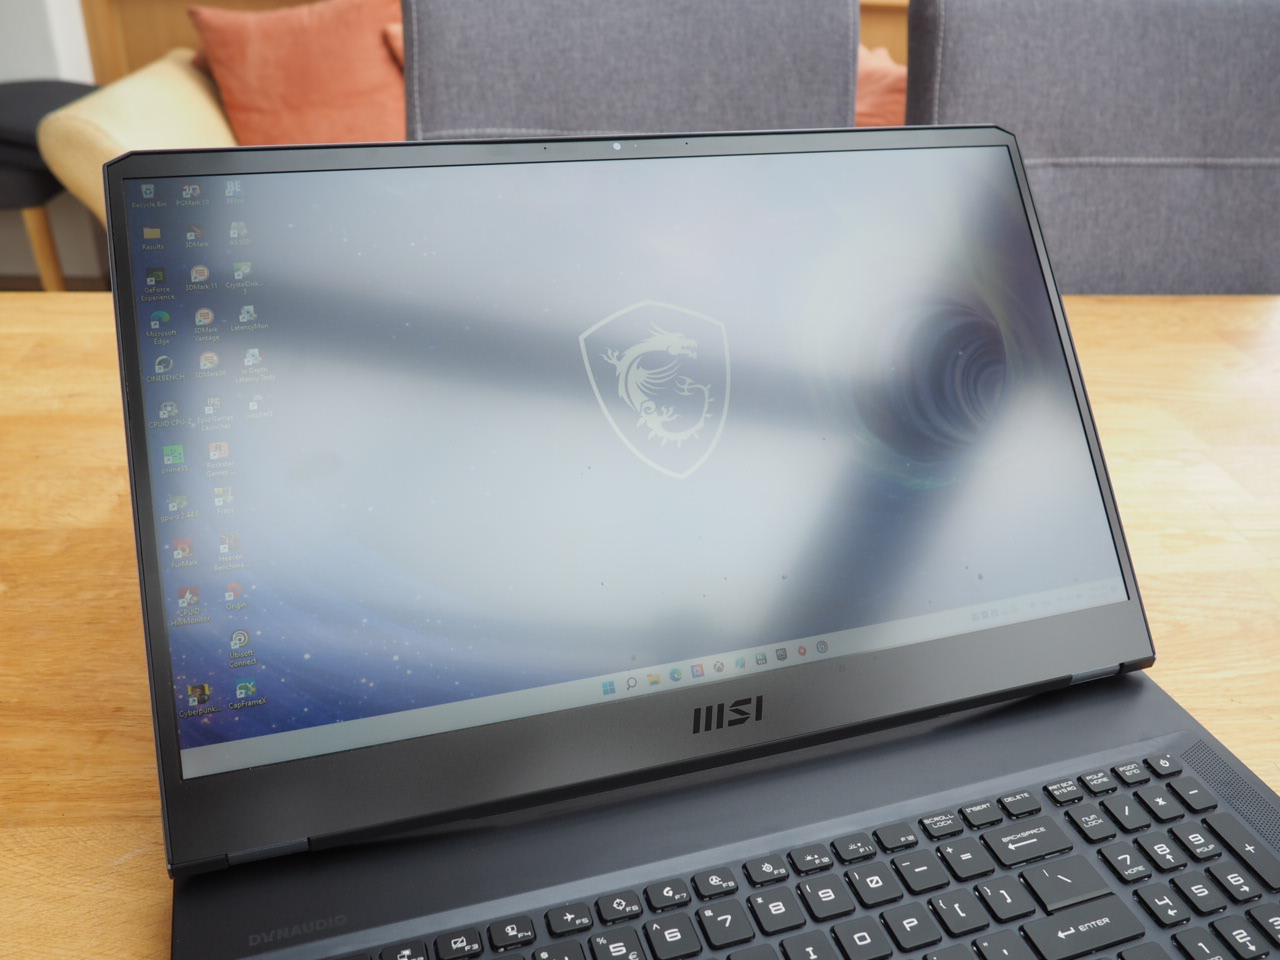
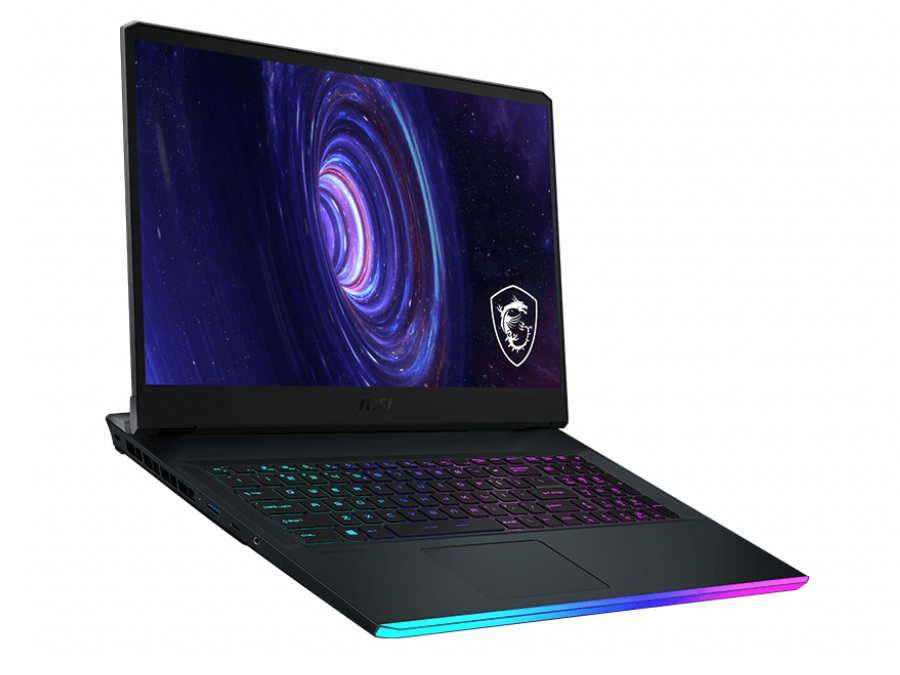
Con 3 kg y una altura de 2,6 cm (pies en la parte inferior no incluidos), el GE76 Raider no es ni un monstruo voluminoso para juegos, ni un delgado y ligero, sino una buena mezcla de ambas categorías
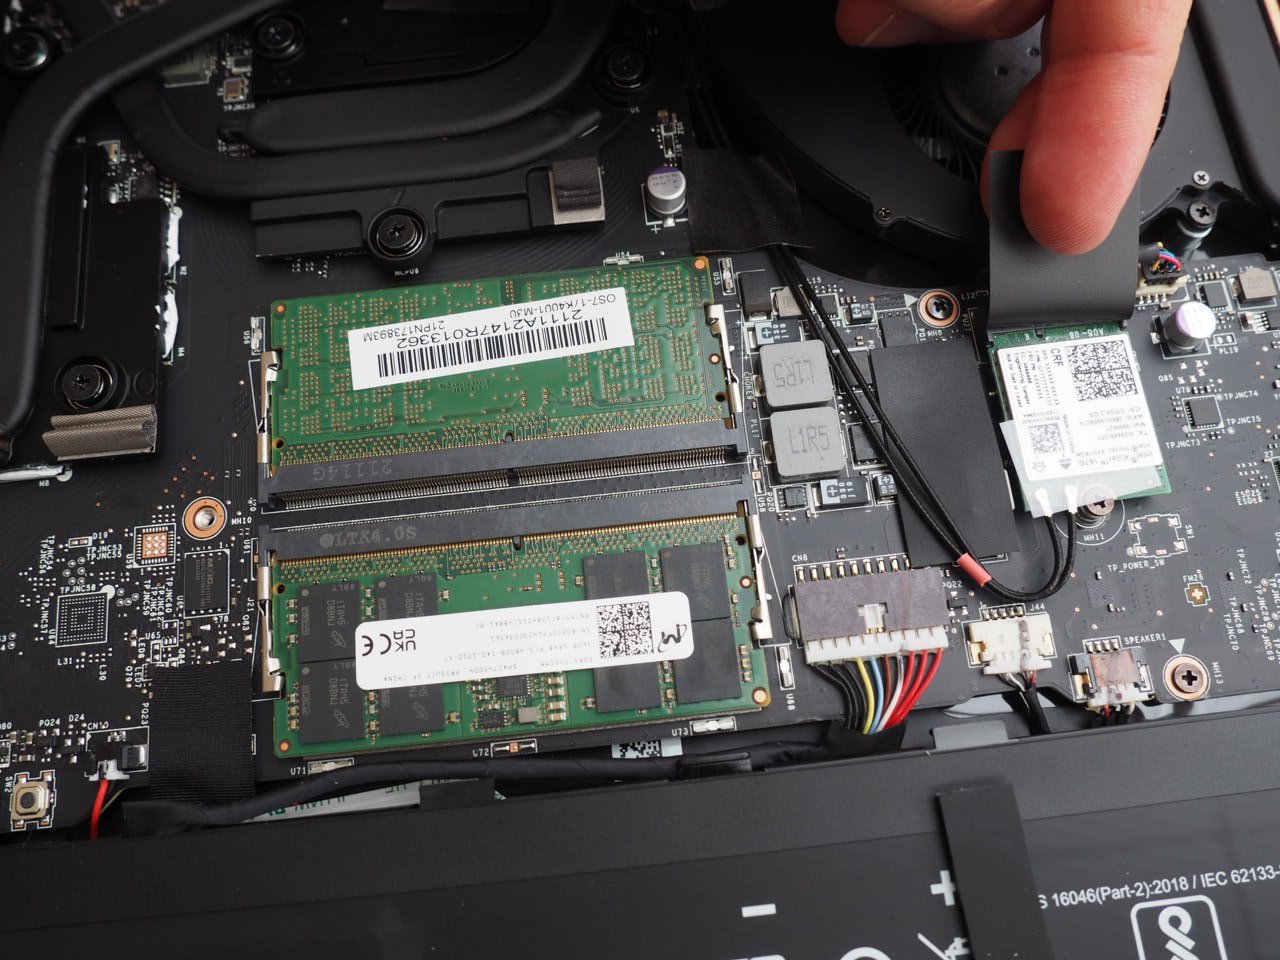
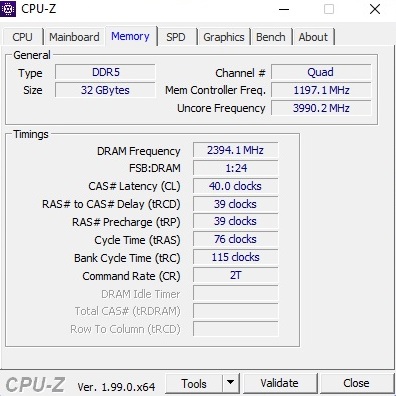
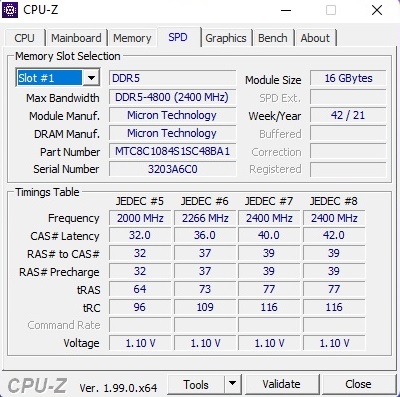
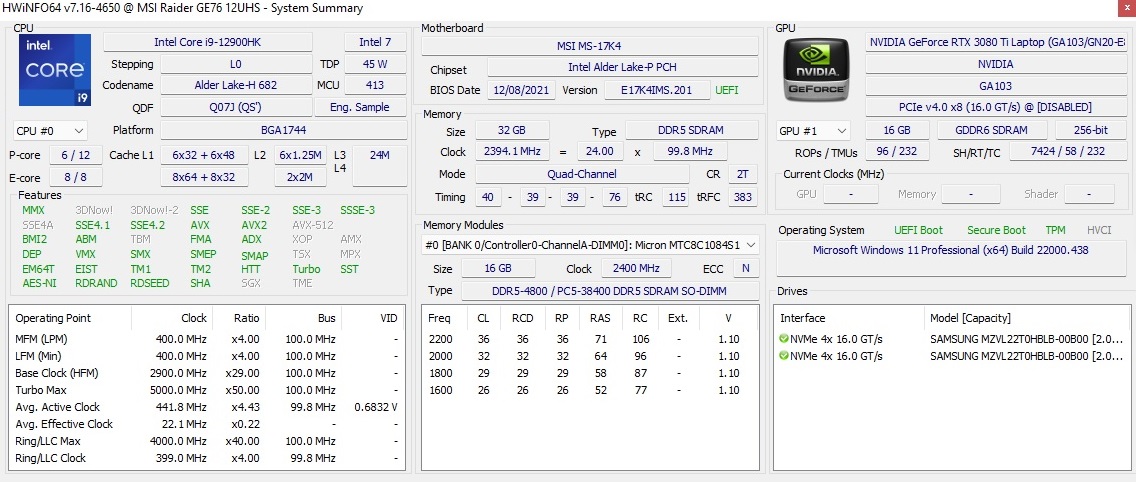
A pesar de su perfil algo delgado, el portátil de 17 pulgadas sigue estando equipado con potentes componentes. MSI utiliza la últimaGeForce RTX 3080 Tila GPU móvil estrella, que quiere atraer a los clientes con 16 GB de VRAM GDDR6. Luego está el nuevo y rapidísimo Intel Alder LakeCore i9-12900HKun chip con catorce núcleos, que puede ejecutar hasta 20 hilos simultáneamente. Nuestro ejemplar, que es una unidad de preproducción (pre-muestra), también lleva 32 GB de RAM DDR5-4800 (2x 16 GB de doble canal) así como dos SSDs NVMe de 2 TB. La resolución de la pantalla está limitada a 1080p, pero es un panel muy rápido con una tasa de refresco de 360 Hz
No había precio oficial de MSI en el momento del análisis, pero esperamos al menos 3000 Euros (más hacia 4000 Euros en realidad).
Los competidores son principalmente sistemas de juego de 17 pulgadas con laGeForce RTX 3080y con la máxima configuración de TGP. Entre ellos se encuentra elSchenker XMG Neo 17y elAlienware x17y elAsus ROG Zephyrus S17y elSchenker XMG Ultra 17.
Potential Competitors in Comparison
Valoración | Fecha | Modelo | Peso | Altura | Tamaño | Resolución | Precio |
|---|---|---|---|---|---|---|---|
| 87.5 % v7 (old) | 01/2022 | MSI GE76 Raider i9-12900HK, GeForce RTX 3080 Ti Laptop GPU | 3 kg | 26 mm | 17.30" | 1920x1080 | |
| 87.4 % v7 (old) | 09/2021 | Schenker XMG NEO 17 GM7TG8S i7-11800H, GeForce RTX 3080 Laptop GPU | 2.6 kg | 27.45 mm | 17.30" | 2560x1440 | |
| 89 % v7 (old) | 09/2021 | Alienware x17 RTX 3080 P48E i7-11800H, GeForce RTX 3080 Laptop GPU | 3.2 kg | 21.4 mm | 17.30" | 3840x2160 | |
| 90.1 % v7 (old) | 07/2021 | Asus ROG Zephyrus S17 GX703HSD i9-11900H, GeForce RTX 3080 Laptop GPU | 2.8 kg | 19.9 mm | 17.30" | 2560x1440 | |
| 84.9 % v7 (old) | 04/2021 | Schenker XMG Ultra 17 Rocket Lake i9-11900K, GeForce RTX 3080 Laptop GPU | 4.7 kg | 43.5 mm | 17.30" | 1920x1080 |
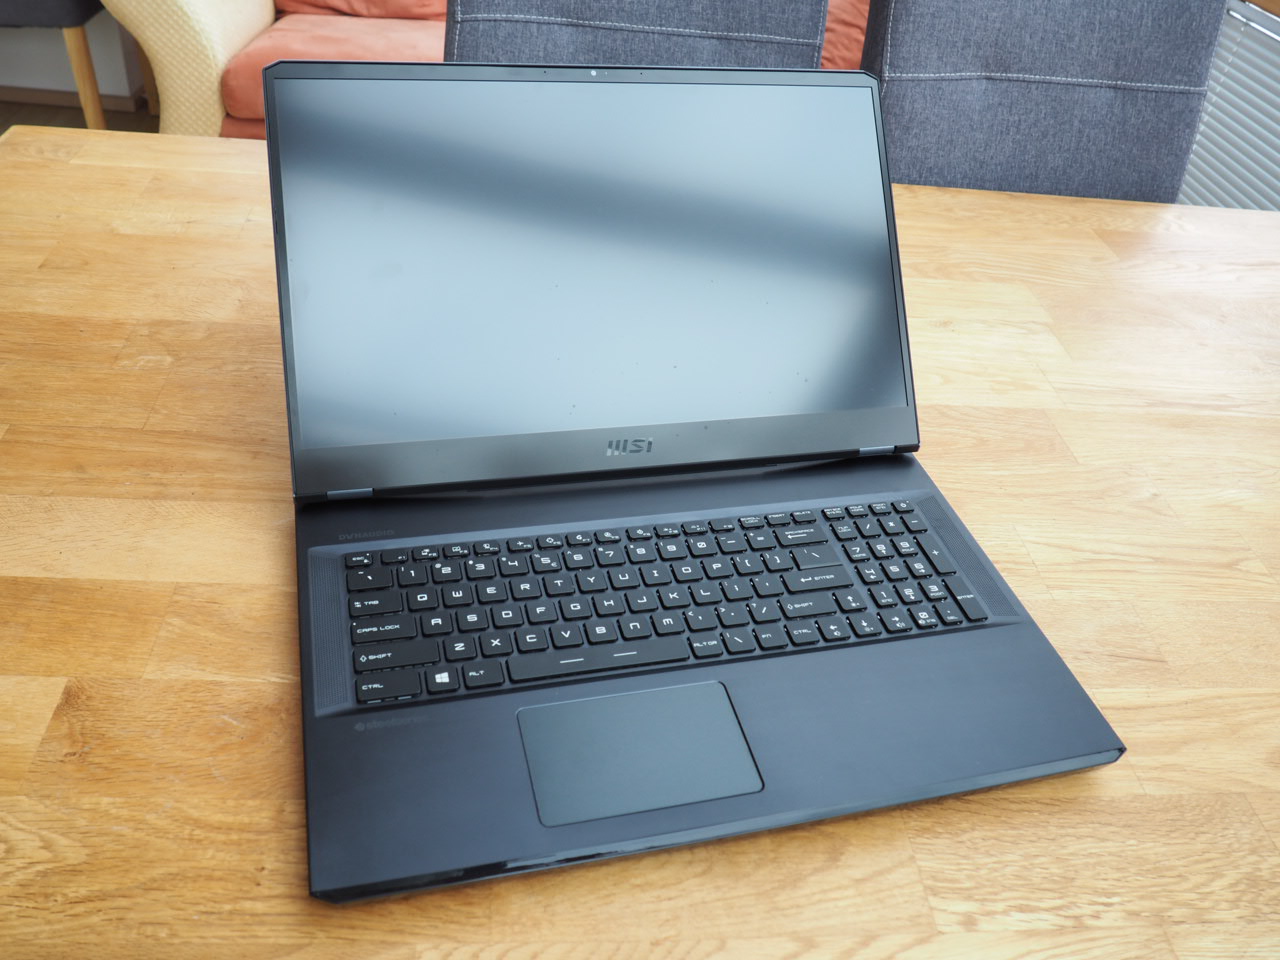
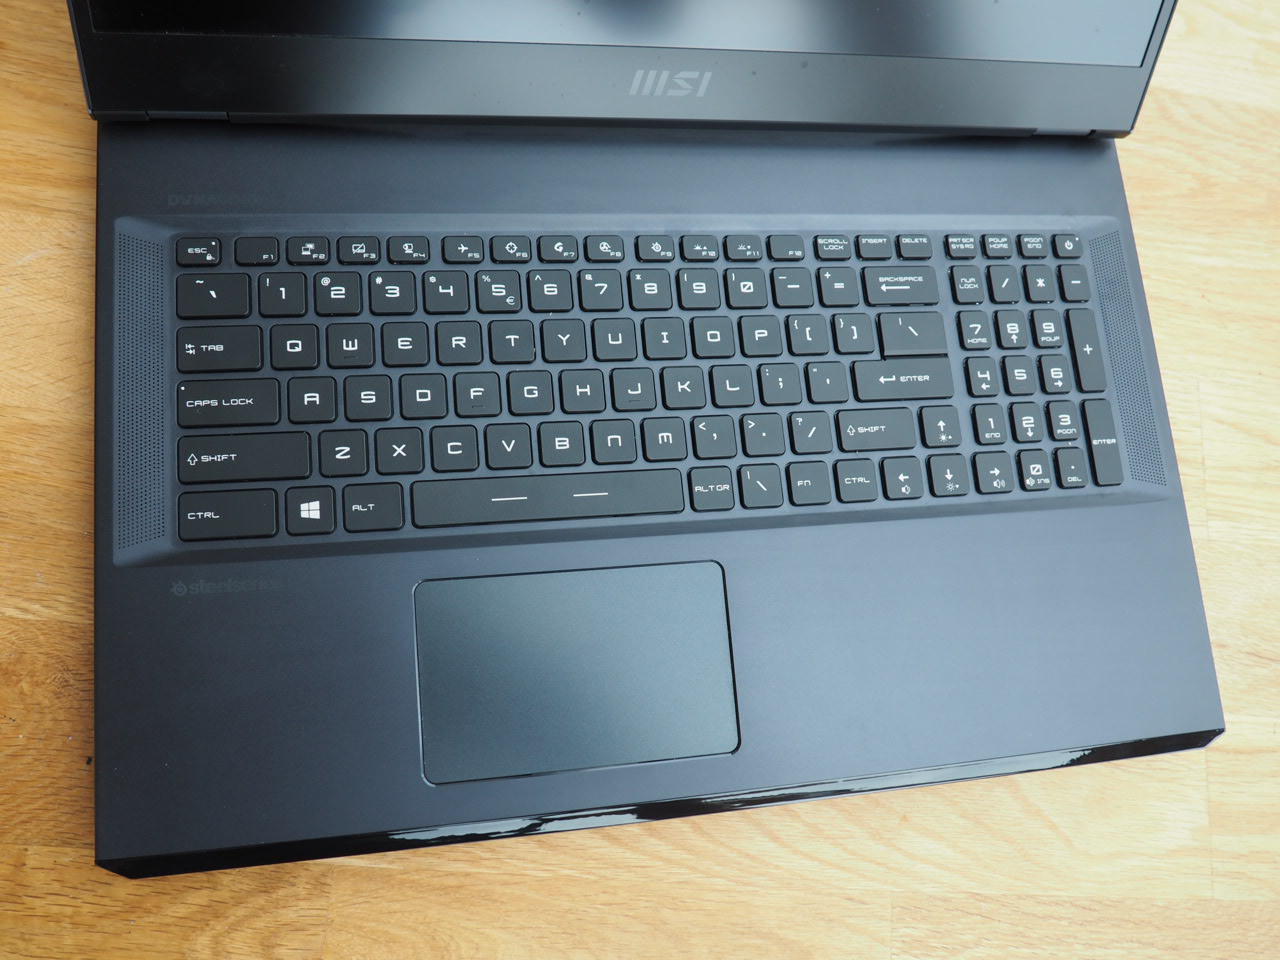
El chasis es idéntico al (pre) predecesor, por lo que no cubriremos la carcasa, la conectividad y los dispositivos de entrada como parte de este análisis. Por favor, vea elGE76 Raider 10UHpara obtener toda la información correspondiente.
Lector de tarjetas SD
| SD Card Reader - average JPG Copy Test (av. of 3 runs) | |
| Schenker XMG Ultra 17 Rocket Lake | |
| Asus ROG Zephyrus S17 GX703HSD | |
| Alienware x17 RTX 3080 P48E (AV Pro V60) | |
| Media de la clase Gaming (20.9 - 210, n=54, últimos 2 años) | |
| MSI GE76 Raider (AV PRO microSD 128 GB V60) | |
| Schenker XMG NEO 17 GM7TG8S | |
Comunicación
Cámara web


Mostrar
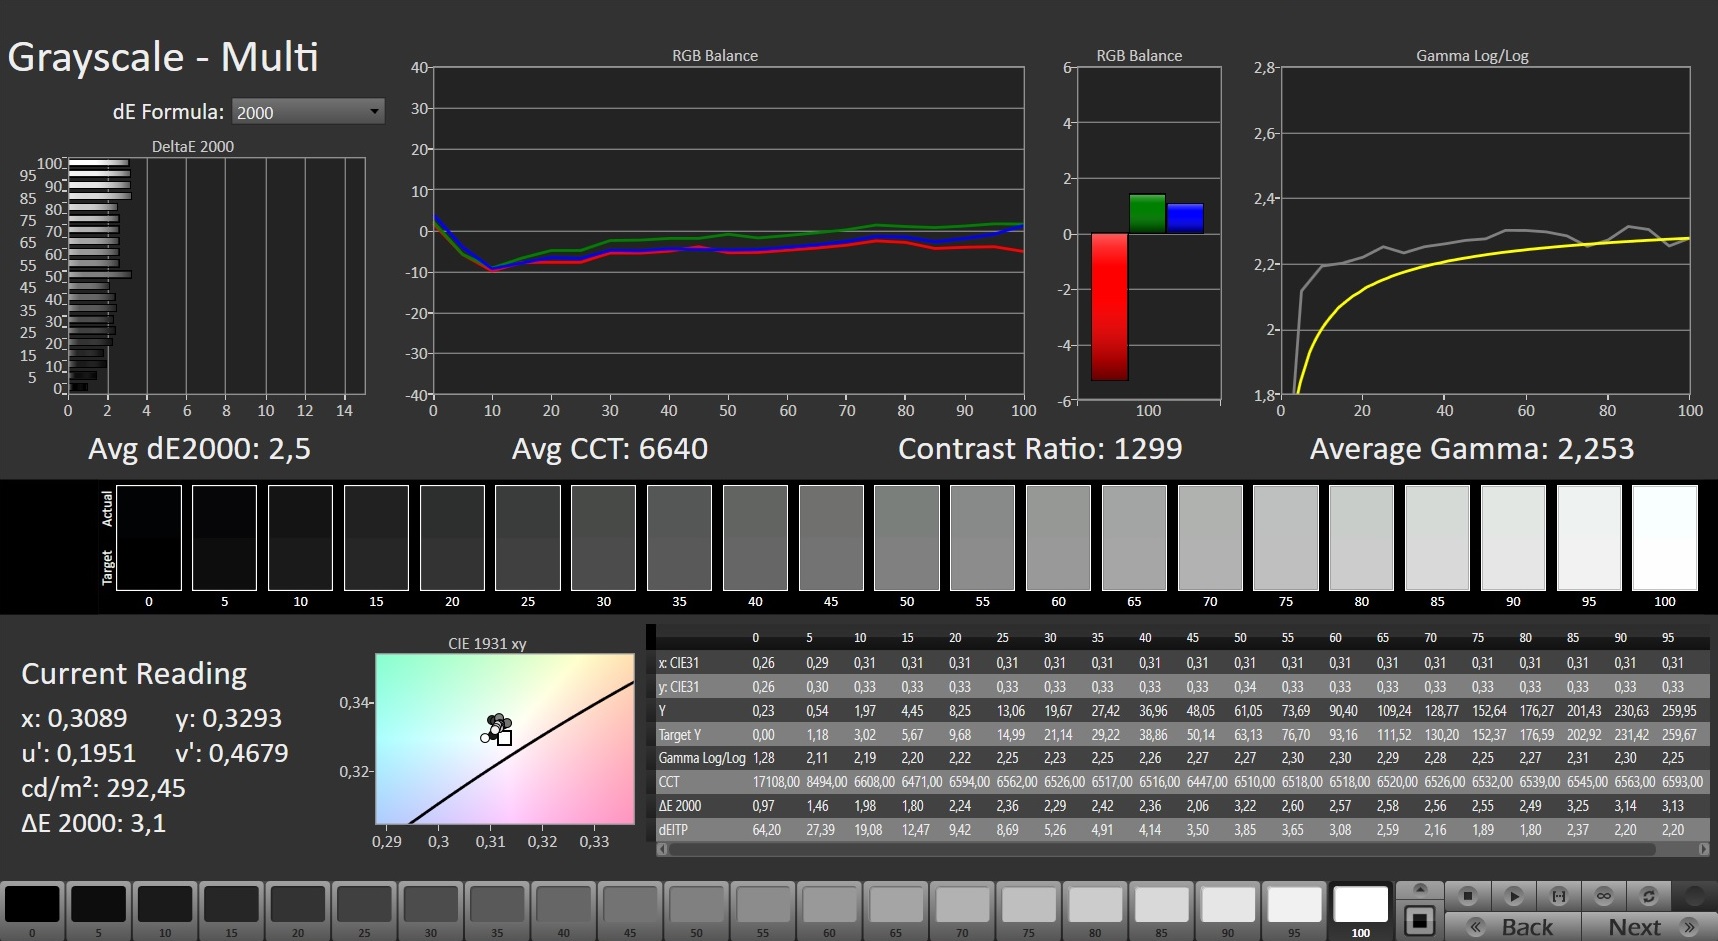
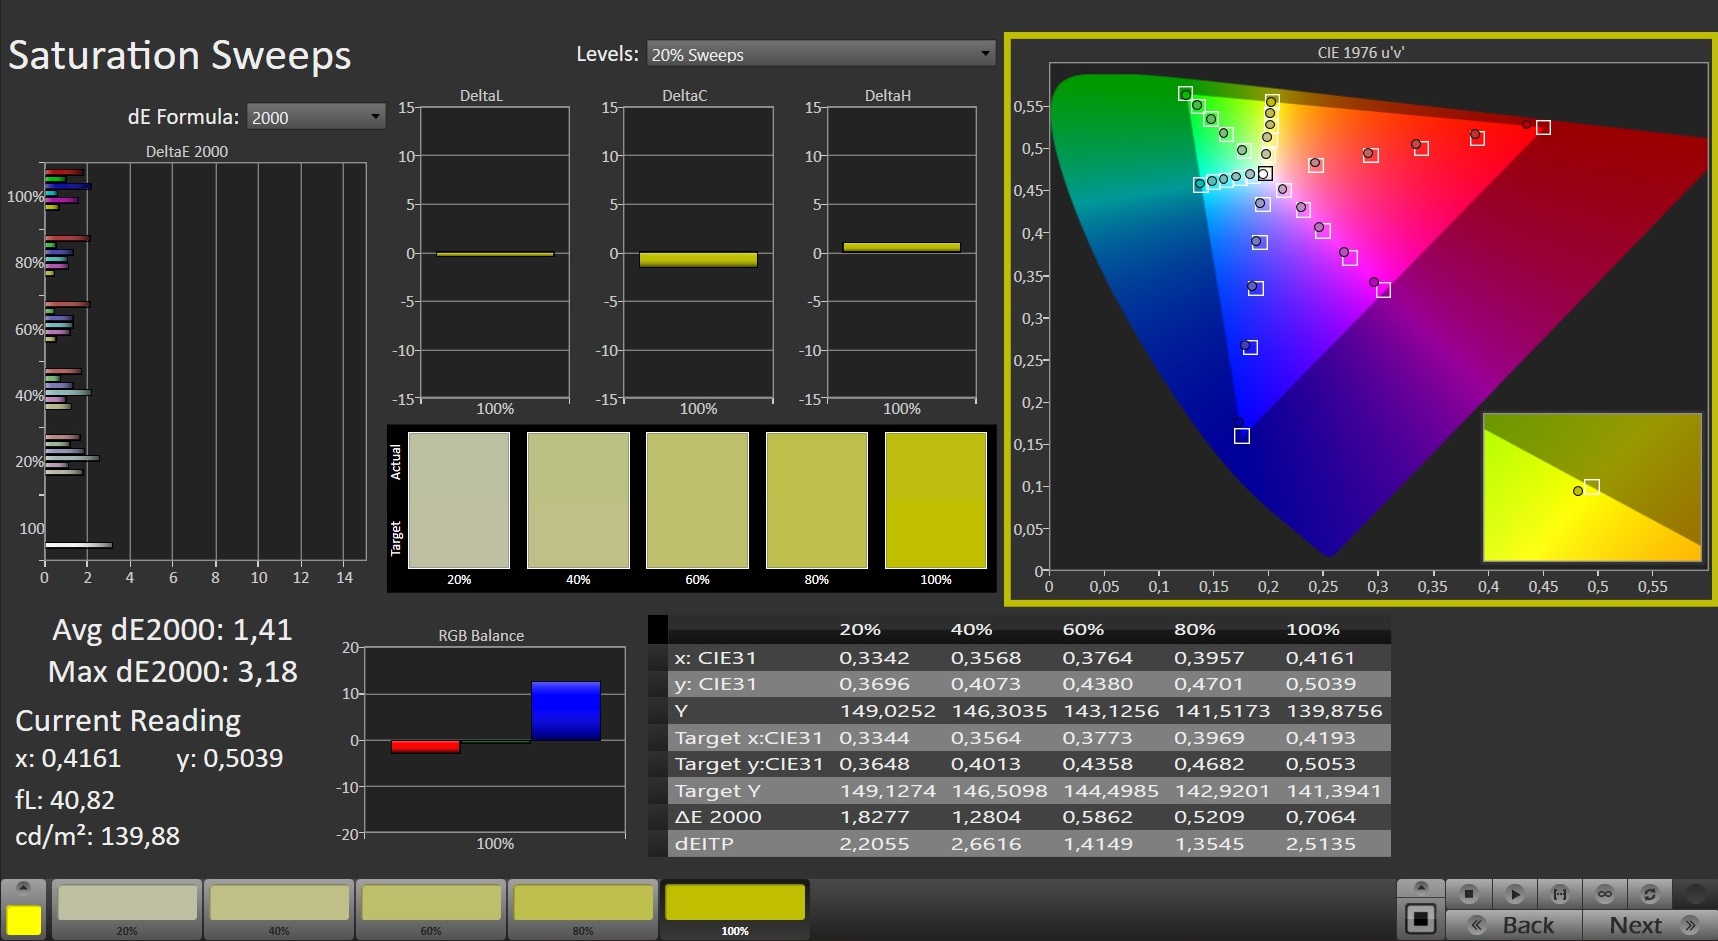
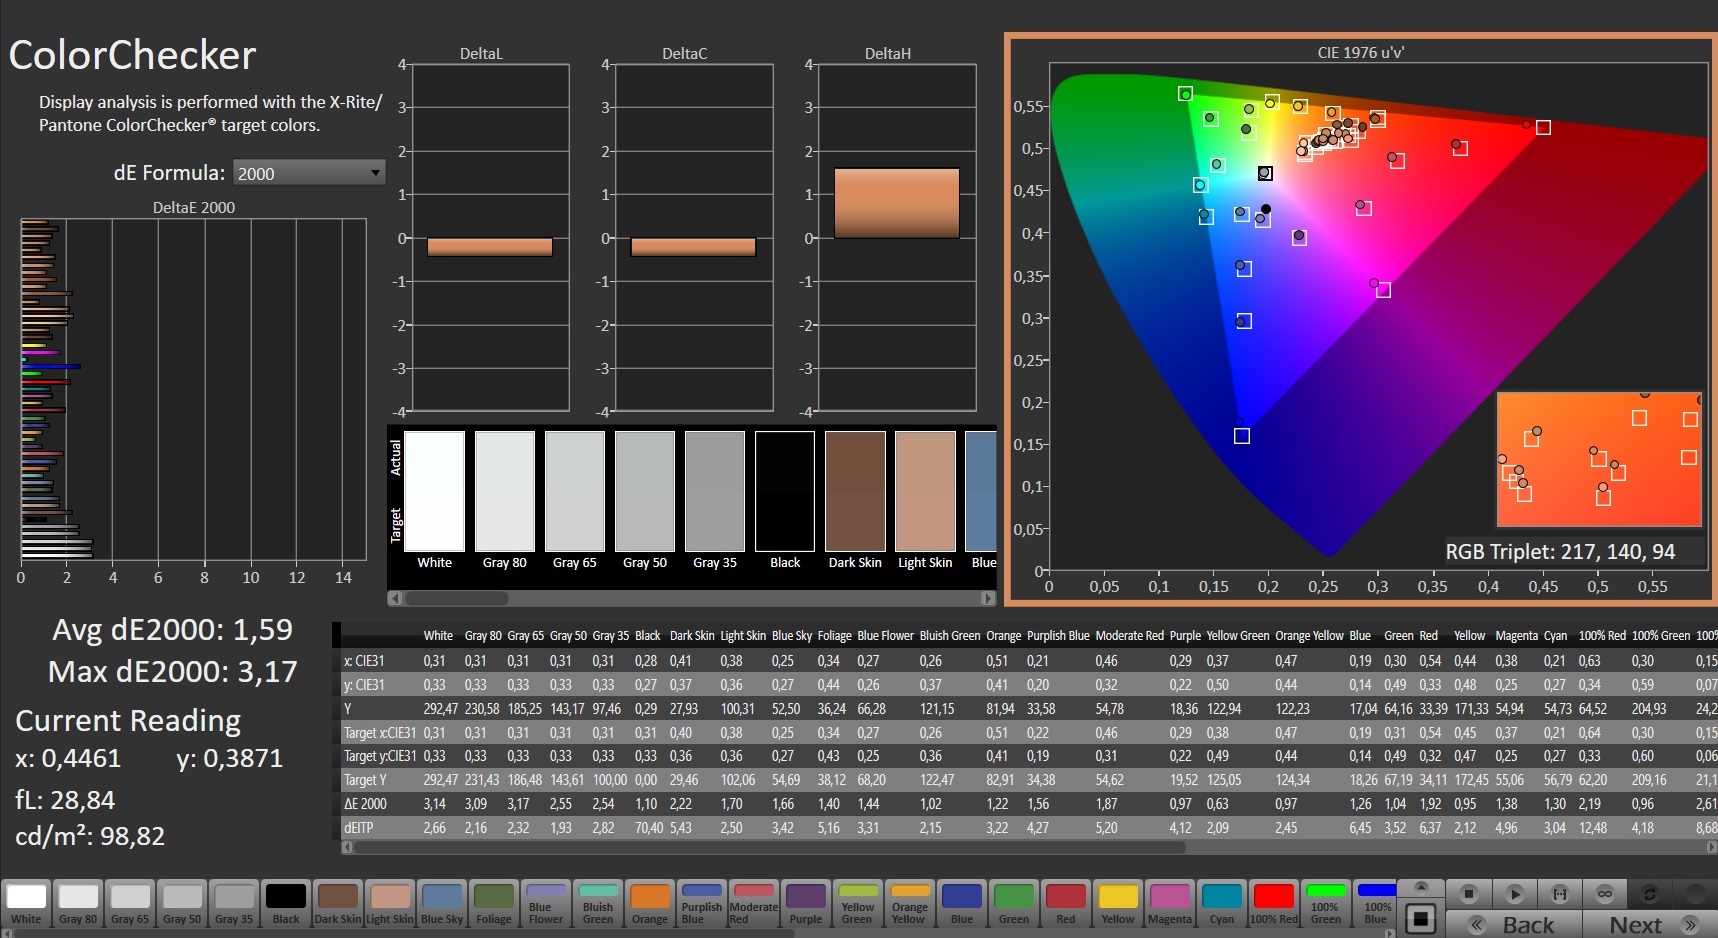
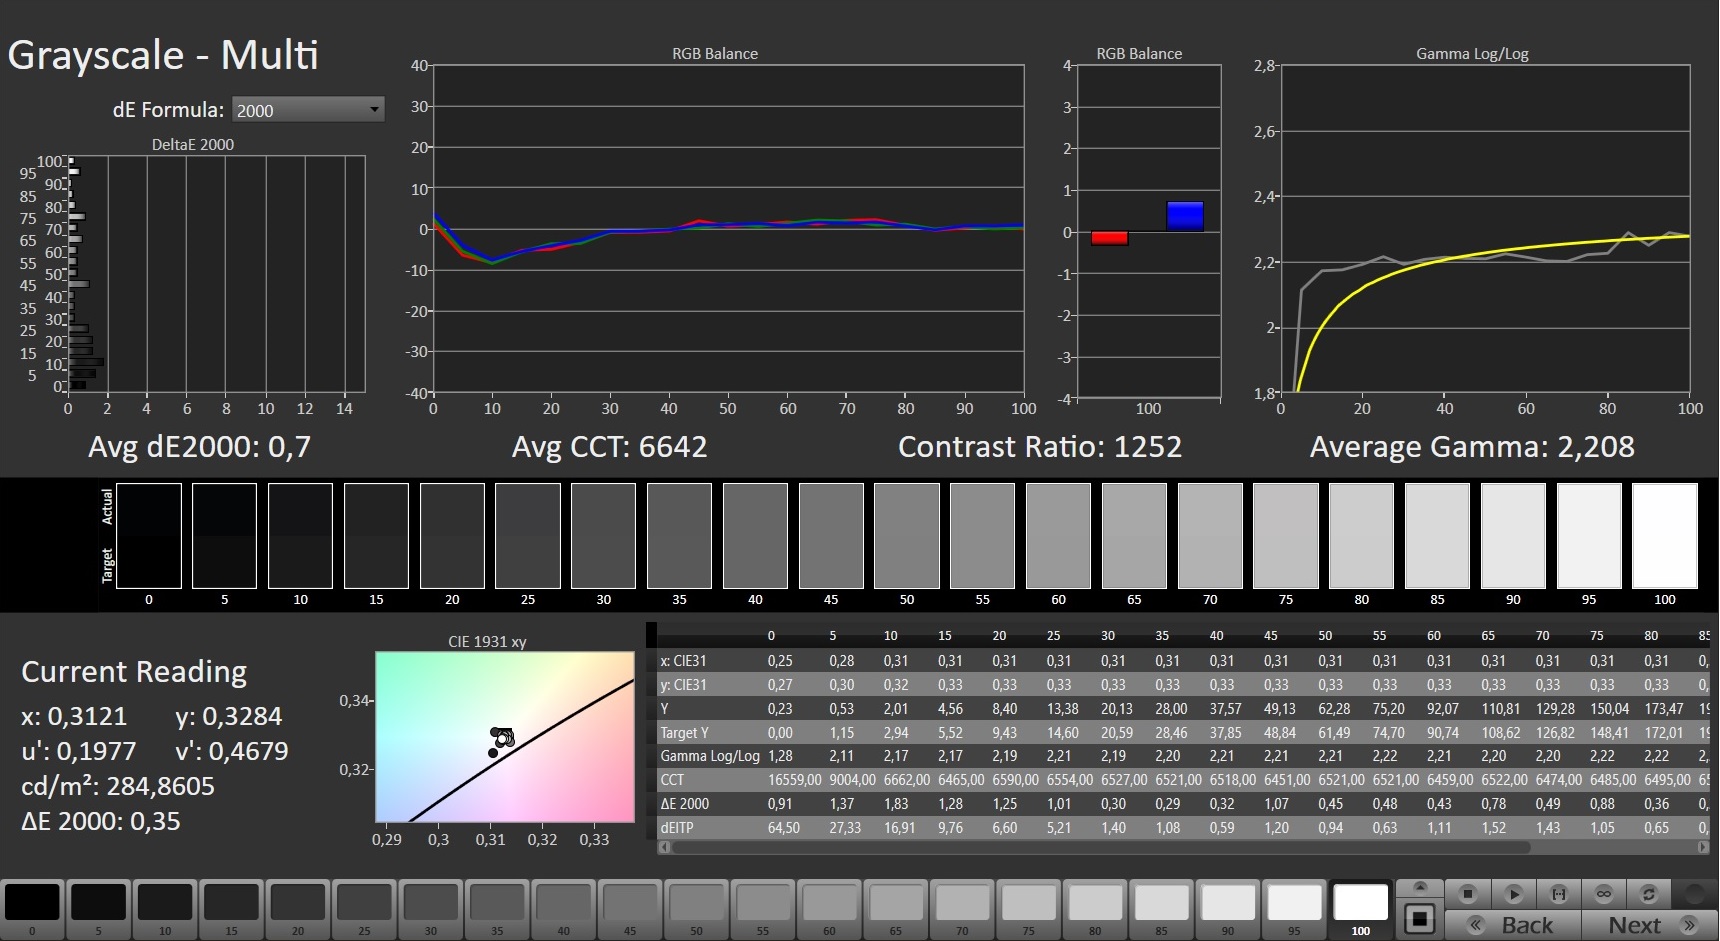
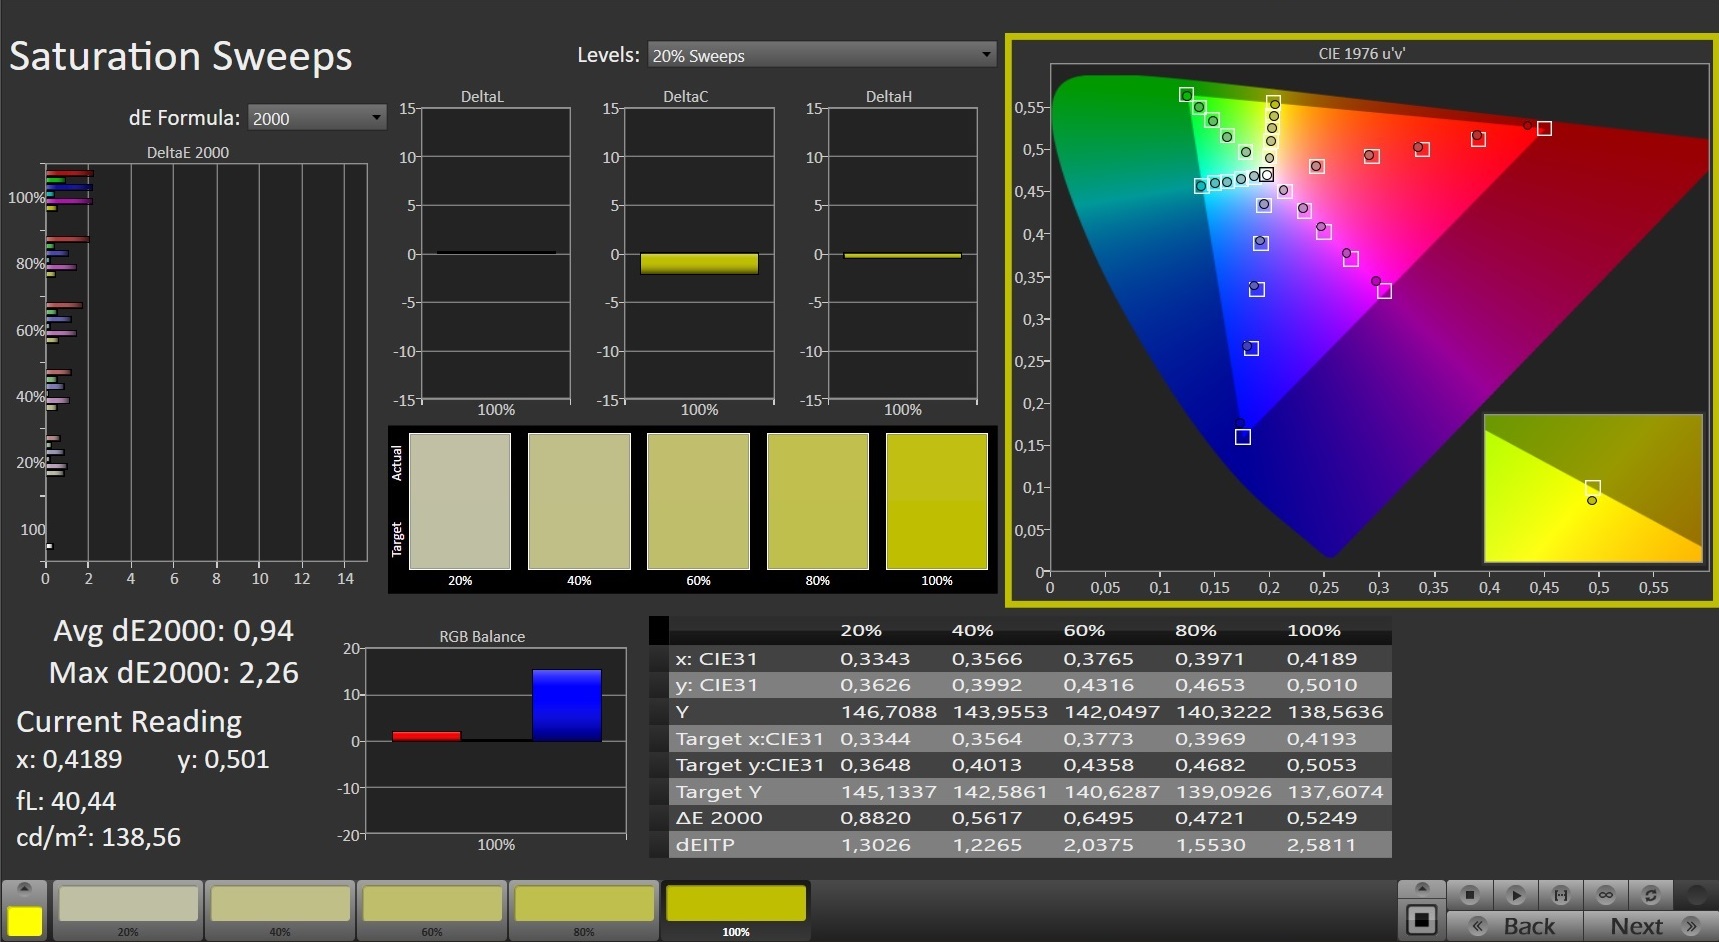
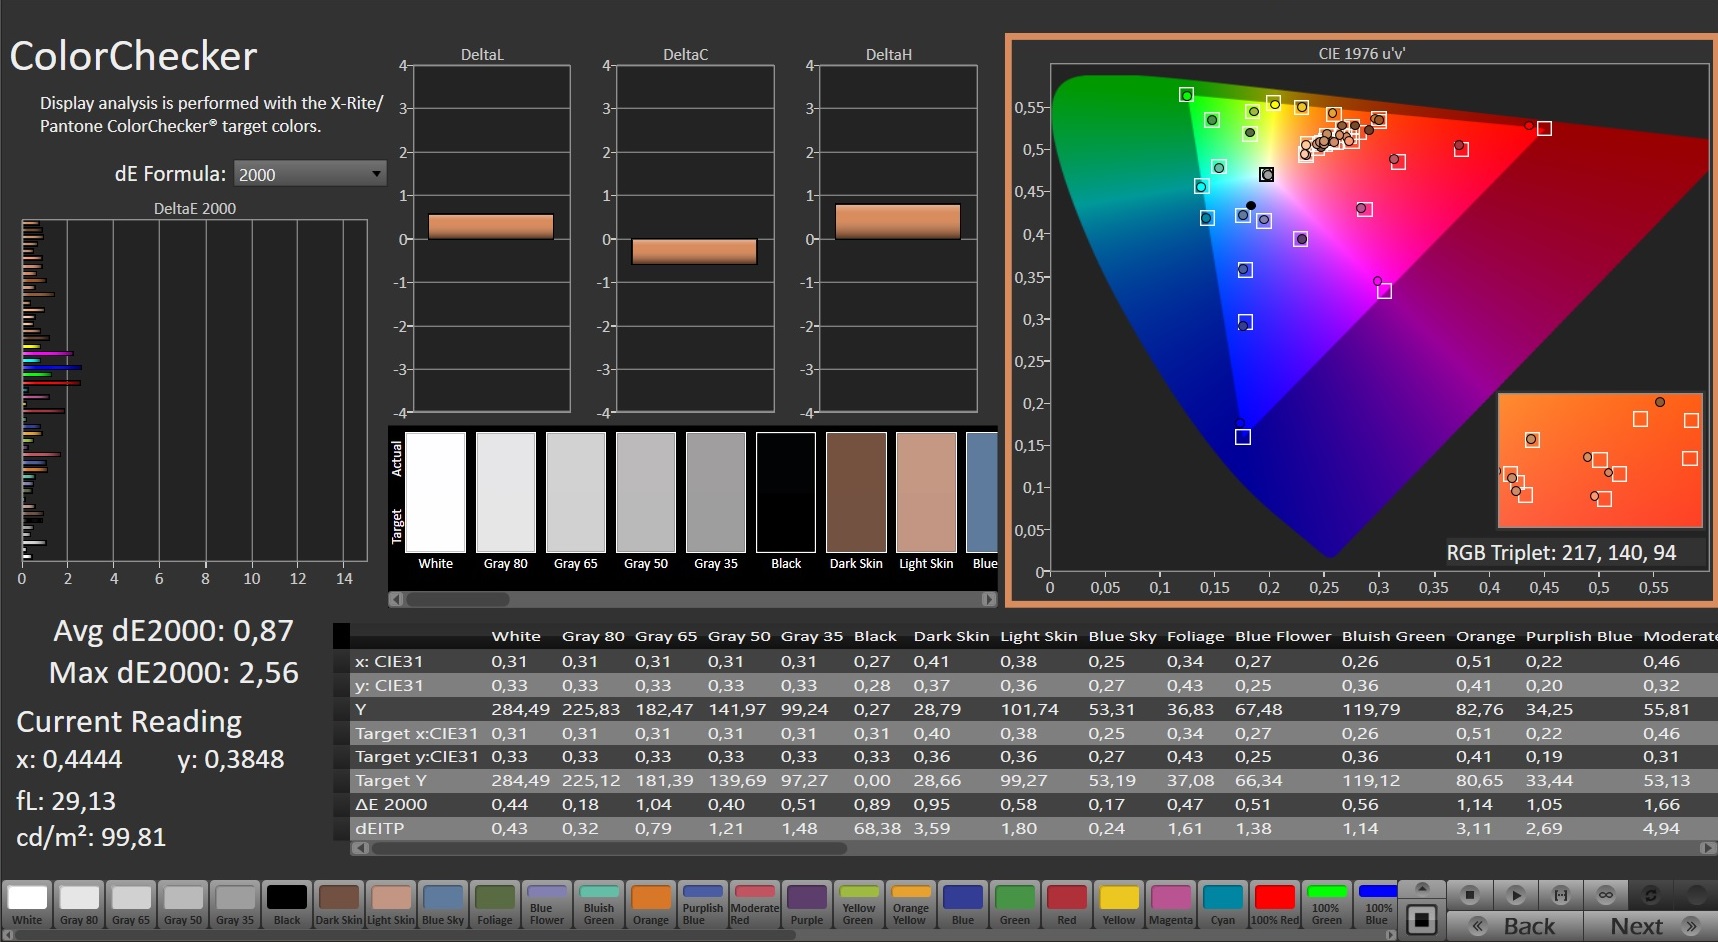
MSI utiliza aparentemente el mismo panel AUOE295 que vimos en el GE76 Raider 11UH pero con mejoras en múltiples frentes. Además de una gama de colores más amplia (94 vs. 74% sRGB), la precisión del color también es mejor. Tanto la escala de grises como las desviaciones del corrector de color son ya muy buenas (DeltaE inferior a 3) en nuestras mediciones CalMAN sin calibración.
Todas las demás mediciones son comparables. Un valor de negro de 0,23 cd/m² es tan respetable como una relación de contraste de 1261:1. Sin embargo, el fabricante debería mejorar el brillo. Una luminancia media de 290 nits podría ser suficiente para la mayoría de los escenarios de interior, pero el GE76 no es muy bueno en exteriores. Por otro lado, los tiempos de respuesta son estupendos (<10 ms), por lo que incluso los shooters rápidos en primera persona pueden jugarse sin limitaciones.
| |||||||||||||||||||||||||
iluminación: 96 %
Brillo con batería: 290 cd/m²
Contraste: 1261:1 (Negro: 0.23 cd/m²)
ΔE ColorChecker Calman: 1.59 | ∀{0.5-29.43 Ø4.73}
calibrated: 0.87
ΔE Greyscale Calman: 2.5 | ∀{0.09-98 Ø4.97}
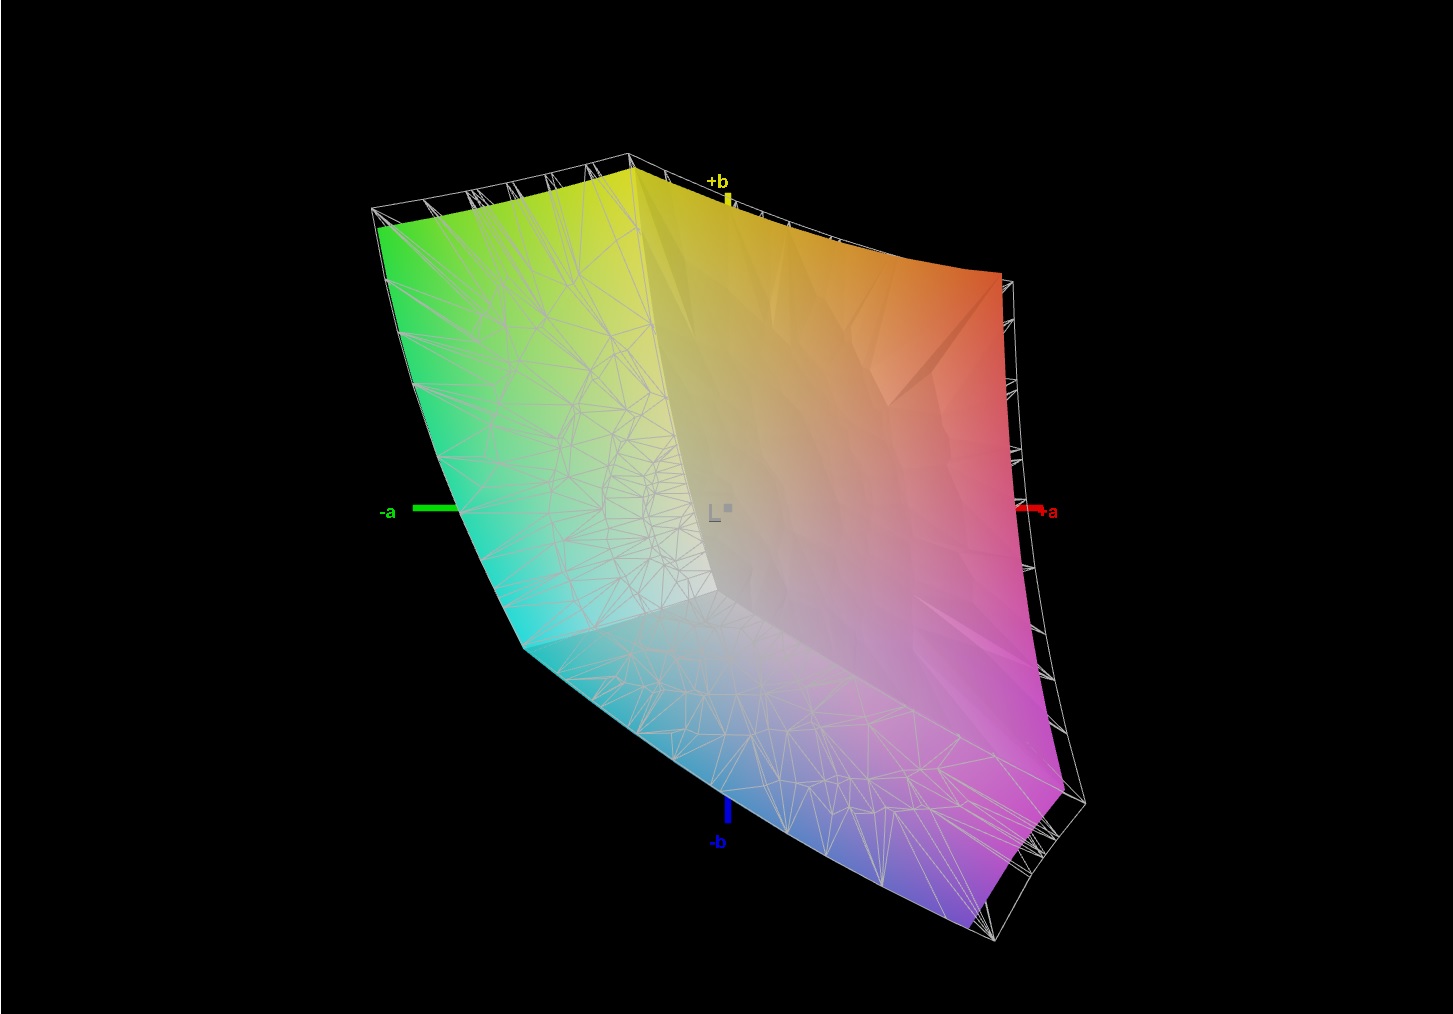
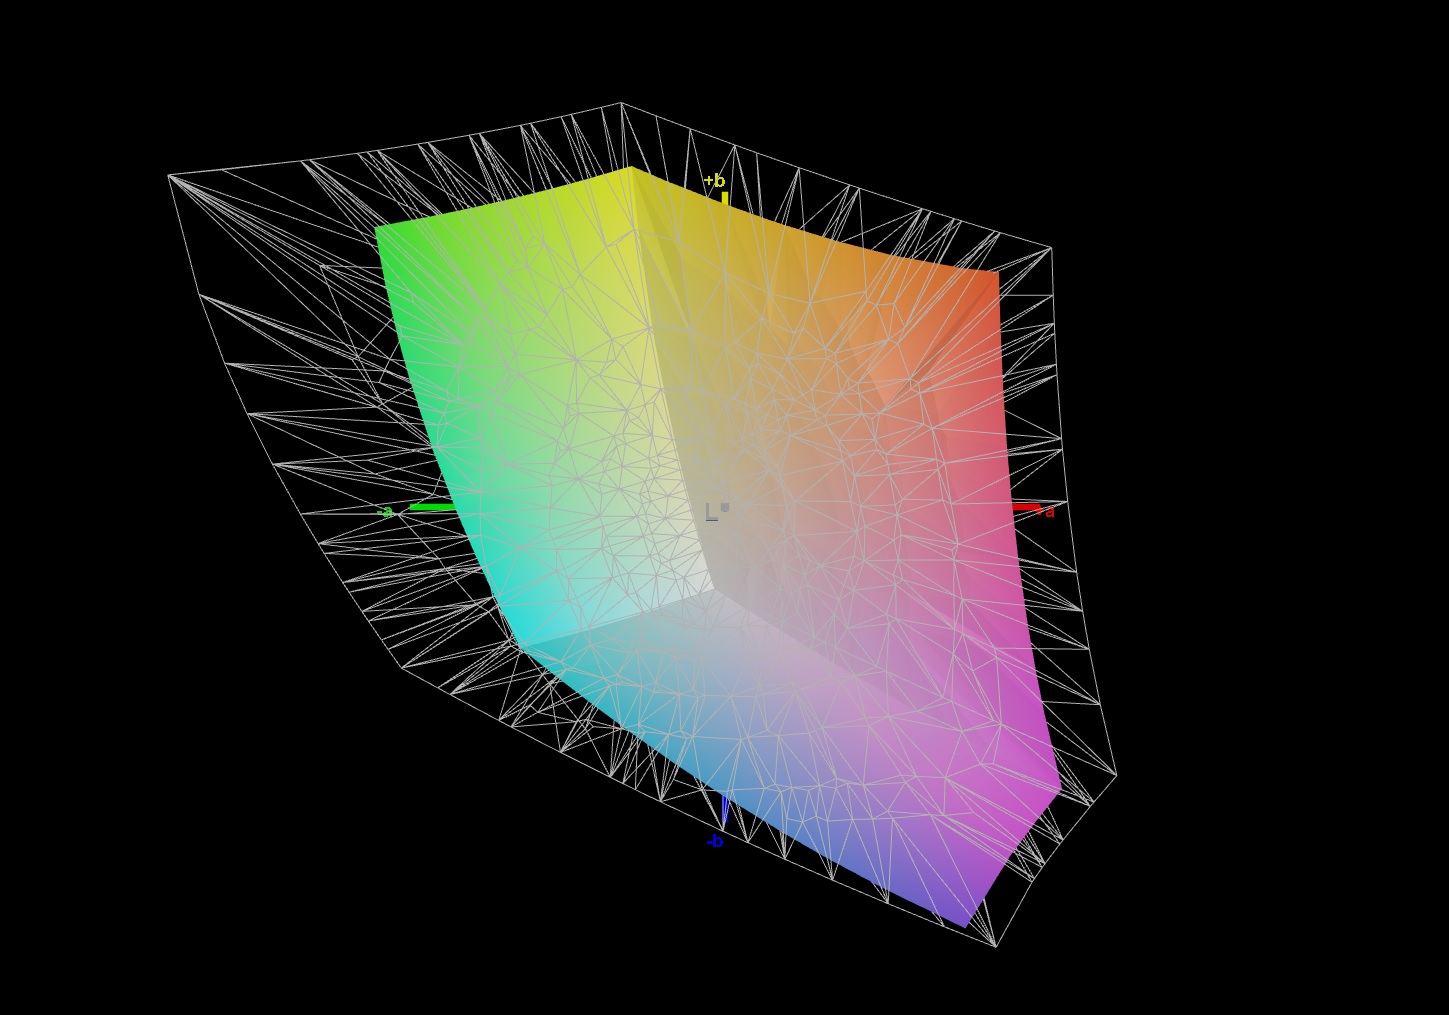
65.2% AdobeRGB 1998 (Argyll 3D)
94% sRGB (Argyll 3D)
63.1% Display P3 (Argyll 3D)
Gamma: 2.253
CCT: 6640 K
| MSI GE76 Raider AU Optronics B173HAN05.4 (AUOE295), IPS-Level, 1920x1080, 17.3" | Schenker XMG NEO 17 GM7TG8S BOE0977 (NE173QHM-NY2), IPS, 2560x1440, 17.3" | Alienware x17 RTX 3080 P48E AU Optronics B173ZAN, IPS, 3840x2160, 17.3" | Asus ROG Zephyrus S17 GX703HSD BOE099D (BOE CQ NE173QHM-NY3), IPS, 2560x1440, 17.3" | Schenker XMG Ultra 17 Rocket Lake AU Optronics B173HAN05.1, IPS, 1920x1080, 17.3" | |
|---|---|---|---|---|---|
| Display | 4% | 33% | 28% | 8% | |
| Display P3 Coverage (%) | 63.1 | 67.1 6% | 88.3 40% | 94.2 49% | 69.8 11% |
| sRGB Coverage (%) | 94 | 96.3 2% | 100 6% | 98.7 5% | 97.2 3% |
| AdobeRGB 1998 Coverage (%) | 65.2 | 68.6 5% | 100 53% | 84.4 29% | 72 10% |
| Response Times | -82% | -83% | 16% | 2% | |
| Response Time Grey 50% / Grey 80% * (ms) | 5.6 ? | 15.2 -171% | 14.4 ? -157% | 4.8 14% | 5.6 ? -0% |
| Response Time Black / White * (ms) | 9.6 ? | 8.8 8% | 10.4 ? -8% | 8 17% | 9.2 ? 4% |
| PWM Frequency (Hz) | |||||
| Screen | -7% | -36% | -40% | -10% | |
| Brightness middle (cd/m²) | 290 | 396 37% | 438.7 51% | 322 11% | 306 6% |
| Brightness (cd/m²) | 290 | 366 26% | 435 50% | 288 -1% | 299 3% |
| Brightness Distribution (%) | 96 | 82 -15% | 91 -5% | 72 -25% | 93 -3% |
| Black Level * (cd/m²) | 0.23 | 0.45 -96% | 0.48 -109% | 0.3 -30% | 0.22 4% |
| Contrast (:1) | 1261 | 880 -30% | 914 -28% | 1073 -15% | 1391 10% |
| Colorchecker dE 2000 * | 1.59 | 1.43 10% | 4.34 -173% | 3.05 -92% | 1.92 -21% |
| Colorchecker dE 2000 max. * | 3.17 | 2.2 31% | 7.3 -130% | 5.23 -65% | 4.78 -51% |
| Colorchecker dE 2000 calibrated * | 0.87 | 1.34 -54% | 0.72 17% | 1.92 -121% | 1.34 -54% |
| Greyscale dE 2000 * | 2.5 | 1.8 28% | 2.4 4% | 3.11 -24% | 2 20% |
| Gamma | 2.253 98% | 2.4 92% | 2.09 105% | 2.13 103% | 2.153 102% |
| CCT | 6640 98% | 6489 100% | 6413 101% | 6553 99% | 6738 96% |
| Color Space (Percent of AdobeRGB 1998) (%) | 84 | 72 | |||
| Color Space (Percent of sRGB) (%) | 99 | 93 | |||
| Media total (Programa/Opciones) | -28% /
-15% | -29% /
-28% | 1% /
-18% | 0% /
-4% |
* ... más pequeño es mejor
Tiempos de respuesta del display
| ↔ Tiempo de respuesta de Negro a Blanco | ||
|---|---|---|
| 9.6 ms ... subida ↗ y bajada ↘ combinada | ↗ 5.2 ms subida | 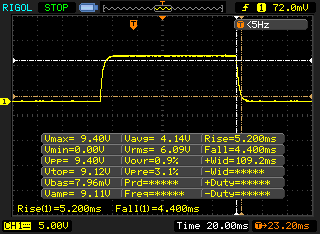 |
| ↘ 4.4 ms bajada | ||
| La pantalla mostró tiempos de respuesta rápidos en nuestros tests y debería ser adecuada para juegos. En comparación, todos los dispositivos de prueba van de ##min### (mínimo) a 240 (máximo) ms. » 26 % de todos los dispositivos son mejores. Esto quiere decir que el tiempo de respuesta medido es mejor que la media (19.9 ms) de todos los dispositivos testados. | ||
| ↔ Tiempo de respuesta 50% Gris a 80% Gris | ||
| 5.6 ms ... subida ↗ y bajada ↘ combinada | ↗ 2 ms subida | 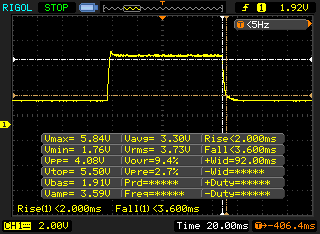 |
| ↘ 3.6 ms bajada | ||
| La pantalla mostró tiempos de respuesta muy rápidos en nuestros tests y debería ser adecuada para juegos frenéticos. En comparación, todos los dispositivos de prueba van de ##min### (mínimo) a 636 (máximo) ms. » 18 % de todos los dispositivos son mejores. Esto quiere decir que el tiempo de respuesta medido es mejor que la media (31.1 ms) de todos los dispositivos testados. | ||
Parpadeo de Pantalla / PWM (Pulse-Width Modulation)
| Parpadeo de Pantalla / PWM no detectado | 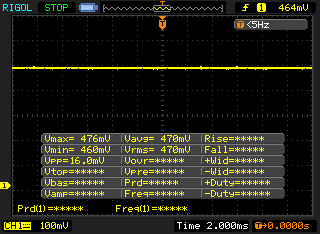 | ||
Comparación: 52 % de todos los dispositivos testados no usaron PWM para atenuar el display. Si se usó, medimos una media de 7798 (mínimo: 5 - máxmo: 343500) Hz. | |||
Rendimiento
Gracias a la nueva CPU de gama alta y a la GPU insignia, el GE76 Raider es, obviamente, uno de los portátiles para juegos más rápidos que puedes conseguir ahora mismo. 32 GB de RAM y un total de 4 TB de almacenamiento SSD son también una excelente base para muchos años de juego feliz.
Condiciones de la prueba
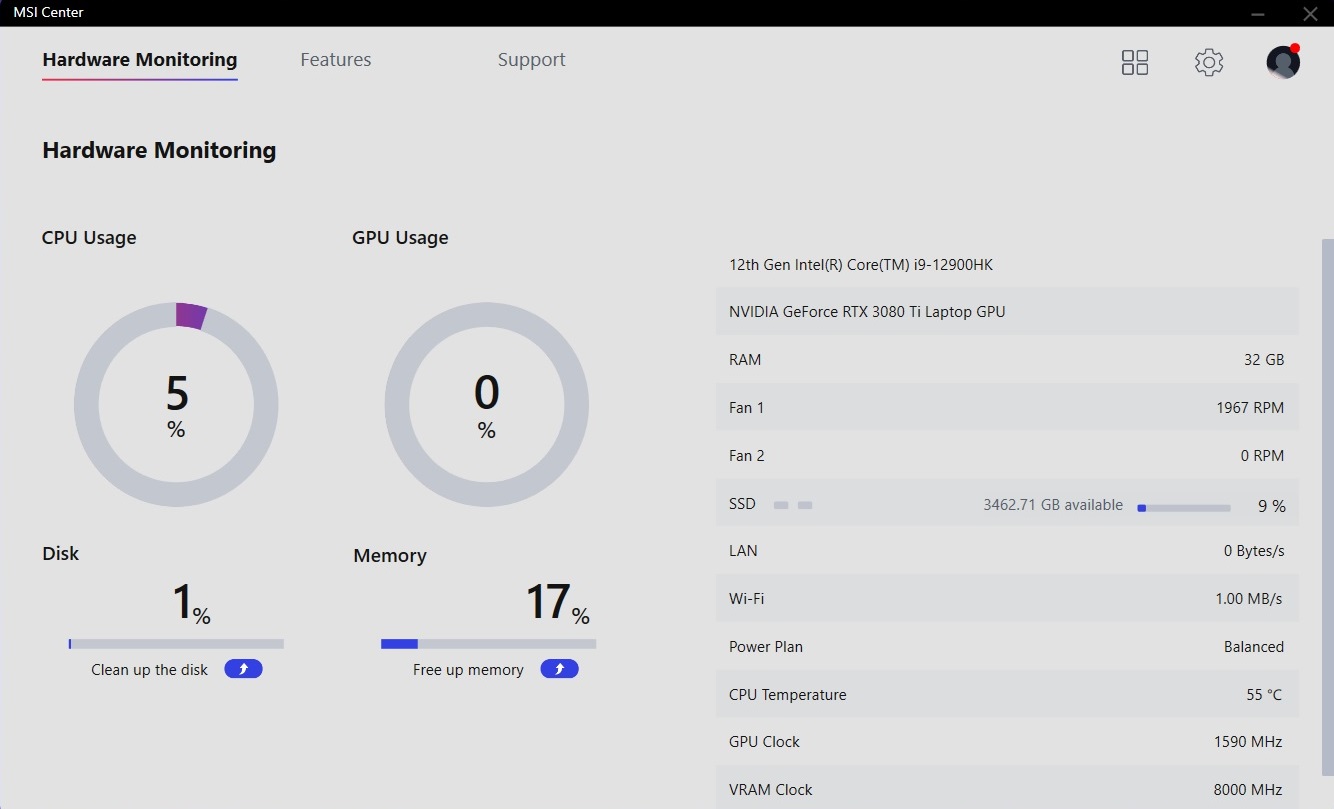
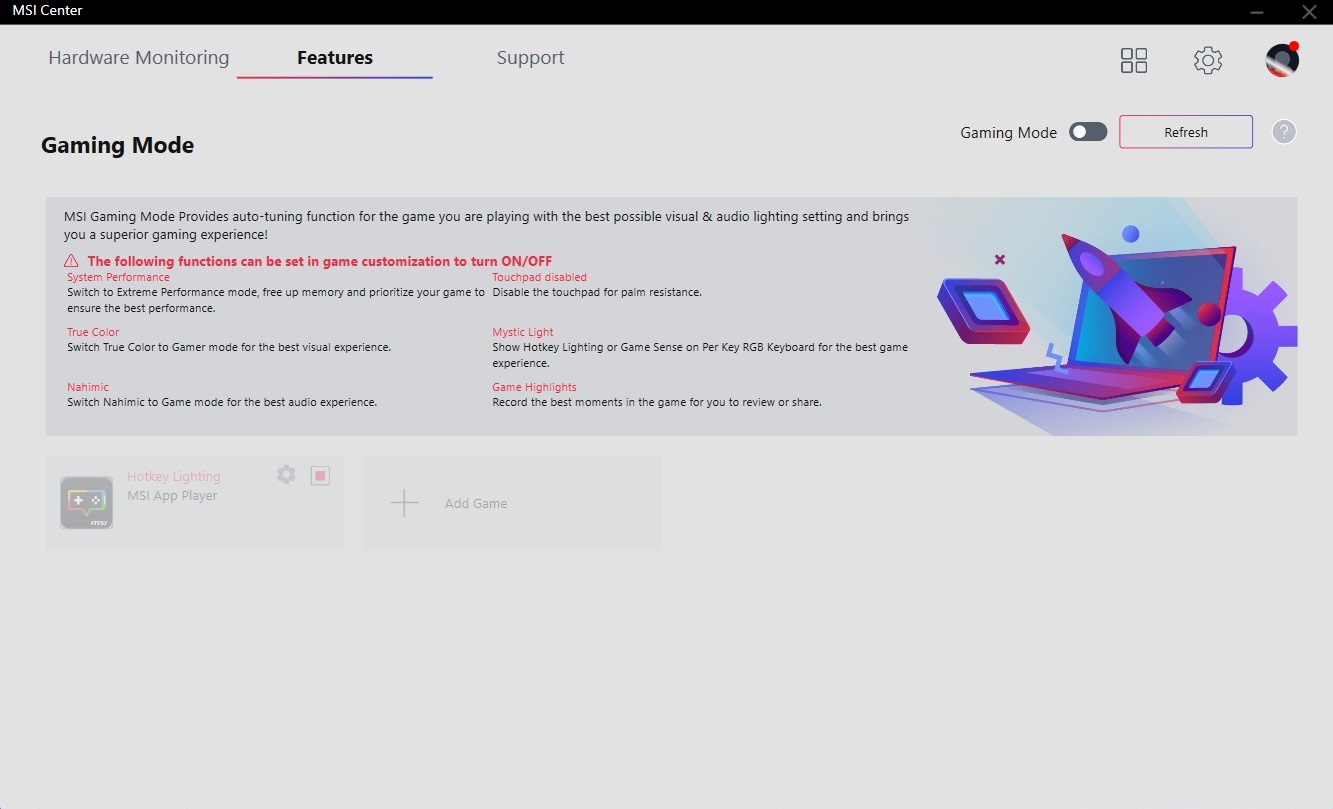
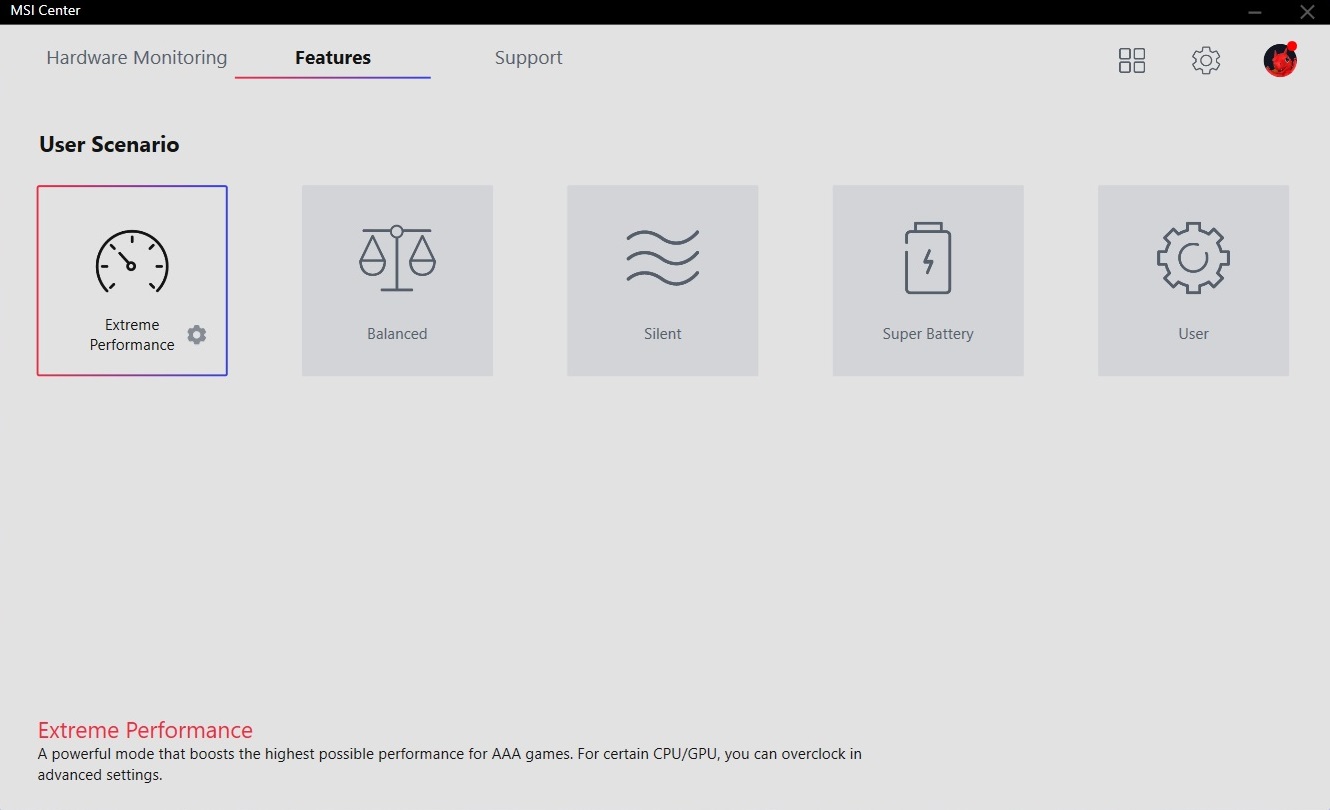
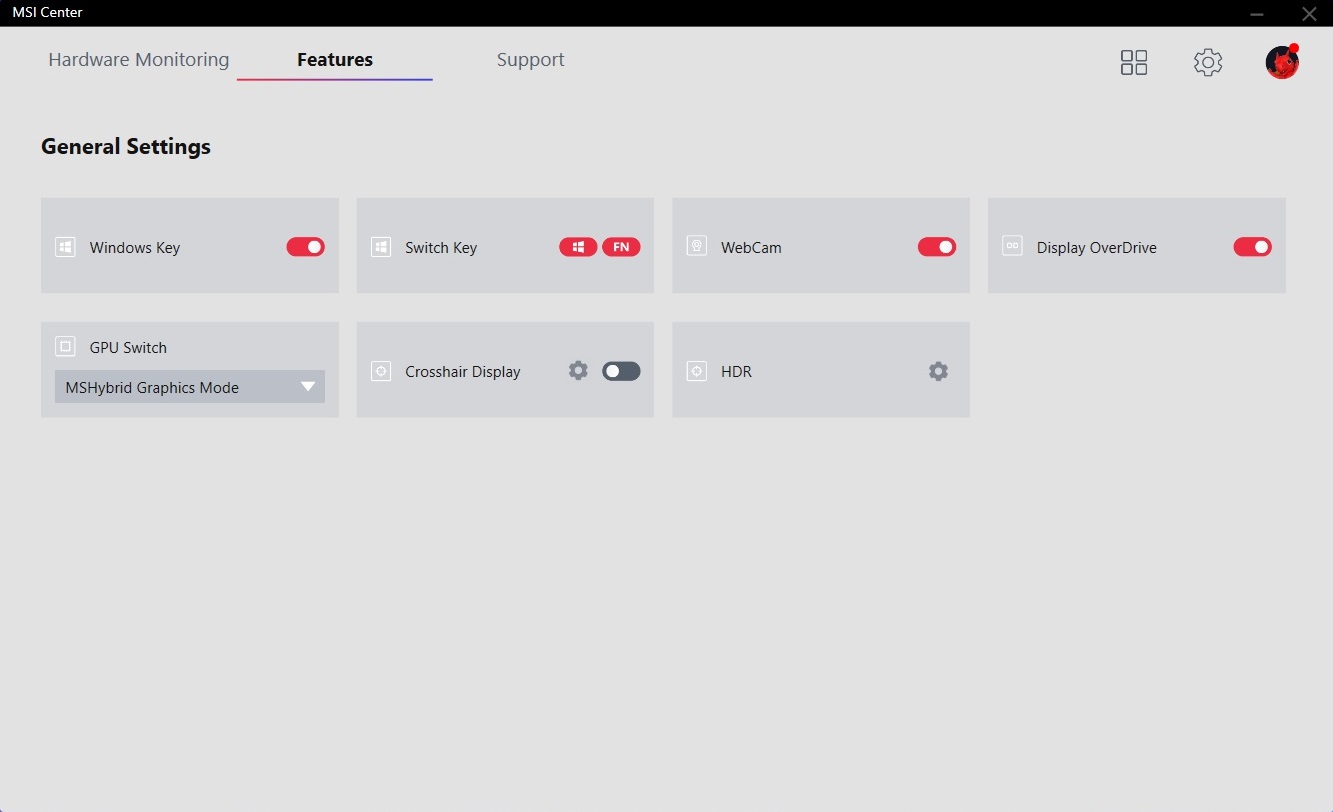
El portátil viene con un potente software de ajuste que es exactamente lo que esperábamos. El MSI Center precargado te permite monitorizar el hardware (carga, relojes, temperaturas) y puedes seleccionar diferentes modos de energía.
Decidimos utilizar el perfil de Rendimiento Extremo para obtener el mejor rendimiento posible de los componentes. El Cooler Boost opcional no estaba activo debido a lo insoportablemente ruidoso que era. Los benchmarks 3D y de juegos abajo fueron realizados con el cambio de gráficos desactivado, pero habilitamos la tecnología Optimus cuando hicimos pruebas para otras secciones de la reseña (configuramos el cambio de GPU al Modo Gráfico Híbrido MSI en el Centro MSI para lograrlo). Los modos de rendimiento disponibles y el efecto que tienen en la GPU/CPU se enumeran en la tabla siguiente.
| Perfil central de MSI | Rendimiento extremo | Equilibrado | Silencioso | Super Battery |
|---|---|---|---|---|
| CPU PL1 (HWiNFO) | 110 Vatios | 110 Vatios | 30 Vatios | 15 Vatios |
| CPU PL2 (HWiNFO) | 135 Vatios | 135 Vatios | 30 Vatios | 15 Vatios |
| Consumo de energía de la tarjeta GPU (GPU-Z) Witcher 3 | ~160 vatios | ~145 vatios | ~145 vatios | ~135 vatios |
| Ruido del ventilador, Witcher 3 | 53 dB(A) | 46 dB(A) | 37 dB(A) | 36 dB(A) |
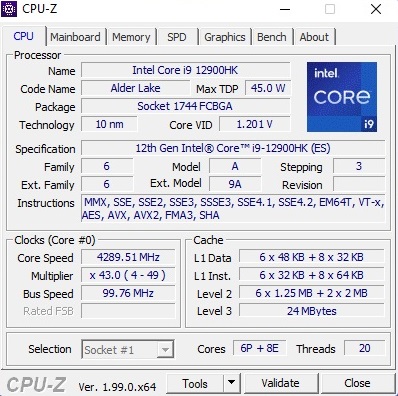
Procesador
Como ya hemos mencionado, el Core i9-12900HK es actualmente la CPU más rápida para portátiles. El modelo de 10 nm de la generación Alder Lake está equipado con 6 núcleos de rendimiento con soporte para hyper threading así como 8 núcleos de eficiencia sin hyper threading. El 12900HK también ofrece 24 MB de caché L3; la K en la designación del modelo indica el multiplicador libre
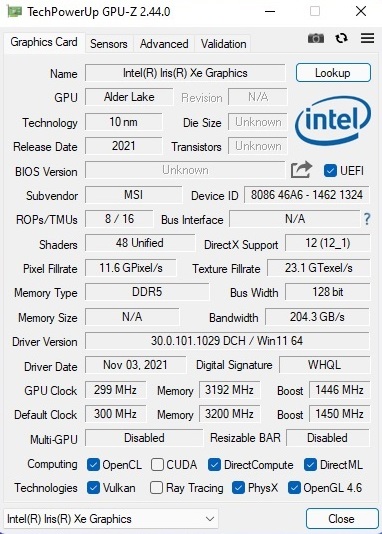
La Iris Xe Graphics G7 integrada es otra de las novedades de los modelos H45. La iGPU se encarga de todas las cargas de trabajo ligeras, como la ofimática, la reproducción de vídeo y la navegación web, lo que mejora el consumo de energía y la duración de la batería, respectivamente
El rendimiento es muy impresionante en comparación con la antigua generación Tiger Lake. Según nuestra clasificación de rendimiento, el GE76 es un 30-50% más rápido que los portátiles con elCore i9-11900HyCore i7-11800Hrespectivamente. Incluso el modelo de sobremesaCore i9-11900Kno tiene ninguna posibilidad en las pruebas multinúcleo. Los resultados caen ligeramente durante el bucle Cinebench, pero el déficit de rendimiento no es tan grande.
Cinebench R15 Multi Loop
| CPU Performance rating - Percent | |
| Media de la clase Gaming | |
| MSI GE76 Raider | |
| Schenker XMG Ultra 17 Rocket Lake | |
| Asus ROG Zephyrus S17 GX703HSD | |
| Alienware x17 RTX 3080 P48E -2! | |
| Schenker XMG NEO 17 GM7TG8S | |
* ... más pequeño es mejor
AIDA64: FP32 Ray-Trace | FPU Julia | CPU SHA3 | CPU Queen | FPU SinJulia | FPU Mandel | CPU AES | CPU ZLib | FP64 Ray-Trace | CPU PhotoWorxx
| Performance rating | |
| Media de la clase Gaming | |
| Schenker XMG Ultra 17 Rocket Lake | |
| MSI GE76 Raider | |
| Schenker XMG NEO 17 GM7TG8S -9! | |
| Alienware x17 RTX 3080 P48E -9! | |
| Asus ROG Zephyrus S17 GX703HSD -9! | |
| AIDA64 / FP32 Ray-Trace | |
| Media de la clase Gaming (10227 - 85542, n=109, últimos 2 años) | |
| Schenker XMG Ultra 17 Rocket Lake | |
| MSI GE76 Raider | |
| AIDA64 / FPU Julia | |
| Media de la clase Gaming (51376 - 238426, n=109, últimos 2 años) | |
| Schenker XMG Ultra 17 Rocket Lake | |
| MSI GE76 Raider | |
| AIDA64 / CPU SHA3 | |
| Media de la clase Gaming (2180 - 9817, n=109, últimos 2 años) | |
| Schenker XMG Ultra 17 Rocket Lake | |
| MSI GE76 Raider | |
| AIDA64 / CPU Queen | |
| Media de la clase Gaming (49785 - 173351, n=100, últimos 2 años) | |
| MSI GE76 Raider | |
| Schenker XMG Ultra 17 Rocket Lake | |
| AIDA64 / FPU SinJulia | |
| Media de la clase Gaming (4424 - 33636, n=109, últimos 2 años) | |
| Schenker XMG Ultra 17 Rocket Lake | |
| MSI GE76 Raider | |
| AIDA64 / FPU Mandel | |
| Media de la clase Gaming (25115 - 128721, n=109, últimos 2 años) | |
| Schenker XMG Ultra 17 Rocket Lake | |
| MSI GE76 Raider | |
| AIDA64 / CPU AES | |
| Schenker XMG Ultra 17 Rocket Lake | |
| Media de la clase Gaming (39258 - 247074, n=109, últimos 2 años) | |
| MSI GE76 Raider | |
| AIDA64 / CPU ZLib | |
| Media de la clase Gaming (574 - 2531, n=109, últimos 2 años) | |
| MSI GE76 Raider | |
| Schenker XMG Ultra 17 Rocket Lake | |
| Asus ROG Zephyrus S17 GX703HSD | |
| Schenker XMG NEO 17 GM7TG8S | |
| Alienware x17 RTX 3080 P48E | |
| AIDA64 / FP64 Ray-Trace | |
| Media de la clase Gaming (5509 - 45446, n=109, últimos 2 años) | |
| Schenker XMG Ultra 17 Rocket Lake | |
| MSI GE76 Raider | |
| AIDA64 / CPU PhotoWorxx | |
| Media de la clase Gaming (12271 - 89891, n=109, últimos 2 años) | |
| MSI GE76 Raider | |
| Schenker XMG Ultra 17 Rocket Lake | |
Rendimiento del sistema
El MSI GE76 también está en la cima de la comparación en términos de rendimiento de sistema con 8000 puntos en PCMark 10, lo que normalmente estaba reservado para algunos sistemas de escritorio. Esto no es sólo resultado de la costosa combinación CPU/GPU, sino también de las rápidas unidades de estado sólido.
| PCMark 10 / Score | |
| Media de la clase Gaming (5828 - 11574, n=95, últimos 2 años) | |
| MSI GE76 Raider | |
| Schenker XMG Ultra 17 Rocket Lake | |
| Alienware x17 RTX 3080 P48E | |
| Asus ROG Zephyrus S17 GX703HSD | |
| Schenker XMG NEO 17 GM7TG8S | |
| PCMark 10 / Essentials | |
| Schenker XMG Ultra 17 Rocket Lake | |
| MSI GE76 Raider | |
| Media de la clase Gaming (8810 - 12600, n=99, últimos 2 años) | |
| Asus ROG Zephyrus S17 GX703HSD | |
| Schenker XMG NEO 17 GM7TG8S | |
| Alienware x17 RTX 3080 P48E | |
| PCMark 10 / Productivity | |
| Media de la clase Gaming (6845 - 18766, n=97, últimos 2 años) | |
| MSI GE76 Raider | |
| Schenker XMG Ultra 17 Rocket Lake | |
| Alienware x17 RTX 3080 P48E | |
| Schenker XMG NEO 17 GM7TG8S | |
| Asus ROG Zephyrus S17 GX703HSD | |
| PCMark 10 / Digital Content Creation | |
| Media de la clase Gaming (7602 - 19657, n=97, últimos 2 años) | |
| MSI GE76 Raider | |
| Schenker XMG Ultra 17 Rocket Lake | |
| Alienware x17 RTX 3080 P48E | |
| Asus ROG Zephyrus S17 GX703HSD | |
| Schenker XMG NEO 17 GM7TG8S | |
| PCMark 10 Score | 8007 puntos | |
ayuda | ||
| AIDA64 / Memory Copy | |
| Media de la clase Gaming (21750 - 129946, n=109, últimos 2 años) | |
| MSI GE76 Raider | |
| Medio Intel Core i9-12900HK (42967 - 62959, n=15) | |
| Schenker XMG Ultra 17 Rocket Lake | |
| AIDA64 / Memory Read | |
| Media de la clase Gaming (22956 - 118858, n=109, últimos 2 años) | |
| MSI GE76 Raider | |
| Medio Intel Core i9-12900HK (44419 - 66989, n=15) | |
| Schenker XMG Ultra 17 Rocket Lake | |
| AIDA64 / Memory Write | |
| Media de la clase Gaming (22297 - 135096, n=109, últimos 2 años) | |
| MSI GE76 Raider | |
| Medio Intel Core i9-12900HK (42144 - 65268, n=15) | |
| Schenker XMG Ultra 17 Rocket Lake | |
| AIDA64 / Memory Latency | |
| Media de la clase Gaming (75.3 - 259, n=109, últimos 2 años) | |
| MSI GE76 Raider | |
| Medio Intel Core i9-12900HK (79.9 - 109, n=15) | |
| Schenker XMG Ultra 17 Rocket Lake | |
| Asus ROG Zephyrus S17 GX703HSD | |
| Schenker XMG NEO 17 GM7TG8S | |
| Alienware x17 RTX 3080 P48E | |
* ... más pequeño es mejor
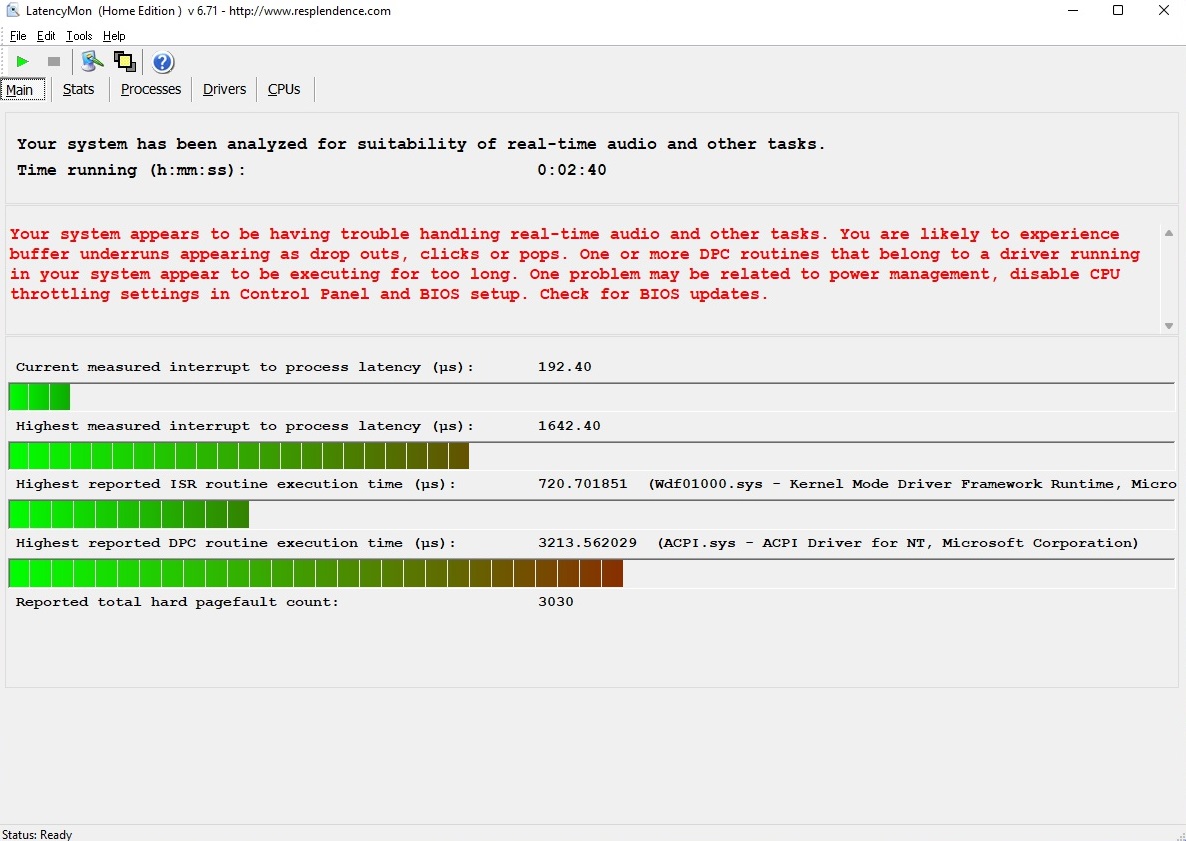
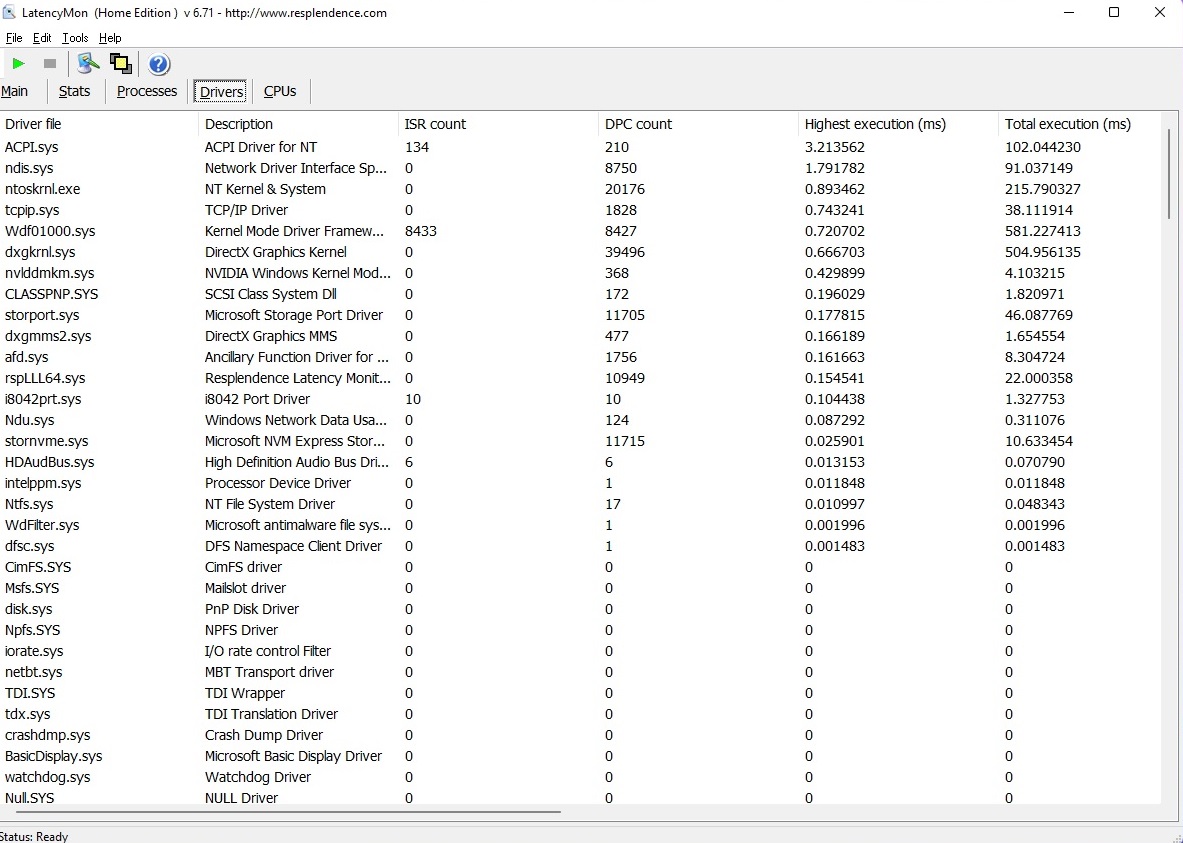
Latencias del CPD
Vemos cierto margen de mejora en la prueba de latencia. La herramienta LatencyMon indica algunos problemas cuando se editan archivos de vídeo o audio en tiempo real, pero este problema afecta a muchos portátiles y normalmente puede ser resuelto por el usuario con algunos ajustes.
| DPC Latencies / LatencyMon - interrupt to process latency (max), Web, Youtube, Prime95 | |
| Schenker XMG NEO 17 GM7TG8S | |
| Alienware x17 RTX 3080 P48E | |
| MSI GE76 Raider | |
| Asus ROG Zephyrus S17 GX703HSD | |
| Schenker XMG Ultra 17 Rocket Lake | |
* ... más pequeño es mejor
Almacenamiento
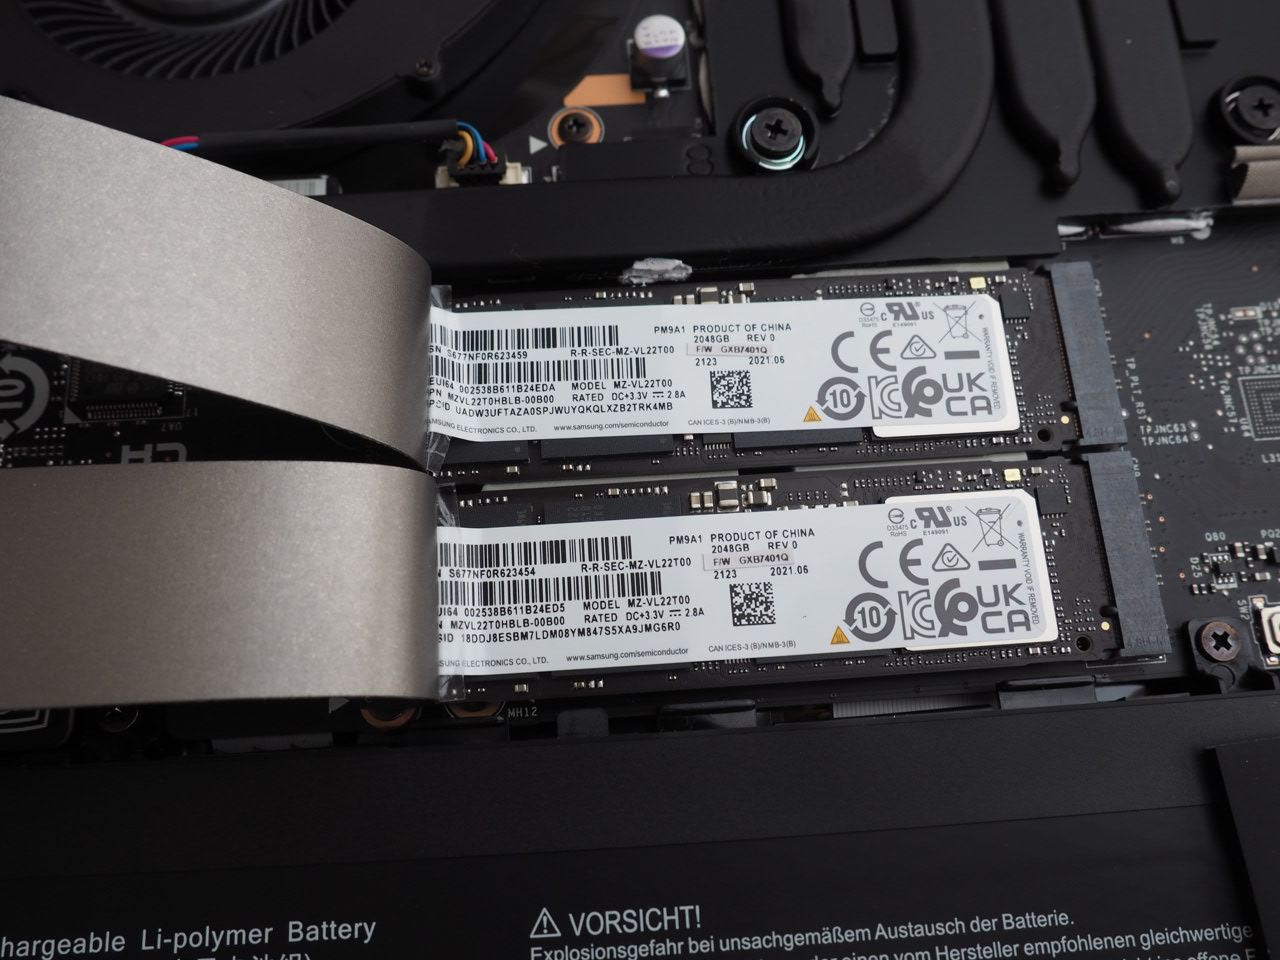
La solución de almacenamiento es muy impresionante: MSI equipó las dos ranuras M.2 con la versión de 2 TB del Samsung PM9A1, que logra grandes tasas de transferencia gracias a la interfaz PCIe-x4. Tasas de transferencia de lectura y escritura secuencial de más de 5000 MB/s y 3000 MB/s (AS SSD Benchmark), respectivamente, habrían sido impensables hace un par de años.

| Drive Performance rating - Percent | |
| Asus ROG Zephyrus S17 GX703HSD | |
| MSI GE76 Raider | |
| Schenker XMG NEO 17 GM7TG8S | |
| Schenker XMG Ultra 17 Rocket Lake | |
| Media de la clase Gaming | |
| Alienware x17 RTX 3080 P48E | |
* ... más pequeño es mejor
Disk Throttling: DiskSpd Read Loop, Queue Depth 8
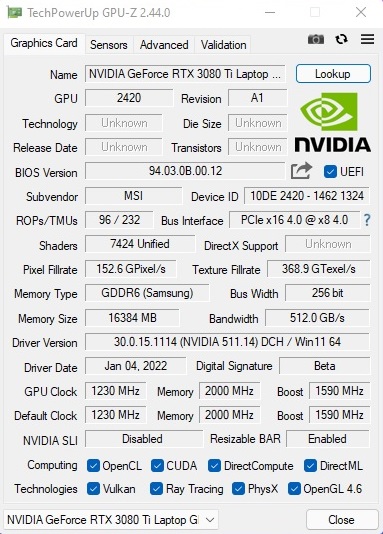
Rendimiento de la GPU
El gran punto fuerte del GE76 Raider será la tarjeta gráfica para muchos usuarios. La nueva GeForce RTX 3080 Ti de Nvidia es un auténtico monstruo del rendimiento, que -como ya se sabe de las otras GPUs Ampere- puede rendir de forma muy diferente según la configuración del TGP.
MSI no hace concesiones y utiliza el TGP máximo de 175 vatios (incluyendo Dynamic Boost) para la RTX 3080 Ti. Esto significa que el GE76 vence a todos los portátiles anteriores en nuestras pruebas, pero la ventaja sobre la RTX 3080 con ajustes TGP altos no es enorme en las pruebas 3DMark. No deberías esperar una ventaja de más del 10-20% (la diferencia suele ser mucho mayor en las pruebas de juegos 4K). Todos los modelos de la RTX 3080 Ti están equipados con 16 GB de GDDR6-VRAM, mientras que algunas versiones de la RTX 3080 estaban equipadas con solo 8 GB. Consulta nuestrasección de tecnologíay nuestroAnálisis de rendimientopara más detalles técnicos.
| 3DMark Performance rating - Percent | |
| Media de la clase Gaming | |
| MSI GE76 Raider | |
| Schenker XMG Ultra 17 Rocket Lake | |
| Schenker XMG NEO 17 GM7TG8S -1! | |
| Alienware x17 RTX 3080 P48E | |
| Asus ROG Zephyrus S17 GX703HSD -1! | |
| 3DMark 06 Standard Score | 56967 puntos | |
| 3DMark Vantage P Result | 94760 puntos | |
| 3DMark 11 Performance | 36650 puntos | |
| 3DMark Cloud Gate Standard Score | 66067 puntos | |
| 3DMark Fire Strike Score | 27992 puntos | |
| 3DMark Time Spy Score | 13413 puntos | |
ayuda | ||
Rendimiento de los juegos
El GE76 es el primer dispositivo con la RTX 3080 Ti, por lo que hemos probado más de 30 juegos con diferentes configuraciones y resoluciones - empezando por 1080p/Medio hasta 4K/Ultra (ver tabla).
Resultado: El nuevo buque insignia de Nvidia no se deja intimidar por los títulos exigentes. La mayoría de los juegos se ejecutan a más de 60 fps incluso con 3840 x 2160 píxeles y la configuración máxima. Sólo hay un puñado de excepciones (comoCyberpunk 2077&Crysis Remasterizado) en las que hay que reducir los ajustes y/o la resolución, pero esto se debe más a la codificación que al rendimiento de la GPU. La RTX 3080 Ti también es adecuada para el Ray Tracing.
| Performance rating - Percent | |
| MSI GE76 Raider -167! | |
| Schenker XMG Ultra 17 Rocket Lake -289! | |
| XMG Neo 15 @165 W TGP -160! | |
| Schenker XMG NEO 17 GM7TG8S -308! | |
| XMG Neo 17 @140 W TGP -155! | |
| Alienware x17 RTX 3080 P48E -300! | |
| Asus ROG Zephyrus S17 GX703HSD -307! | |
| The Witcher 3 v4 | |
| 1920x1080 RT Ultra Preset / On AA:FX | |
| XMG Neo 15 @165 W TGP | |
| XMG Neo 17 @140 W TGP | |
| 2560x1440 Ultra Preset / On AA:FX | |
| XMG Neo 15 @165 W TGP | |
| XMG Neo 17 @140 W TGP | |
| 1920x1080 Ultra Preset / On AA:FX | |
| XMG Neo 15 @165 W TGP | |
| XMG Neo 17 @140 W TGP | |
| 1920x1080 High Preset / On AA:FX | |
| XMG Neo 15 @165 W TGP | |
| XMG Neo 17 @140 W TGP | |
| 1920x1080 Medium Preset / On AA:FX | |
| XMG Neo 15 @165 W TGP | |
| XMG Neo 17 @140 W TGP | |
| 1920x1080 Low Preset / Off | |
| XMG Neo 15 @165 W TGP | |
| XMG Neo 17 @140 W TGP | |
| Need for Speed Unbound | |
| 2560x1440 Ultra Preset | |
| XMG Neo 15 @165 W TGP | |
| XMG Neo 17 @140 W TGP | |
| 1920x1080 Ultra Preset | |
| XMG Neo 15 @165 W TGP | |
| XMG Neo 17 @140 W TGP | |
| 1920x1080 High Preset | |
| XMG Neo 15 @165 W TGP | |
| XMG Neo 17 @140 W TGP | |
| 1920x1080 Medium Preset | |
| XMG Neo 15 @165 W TGP | |
| XMG Neo 17 @140 W TGP | |
| 1920x1080 Low Preset | |
| XMG Neo 15 @165 W TGP | |
| XMG Neo 17 @140 W TGP | |
| The Callisto Protocol | |
| 1920x1080 Ultra Preset (without FSR Upscaling) + Full Ray-Tracing | |
| XMG Neo 15 @165 W TGP | |
| XMG Neo 17 @140 W TGP | |
| 3840x2160 Ultra Preset (without FSR Upscaling) | |
| XMG Neo 15 @165 W TGP | |
| XMG Neo 17 @140 W TGP | |
| 2560x1440 Ultra Preset (without FSR Upscaling) | |
| XMG Neo 15 @165 W TGP | |
| XMG Neo 17 @140 W TGP | |
| 1920x1080 Ultra Preset (without FSR Upscaling) | |
| XMG Neo 15 @165 W TGP | |
| XMG Neo 17 @140 W TGP | |
| 1920x1080 High Preset (without FSR Upscaling) | |
| XMG Neo 15 @165 W TGP | |
| XMG Neo 17 @140 W TGP | |
| 1920x1080 Medium Preset (without FSR Upscaling) | |
| XMG Neo 15 @165 W TGP | |
| XMG Neo 17 @140 W TGP | |
| Spider-Man Miles Morales | |
| 1920x0180 Very High Preset + Ray-Tracing AA:T | |
| XMG Neo 15 @165 W TGP | |
| XMG Neo 17 @140 W TGP | |
| 3840x2160 Very High Preset AA:T | |
| XMG Neo 15 @165 W TGP | |
| XMG Neo 17 @140 W TGP | |
| 2560x1440 Very High Preset AA:T | |
| XMG Neo 15 @165 W TGP | |
| XMG Neo 17 @140 W TGP | |
| 1920x1080 Very High Preset AA:T | |
| XMG Neo 15 @165 W TGP | |
| XMG Neo 17 @140 W TGP | |
| 1920x1080 High Preset AA:T | |
| XMG Neo 15 @165 W TGP | |
| XMG Neo 17 @140 W TGP | |
| 1920x1080 Medium Preset AA:SM | |
| XMG Neo 15 @165 W TGP | |
| XMG Neo 17 @140 W TGP | |
| Uncharted Legacy of Thieves Collection | |
| 3840x2160 Ultra Preset | |
| XMG Neo 15 @165 W TGP | |
| XMG Neo 17 @140 W TGP | |
| 2560x1440 Ultra Preset | |
| XMG Neo 15 @165 W TGP | |
| XMG Neo 17 @140 W TGP | |
| 1920x1080 Ultra Preset | |
| XMG Neo 15 @165 W TGP | |
| XMG Neo 17 @140 W TGP | |
| 1920x1080 High Preset | |
| XMG Neo 15 @165 W TGP | |
| XMG Neo 17 @140 W TGP | |
| 1920x1080 Medium Preset | |
| XMG Neo 15 @165 W TGP | |
| XMG Neo 17 @140 W TGP | |
| A Plague Tale Requiem | |
| 3840x2160 Ultra Preset | |
| XMG Neo 15 @165 W TGP | |
| XMG Neo 17 @140 W TGP | |
| 2560x1440 Ultra Preset | |
| XMG Neo 15 @165 W TGP | |
| XMG Neo 17 @140 W TGP | |
| 1920x1080 Ultra Preset | |
| XMG Neo 15 @165 W TGP | |
| XMG Neo 17 @140 W TGP | |
| 1920x1080 High Preset | |
| XMG Neo 15 @165 W TGP | |
| XMG Neo 17 @140 W TGP | |
| 1920x1080 Medium Preset | |
| XMG Neo 15 @165 W TGP | |
| XMG Neo 17 @140 W TGP | |
| Call of Duty Modern Warfare 2 2022 | |
| 3840x2160 Extreme Quality Preset AA:T2X Filmic SM | |
| XMG Neo 15 @165 W TGP | |
| XMG Neo 17 @140 W TGP | |
| 2560x1440 Extreme Quality Preset AA:T2X Filmic SM | |
| XMG Neo 15 @165 W TGP | |
| XMG Neo 17 @140 W TGP | |
| 1920x1080 Extreme Quality Preset AA:T2X Filmic SM | |
| XMG Neo 15 @165 W TGP | |
| XMG Neo 17 @140 W TGP | |
| 1920x1080 Ultra Quality Preset AA:T2X Filmic SM | |
| XMG Neo 15 @165 W TGP | |
| XMG Neo 17 @140 W TGP | |
| 1920x1080 Balanced Quality Preset AA:T2X SM | |
| XMG Neo 15 @165 W TGP | |
| XMG Neo 17 @140 W TGP | |
| FIFA 23 | |
| 3840x2160 Ultra Rendering Quality | |
| XMG Neo 15 @165 W TGP | |
| XMG Neo 17 @140 W TGP | |
| 2560x1440 Ultra Rendering Quality | |
| XMG Neo 15 @165 W TGP | |
| XMG Neo 17 @140 W TGP | |
| 1920x1080 Ultra Rendering Quality | |
| XMG Neo 15 @165 W TGP | |
| XMG Neo 17 @140 W TGP | |
| 1920x1080 High Rendering Quality | |
| XMG Neo 15 @165 W TGP | |
| XMG Neo 17 @140 W TGP | |
| 1920x1080 Medium Rendering Quality | |
| XMG Neo 15 @165 W TGP | |
| XMG Neo 17 @140 W TGP | |
| F1 22 | |
| 3840x2160 Ultra High Preset AA:T AF:16x | |
| XMG Neo 15 @165 W TGP | |
| XMG Neo 17 @140 W TGP | |
| 2560x1440 Ultra High Preset AA:T AF:16x | |
| XMG Neo 15 @165 W TGP | |
| XMG Neo 17 @140 W TGP | |
| 1920x1080 Ultra High Preset AA:T AF:16x | |
| XMG Neo 15 @165 W TGP | |
| XMG Neo 17 @140 W TGP | |
| 1920x1080 High Preset AA:T AF:16x | |
| XMG Neo 15 @165 W TGP | |
| XMG Neo 17 @140 W TGP | |
| 1920x1080 Medium Preset AA:T AF:16x | |
| XMG Neo 15 @165 W TGP | |
| XMG Neo 17 @140 W TGP | |
| The Quarry | |
| 3840x2160 Ultra Preset | |
| XMG Neo 15 @165 W TGP | |
| XMG Neo 17 @140 W TGP | |
| 2560x1440 Ultra Preset | |
| XMG Neo 15 @165 W TGP | |
| XMG Neo 17 @140 W TGP | |
| 1920x1080 Ultra Preset | |
| XMG Neo 15 @165 W TGP | |
| XMG Neo 17 @140 W TGP | |
| 1920x1080 High Preset | |
| XMG Neo 15 @165 W TGP | |
| XMG Neo 17 @140 W TGP | |
| 1920x1080 Medium Preset | |
| XMG Neo 15 @165 W TGP | |
| XMG Neo 17 @140 W TGP | |
| Vampire Bloodhunt | |
| 3840x2160 Ultra Preset | |
| XMG Neo 15 @165 W TGP | |
| XMG Neo 17 @140 W TGP | |
| 2560x1440 Ultra Preset | |
| XMG Neo 15 @165 W TGP | |
| XMG Neo 17 @140 W TGP | |
| 1920x1080 Ultra Preset | |
| XMG Neo 15 @165 W TGP | |
| XMG Neo 17 @140 W TGP | |
| 1920x1080 High Preset | |
| XMG Neo 15 @165 W TGP | |
| XMG Neo 17 @140 W TGP | |
| 1920x1080 Medium Preset | |
| XMG Neo 15 @165 W TGP | |
| XMG Neo 17 @140 W TGP | |
| Tiny Tina's Wonderlands | |
| 3840x2160 Badass Preset (DX12) | |
| XMG Neo 15 @165 W TGP | |
| XMG Neo 17 @140 W TGP | |
| 2560x1440 Badass Preset (DX12) | |
| XMG Neo 15 @165 W TGP | |
| XMG Neo 17 @140 W TGP | |
| 1920x1080 Badass Preset (DX12) | |
| XMG Neo 15 @165 W TGP | |
| XMG Neo 17 @140 W TGP | |
| 1920x1080 High Preset (DX12) | |
| XMG Neo 15 @165 W TGP | |
| XMG Neo 17 @140 W TGP | |
| 1920x1080 Medium Preset (DX12) | |
| XMG Neo 15 @165 W TGP | |
| XMG Neo 17 @140 W TGP | |
| Ghostwire Tokyo | |
| 1920x1080 Highest Settings + Maximum Ray Tracing | |
| XMG Neo 15 @165 W TGP | |
| XMG Neo 17 @140 W TGP | |
| 3840x2160 Highest Settings | |
| XMG Neo 15 @165 W TGP | |
| XMG Neo 17 @140 W TGP | |
| 2560x1440 Highest Settings | |
| XMG Neo 15 @165 W TGP | |
| XMG Neo 17 @140 W TGP | |
| 1920x1080 Highest Settings | |
| XMG Neo 15 @165 W TGP | |
| XMG Neo 17 @140 W TGP | |
| 1920x1080 High Settings | |
| XMG Neo 15 @165 W TGP | |
| XMG Neo 17 @140 W TGP | |
| 1920x1080 Medium Settings | |
| XMG Neo 15 @165 W TGP | |
| XMG Neo 17 @140 W TGP | |
| Elden Ring | |
| 3840x2160 Maximum Preset | |
| XMG Neo 15 @165 W TGP | |
| XMG Neo 17 @140 W TGP | |
| 2560x1440 Maximum Preset | |
| XMG Neo 17 @140 W TGP | |
| XMG Neo 15 @165 W TGP | |
| 1920x1080 Maximum Preset | |
| XMG Neo 17 @140 W TGP | |
| XMG Neo 15 @165 W TGP | |
| 1920x1080 High Preset | |
| XMG Neo 17 @140 W TGP | |
| XMG Neo 15 @165 W TGP | |
| 1920x1080 Medium Preset | |
| XMG Neo 17 @140 W TGP | |
| XMG Neo 15 @165 W TGP | |
| Elex 2 | |
| 3840x2160 Ultra / On AA:SM AF:16x | |
| XMG Neo 15 @165 W TGP | |
| XMG Neo 17 @140 W TGP | |
| 2560x1440 Ultra / On AA:SM AF:16x | |
| XMG Neo 15 @165 W TGP | |
| XMG Neo 17 @140 W TGP | |
| 1920x1080 Ultra / On AA:SM AF:16x | |
| XMG Neo 15 @165 W TGP | |
| XMG Neo 17 @140 W TGP | |
| 1920x1080 High / On AA:FX AF:16x | |
| XMG Neo 17 @140 W TGP | |
| XMG Neo 15 @165 W TGP | |
| 1920x1080 Medium / On AA:FX AF:16x | |
| XMG Neo 17 @140 W TGP | |
| XMG Neo 15 @165 W TGP | |
| Cyberpunk 2077 1.6 | |
| 3840x2160 Ray Tracing Ultra Preset (DLSS off) | |
| XMG Neo 15 @165 W TGP | |
| XMG Neo 17 @140 W TGP | |
| 1920x1080 Ray Tracing Ultra Preset (DLSS off) | |
| XMG Neo 15 @165 W TGP | |
| XMG Neo 17 @140 W TGP | |
| 3840x2160 Ultra Preset | |
| XMG Neo 17 @140 W TGP | |
| 2560x1440 Ultra Preset | |
| XMG Neo 17 @140 W TGP | |
| 1920x1080 Ultra Preset | |
| XMG Neo 17 @140 W TGP | |
| 1920x1080 High Preset | |
| XMG Neo 17 @140 W TGP | |
| 1920x1080 Medium Preset | |
| XMG Neo 17 @140 W TGP | |
| GRID Legends | |
| 3840x2160 Ultra Preset | |
| XMG Neo 15 @165 W TGP | |
| XMG Neo 17 @140 W TGP | |
| 2560x1440 Ultra Preset | |
| XMG Neo 15 @165 W TGP | |
| XMG Neo 17 @140 W TGP | |
| 1920x1080 Ultra Preset | |
| XMG Neo 15 @165 W TGP | |
| XMG Neo 17 @140 W TGP | |
| 1920x1080 High Preset | |
| XMG Neo 15 @165 W TGP | |
| XMG Neo 17 @140 W TGP | |
| 1920x1080 Medium Preset | |
| XMG Neo 15 @165 W TGP | |
| XMG Neo 17 @140 W TGP | |
| Dying Light 2 | |
| 1920x1080 High Quality Raytracing | |
| XMG Neo 15 @165 W TGP | |
| XMG Neo 17 @140 W TGP | |
| 3840x2160 High Quality | |
| XMG Neo 15 @165 W TGP | |
| XMG Neo 17 @140 W TGP | |
| 2560x1440 High Quality | |
| XMG Neo 15 @165 W TGP | |
| XMG Neo 17 @140 W TGP | |
| 1920x1080 High Quality | |
| XMG Neo 15 @165 W TGP | |
| XMG Neo 17 @140 W TGP | |
| 1920x1080 Medium Quality | |
| XMG Neo 15 @165 W TGP | |
| XMG Neo 17 @140 W TGP | |
| Rainbow Six Extraction | |
| 3840x2160 Ultra Preset (with Fixed Resolution Quality) | |
| XMG Neo 15 @165 W TGP | |
| XMG Neo 17 @140 W TGP | |
| 2560x1440 Ultra Preset (with Fixed Resolution Quality) | |
| XMG Neo 15 @165 W TGP | |
| XMG Neo 17 @140 W TGP | |
| 1920x1080 Ultra Preset (with Fixed Resolution Quality) | |
| XMG Neo 15 @165 W TGP | |
| XMG Neo 17 @140 W TGP | |
| 1920x1080 High Preset (with Fixed Resolution Quality) | |
| XMG Neo 15 @165 W TGP | |
| XMG Neo 17 @140 W TGP | |
| 1920x1080 Medium Preset (with Fixed Resolution Quality) | |
| XMG Neo 15 @165 W TGP | |
| XMG Neo 17 @140 W TGP | |
| God of War | |
| 3840x2160 Ultra Preset | |
| MSI GE76 Raider | |
| XMG Neo 15 @165 W TGP | |
| XMG Neo 17 @140 W TGP | |
| 2560x1440 Ultra Preset | |
| MSI GE76 Raider | |
| XMG Neo 15 @165 W TGP | |
| XMG Neo 17 @140 W TGP | |
| 1920x1080 Ultra Preset | |
| MSI GE76 Raider | |
| XMG Neo 15 @165 W TGP | |
| XMG Neo 17 @140 W TGP | |
| 1920x1080 High Preset | |
| MSI GE76 Raider | |
| XMG Neo 15 @165 W TGP | |
| XMG Neo 17 @140 W TGP | |
| 1920x1080 Original Preset | |
| MSI GE76 Raider | |
| XMG Neo 15 @165 W TGP | |
| XMG Neo 17 @140 W TGP | |
| Halo Infinite | |
| 3840x2160 Ultra Preset | |
| MSI GE76 Raider | |
| XMG Neo 15 @165 W TGP | |
| XMG Neo 17 @140 W TGP | |
| 2560x1440 Ultra Preset | |
| MSI GE76 Raider | |
| XMG Neo 15 @165 W TGP | |
| XMG Neo 17 @140 W TGP | |
| 1920x1080 Ultra Preset | |
| MSI GE76 Raider | |
| XMG Neo 15 @165 W TGP | |
| XMG Neo 17 @140 W TGP | |
| 1920x1080 High Preset | |
| MSI GE76 Raider | |
| XMG Neo 15 @165 W TGP | |
| XMG Neo 17 @140 W TGP | |
| 1920x1080 Medium Preset | |
| MSI GE76 Raider | |
| XMG Neo 15 @165 W TGP | |
| XMG Neo 17 @140 W TGP | |
| Farming Simulator 22 | |
| 3840x2160 Very High Preset | |
| MSI GE76 Raider | |
| XMG Neo 15 @165 W TGP | |
| XMG Neo 17 @140 W TGP | |
| 2560x1440 Very High Preset | |
| MSI GE76 Raider | |
| XMG Neo 15 @165 W TGP | |
| XMG Neo 17 @140 W TGP | |
| 1920x1080 Very High Preset | |
| MSI GE76 Raider | |
| XMG Neo 15 @165 W TGP | |
| XMG Neo 17 @140 W TGP | |
| 1920x1080 High Preset | |
| MSI GE76 Raider | |
| XMG Neo 15 @165 W TGP | |
| XMG Neo 17 @140 W TGP | |
| 1920x1080 Medium Preset | |
| MSI GE76 Raider | |
| XMG Neo 17 @140 W TGP | |
| XMG Neo 15 @165 W TGP | |
| Battlefield 2042 | |
| 1920x1080 Ultra Preset + Ray Tracing | |
| MSI GE76 Raider | |
| XMG Neo 15 @165 W TGP | |
| XMG Neo 17 @140 W TGP | |
| 3840x2160 Ultra Preset | |
| MSI GE76 Raider | |
| XMG Neo 15 @165 W TGP | |
| XMG Neo 17 @140 W TGP | |
| 2560x1440 Ultra Preset | |
| MSI GE76 Raider | |
| XMG Neo 15 @165 W TGP | |
| XMG Neo 17 @140 W TGP | |
| 1920x1080 Ultra Preset | |
| MSI GE76 Raider | |
| XMG Neo 15 @165 W TGP | |
| XMG Neo 17 @140 W TGP | |
| 1920x1080 High Preset | |
| MSI GE76 Raider | |
| XMG Neo 15 @165 W TGP | |
| XMG Neo 17 @140 W TGP | |
| 1920x1080 Medium Preset | |
| XMG Neo 17 @140 W TGP | |
| MSI GE76 Raider | |
| XMG Neo 15 @165 W TGP | |
| Forza Horizon 5 | |
| 3840x2160 Extreme Preset | |
| MSI GE76 Raider | |
| XMG Neo 15 @165 W TGP | |
| XMG Neo 17 @140 W TGP | |
| 2560x1440 Extreme Preset | |
| MSI GE76 Raider | |
| XMG Neo 15 @165 W TGP | |
| XMG Neo 17 @140 W TGP | |
| 1920x1080 Extreme Preset | |
| MSI GE76 Raider | |
| XMG Neo 15 @165 W TGP | |
| XMG Neo 17 @140 W TGP | |
| 1920x1080 High Preset | |
| MSI GE76 Raider | |
| XMG Neo 15 @165 W TGP | |
| XMG Neo 17 @140 W TGP | |
| 1920x1080 Medium Preset | |
| MSI GE76 Raider | |
| XMG Neo 15 @165 W TGP | |
| XMG Neo 17 @140 W TGP | |
| 1920x1080 Low Preset | |
| XMG Neo 15 @165 W TGP | |
| XMG Neo 17 @140 W TGP | |
| Call of Duty Vanguard | |
| 3840x2160 Ultra Preset | |
| XMG Neo 15 @165 W TGP | |
| XMG Neo 17 @140 W TGP | |
| 2560x1440 Ultra Preset | |
| XMG Neo 15 @165 W TGP | |
| XMG Neo 17 @140 W TGP | |
| 1920x1080 Ultra Preset | |
| XMG Neo 15 @165 W TGP | |
| XMG Neo 17 @140 W TGP | |
| 1920x1080 High Preset | |
| XMG Neo 15 @165 W TGP | |
| XMG Neo 17 @140 W TGP | |
| 1920x1080 Medium Preset | |
| XMG Neo 17 @140 W TGP | |
| XMG Neo 15 @165 W TGP | |
| 1920x1080 Low Preset | |
| XMG Neo 17 @140 W TGP | |
| XMG Neo 15 @165 W TGP | |
| Riders Republic | |
| 3840x2160 Ultra Preset | |
| MSI GE76 Raider | |
| XMG Neo 15 @165 W TGP | |
| XMG Neo 17 @140 W TGP | |
| 2560x1440 Ultra Preset | |
| MSI GE76 Raider | |
| XMG Neo 15 @165 W TGP | |
| XMG Neo 17 @140 W TGP | |
| 1920x1080 Ultra Preset | |
| MSI GE76 Raider | |
| XMG Neo 15 @165 W TGP | |
| XMG Neo 17 @140 W TGP | |
| 1920x1080 High Preset | |
| MSI GE76 Raider | |
| XMG Neo 15 @165 W TGP | |
| XMG Neo 17 @140 W TGP | |
| 1920x1080 Medium Preset | |
| MSI GE76 Raider | |
| XMG Neo 15 @165 W TGP | |
| XMG Neo 17 @140 W TGP | |
| 1920x1080 Low Preset | |
| XMG Neo 15 @165 W TGP | |
| XMG Neo 17 @140 W TGP | |
| Guardians of the Galaxy | |
| 1920x1080 Ultra Preset + Ultra Ray-Tracing | |
| MSI GE76 Raider | |
| XMG Neo 15 @165 W TGP | |
| XMG Neo 17 @140 W TGP | |
| 3840x2160 Ultra Preset | |
| MSI GE76 Raider | |
| XMG Neo 15 @165 W TGP | |
| XMG Neo 17 @140 W TGP | |
| 2560x1440 Ultra Preset | |
| MSI GE76 Raider | |
| XMG Neo 15 @165 W TGP | |
| XMG Neo 17 @140 W TGP | |
| 1920x1080 Ultra Preset | |
| MSI GE76 Raider | |
| XMG Neo 15 @165 W TGP | |
| XMG Neo 17 @140 W TGP | |
| 1920x1080 High Preset | |
| MSI GE76 Raider | |
| XMG Neo 15 @165 W TGP | |
| XMG Neo 17 @140 W TGP | |
| 1920x1080 Medium Preset | |
| MSI GE76 Raider | |
| XMG Neo 15 @165 W TGP | |
| XMG Neo 17 @140 W TGP | |
| Alan Wake Remastered | |
| 3840x2160 High Preset | |
| MSI GE76 Raider | |
| XMG Neo 15 @165 W TGP | |
| XMG Neo 17 @140 W TGP | |
| 2560x1440 High Preset | |
| MSI GE76 Raider | |
| XMG Neo 15 @165 W TGP | |
| XMG Neo 17 @140 W TGP | |
| 1920x1080 High Preset | |
| MSI GE76 Raider | |
| XMG Neo 15 @165 W TGP | |
| XMG Neo 17 @140 W TGP | |
| 1920x1080 Medium Preset | |
| MSI GE76 Raider | |
| XMG Neo 15 @165 W TGP | |
| XMG Neo 17 @140 W TGP | |
| 1920x1080 Low Preset | |
| XMG Neo 15 @165 W TGP | |
| XMG Neo 17 @140 W TGP | |
| Back 4 Blood | |
| 3840x2160 Epic Preset (DX12) AA:T | |
| MSI GE76 Raider | |
| XMG Neo 15 @165 W TGP | |
| XMG Neo 17 @140 W TGP | |
| 2560x1440 Epic Preset (DX12) AA:T | |
| MSI GE76 Raider | |
| XMG Neo 15 @165 W TGP | |
| XMG Neo 17 @140 W TGP | |
| 1920x1080 Epic Preset (DX12) AA:T | |
| MSI GE76 Raider | |
| XMG Neo 15 @165 W TGP | |
| XMG Neo 17 @140 W TGP | |
| 1920x1080 High Preset (DX12) AA:T | |
| MSI GE76 Raider | |
| XMG Neo 15 @165 W TGP | |
| XMG Neo 17 @140 W TGP | |
| 1920x1080 Medium Preset (DX12) AA:FX | |
| MSI GE76 Raider | |
| XMG Neo 15 @165 W TGP | |
| XMG Neo 17 @140 W TGP | |
| 1920x1080 Low Preset (DX12) | |
| XMG Neo 15 @165 W TGP | |
| XMG Neo 17 @140 W TGP | |
| Far Cry 6 | |
| 1920x1080 Ultra Graphics Quality + HD Textures + DXR AA:T | |
| MSI GE76 Raider | |
| XMG Neo 15 @165 W TGP | |
| XMG Neo 17 @140 W TGP | |
| 3840x2160 Ultra Graphics Quality + HD Textures AA:T | |
| MSI GE76 Raider | |
| XMG Neo 15 @165 W TGP | |
| XMG Neo 17 @140 W TGP | |
| 2560x1440 Ultra Graphics Quality + HD Textures AA:T | |
| MSI GE76 Raider | |
| XMG Neo 15 @165 W TGP | |
| XMG Neo 17 @140 W TGP | |
| 1920x1080 Ultra Graphics Quality + HD Textures AA:T | |
| MSI GE76 Raider | |
| XMG Neo 15 @165 W TGP | |
| XMG Neo 17 @140 W TGP | |
| 1920x1080 High Graphics Quality AA:T | |
| MSI GE76 Raider | |
| XMG Neo 15 @165 W TGP | |
| XMG Neo 17 @140 W TGP | |
| 1920x1080 Medium Graphics Quality AA:SM | |
| MSI GE76 Raider | |
| XMG Neo 15 @165 W TGP | |
| XMG Neo 17 @140 W TGP | |
| 1920x1080 Low Graphics Quality | |
| XMG Neo 15 @165 W TGP | |
| XMG Neo 17 @140 W TGP | |
| FIFA 22 | |
| 3840x2160 Ultra Rendering Quality AA:4x MS | |
| XMG Neo 15 @165 W TGP | |
| XMG Neo 17 @140 W TGP | |
| 2560x1440 Ultra Rendering Quality AA:4x MS | |
| XMG Neo 15 @165 W TGP | |
| XMG Neo 17 @140 W TGP | |
| 1920x1080 Ultra Rendering Quality AA:4x MS | |
| XMG Neo 15 @165 W TGP | |
| XMG Neo 17 @140 W TGP | |
| 1920x1080 High Rendering Quality AA:2x MS | |
| XMG Neo 15 @165 W TGP | |
| XMG Neo 17 @140 W TGP | |
| 1920x1080 Medium Rendering Quality | |
| XMG Neo 17 @140 W TGP | |
| XMG Neo 15 @165 W TGP | |
| 1920x1080 Low Rendering Quality | |
| XMG Neo 15 @165 W TGP | |
| XMG Neo 17 @140 W TGP | |
| New World | |
| 3840x2160 Very High Video Quality | |
| MSI GE76 Raider | |
| XMG Neo 15 @165 W TGP | |
| XMG Neo 17 @140 W TGP | |
| 2560x1440 Very High Video Quality | |
| MSI GE76 Raider | |
| XMG Neo 15 @165 W TGP | |
| XMG Neo 17 @140 W TGP | |
| 1920x1080 Very High Video Quality | |
| MSI GE76 Raider | |
| XMG Neo 17 @140 W TGP | |
| XMG Neo 15 @165 W TGP | |
| 1920x1080 High Video Quality | |
| MSI GE76 Raider | |
| XMG Neo 17 @140 W TGP | |
| XMG Neo 15 @165 W TGP | |
| 1920x1080 Medium Video Quality | |
| MSI GE76 Raider | |
| XMG Neo 17 @140 W TGP | |
| XMG Neo 15 @165 W TGP | |
| 1920x1080 Low Video Quality | |
| XMG Neo 17 @140 W TGP | |
| XMG Neo 15 @165 W TGP | |
| Deathloop | |
| 3840x2160 Ultra Preset | |
| XMG Neo 15 @165 W TGP | |
| MSI GE76 Raider | |
| XMG Neo 17 @140 W TGP | |
| 2560x1440 Ultra Preset | |
| XMG Neo 15 @165 W TGP | |
| MSI GE76 Raider | |
| XMG Neo 17 @140 W TGP | |
| 1920x1080 Ultra Preset | |
| MSI GE76 Raider | |
| XMG Neo 15 @165 W TGP | |
| XMG Neo 17 @140 W TGP | |
| 1920x1080 High Preset | |
| MSI GE76 Raider | |
| XMG Neo 15 @165 W TGP | |
| XMG Neo 17 @140 W TGP | |
| 1920x1080 Medium Preset | |
| MSI GE76 Raider | |
| XMG Neo 15 @165 W TGP | |
| XMG Neo 17 @140 W TGP | |
| 1920x1080 Low Preset | |
| XMG Neo 17 @140 W TGP | |
| XMG Neo 15 @165 W TGP | |
| Monster Hunter Stories 2 | |
| 3840x2160 High Preset | |
| XMG Neo 15 @165 W TGP | |
| XMG Neo 17 @140 W TGP | |
| 2560x1440 High Preset | |
| XMG Neo 17 @140 W TGP | |
| XMG Neo 15 @165 W TGP | |
| 1920x1080 High Preset | |
| XMG Neo 17 @140 W TGP | |
| XMG Neo 15 @165 W TGP | |
| 1920x1080 Medium Preset | |
| XMG Neo 17 @140 W TGP | |
| XMG Neo 15 @165 W TGP | |
| 1920x1080 Low Preset | |
| XMG Neo 17 @140 W TGP | |
| XMG Neo 15 @165 W TGP | |
| F1 2021 | |
| 3840x2160 Ultra High Preset + Raytracing AA:T AF:16x | |
| MSI GE76 Raider | |
| 2560x1440 Ultra High Preset + Raytracing AA:T AF:16x | |
| MSI GE76 Raider | |
| 1920x1080 Ultra High Preset + Raytracing AA:T AF:16x | |
| MSI GE76 Raider | |
| 1920x1080 High Preset AA:T AF:16x | |
| MSI GE76 Raider | |
| 1920x1080 Medium Preset AA:T AF:16x | |
| MSI GE76 Raider | |
| Days Gone | |
| 3840x2160 Very High Preset | |
| MSI GE76 Raider | |
| 2560x1440 Very High Preset | |
| MSI GE76 Raider | |
| 1920x1080 Very High Preset | |
| MSI GE76 Raider | |
| 1920x1080 High Preset | |
| MSI GE76 Raider | |
| 1920x1080 Medium Preset | |
| MSI GE76 Raider | |
| Mass Effect Legendary Edition | |
| 3840x2160 On | |
| MSI GE76 Raider | |
| 2560x1440 On | |
| MSI GE76 Raider | |
| 1920x1080 On | |
| MSI GE76 Raider | |
| Resident Evil Village | |
| 1920x1080 Ray Tracing Preset | |
| MSI GE76 Raider | |
| 3840x2160 Max Preset | |
| MSI GE76 Raider | |
| 2560x1440 Max Preset | |
| MSI GE76 Raider | |
| 1920x1080 Max Preset | |
| MSI GE76 Raider | |
| 1920x1080 Prioritize Graphics Preset | |
| MSI GE76 Raider | |
| 1920x1080 Balanced Preset | |
| MSI GE76 Raider | |
| Outriders | |
| 3840x2160 Ultra Preset | |
| MSI GE76 Raider | |
| 2560x1440 Ultra Preset | |
| MSI GE76 Raider | |
| 1920x1080 Ultra Preset | |
| MSI GE76 Raider | |
| 1920x1080 High Preset | |
| MSI GE76 Raider | |
| 1920x1080 Medium Preset | |
| MSI GE76 Raider | |
| Hitman 3 | |
| 3840x2160 Maximum Settings AF:16x | |
| MSI GE76 Raider | |
| 2560x1440 Maximum Settings AF:16x | |
| MSI GE76 Raider | |
| 1920x1080 Maximum Settings AF:16x | |
| Schenker XMG Ultra 17 Rocket Lake | |
| MSI GE76 Raider | |
| 1920x1080 High Settings AF:16x | |
| Schenker XMG Ultra 17 Rocket Lake | |
| MSI GE76 Raider | |
| 1920x1080 Medium Settings AF:16x | |
| Schenker XMG Ultra 17 Rocket Lake | |
| MSI GE76 Raider | |
| 1920x1080 Minimum Settings | |
| Schenker XMG Ultra 17 Rocket Lake | |
| 1280x720 Minimum Settings | |
| Schenker XMG Ultra 17 Rocket Lake | |
| Cyberpunk 2077 1.0 | |
| 1920x1080 Ray Tracing Ultra Preset (DLSS off) | |
| MSI GE76 Raider | |
| Schenker XMG Ultra 17 Rocket Lake | |
| 3840x2160 Ultra Preset | |
| MSI GE76 Raider | |
| 2560x1440 Ultra Preset | |
| MSI GE76 Raider | |
| 1920x1080 Ultra Preset | |
| MSI GE76 Raider | |
| Schenker XMG Ultra 17 Rocket Lake | |
| 1920x1080 High Preset | |
| MSI GE76 Raider | |
| Schenker XMG Ultra 17 Rocket Lake | |
| 1920x1080 Medium Preset | |
| MSI GE76 Raider | |
| Schenker XMG Ultra 17 Rocket Lake | |
| 1920x1080 Low Preset | |
| Schenker XMG Ultra 17 Rocket Lake | |
| 1280x720 Low Preset | |
| Schenker XMG Ultra 17 Rocket Lake | |
| Immortals Fenyx Rising | |
| 1920x1080 Very High Preset | |
| Schenker XMG Ultra 17 Rocket Lake | |
| 1920x1080 High Preset | |
| Schenker XMG Ultra 17 Rocket Lake | |
| 1920x1080 Medium Preset | |
| Schenker XMG Ultra 17 Rocket Lake | |
| 1280x720 Very Low Preset | |
| Schenker XMG Ultra 17 Rocket Lake | |
| Crysis Remastered | |
| 3840x2160 Very High Preset AA:SM | |
| MSI GE76 Raider | |
| 2560x1440 Very High Preset AA:SM | |
| MSI GE76 Raider | |
| 1920x1080 Very High Preset AA:SM | |
| MSI GE76 Raider | |
| 1920x1080 High Preset AA:SM | |
| MSI GE76 Raider | |
| 1920x1080 Medium Preset | |
| MSI GE76 Raider | |
| Yakuza Like a Dragon | |
| 3840x2160 Ultra Preset | |
| MSI GE76 Raider | |
| 2560x1440 Ultra Preset | |
| MSI GE76 Raider | |
| 1920x1080 Ultra Preset | |
| MSI GE76 Raider | |
| 1920x1080 High Preset | |
| MSI GE76 Raider | |
| 1920x1080 Medium Preset | |
| MSI GE76 Raider | |
| Assassin´s Creed Valhalla | |
| 3840x2160 Ultra High Preset | |
| MSI GE76 Raider | |
| 2560x1440 Ultra High Preset | |
| MSI GE76 Raider | |
| 1920x1080 Ultra High Preset | |
| MSI GE76 Raider | |
| 1920x1080 High Preset | |
| MSI GE76 Raider | |
| 1920x1080 Medium Preset | |
| MSI GE76 Raider | |
| Dirt 5 | |
| 3840x2160 Ultra High Preset | |
| MSI GE76 Raider | |
| 2560x1440 Ultra High Preset | |
| MSI GE76 Raider | |
| 1920x1080 Ultra High Preset | |
| MSI GE76 Raider | |
| Schenker XMG Ultra 17 Rocket Lake | |
| 1920x1080 High Preset | |
| MSI GE76 Raider | |
| Schenker XMG Ultra 17 Rocket Lake | |
| 1920x1080 Medium Preset | |
| MSI GE76 Raider | |
| Schenker XMG Ultra 17 Rocket Lake | |
| 1280x720 Ultra Low Preset | |
| Schenker XMG Ultra 17 Rocket Lake | |
| Watch Dogs Legion | |
| 1920x1080 Ultra Preset + Ultra Ray Tracing (DX12) | |
| MSI GE76 Raider | |
| Schenker XMG Ultra 17 Rocket Lake | |
| 3840x2160 Ultra Preset (DX12) | |
| MSI GE76 Raider | |
| 2560x1440 Ultra Preset (DX12) | |
| MSI GE76 Raider | |
| 1920x1080 Ultra Preset (DX12) | |
| Schenker XMG Ultra 17 Rocket Lake | |
| MSI GE76 Raider | |
| 1920x1080 High Preset (DX12) | |
| MSI GE76 Raider | |
| Schenker XMG Ultra 17 Rocket Lake | |
| 1920x1080 Medium Preset (DX12) | |
| Schenker XMG Ultra 17 Rocket Lake | |
| MSI GE76 Raider | |
| 1280x720 Low Preset (DX12) | |
| Schenker XMG Ultra 17 Rocket Lake | |
| Star Wars Squadrons | |
| 3840x2160 Ultra Preset | |
| MSI GE76 Raider | |
| 2560x1440 Ultra Preset | |
| MSI GE76 Raider | |
| 1920x1080 Ultra Preset | |
| MSI GE76 Raider | |
| 1920x1080 High Preset | |
| MSI GE76 Raider | |
| 1920x1080 Medium Preset | |
| MSI GE76 Raider | |
| Mafia Definitive Edition | |
| 3840x2160 High Preset | |
| MSI GE76 Raider | |
| 2560x1440 High Preset | |
| MSI GE76 Raider | |
| 1920x1080 High Preset | |
| MSI GE76 Raider | |
| 1920x1080 Medium Preset | |
| MSI GE76 Raider | |
| Serious Sam 4 | |
| 3840x2160 Ultra (DX12) AA:2xMS | |
| MSI GE76 Raider | |
| 2560x1440 Ultra (DX12) AA:2xMS | |
| MSI GE76 Raider | |
| 1920x1080 Ultra (DX12) AA:2xMS | |
| Schenker XMG Ultra 17 Rocket Lake | |
| MSI GE76 Raider | |
| 1920x1080 High (DX12) | |
| Schenker XMG Ultra 17 Rocket Lake | |
| MSI GE76 Raider | |
| 1920x1080 Medium (DX12) | |
| MSI GE76 Raider | |
| Schenker XMG Ultra 17 Rocket Lake | |
| 1280x720 Lowest (DX12) | |
| Schenker XMG Ultra 17 Rocket Lake | |
| Strange Brigade | |
| 3840x2160 ultra AA:ultra AF:16 | |
| Alienware x17 RTX 3080 P48E | |
| 2560x1440 ultra AA:ultra AF:16 | |
| Alienware x17 RTX 3080 P48E | |
| 1920x1080 ultra AA:ultra AF:16 | |
| MSI GE76 Raider | |
| Schenker XMG NEO 17 GM7TG8S | |
| Alienware x17 RTX 3080 P48E | |
| Asus ROG Zephyrus S17 GX703HSD | |
| 1920x1080 high AA:high AF:8 | |
| MSI GE76 Raider | |
| Schenker XMG NEO 17 GM7TG8S | |
| Alienware x17 RTX 3080 P48E | |
| Asus ROG Zephyrus S17 GX703HSD | |
| 1920x1080 medium AA:medium AF:4 | |
| MSI GE76 Raider | |
| Schenker XMG NEO 17 GM7TG8S | |
| Alienware x17 RTX 3080 P48E | |
| Asus ROG Zephyrus S17 GX703HSD | |
| 1280x720 lowest AF:1 | |
| Schenker XMG NEO 17 GM7TG8S | |
| Asus ROG Zephyrus S17 GX703HSD | |
| Alienware x17 RTX 3080 P48E | |
| Death Stranding | |
| 3840x2160 Very High Preset | |
| MSI GE76 Raider | |
| 2560x1440 Very High Preset | |
| MSI GE76 Raider | |
| 1920x1080 Very High Preset | |
| MSI GE76 Raider | |
| 1920x1080 Default Preset | |
| MSI GE76 Raider | |
| 1920x1080 Medium Preset | |
| MSI GE76 Raider | |
| Gears Tactics | |
| 3840x2160 Ultra Preset | |
| MSI GE76 Raider | |
| 2560x1440 Ultra Preset | |
| MSI GE76 Raider | |
| 1920x1080 Ultra Preset | |
| MSI GE76 Raider | |
| 1920x1080 High Preset | |
| MSI GE76 Raider | |
| 1920x1080 Medium Preset | |
| MSI GE76 Raider | |
| Doom Eternal | |
| 3840x2160 Ultra Preset | |
| MSI GE76 Raider | |
| 2560x1440 Ultra Preset | |
| MSI GE76 Raider | |
| 1920x1080 Ultra Preset | |
| MSI GE76 Raider | |
| Schenker XMG Ultra 17 Rocket Lake | |
| 1920x1080 High Preset | |
| MSI GE76 Raider | |
| Schenker XMG Ultra 17 Rocket Lake | |
| 1920x1080 Medium Preset | |
| MSI GE76 Raider | |
| Schenker XMG Ultra 17 Rocket Lake | |
| 1280x720 Low Preset | |
| Schenker XMG Ultra 17 Rocket Lake | |
| Hunt Showdown | |
| 3840x2160 High Preset | |
| MSI GE76 Raider | |
| 2560x1440 High Preset | |
| MSI GE76 Raider | |
| 1920x1080 High Preset | |
| MSI GE76 Raider | |
| 1920x1080 Medium Preset | |
| MSI GE76 Raider | |
| Shadow of the Tomb Raider | |
| 2560x1440 Highest Preset AA:T | |
| Schenker XMG NEO 17 GM7TG8S | |
| Asus ROG Zephyrus S17 GX703HSD | |
| 1920x1080 Highest Preset AA:T | |
| Schenker XMG Ultra 17 Rocket Lake | |
| Schenker XMG NEO 17 GM7TG8S | |
| Asus ROG Zephyrus S17 GX703HSD | |
| 1920x1080 High Preset AA:SM | |
| Schenker XMG Ultra 17 Rocket Lake | |
| Asus ROG Zephyrus S17 GX703HSD | |
| Schenker XMG NEO 17 GM7TG8S | |
| 1920x1080 Medium Preset | |
| Schenker XMG Ultra 17 Rocket Lake | |
| Schenker XMG NEO 17 GM7TG8S | |
| Asus ROG Zephyrus S17 GX703HSD | |
| 1920x1080 Lowest Preset | |
| Schenker XMG Ultra 17 Rocket Lake | |
| Schenker XMG NEO 17 GM7TG8S | |
| Asus ROG Zephyrus S17 GX703HSD | |
| 1280x720 Lowest Preset | |
| Schenker XMG Ultra 17 Rocket Lake | |
| Schenker XMG NEO 17 GM7TG8S | |
| Asus ROG Zephyrus S17 GX703HSD | |
| Far Cry 5 | |
| 3840x2160 Ultra Preset AA:T | |
| Alienware x17 RTX 3080 P48E | |
| 2560x1440 Ultra Preset AA:T | |
| Schenker XMG NEO 17 GM7TG8S | |
| Asus ROG Zephyrus S17 GX703HSD | |
| Alienware x17 RTX 3080 P48E | |
| 1920x1080 Ultra Preset AA:T | |
| Schenker XMG Ultra 17 Rocket Lake | |
| Schenker XMG NEO 17 GM7TG8S | |
| Asus ROG Zephyrus S17 GX703HSD | |
| Alienware x17 RTX 3080 P48E | |
| 1920x1080 High Preset AA:T | |
| Schenker XMG Ultra 17 Rocket Lake | |
| Schenker XMG NEO 17 GM7TG8S | |
| Asus ROG Zephyrus S17 GX703HSD | |
| Alienware x17 RTX 3080 P48E | |
| 1920x1080 Medium Preset AA:T | |
| Schenker XMG Ultra 17 Rocket Lake | |
| Schenker XMG NEO 17 GM7TG8S | |
| Asus ROG Zephyrus S17 GX703HSD | |
| Alienware x17 RTX 3080 P48E | |
| 1920x1080 Low Preset AA:T | |
| Schenker XMG Ultra 17 Rocket Lake | |
| Schenker XMG NEO 17 GM7TG8S | |
| Asus ROG Zephyrus S17 GX703HSD | |
| Alienware x17 RTX 3080 P48E | |
| 1280x720 Low Preset AA:T | |
| Schenker XMG Ultra 17 Rocket Lake | |
| Asus ROG Zephyrus S17 GX703HSD | |
| Schenker XMG NEO 17 GM7TG8S | |
| Alienware x17 RTX 3080 P48E | |
| X-Plane 11.11 | |
| 3840x2160 high (fps_test=3) | |
| Alienware x17 RTX 3080 P48E | |
| 1920x1080 high (fps_test=3) | |
| Schenker XMG Ultra 17 Rocket Lake | |
| MSI GE76 Raider | |
| Asus ROG Zephyrus S17 GX703HSD | |
| Schenker XMG NEO 17 GM7TG8S | |
| Alienware x17 RTX 3080 P48E | |
| 1920x1080 med (fps_test=2) | |
| Schenker XMG Ultra 17 Rocket Lake | |
| MSI GE76 Raider | |
| Asus ROG Zephyrus S17 GX703HSD | |
| Schenker XMG NEO 17 GM7TG8S | |
| Alienware x17 RTX 3080 P48E | |
| 1280x720 low (fps_test=1) | |
| Schenker XMG Ultra 17 Rocket Lake | |
| MSI GE76 Raider | |
| Asus ROG Zephyrus S17 GX703HSD | |
| Schenker XMG NEO 17 GM7TG8S | |
| Alienware x17 RTX 3080 P48E | |
| Final Fantasy XV Benchmark | |
| 3840x2160 High Quality | |
| Alienware x17 RTX 3080 P48E | |
| 2560x1440 High Quality | |
| Alienware x17 RTX 3080 P48E | |
| 1920x1080 High Quality | |
| MSI GE76 Raider | |
| Alienware x17 RTX 3080 P48E | |
| 1920x1080 Standard Quality | |
| MSI GE76 Raider | |
| Asus ROG Zephyrus S17 GX703HSD | |
| Alienware x17 RTX 3080 P48E | |
| 1280x720 Lite Quality | |
| Alienware x17 RTX 3080 P48E | |
| Dota 2 Reborn | |
| 3840x2160 ultra (3/3) best looking | |
| Alienware x17 RTX 3080 P48E | |
| 1920x1080 ultra (3/3) best looking | |
| Schenker XMG Ultra 17 Rocket Lake | |
| MSI GE76 Raider | |
| Asus ROG Zephyrus S17 GX703HSD | |
| Alienware x17 RTX 3080 P48E | |
| Schenker XMG NEO 17 GM7TG8S | |
| 1920x1080 high (2/3) | |
| MSI GE76 Raider | |
| Schenker XMG Ultra 17 Rocket Lake | |
| Asus ROG Zephyrus S17 GX703HSD | |
| Alienware x17 RTX 3080 P48E | |
| Schenker XMG NEO 17 GM7TG8S | |
| 1366x768 med (1/3) | |
| MSI GE76 Raider | |
| Schenker XMG Ultra 17 Rocket Lake | |
| Schenker XMG NEO 17 GM7TG8S | |
| Alienware x17 RTX 3080 P48E | |
| Asus ROG Zephyrus S17 GX703HSD | |
| 1280x720 min (0/3) fastest | |
| MSI GE76 Raider | |
| Schenker XMG Ultra 17 Rocket Lake | |
| Schenker XMG NEO 17 GM7TG8S | |
| Asus ROG Zephyrus S17 GX703HSD | |
| Alienware x17 RTX 3080 P48E | |
| The Witcher 3 | |
| 3840x2160 Ultra Graphics & Postprocessing (HBAO+) | |
| Alienware x17 RTX 3080 P48E | |
| 3840x2160 High Graphics & Postprocessing (Nvidia HairWorks Off) | |
| Alienware x17 RTX 3080 P48E | |
| 1920x1080 Ultra Graphics & Postprocessing (HBAO+) | |
| MSI GE76 Raider | |
| Schenker XMG Ultra 17 Rocket Lake | |
| Schenker XMG NEO 17 GM7TG8S | |
| Asus ROG Zephyrus S17 GX703HSD | |
| Alienware x17 RTX 3080 P48E | |
| 1920x1080 High Graphics & Postprocessing (Nvidia HairWorks Off) | |
| MSI GE76 Raider | |
| Schenker XMG Ultra 17 Rocket Lake | |
| Schenker XMG NEO 17 GM7TG8S | |
| Asus ROG Zephyrus S17 GX703HSD | |
| Alienware x17 RTX 3080 P48E | |
| 1366x768 Medium Graphics & Postprocessing | |
| MSI GE76 Raider | |
| Schenker XMG Ultra 17 Rocket Lake | |
| Schenker XMG NEO 17 GM7TG8S | |
| Alienware x17 RTX 3080 P48E | |
| Asus ROG Zephyrus S17 GX703HSD | |
| 1920x1080 Medium Graphics & Postprocessing | |
| Schenker XMG NEO 17 GM7TG8S | |
| Asus ROG Zephyrus S17 GX703HSD | |
| 1024x768 Low Graphics & Postprocessing | |
| Schenker XMG Ultra 17 Rocket Lake | |
| Schenker XMG NEO 17 GM7TG8S | |
| Asus ROG Zephyrus S17 GX703HSD | |
| Alienware x17 RTX 3080 P48E | |
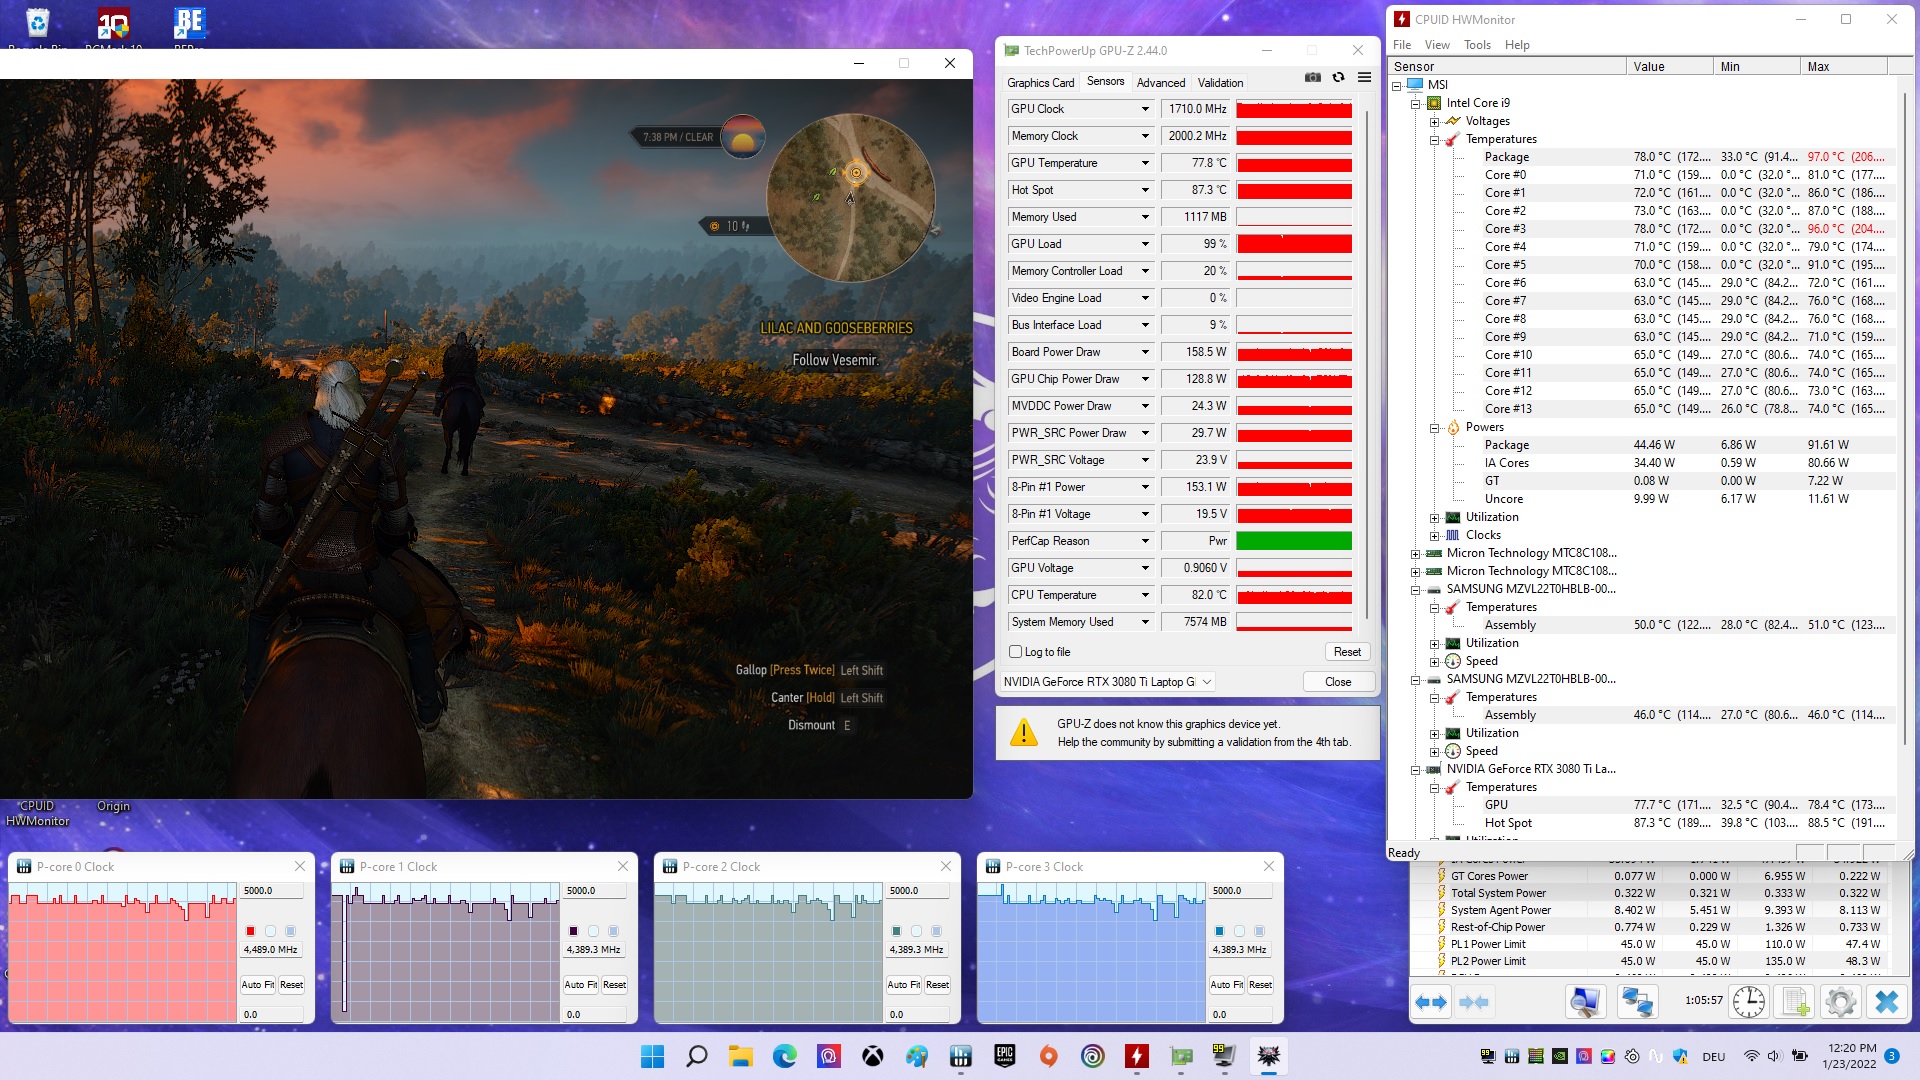
Comprobamos el rendimiento 3D sostenido con nuestra prueba Witcher 3 (60 minutos). El reloj de la GPU cae ligeramente (similar al de la CPU), pero no se nota la diferencia. La tasa de fotogramas general fue muy estable a lo largo de la prueba.
Witcher 3 FPS chart
| bajo | medio | alto | ultra | QHD | 4K | |
|---|---|---|---|---|---|---|
| GTA V (2015) | 184 | 176 | 125 | |||
| The Witcher 3 (2015) | 384 | 247 | 126 | |||
| Dota 2 Reborn (2015) | 186 | 172 | 164 | 156 | ||
| Final Fantasy XV Benchmark (2018) | 171 | 131 | ||||
| X-Plane 11.11 (2018) | 155 | 133 | 109 | |||
| Strange Brigade (2018) | 312 | 251 | 221 | |||
| Hunt Showdown (2020) | 206 | 181 | 117 | 54.3 | ||
| Doom Eternal (2020) | 361 | 307 | 304 | 236 | 128 | |
| Gears Tactics (2020) | 295 | 205 | 154 | 103 | 58.9 | |
| Death Stranding (2020) | 152 | 151 | 150 | 130 | 78 | |
| Crysis Remastered (2020) | 199 | 103 | 71.4 | 60.9 | 38.1 | |
| Serious Sam 4 (2020) | 121 | 109 | 103 | 94.4 | 65.6 | |
| Mafia Definitive Edition (2020) | 158 | 151 | 108 | 58.6 | ||
| Star Wars Squadrons (2020) | 407 | 378 | 354 | 261 | 144 | |
| Watch Dogs Legion (2020) | 121 | 113 | 87 | 69 | 42 | |
| Dirt 5 (2020) | 170 | 141 | 117 | 93.1 | 60.9 | |
| Assassin´s Creed Valhalla (2020) | 135 | 103 | 93 | 74 | 50 | |
| Yakuza Like a Dragon (2020) | 162 | 160 | 143 | 107 | 54.8 | |
| Cyberpunk 2077 1.0 (2020) | 121 | 101 | 85.3 | 53.9 | 26.1 | |
| Hitman 3 (2021) | 213 | 197 | 189 | 136 | 76.1 | |
| Outriders (2021) | 160 | 155 | 153 | 111 | 57.4 | |
| Resident Evil Village (2021) | 248 | 232 | 197 | 135 | 70.9 | |
| Mass Effect Legendary Edition (2021) | 152 | 149 | 115 | |||
| Days Gone (2021) | 197 | 177 | 133 | 98.5 | 57.1 | |
| F1 2021 (2021) | 342 | 289 | 157 | 117 | 68 | |
| Deathloop (2021) | 143 | 133 | 112 | 80.2 | 44.4 | |
| New World (2021) | 129 | 122 | 115 | 94.9 | 50.9 | |
| Alan Wake Remastered (2021) | 157 | 155 | 149 | 89 | ||
| Far Cry 6 (2021) | 144 | 130 | 114 | 93 | 57 | |
| Back 4 Blood (2021) | 294 | 263 | 238 | 171 | 88.9 | |
| Guardians of the Galaxy (2021) | 157 | 156 | 155 | 136 | 75 | |
| Riders Republic (2021) | 163 | 138 | 129 | 98 | 56 | |
| Forza Horizon 5 (2021) | 155 | 142 | 95 | 82 | 61 | |
| Battlefield 2042 (2021) | 141 | 121 | 108 | 88.2 | 58.7 | |
| Farming Simulator 22 (2021) | 205 | 183 | 158 | 143 | 93.3 | |
| Halo Infinite (2021) | 171 | 147 | 141 | 104 | 59 | |
| God of War (2022) | 146 | 119 | 81.6 | 67.5 | 46.4 |
Emisiones
Ruido del sistema
El ruido del ventilador es un problema familiar para los portátiles de juegos, y el GE76 también será bastante ruidoso cuando juegues con el modo de rendimiento extremo. 50 hasta 53 dB(A) son claramente audibles, aunque la competencia es a veces incluso más ruidosa bajo carga máxima - a pesar de tener componentes más lentos.
Teniendo en cuenta el fuerte ruido del ventilador, recomendaríamos el modo Equilibrado para los juegos, en el que el GE76 se mantiene por debajo de los 50 dB(A) y sólo recibe un pequeño golpe de rendimiento. Algunos juegos funcionarán bien incluso con el modo Silencioso, que hace honor a su nombre (menos de 40 dB(A)). El sistema de 17 pulgadas suele ser muy silencioso en reposo (incluso con el modo de Rendimiento Extremo) si puedes vivir con las subidas ocasionales de los ventiladores.
Ruido
| Ocioso |
| 26 / 27 / 40 dB(A) |
| Carga |
| 50 / 53 dB(A) |
 | ||
30 dB silencioso 40 dB(A) audible 50 dB(A) ruidosamente alto |
||
min: | ||
| MSI GE76 Raider i9-12900HK, GeForce RTX 3080 Ti Laptop GPU | Schenker XMG NEO 17 GM7TG8S i7-11800H, GeForce RTX 3080 Laptop GPU | Alienware x17 RTX 3080 P48E i7-11800H, GeForce RTX 3080 Laptop GPU | Asus ROG Zephyrus S17 GX703HSD i9-11900H, GeForce RTX 3080 Laptop GPU | Schenker XMG Ultra 17 Rocket Lake i9-11900K, GeForce RTX 3080 Laptop GPU | |
|---|---|---|---|---|---|
| Noise | 14% | 12% | 17% | -18% | |
| apagado / medio ambiente * (dB) | 26 | 23 12% | 24.9 4% | 23 12% | 24 8% |
| Idle Minimum * (dB) | 26 | 23 12% | 24.9 4% | 23 12% | 30 -15% |
| Idle Average * (dB) | 27 | 23 15% | 24.9 8% | 23 15% | 31 -15% |
| Idle Maximum * (dB) | 40 | 23 43% | 29.6 26% | 23 43% | 57 -43% |
| Load Average * (dB) | 50 | 39.5 21% | 31.1 38% | 41 18% | 63 -26% |
| Witcher 3 ultra * (dB) | 53 | 54.5 -3% | 49.7 6% | 45 15% | 61 -15% |
| Load Maximum * (dB) | 53 | 55.09 -4% | 54.8 -3% | 52 2% | 63 -19% |
* ... más pequeño es mejor
Temperatura
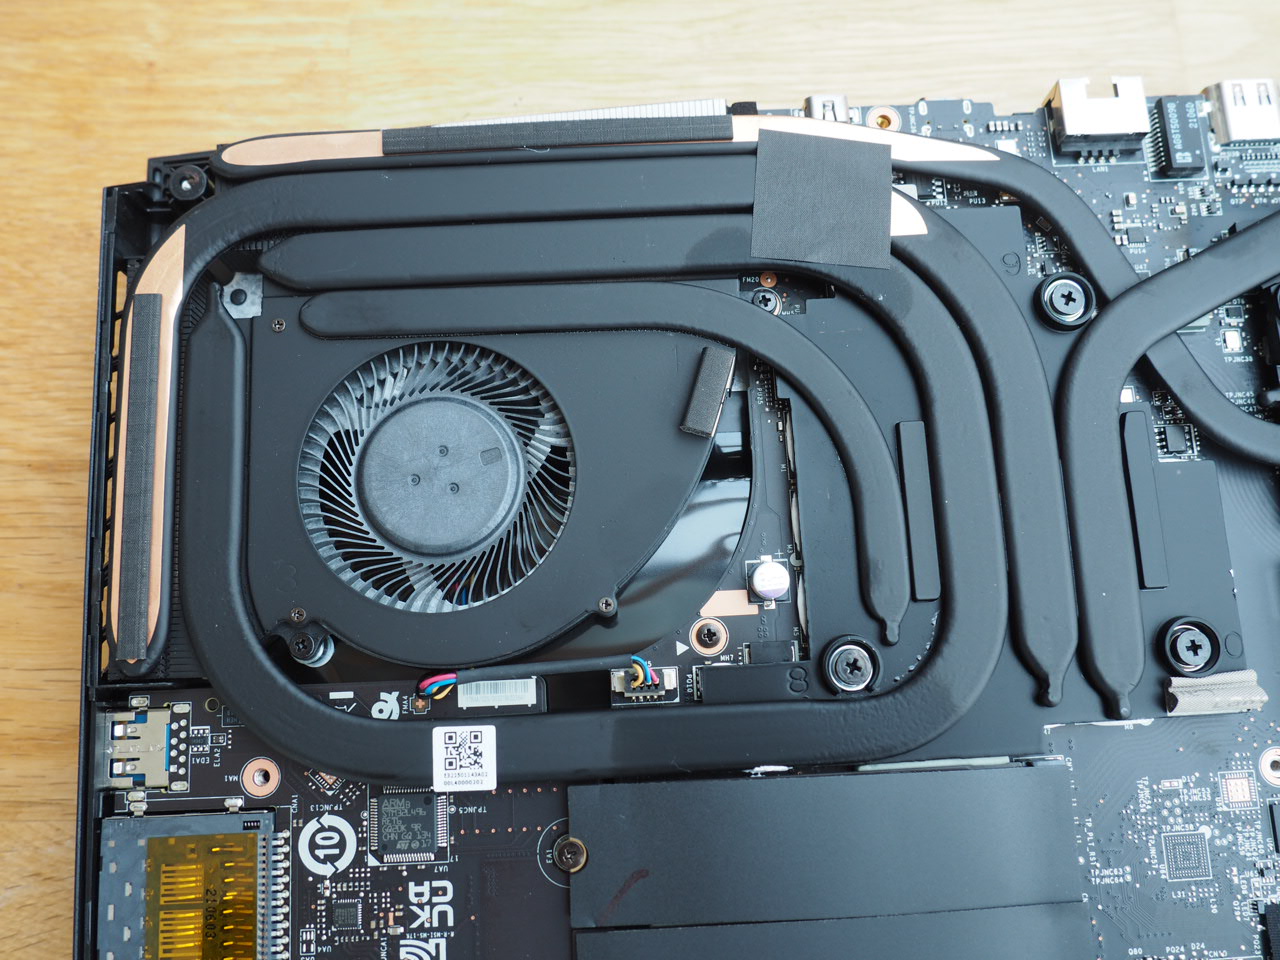
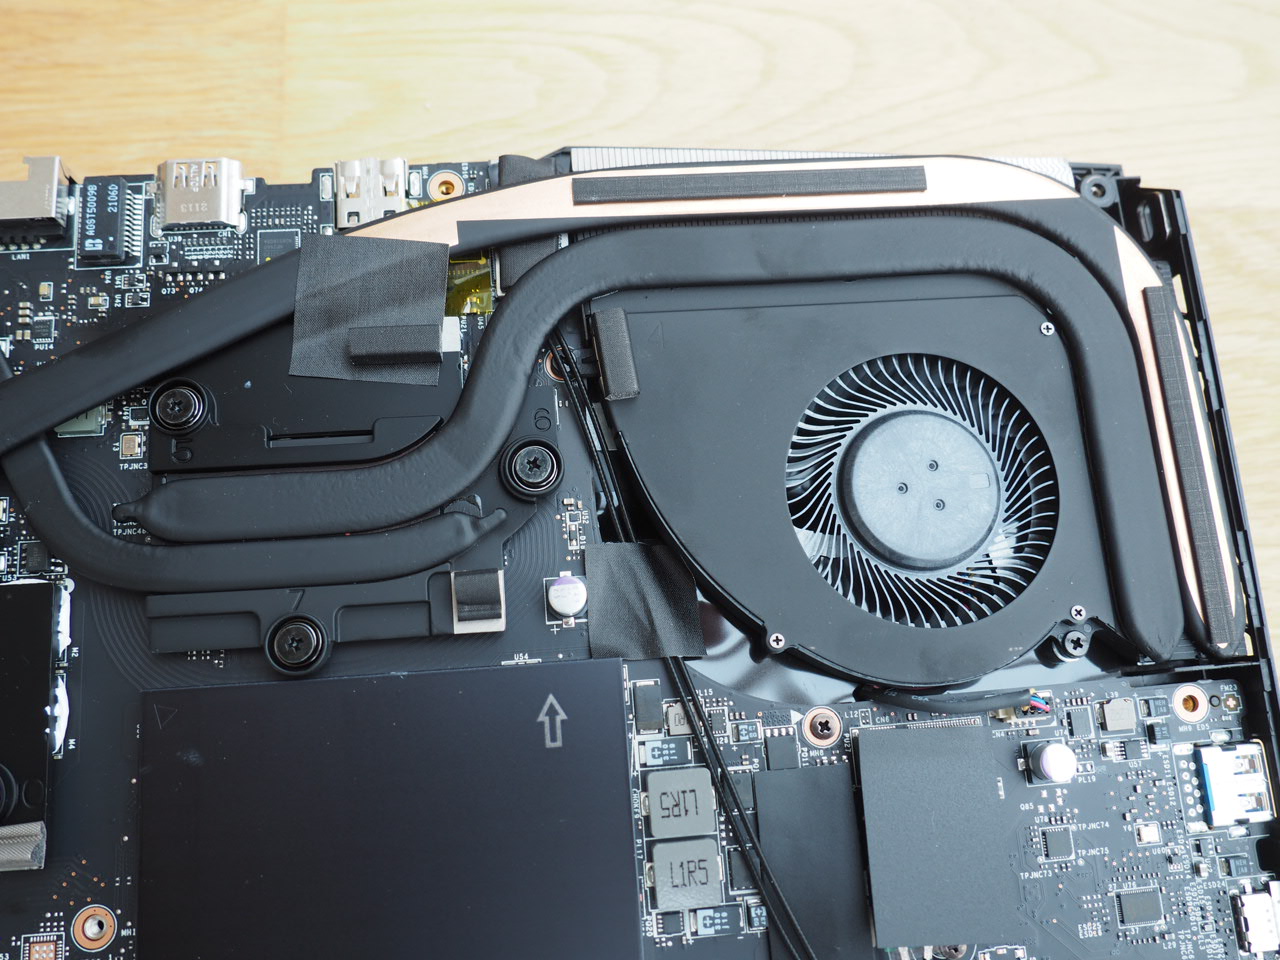
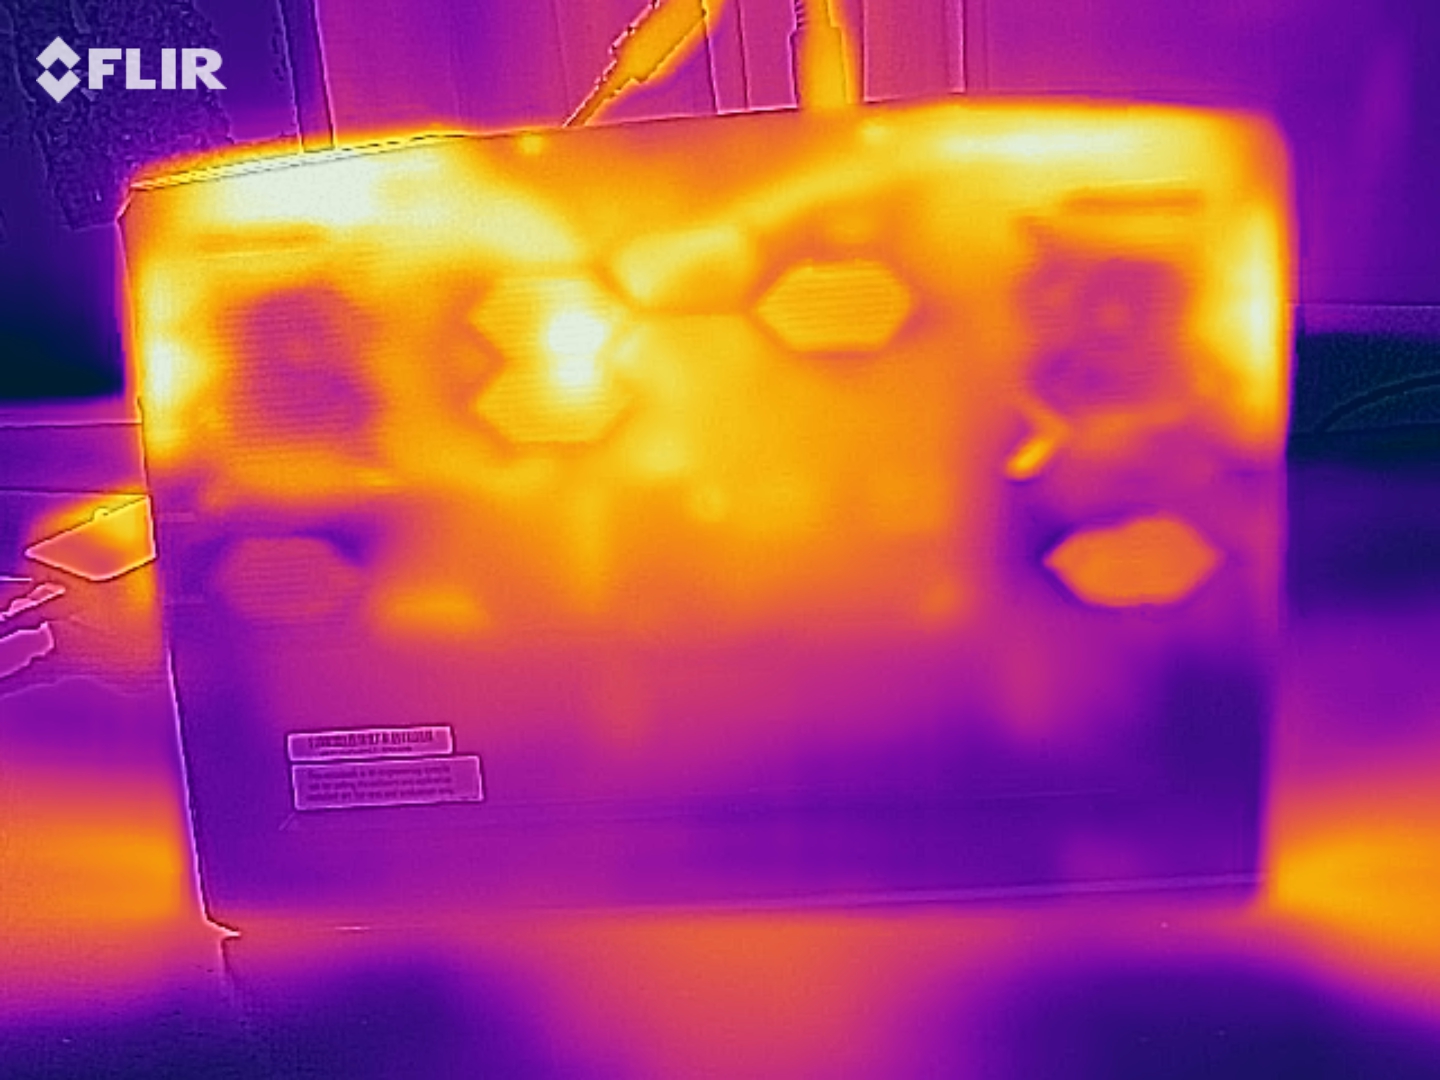
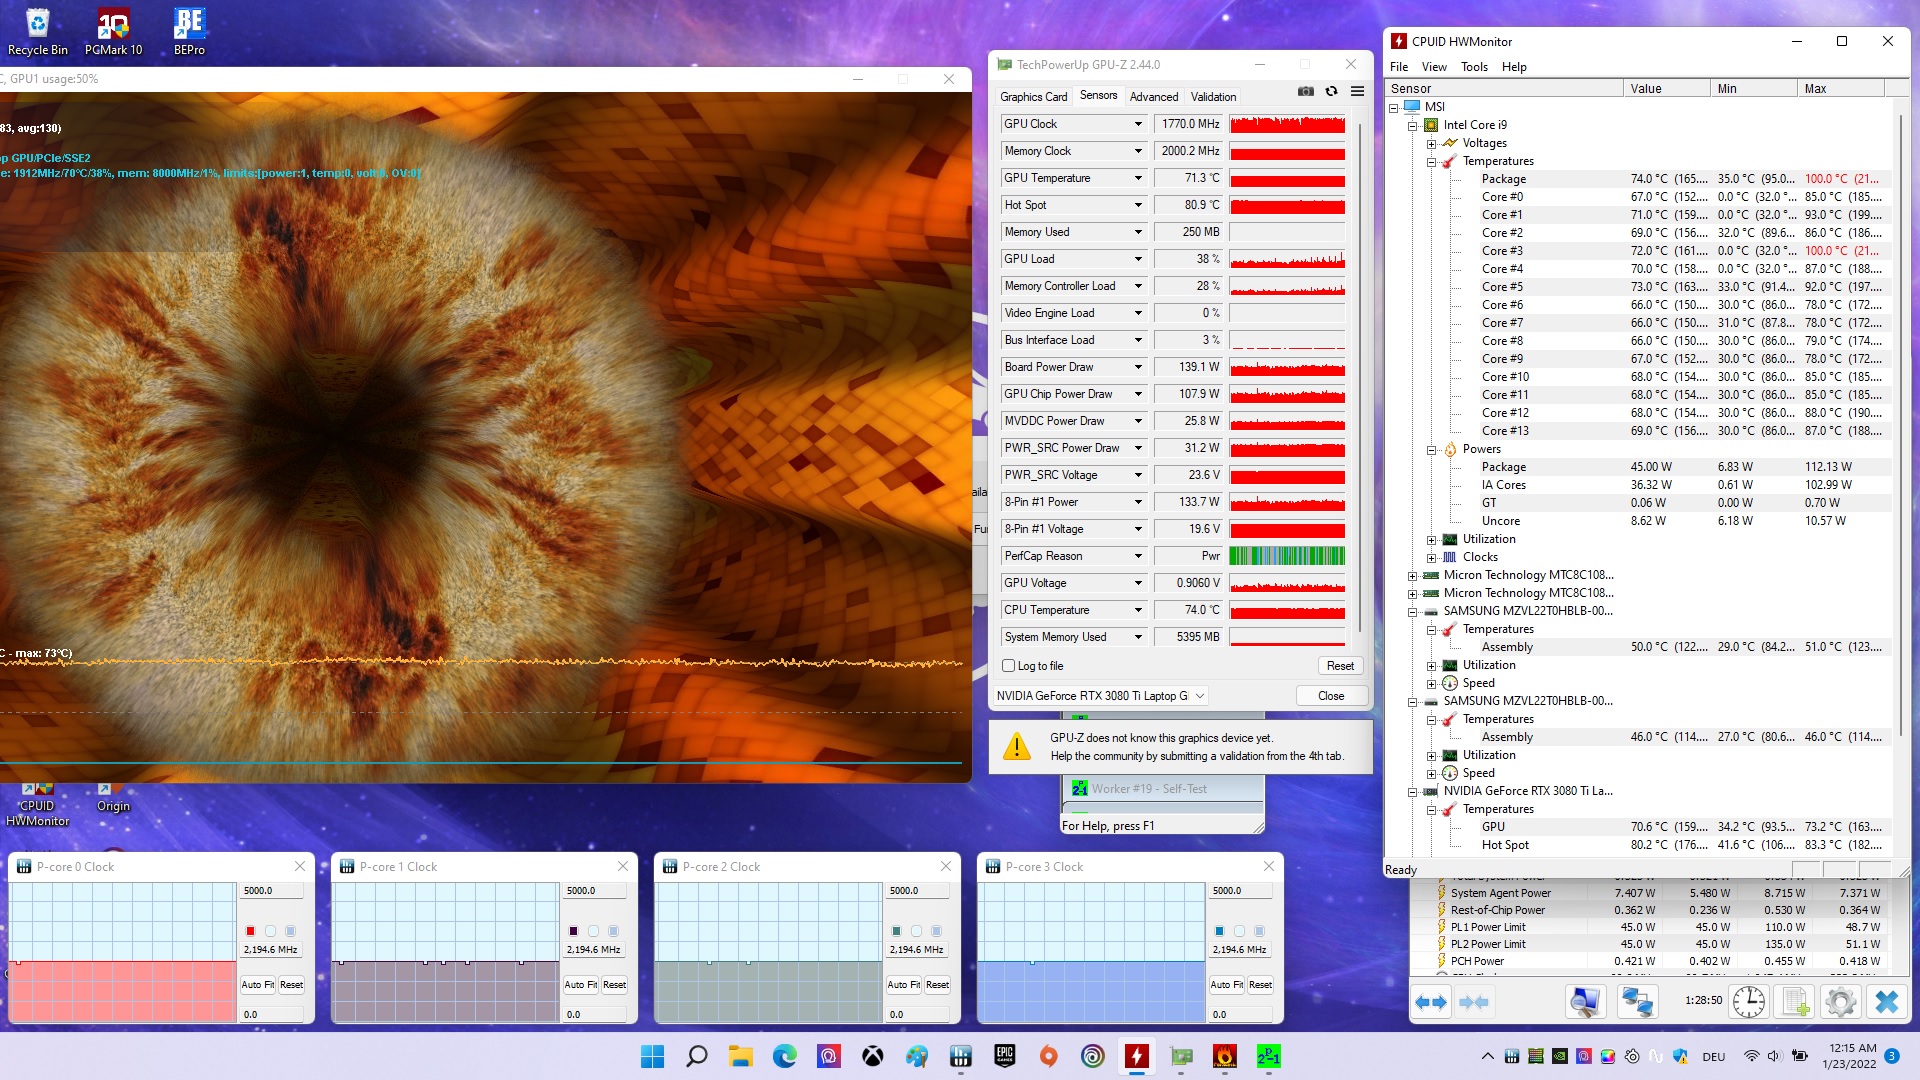
Aunque el GE76 puede ser bastante ruidoso, seguimos pensando que el sistema de refrigeración es un éxito. Esto se basa en las moderadas temperaturas del chasis. Mientras que las mediciones durante el test de estrés con las herramientas FurMark y Prime95 no son muy representativas debido a la ralentización de la CPU, el test Witcher 3 es un mejor indicador de las temperaturas durante las sesiones de juego. Menos de 45 °C en la parte superior y menos de 50 °C en la inferior son sorprendentemente buenos para un portátil de gama alta tan potente - especialmente considerando la altura del chasis de menos de 3 cm. Los componentes (CPU y GPU) rondan los 80 °C durante el test Witcher 3 - también un resultado decente.
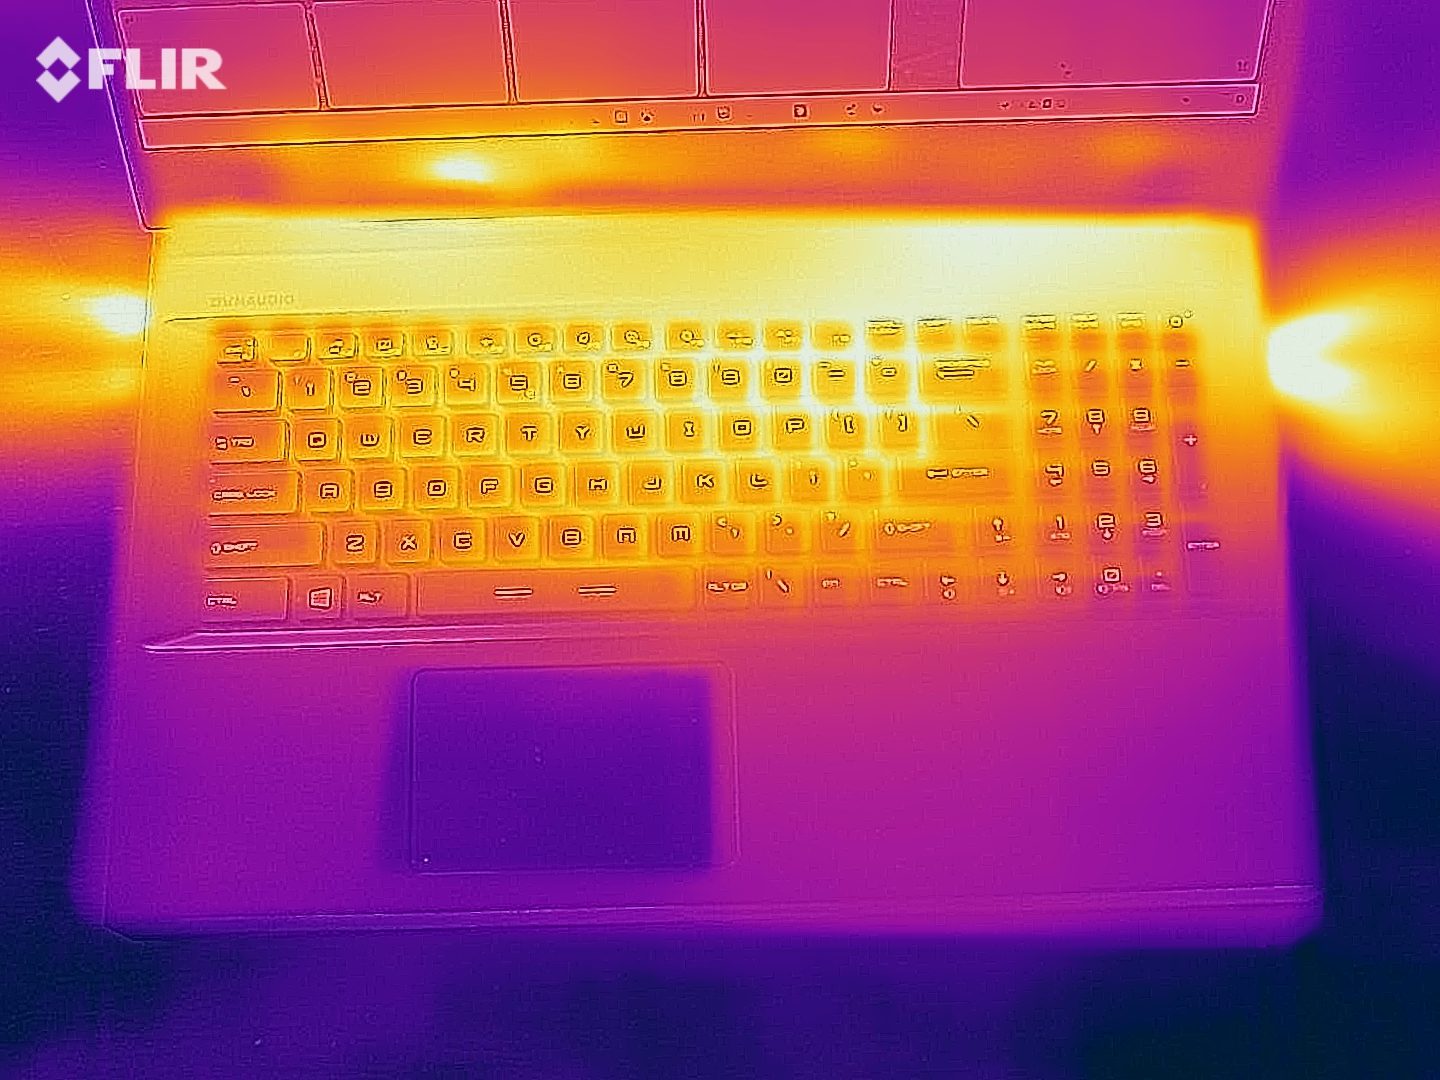
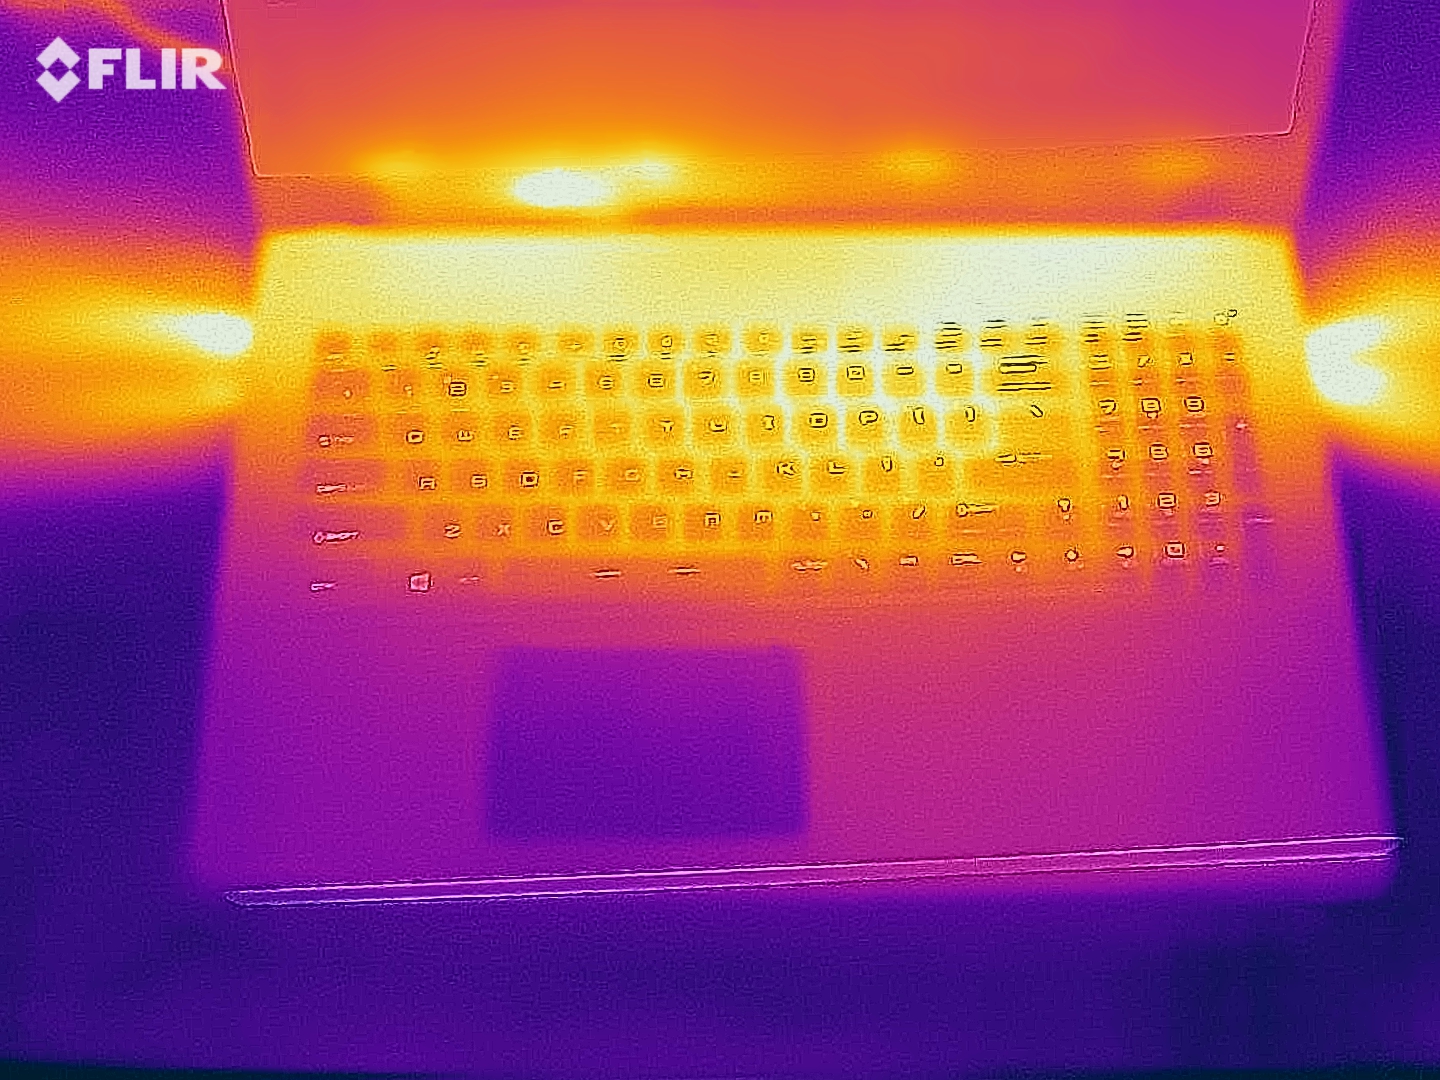
(±) La temperatura máxima en la parte superior es de 43 °C / 109 F, frente a la media de 40.4 °C / 105 F, que oscila entre 21.2 y 68.8 °C para la clase Gaming.
(-) El fondo se calienta hasta un máximo de 47 °C / 117 F, frente a la media de 43.2 °C / 110 F
(+) En reposo, la temperatura media de la parte superior es de 29.1 °C / 84# F, frente a la media del dispositivo de 33.9 °C / 93 F.
(±) Jugando a The Witcher 3, la temperatura media de la parte superior es de 37.6 °C / 100 F, frente a la media del dispositivo de 33.9 °C / 93 F.
(+) El reposamanos y el panel táctil están a una temperatura inferior a la de la piel, con un máximo de 30 °C / 86 F y, por tanto, son fríos al tacto.
(±) La temperatura media de la zona del reposamanos de dispositivos similares fue de 28.8 °C / 83.8 F (-1.2 °C / -2.2 F).
| MSI GE76 Raider i9-12900HK, GeForce RTX 3080 Ti Laptop GPU | Schenker XMG NEO 17 GM7TG8S i7-11800H, GeForce RTX 3080 Laptop GPU | Alienware x17 RTX 3080 P48E i7-11800H, GeForce RTX 3080 Laptop GPU | Asus ROG Zephyrus S17 GX703HSD i9-11900H, GeForce RTX 3080 Laptop GPU | Schenker XMG Ultra 17 Rocket Lake i9-11900K, GeForce RTX 3080 Laptop GPU | |
|---|---|---|---|---|---|
| Heat | -15% | -9% | -13% | 3% | |
| Maximum Upper Side * (°C) | 43 | 51 -19% | 58.4 -36% | 59 -37% | 34 21% |
| Maximum Bottom * (°C) | 47 | 62 -32% | 49 -4% | 53 -13% | 43 9% |
| Idle Upper Side * (°C) | 33 | 35 -6% | 33.6 -2% | 35 -6% | 38 -15% |
| Idle Bottom * (°C) | 37 | 38 -3% | 34.6 6% | 35 5% | 39 -5% |
* ... más pequeño es mejor
Altavoces
MSI GE76 Raider análisis de audio
(+) | los altavoces pueden reproducir a un volumen relativamente alto (#84 dB)
Graves 100 - 315 Hz
(±) | lubina reducida - en promedio 10.3% inferior a la mediana
(±) | la linealidad de los graves es media (8.5% delta a frecuencia anterior)
Medios 400 - 2000 Hz
(±) | medias más altas - de media 6.8% más altas que la mediana
(+) | los medios son lineales (4.1% delta a la frecuencia anterior)
Altos 2 - 16 kHz
(+) | máximos equilibrados - a sólo 2.7% de la mediana
(+) | los máximos son lineales (4.9% delta a la frecuencia anterior)
Total 100 - 16.000 Hz
(+) | el sonido global es lineal (13.5% de diferencia con la mediana)
En comparación con la misma clase
» 19% de todos los dispositivos probados de esta clase eran mejores, 7% similares, 73% peores
» El mejor tuvo un delta de 6%, la media fue 18%, el peor fue ###max##%
En comparación con todos los dispositivos probados
» 14% de todos los dispositivos probados eran mejores, 4% similares, 82% peores
» El mejor tuvo un delta de 4%, la media fue 24%, el peor fue ###max##%
Alienware x17 RTX 3080 P48E análisis de audio
(+) | los altavoces pueden reproducir a un volumen relativamente alto (#88 dB)
Graves 100 - 315 Hz
(-) | casi sin bajos - de media 23% inferior a la mediana
(±) | la linealidad de los graves es media (9.8% delta a frecuencia anterior)
Medios 400 - 2000 Hz
(+) | medios equilibrados - a sólo 2.7% de la mediana
(+) | los medios son lineales (4% delta a la frecuencia anterior)
Altos 2 - 16 kHz
(+) | máximos equilibrados - a sólo 4.4% de la mediana
(±) | la linealidad de los máximos es media (7% delta a frecuencia anterior)
Total 100 - 16.000 Hz
(±) | la linealidad del sonido global es media (17.3% de diferencia con la mediana)
En comparación con la misma clase
» 47% de todos los dispositivos probados de esta clase eran mejores, 12% similares, 41% peores
» El mejor tuvo un delta de 6%, la media fue 18%, el peor fue ###max##%
En comparación con todos los dispositivos probados
» 32% de todos los dispositivos probados eran mejores, 8% similares, 59% peores
» El mejor tuvo un delta de 4%, la media fue 24%, el peor fue ###max##%
Gestión de la energía
Consumo de energía
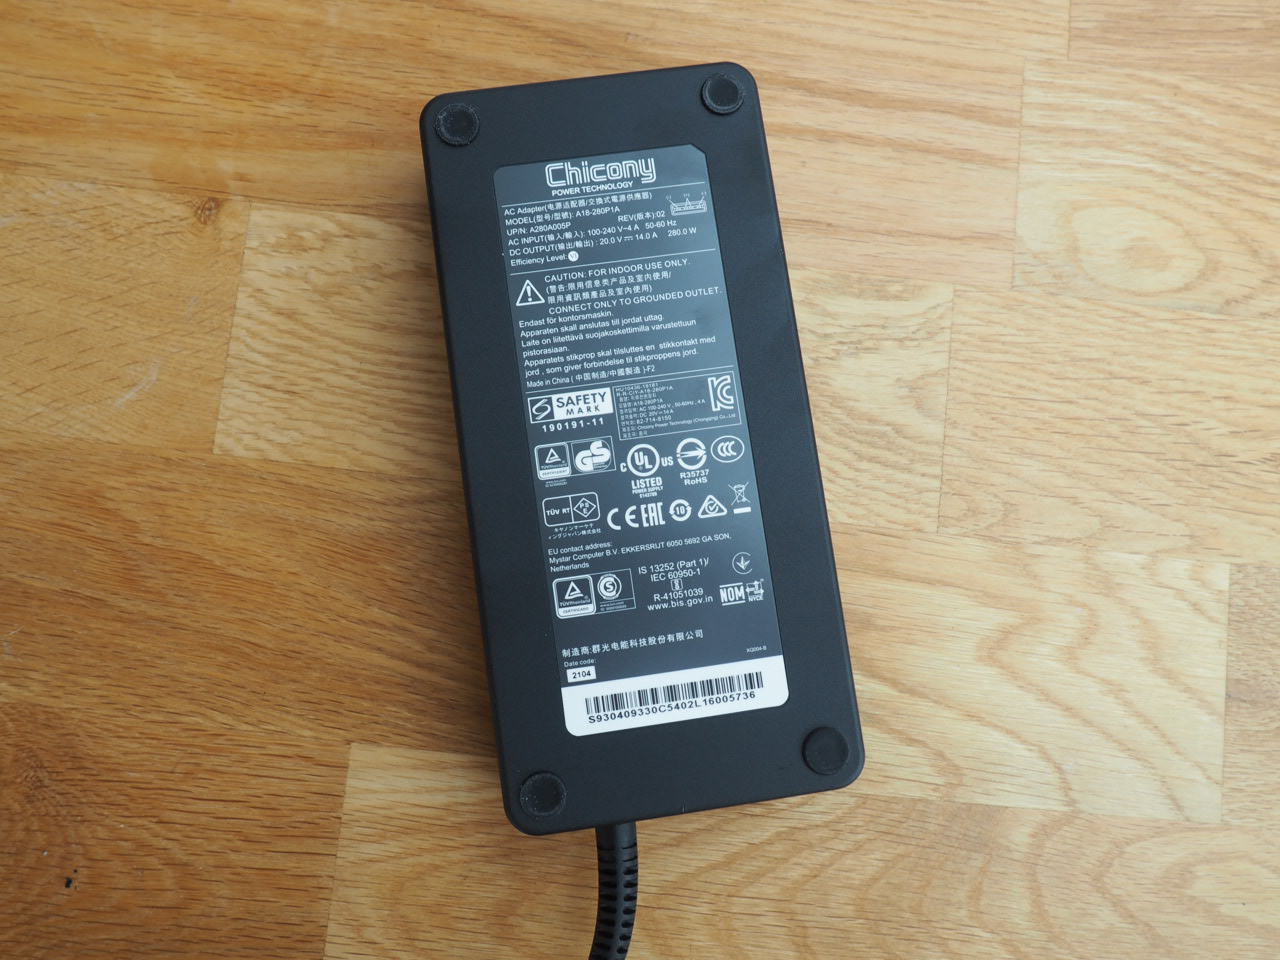
El GE76 no consume demasiada energía en reposo siempre que la conmutación gráfica esté activada. de 12 a 28 vatios son buenos resultados teniendo en cuenta el hardware y también es más eficiente que los rivales. Observamos entre 118 y 272 vatios durante las aplicaciones 3D, por lo que el adaptador de corriente de 280W incluido parece ser suficiente.
| Off / Standby | |
| Ocioso | |
| Carga |
|
Clave:
min: | |
| MSI GE76 Raider i9-12900HK, GeForce RTX 3080 Ti Laptop GPU | Schenker XMG NEO 17 GM7TG8S i7-11800H, GeForce RTX 3080 Laptop GPU | Alienware x17 RTX 3080 P48E i7-11800H, GeForce RTX 3080 Laptop GPU | Asus ROG Zephyrus S17 GX703HSD i9-11900H, GeForce RTX 3080 Laptop GPU | Schenker XMG Ultra 17 Rocket Lake i9-11900K, GeForce RTX 3080 Laptop GPU | Media de la clase Gaming | |
|---|---|---|---|---|---|---|
| Power Consumption | -11% | -13% | -17% | -158% | 1% | |
| Idle Minimum * (Watt) | 12 | 19 -58% | 10.2 15% | 21.7 -81% | 62 -417% | 13.2 ? -10% |
| Idle Average * (Watt) | 17 | 25 -47% | 21.2 -25% | 27 -59% | 64 -276% | 18.9 ? -11% |
| Idle Maximum * (Watt) | 28 | 28 -0% | 48.4 -73% | 33 -18% | 69 -146% | 24.3 ? 13% |
| Load Average * (Watt) | 118 | 105 11% | 118.7 -1% | 108 8% | 183 -55% | 108 ? 8% |
| Witcher 3 ultra * (Watt) | 252 | 223 12% | 249 1% | 195 23% | 297 -18% | |
| Load Maximum * (Watt) | 272 | 226 17% | 262 4% | 210 23% | 368 -35% | 254 ? 7% |
* ... más pequeño es mejor
Power Consumption Witcher 3 / Stress test
Power Consumption external screen
Duración de la batería
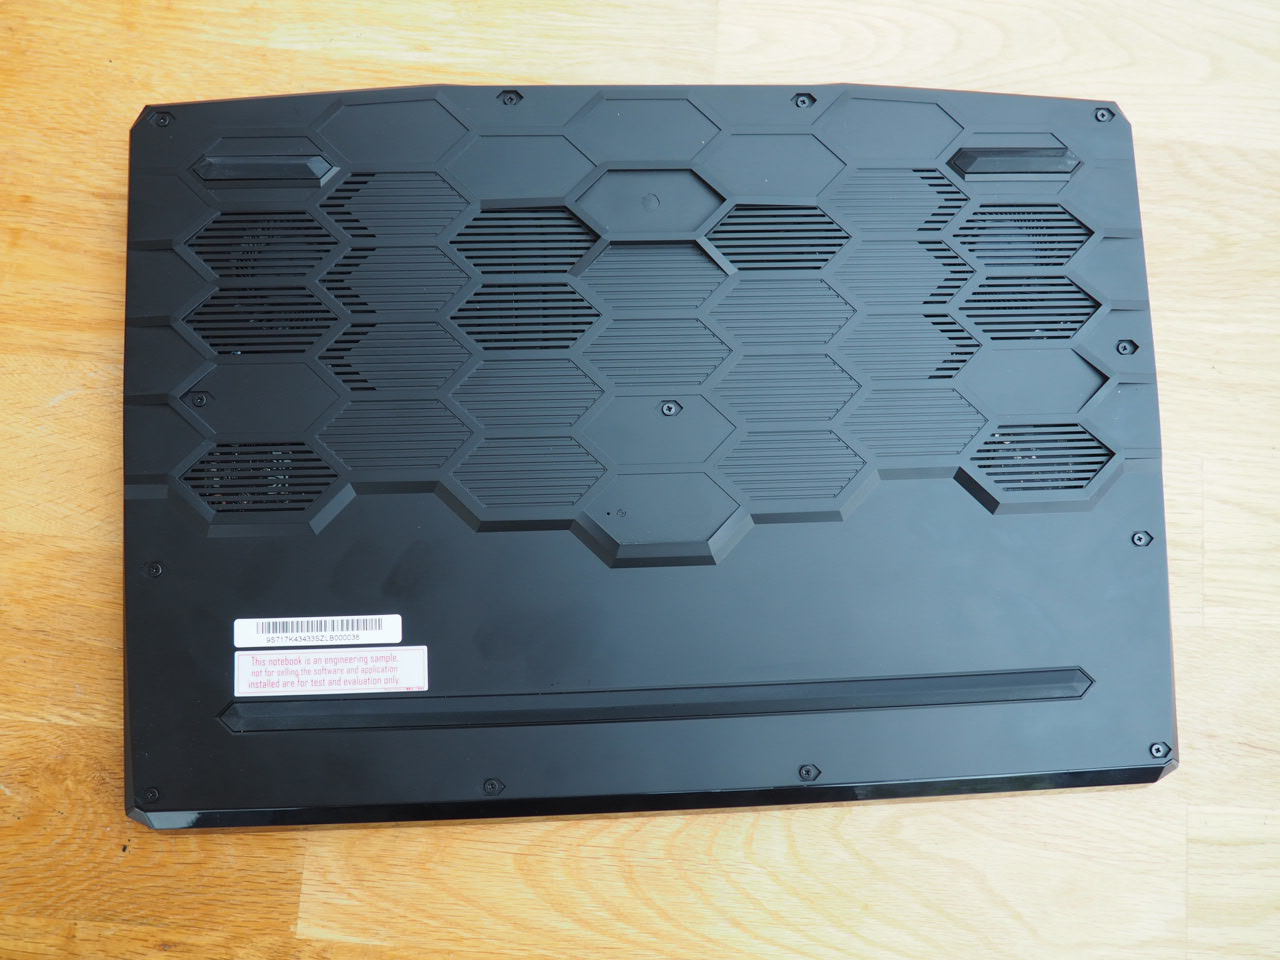
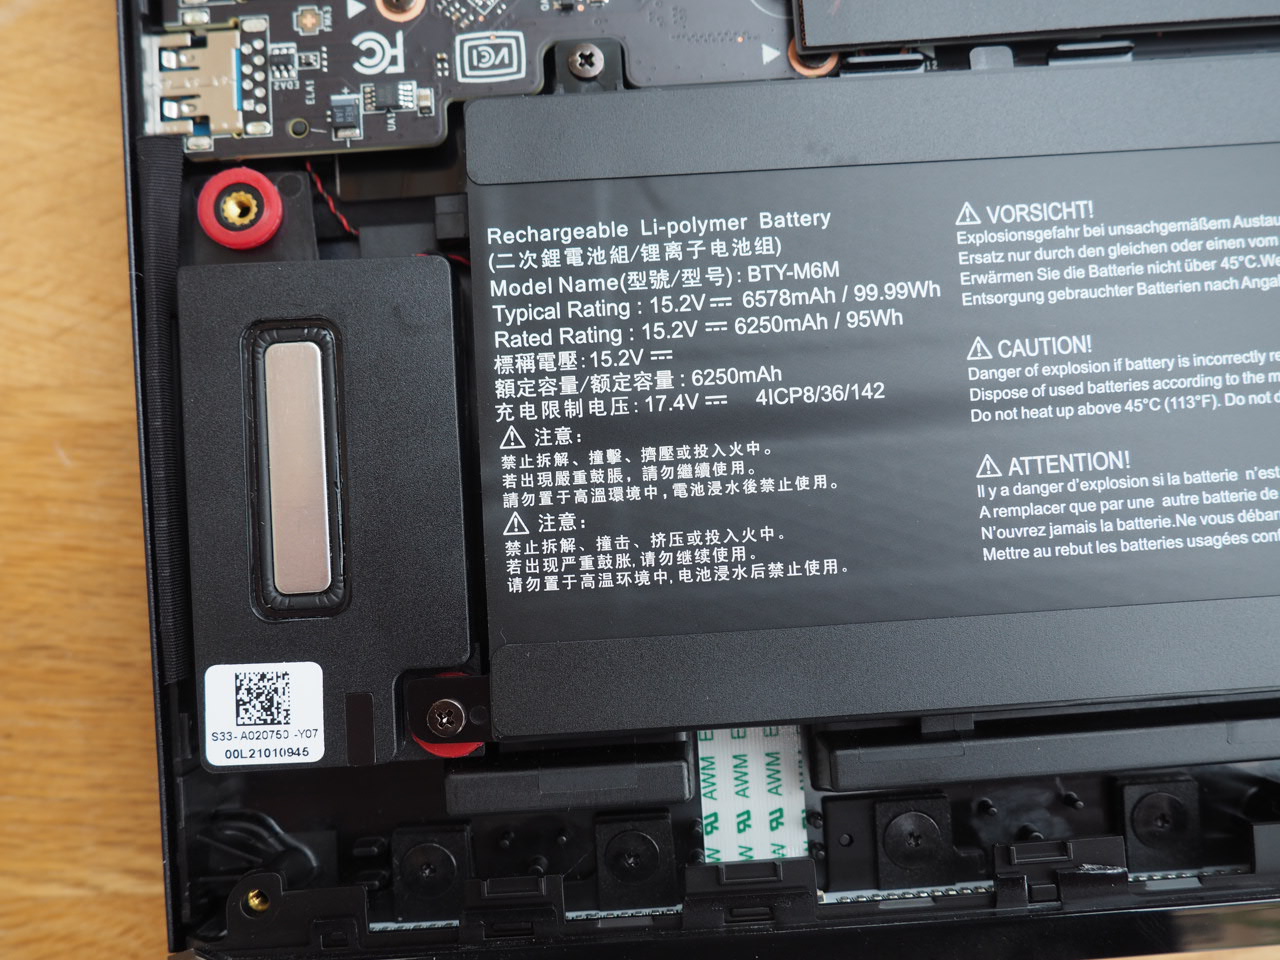
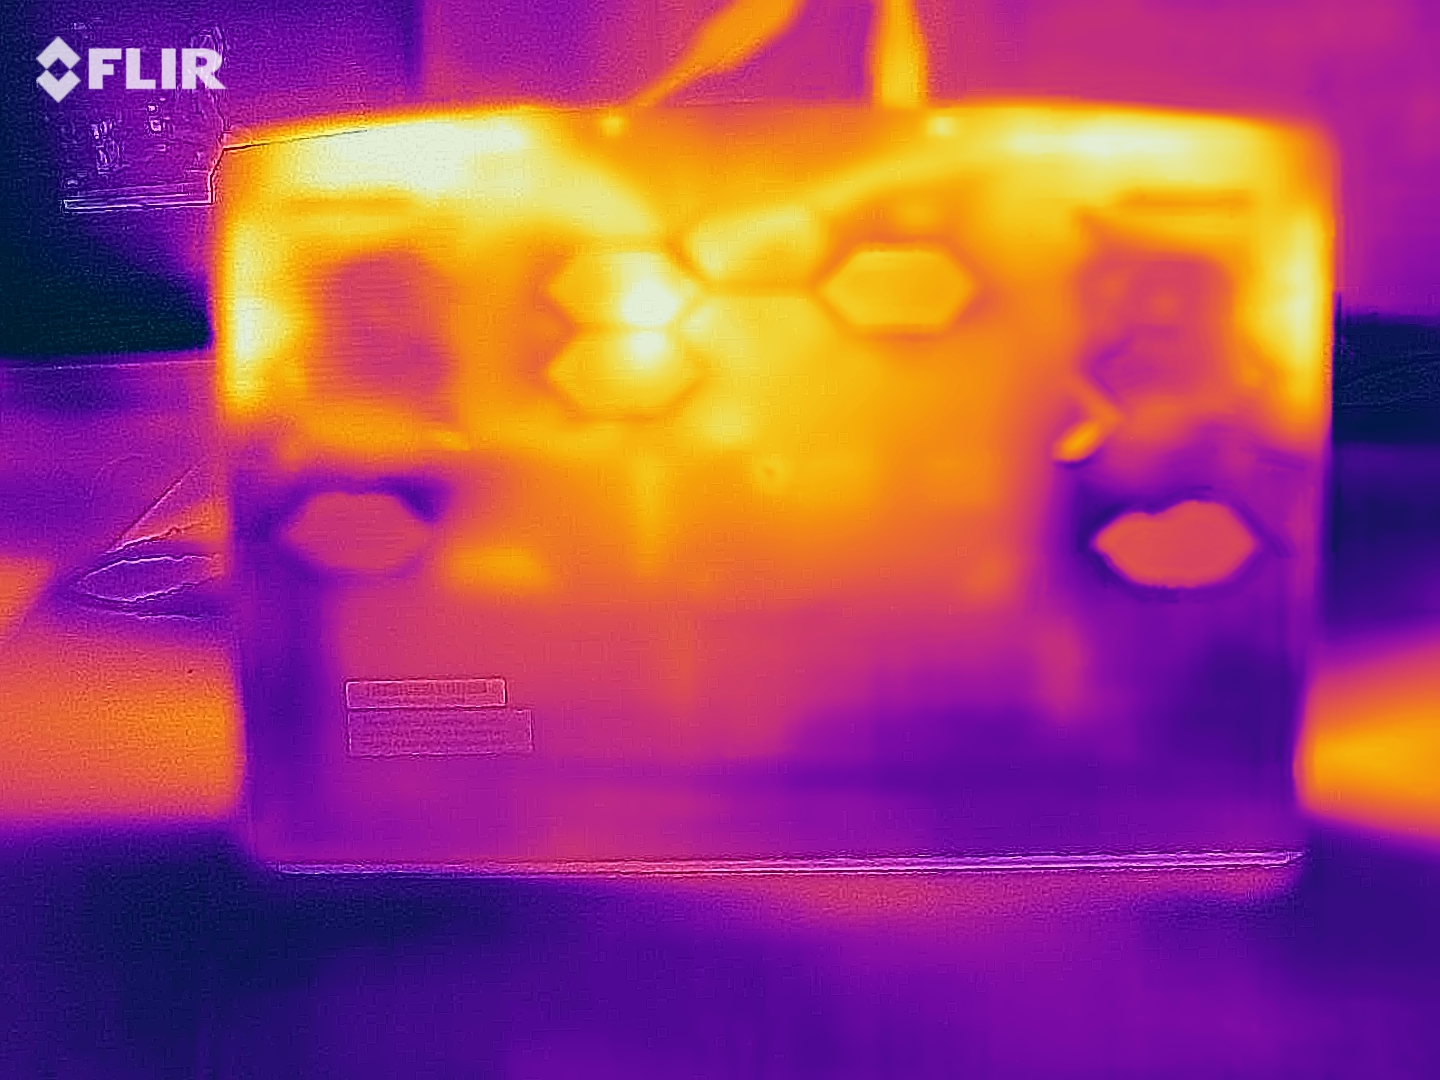
Un vistazo a la distribución interna muestra que el área bajo el reposamanos está casi completamente ocupada por la batería. MSI volvió a decidir usar un modelo gigante de 99.9 Wh, que vence a todos los rivales - al menos sobre el papel (62 hasta 97 Wh). La duración de la batería, sin embargo, no puede estar a la altura. Tanto el Alienware x17 como el Asus Zephyrus S17 consiguen una mayor duración en nuestro test Wi-Fi (navegación web a 150 nits), a pesar de tener baterías más pequeñas. Casi 5 horas con el modo de rendimiento equilibrado sigue siendo un resultado respetable para la unidad de prueba de 17 pulgadas.
| MSI GE76 Raider i9-12900HK, GeForce RTX 3080 Ti Laptop GPU, 99.99 Wh | Schenker XMG NEO 17 GM7TG8S i7-11800H, GeForce RTX 3080 Laptop GPU, 62 Wh | Alienware x17 RTX 3080 P48E i7-11800H, GeForce RTX 3080 Laptop GPU, 87 Wh | Asus ROG Zephyrus S17 GX703HSD i9-11900H, GeForce RTX 3080 Laptop GPU, 90 Wh | Schenker XMG Ultra 17 Rocket Lake i9-11900K, GeForce RTX 3080 Laptop GPU, 97 Wh | Media de la clase Gaming | |
|---|---|---|---|---|---|---|
| Duración de Batería | -27% | 16% | 47% | -65% | 38% | |
| WiFi v1.3 (h) | 5.1 | 3.7 -27% | 5.9 16% | 7.5 47% | 1.8 -65% | 7.02 ? 38% |
| H.264 (h) | 3.7 | 7.2 | 1.9 | 8.26 ? | ||
| Load (h) | 1.6 | 0.8 | 2.7 | 1.1 | 1.47 ? | |
| Reader / Idle (h) | 7 | 3 | 8.71 ? | |||
| Witcher 3 ultra (h) | 1 |
Pro
Contra
Veredicto
La última versión del MSI GE76 Raider vuelve a ser un sueño para los amantes de los juegos
Sí, MSI podría mejorar algunos aspectos (como la calidad de la webcam), pero el fabricante ofrece un paquete global muy convincente y equilibrado. La mayor ventaja es sin duda el inmenso potencial de rendimiento.
La combinación deCore i9-12900HK,GeForce RTX 3080 Ti32 GB de memoria DDR5 y los dos discos duros NVMe ofrecen mucho rendimiento para los próximos dos años y mucha potencia para las aplicaciones 3D. La mayoría de los títulos seguirían funcionando sin problemas en una pantalla externa 4K con los ajustes máximos. El panel integrado de 360 Hz impresiona con rápidos tiempos de respuesta y buena precisión de color.
Si el dispositivo es demasiado ruidoso para ti en el modo de Rendimiento Extremo, puedes cambiar fácilmente a otra configuración de rendimiento a través del software MSI Center. El perfil Equilibrado es un buen compromiso entre frame rates y ruido de ventilador en nuestra experiencia, y recomendaríamos los modos Silencioso y Super Batería con cambio de gráfica activo para cargas de trabajo sencillas o en la carretera, respectivamente.
MSI GE76 Raider
- 01/24/2022 v7 (old)
Florian Glaser
Price comparison

