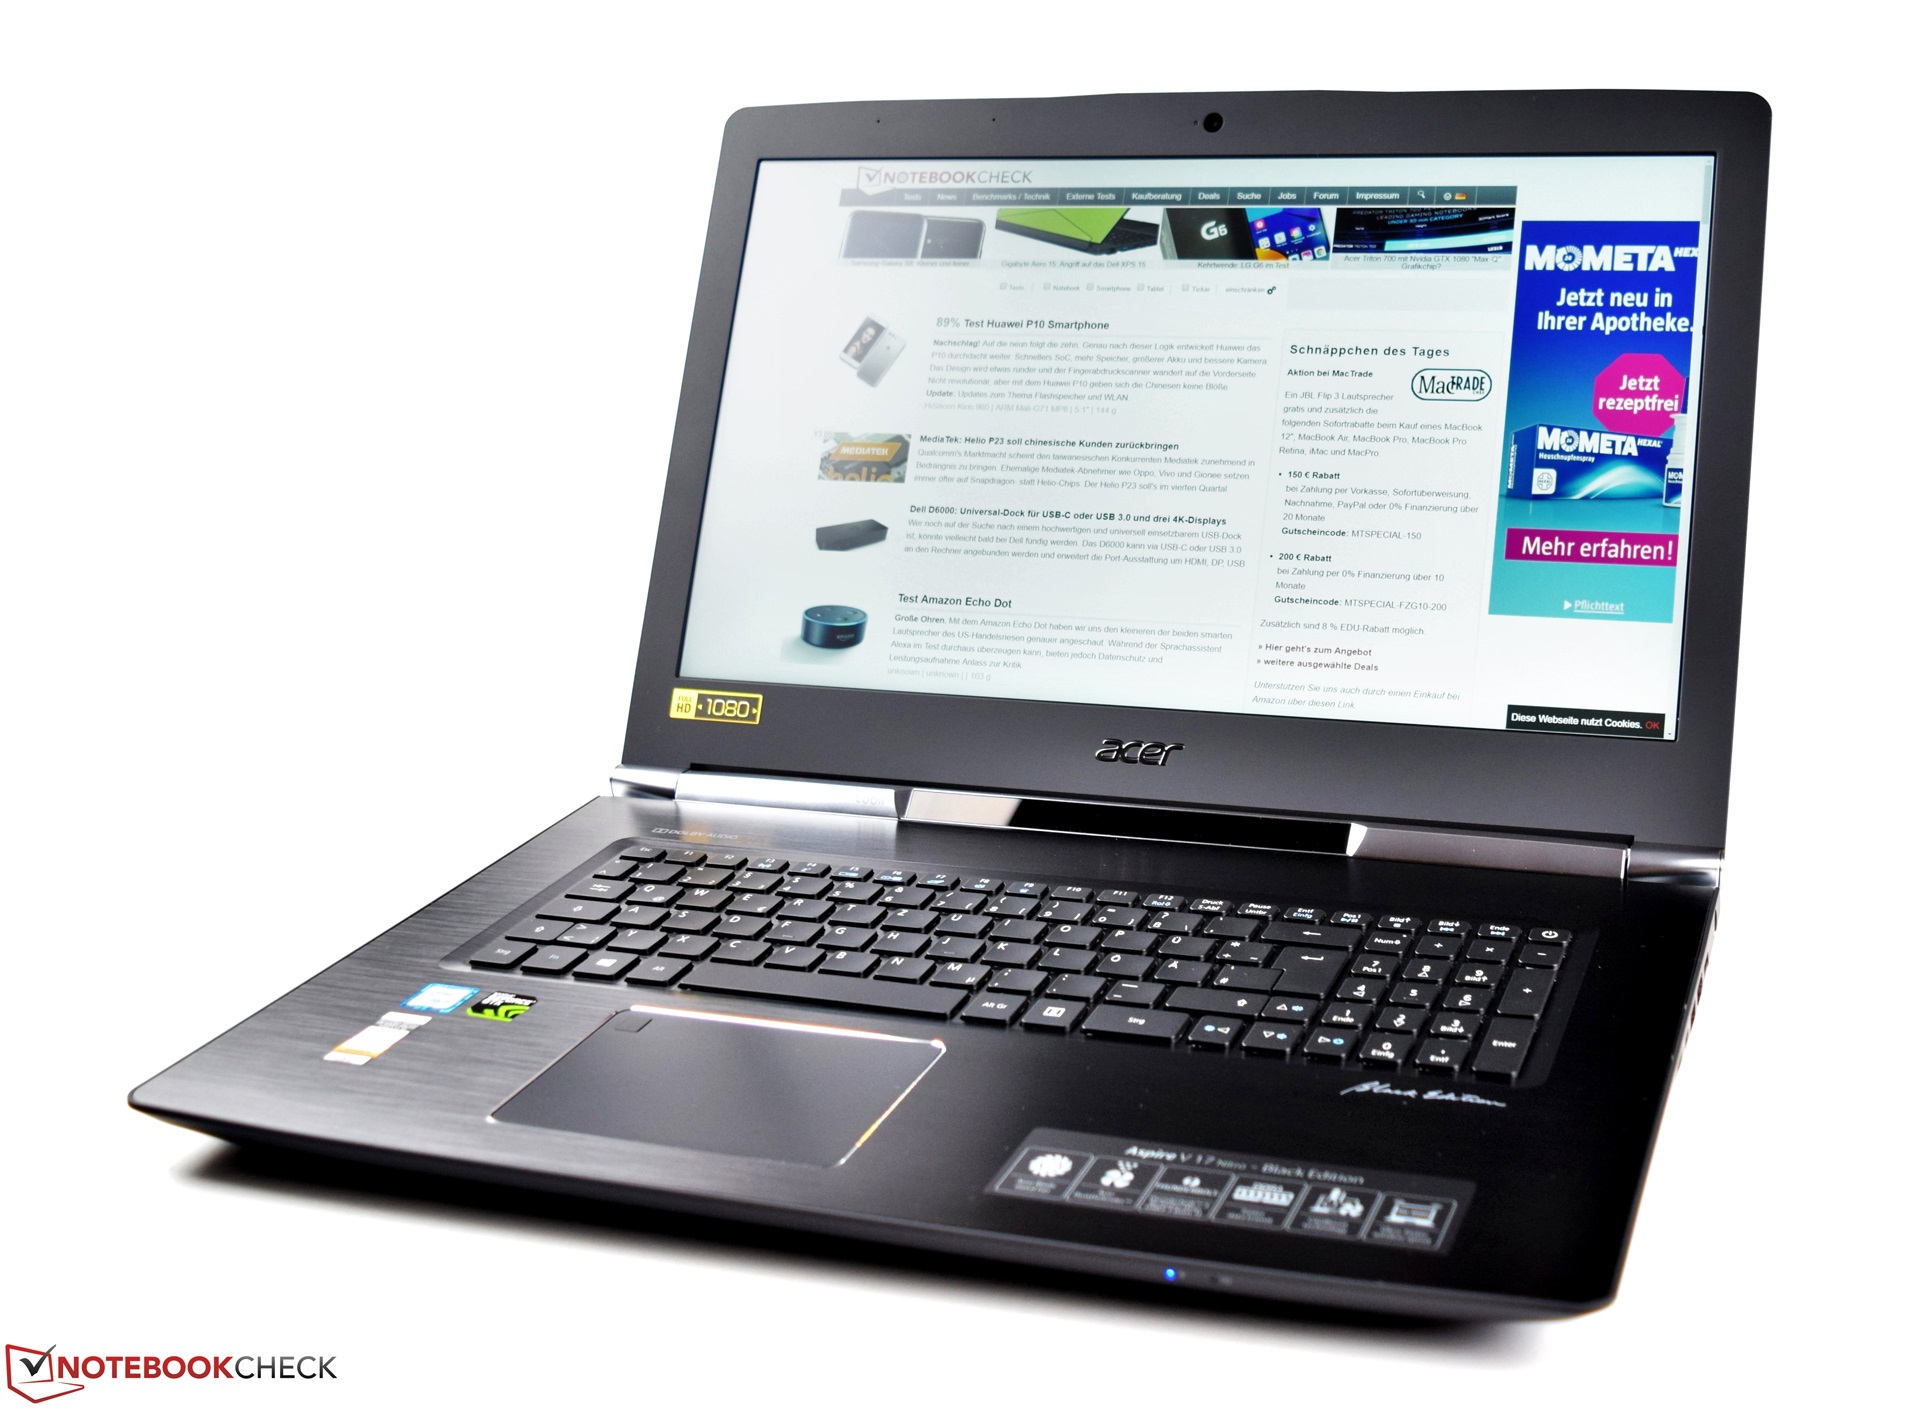
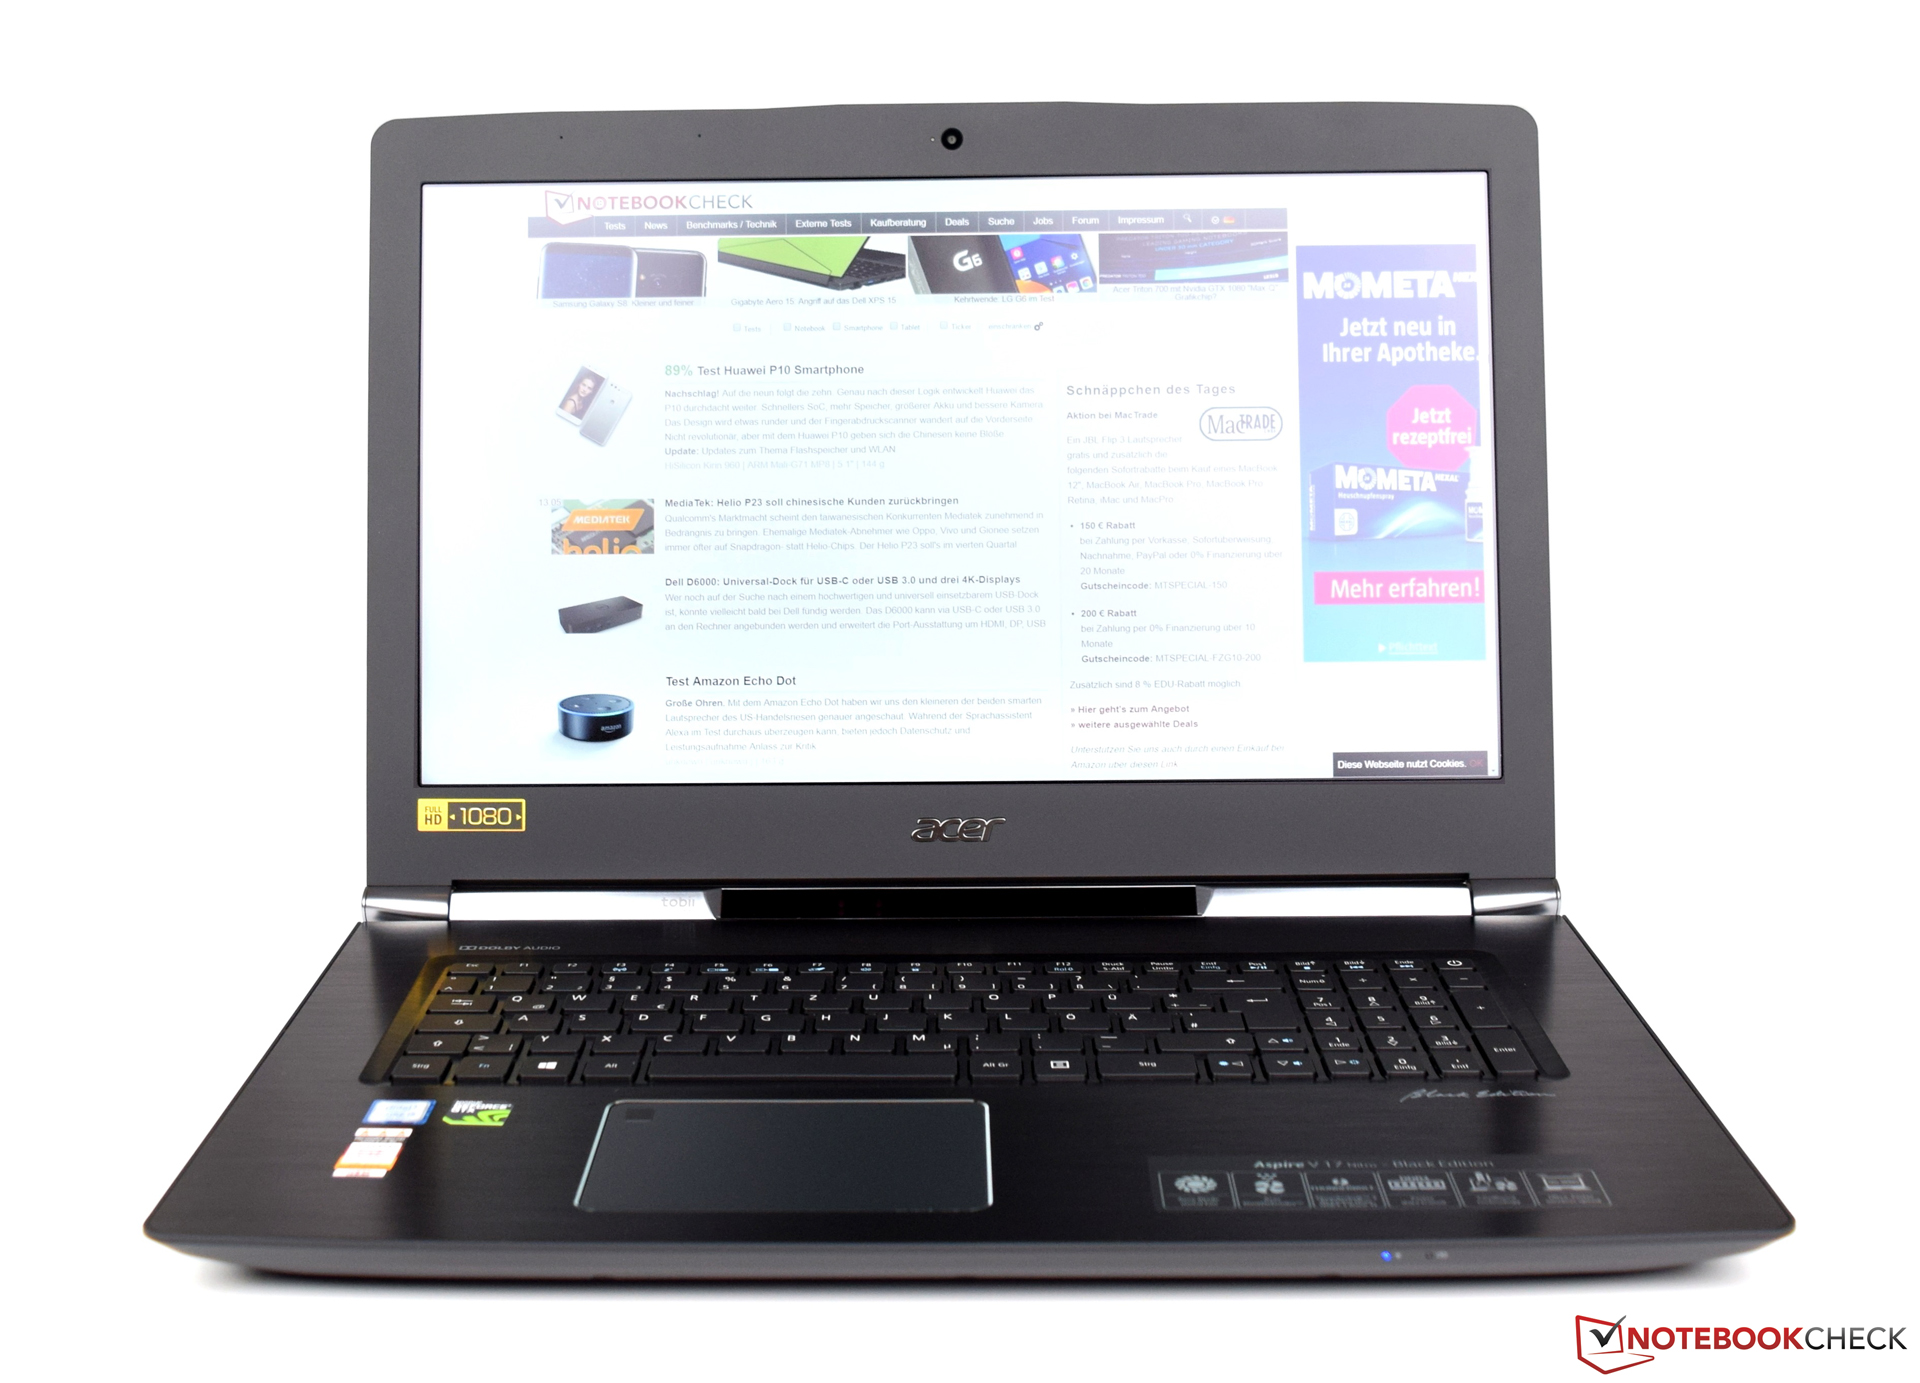
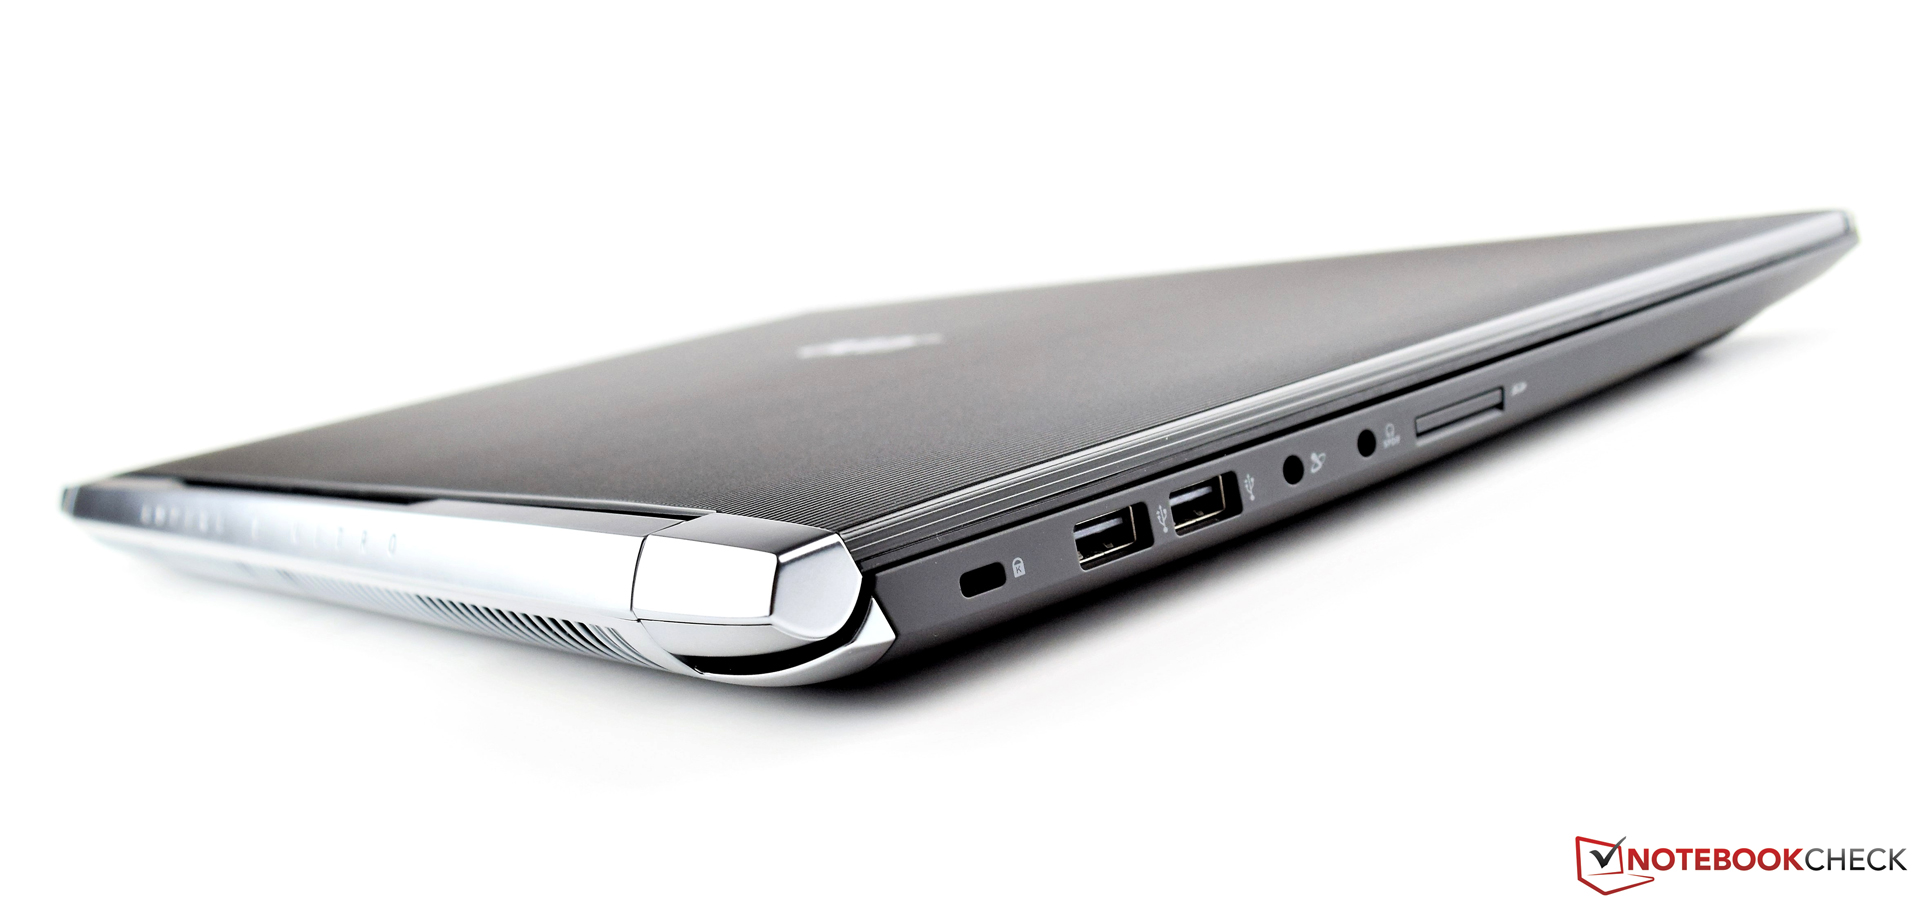
Breve análisis del Acer Aspire V17 Nitro BE VN7-793G (7300HQ, GTX 1060, FHD, Seguimiento ocular)
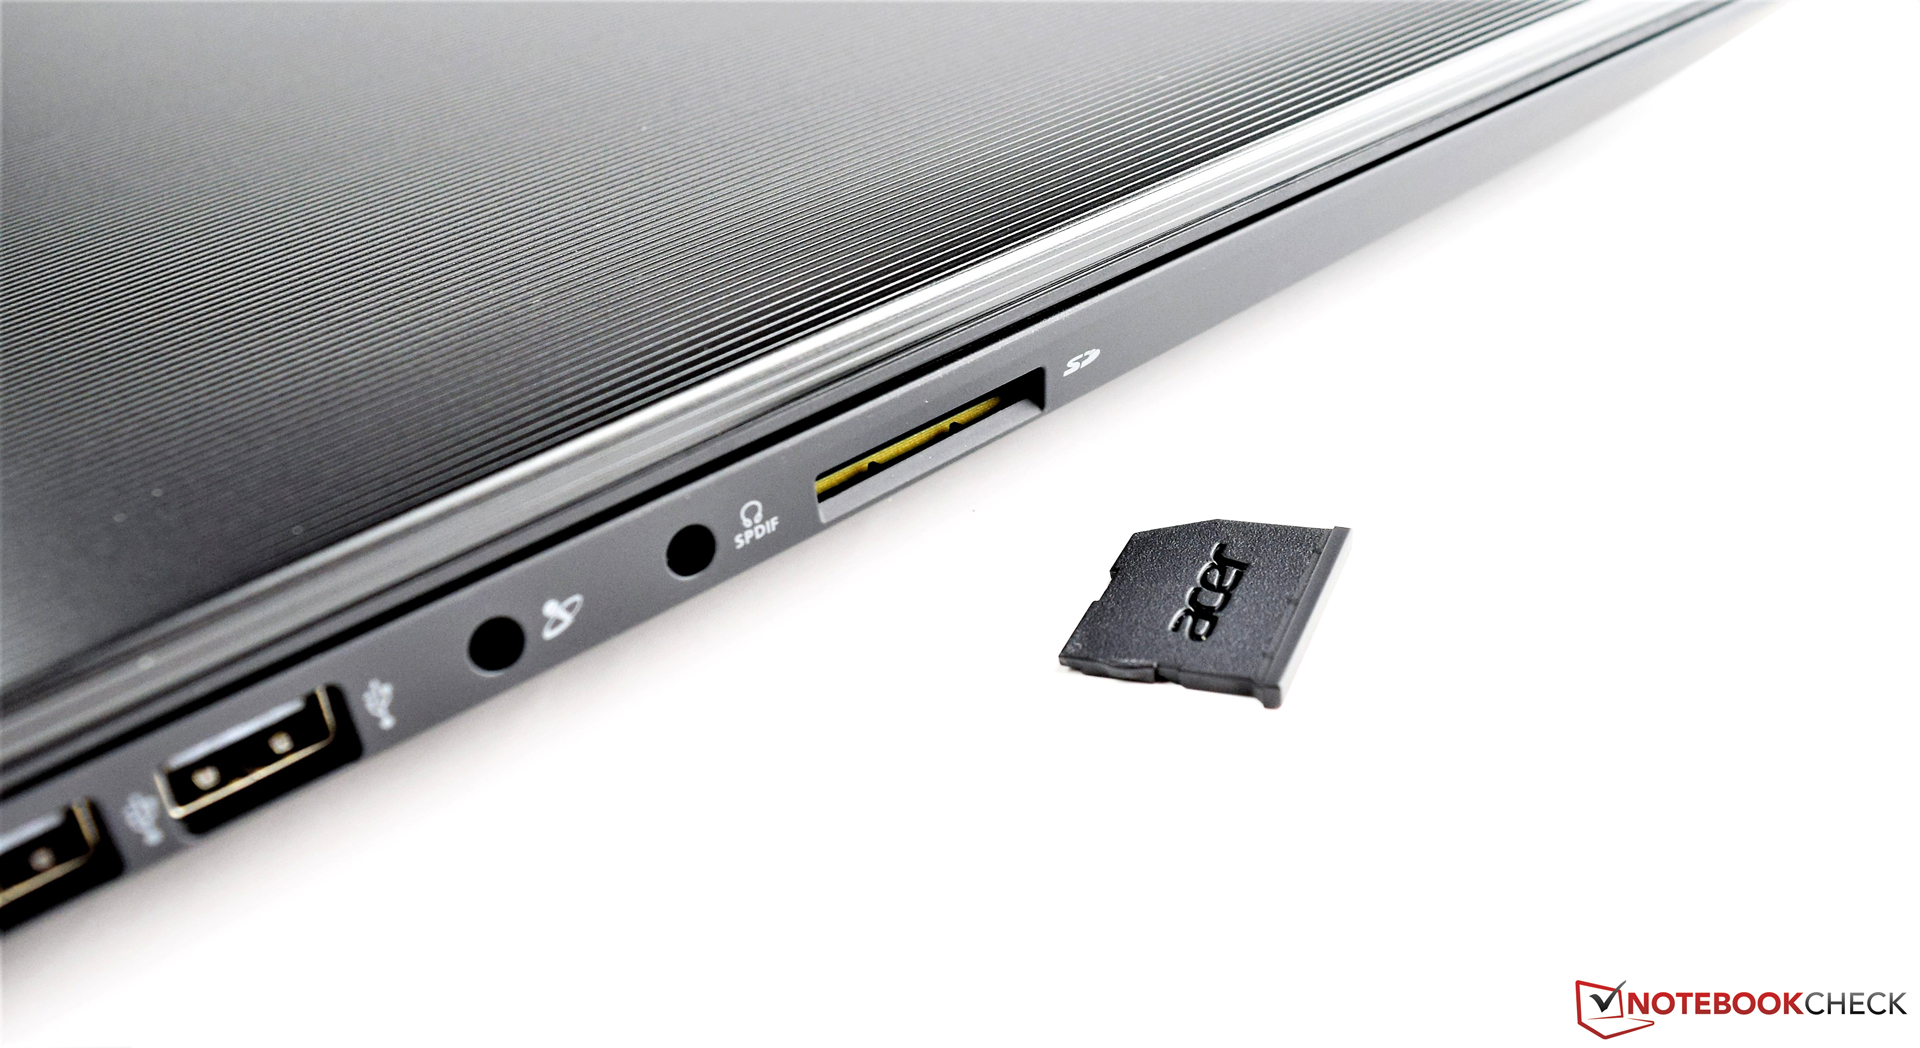
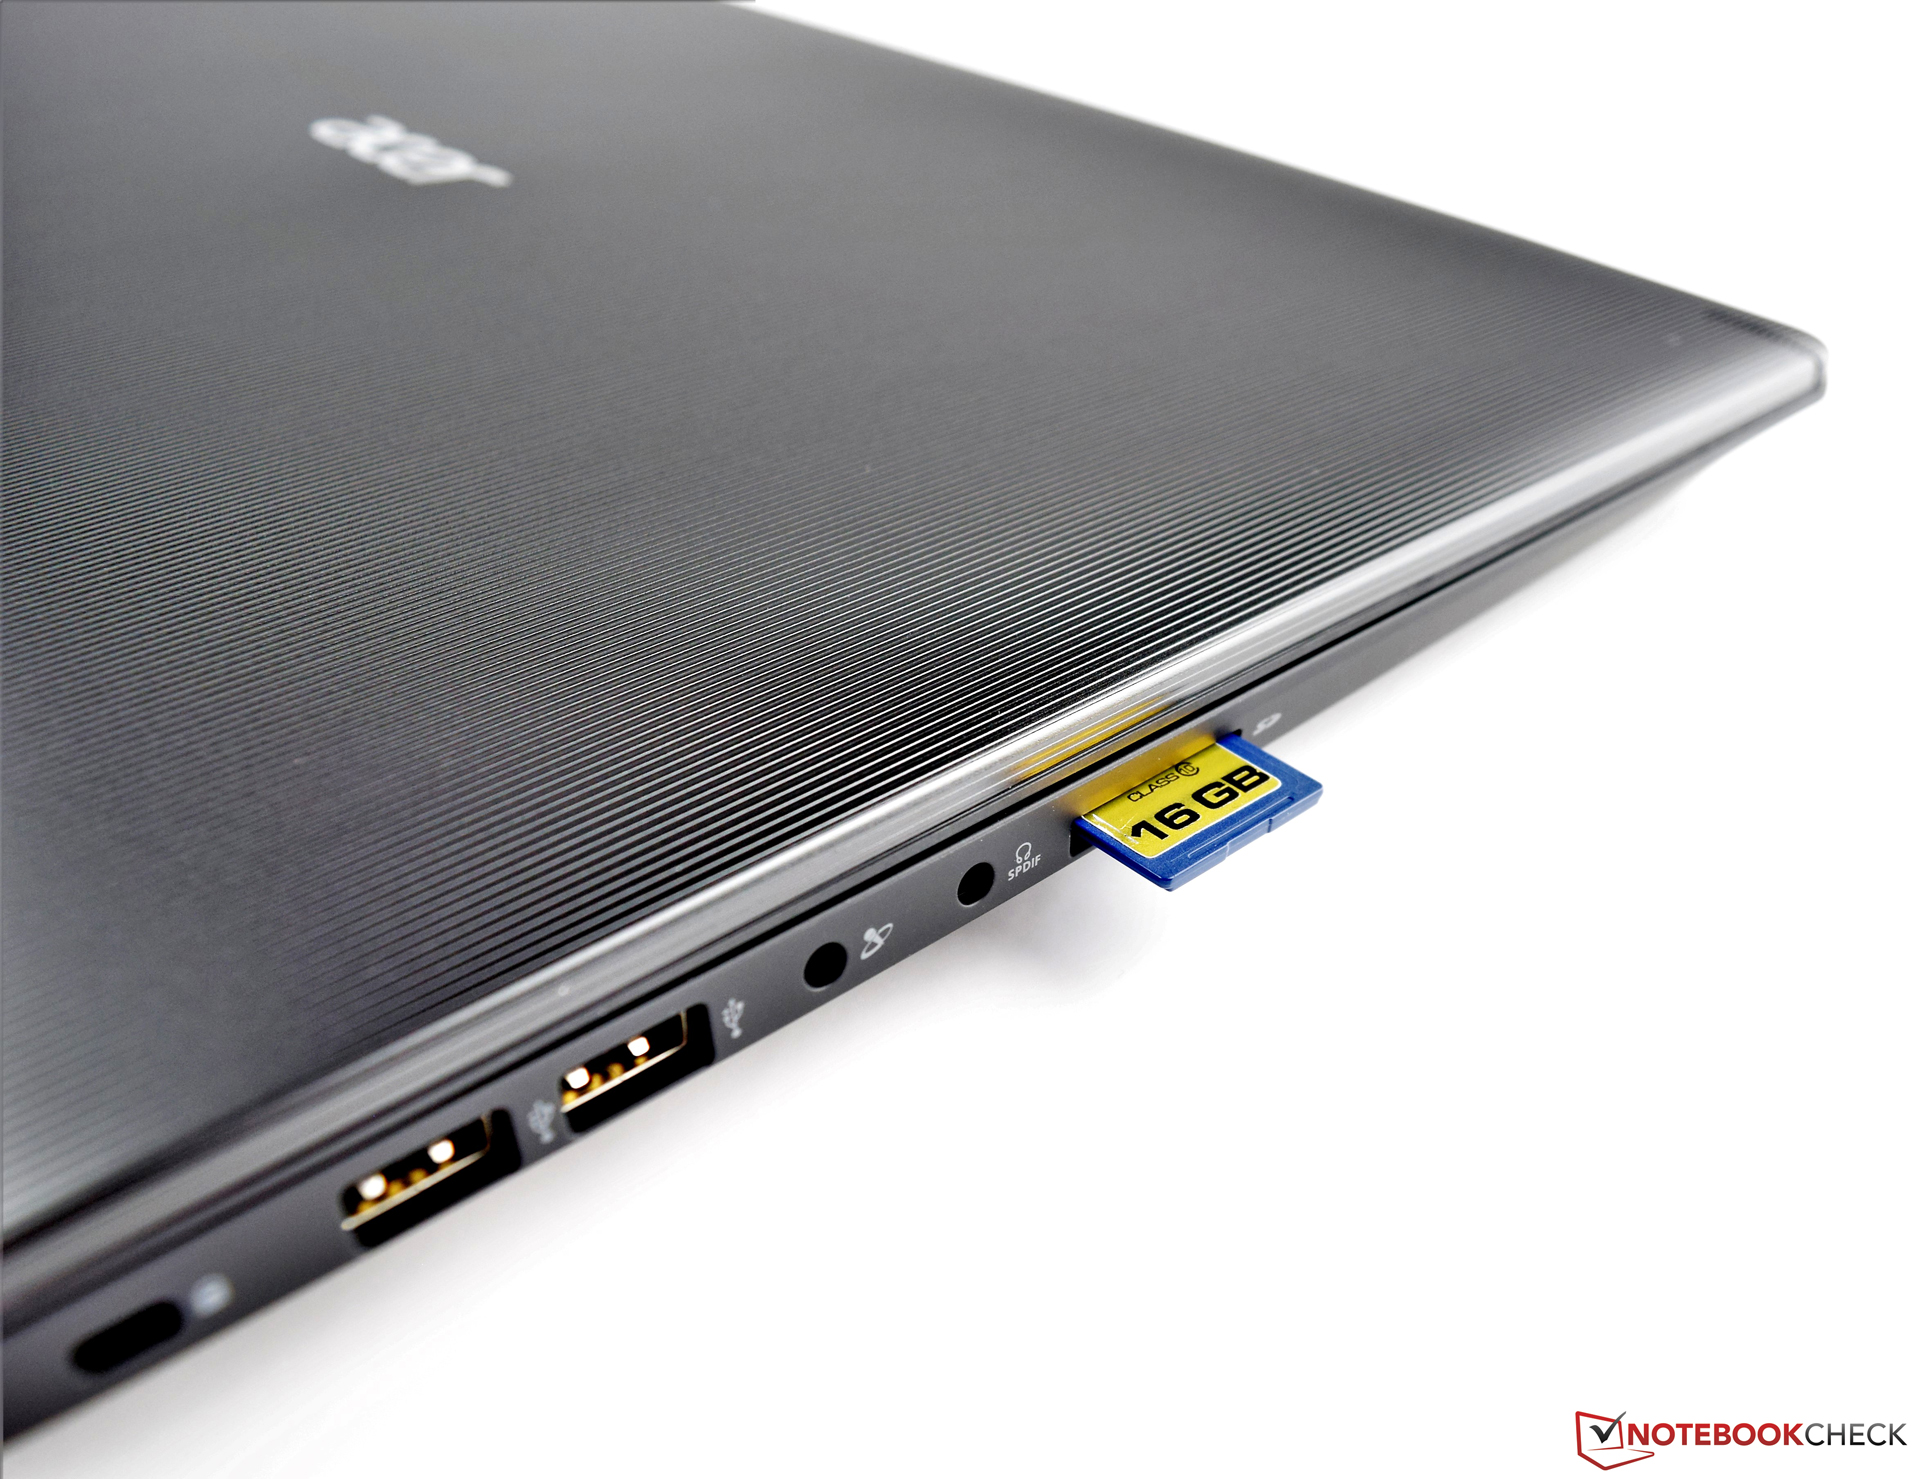
| SD Card Reader | |
| average JPG Copy Test (av. of 3 runs) | |
| MSI GT72VR 7RE-433 | |
| Gigabyte P57X v7 | |
| Asus Strix GL753VD-GC045T | |
| HP Omen 17-w100ng | |
| HP Pavilion 17t-ab200 | |
| Acer Aspire V17 Nitro BE VN7-793G-52XN | |
| maximum AS SSD Seq Read Test (1GB) | |
| MSI GT72VR 7RE-433 | |
| HP Pavilion 17t-ab200 | |
| Gigabyte P57X v7 | |
| HP Omen 17-w100ng | |
| Asus Strix GL753VD-GC045T | |
| Acer Aspire V17 Nitro BE VN7-793G-52XN | |
| |||||||||||||||||||||||||
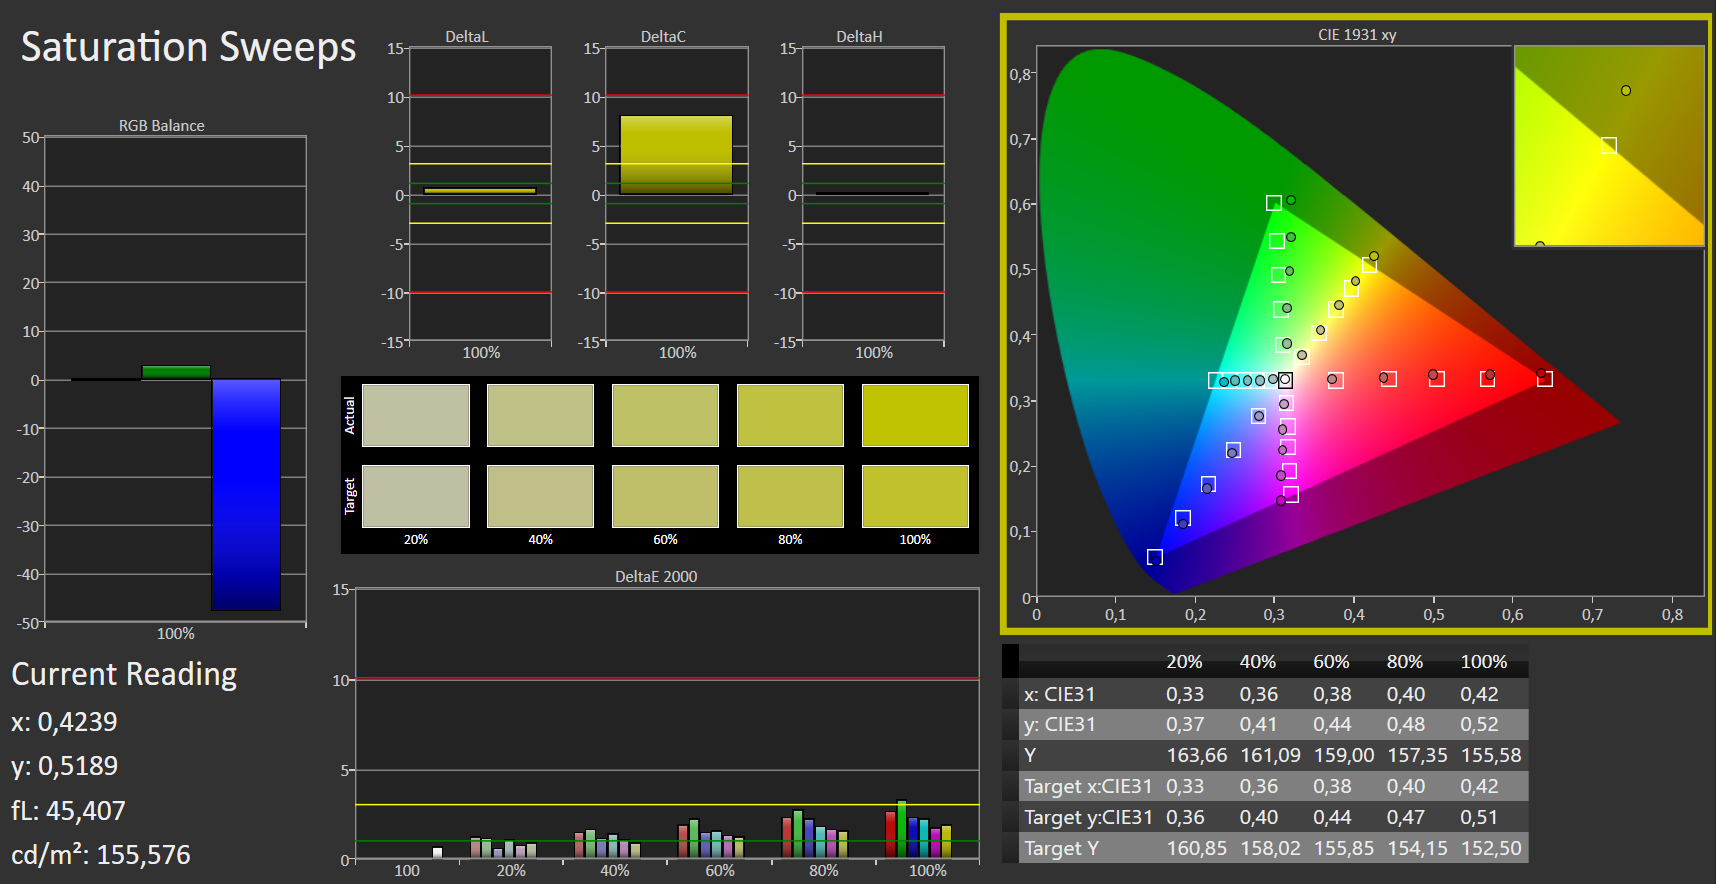
iluminación: 84 %
Brillo con batería: 346 cd/m²
Contraste: 1331:1 (Negro: 0.26 cd/m²)
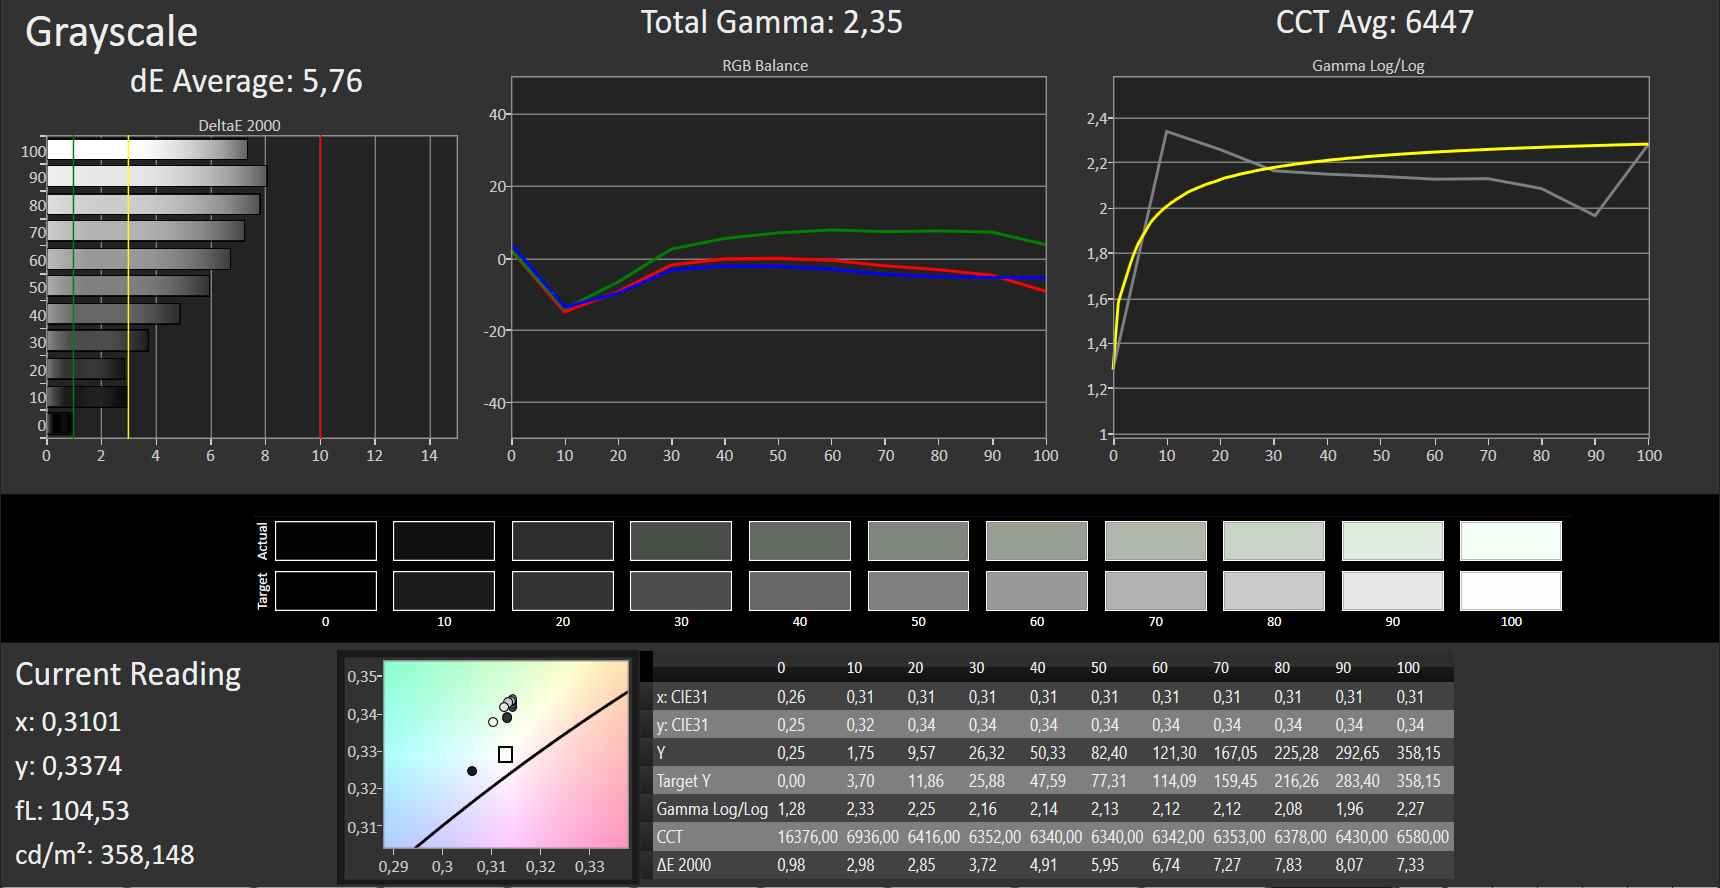
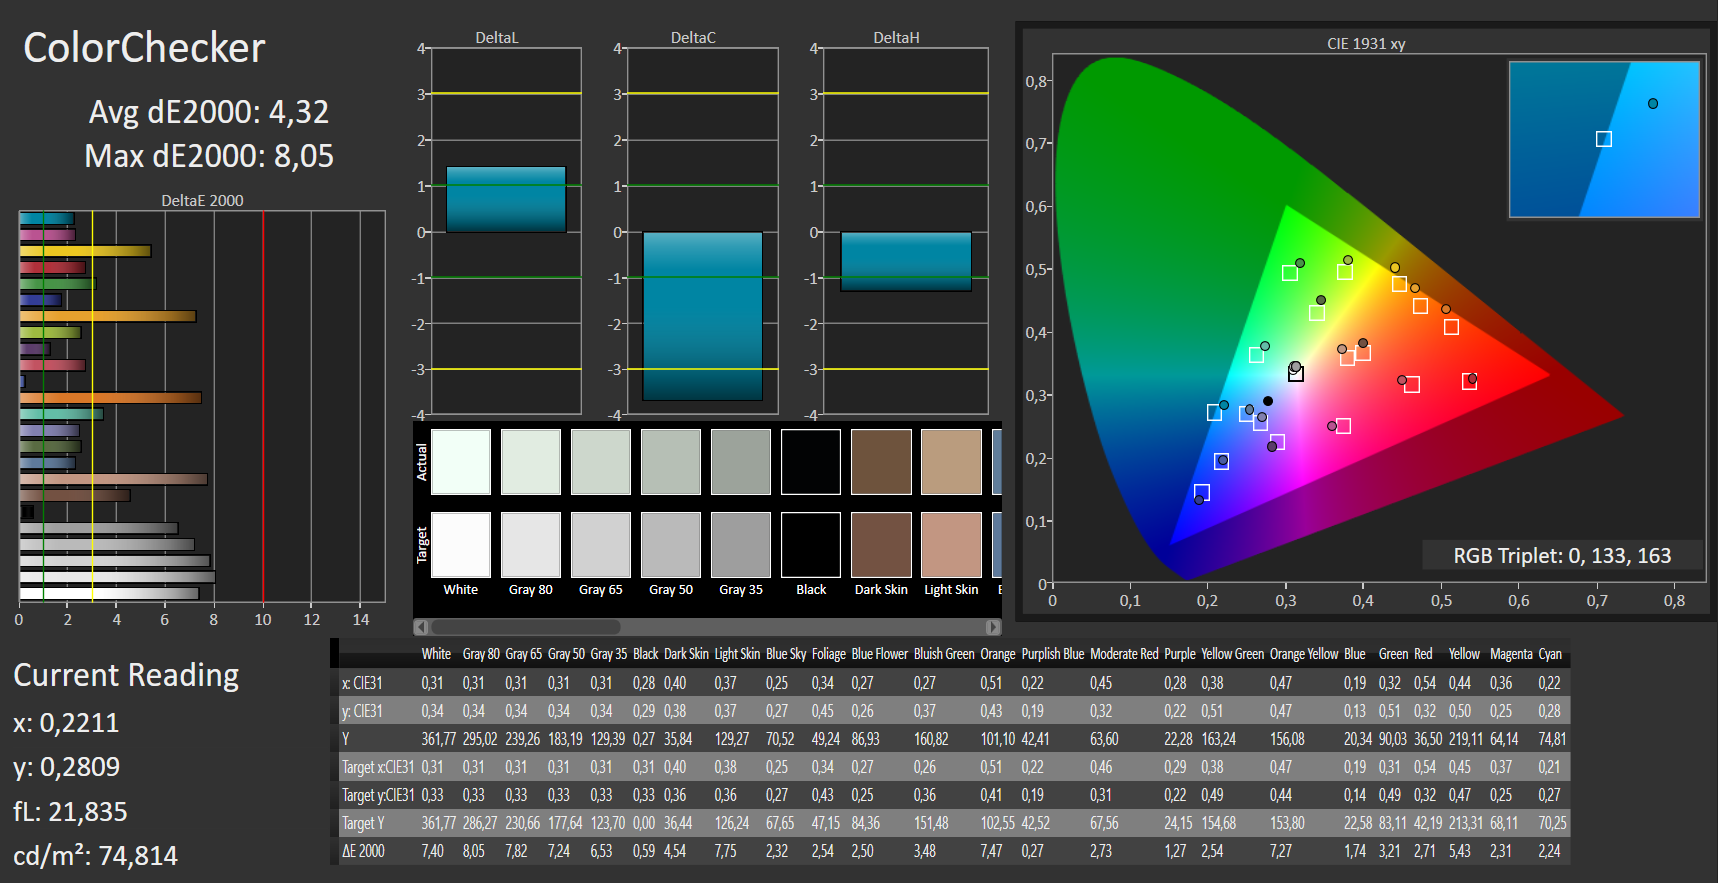
ΔE ColorChecker Calman: 4.32 | ∀{0.5-29.43 Ø4.71}
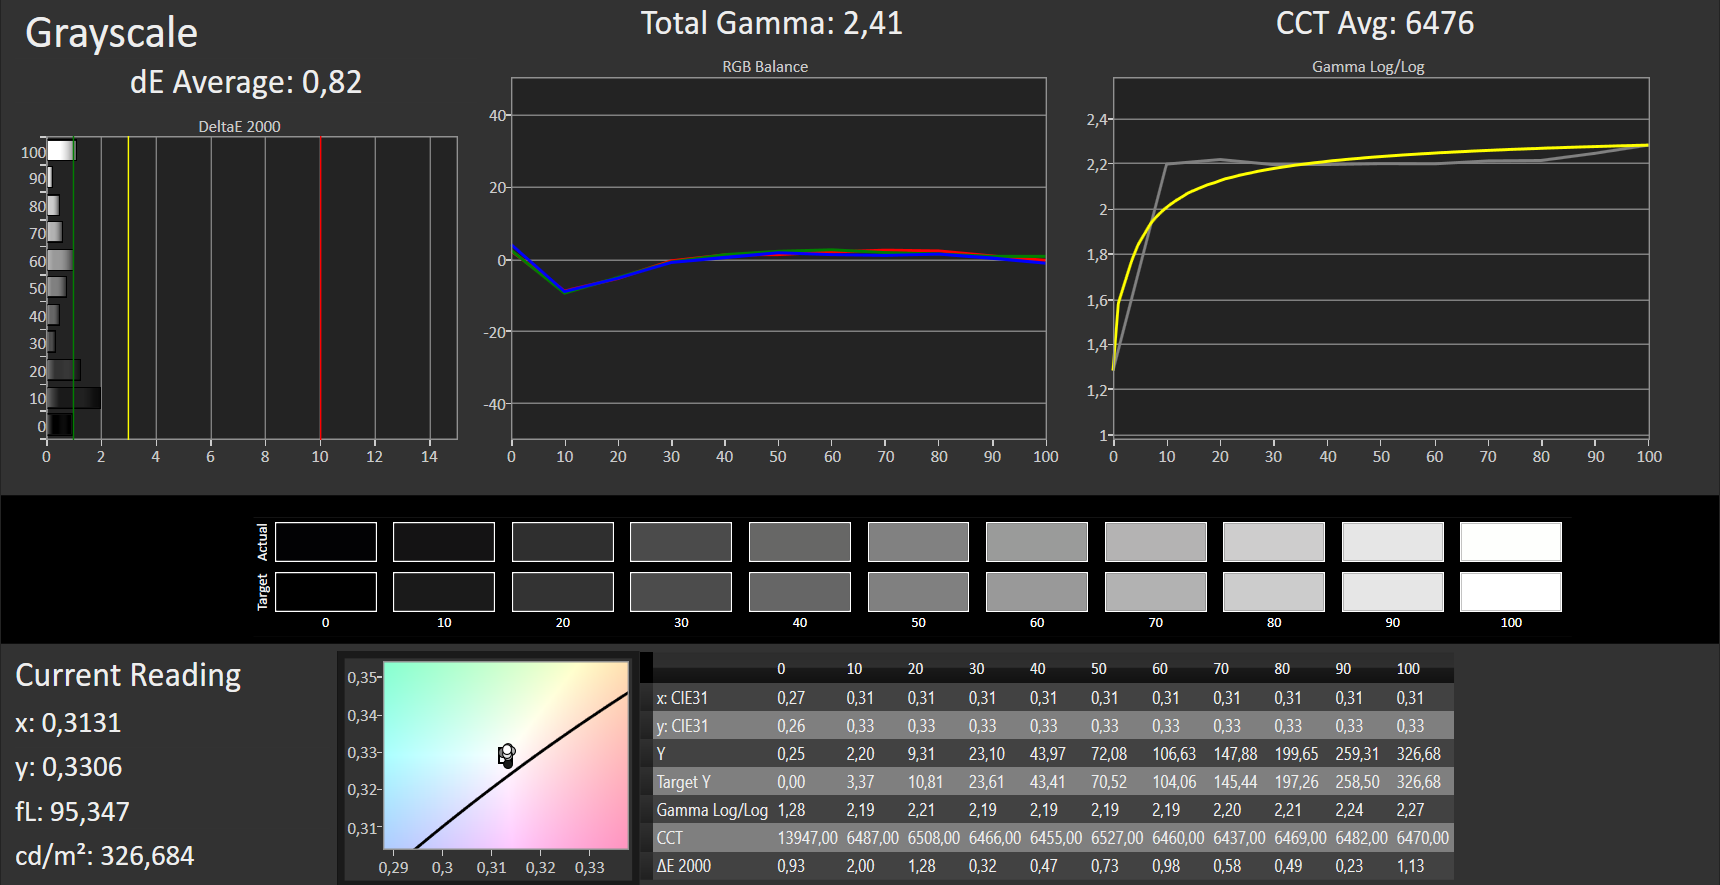
ΔE Greyscale Calman: 5.76 | ∀{0.09-98 Ø4.96}
90% sRGB (Argyll 1.6.3 3D)
59% AdobeRGB 1998 (Argyll 1.6.3 3D)
65.4% AdobeRGB 1998 (Argyll 3D)
90.2% sRGB (Argyll 3D)
64% Display P3 (Argyll 3D)
Gamma: 2.35
CCT: 6447 K
| Acer Aspire V17 Nitro BE VN7-793G-52XN a-Si TFT-LCD, WLED, 1920x1080, 17.3" | Asus Strix GL753VD-GC045T LED IPS, 1920x1080, 17.3" | MSI GT72VR 7RE-433 TN LED, 1920x1080, 17.3" | Gigabyte P57X v7 IPS, 3840x2160, 17.3" | HP Pavilion 17t-ab200 IPS, 1920x1080, 17.3" | HP Omen 17-w100ng IPS, 1920x1080, 17.3" | |
|---|---|---|---|---|---|---|
| Display | -2% | 0% | 33% | -1% | -1% | |
| Display P3 Coverage (%) | 64 | 67.1 5% | 68.3 7% | 87.8 37% | 65.2 2% | 67.2 5% |
| sRGB Coverage (%) | 90.2 | 84.8 -6% | 86.7 -4% | 100 11% | 87.6 -3% | 86.6 -4% |
| AdobeRGB 1998 Coverage (%) | 65.4 | 62 -5% | 63.4 -3% | 98.9 51% | 64.1 -2% | 63.3 -3% |
| Response Times | -2% | 46% | -67% | -5% | 4% | |
| Response Time Grey 50% / Grey 80% * (ms) | 36 ? | 33.2 ? 8% | 29 ? 19% | 55.6 ? -54% | 36.8 -2% | 35 ? 3% |
| Response Time Black / White * (ms) | 26 ? | 28.8 ? -11% | 7 ? 73% | 46.8 ? -80% | 28 -8% | 25 ? 4% |
| PWM Frequency (Hz) | 1000 ? | |||||
| Screen | -17% | -29% | 1% | -17% | -2% | |
| Brightness middle (cd/m²) | 346 | 349 1% | 299 -14% | 441.3 28% | 278.8 -19% | 342 -1% |
| Brightness (cd/m²) | 307 | 337 10% | 277 -10% | 408 33% | 265 -14% | 331 8% |
| Brightness Distribution (%) | 84 | 91 8% | 87 4% | 86 2% | 91 8% | 84 0% |
| Black Level * (cd/m²) | 0.26 | 0.58 -123% | 0.27 -4% | 0.44 -69% | 0.28 -8% | 0.32 -23% |
| Contrast (:1) | 1331 | 602 -55% | 1107 -17% | 1003 -25% | 996 -25% | 1069 -20% |
| Colorchecker dE 2000 * | 4.32 | 4.5 -4% | 9.65 -123% | 5.1 -18% | 5.8 -34% | 4.35 -1% |
| Colorchecker dE 2000 max. * | 8.05 | 10.2 -27% | 15.43 -92% | 9.8 -22% | 10.6 -32% | 9.24 -15% |
| Greyscale dE 2000 * | 5.76 | 3.3 43% | 9.68 -68% | 4.3 25% | 8.3 -44% | 3.73 35% |
| Gamma | 2.35 94% | 2.15 102% | 1.89 116% | 2.08 106% | 2.1 105% | 2.23 99% |
| CCT | 6447 101% | 6103 107% | 11652 56% | 7345 88% | 5723 114% | 6801 96% |
| Color Space (Percent of AdobeRGB 1998) (%) | 59 | 55.7 -6% | 75 27% | 87 47% | 57 -3% | 57 -3% |
| Color Space (Percent of sRGB) (%) | 90 | 75.7 -16% | 100 11% | 100 11% | 87 -3% | 86 -4% |
| Media total (Programa/Opciones) | -7% /
-12% | 6% /
-13% | -11% /
-2% | -8% /
-12% | 0% /
-1% |
* ... más pequeño es mejor
Tiempos de respuesta del display
| ↔ Tiempo de respuesta de Negro a Blanco | ||
|---|---|---|
| 26 ms ... subida ↗ y bajada ↘ combinada | ↗ 15 ms subida | 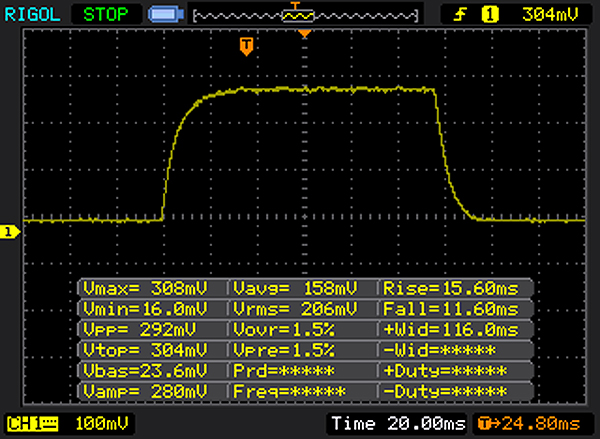 |
| ↘ 11 ms bajada | ||
| La pantalla mostró tiempos de respuesta relativamente lentos en nuestros tests pero podría ser demasiado lenta para los jugones. En comparación, todos los dispositivos de prueba van de ##min### (mínimo) a 240 (máximo) ms. » 63 % de todos los dispositivos son mejores. Eso quiere decir que el tiempo de respuesta es peor que la media (19.8 ms) de todos los dispositivos testados. | ||
| ↔ Tiempo de respuesta 50% Gris a 80% Gris | ||
| 36 ms ... subida ↗ y bajada ↘ combinada | ↗ 20 ms subida | 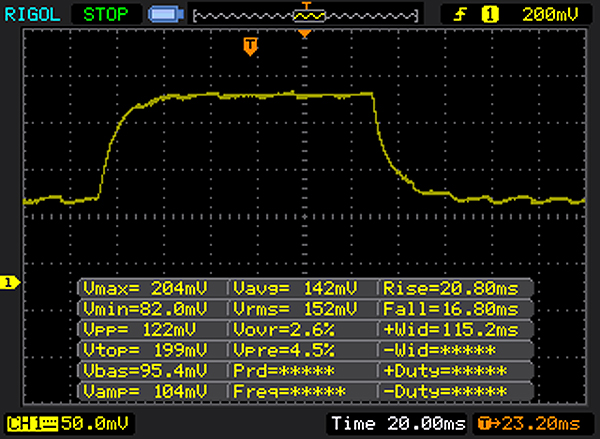 |
| ↘ 16 ms bajada | ||
| La pantalla mostró tiempos de respuesta lentos en nuestros tests y podría ser demasiado lenta para los jugones. En comparación, todos los dispositivos de prueba van de ##min### (mínimo) a 636 (máximo) ms. » 51 % de todos los dispositivos son mejores. Eso quiere decir que el tiempo de respuesta es peor que la media (31 ms) de todos los dispositivos testados. | ||
Parpadeo de Pantalla / PWM (Pulse-Width Modulation)
| Parpadeo de Pantalla / PWM no detectado | ||
Comparación: 52 % de todos los dispositivos testados no usaron PWM para atenuar el display. Si se usó, medimos una media de 7754 (mínimo: 5 - máxmo: 343500) Hz. | ||
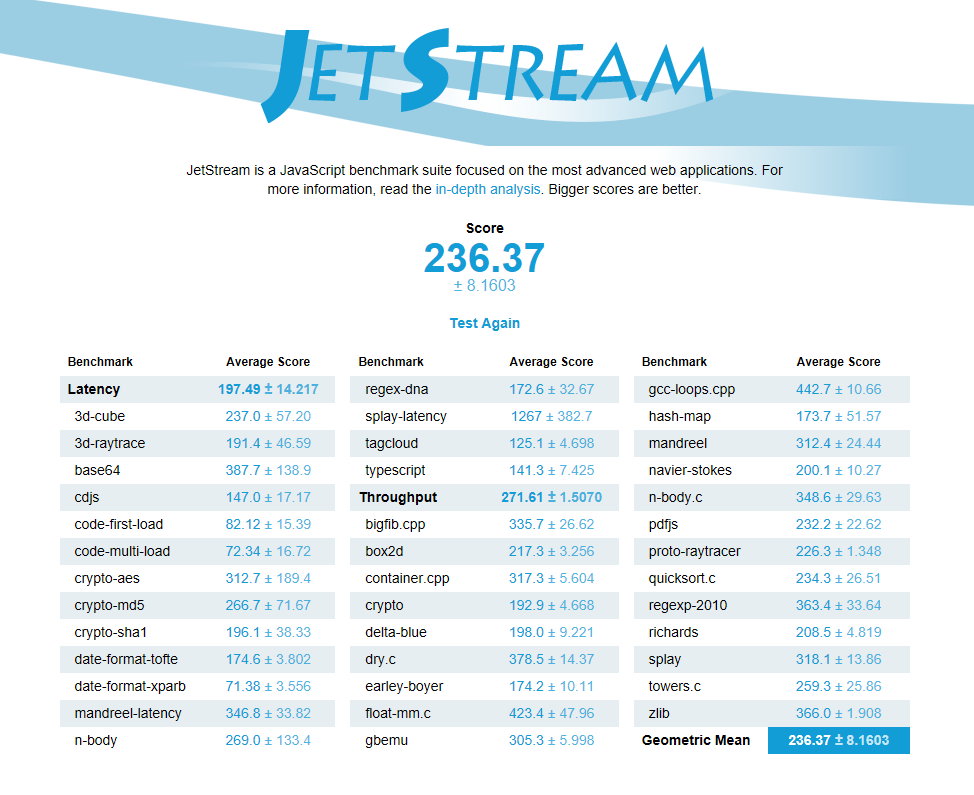
| JetStream 1.1 - 1.1 Total | |
| HP Pavilion 17t-ab200 | |
| MSI GT72VR 7RE-433 | |
| Acer Aspire V17 Nitro BE VN7-793G-52XN | |
| HP Omen 17-w100ng | |
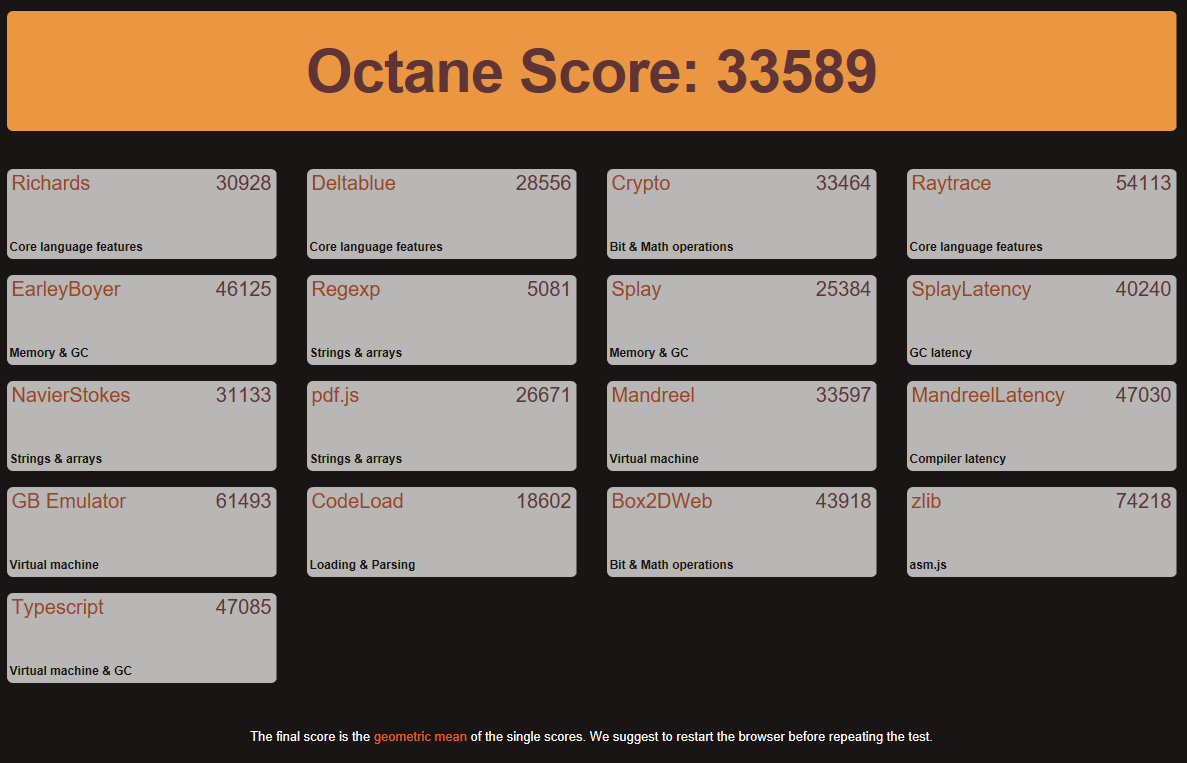
| Octane V2 - Total Score | |
| HP Pavilion 17t-ab200 | |
| MSI GT72VR 7RE-433 | |
| Acer Aspire V17 Nitro BE VN7-793G-52XN | |
| HP Omen 17-w100ng | |
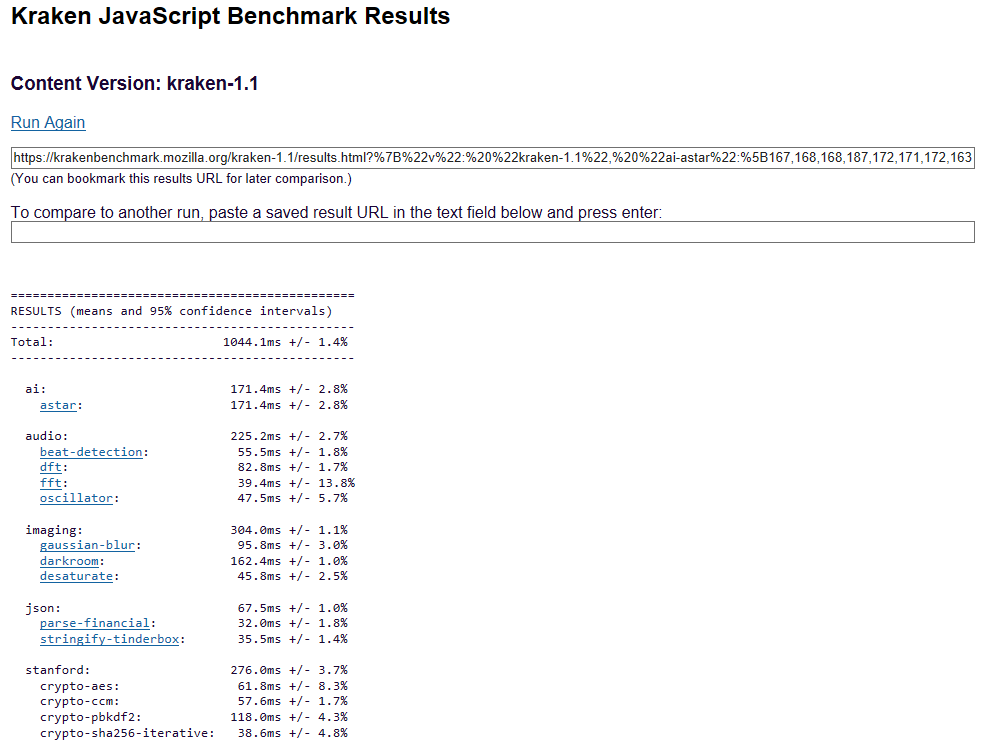
| Mozilla Kraken 1.1 - Total | |
| HP Omen 17-w100ng | |
| Acer Aspire V17 Nitro BE VN7-793G-52XN | |
| MSI GT72VR 7RE-433 | |
| HP Pavilion 17t-ab200 | |
* ... más pequeño es mejor
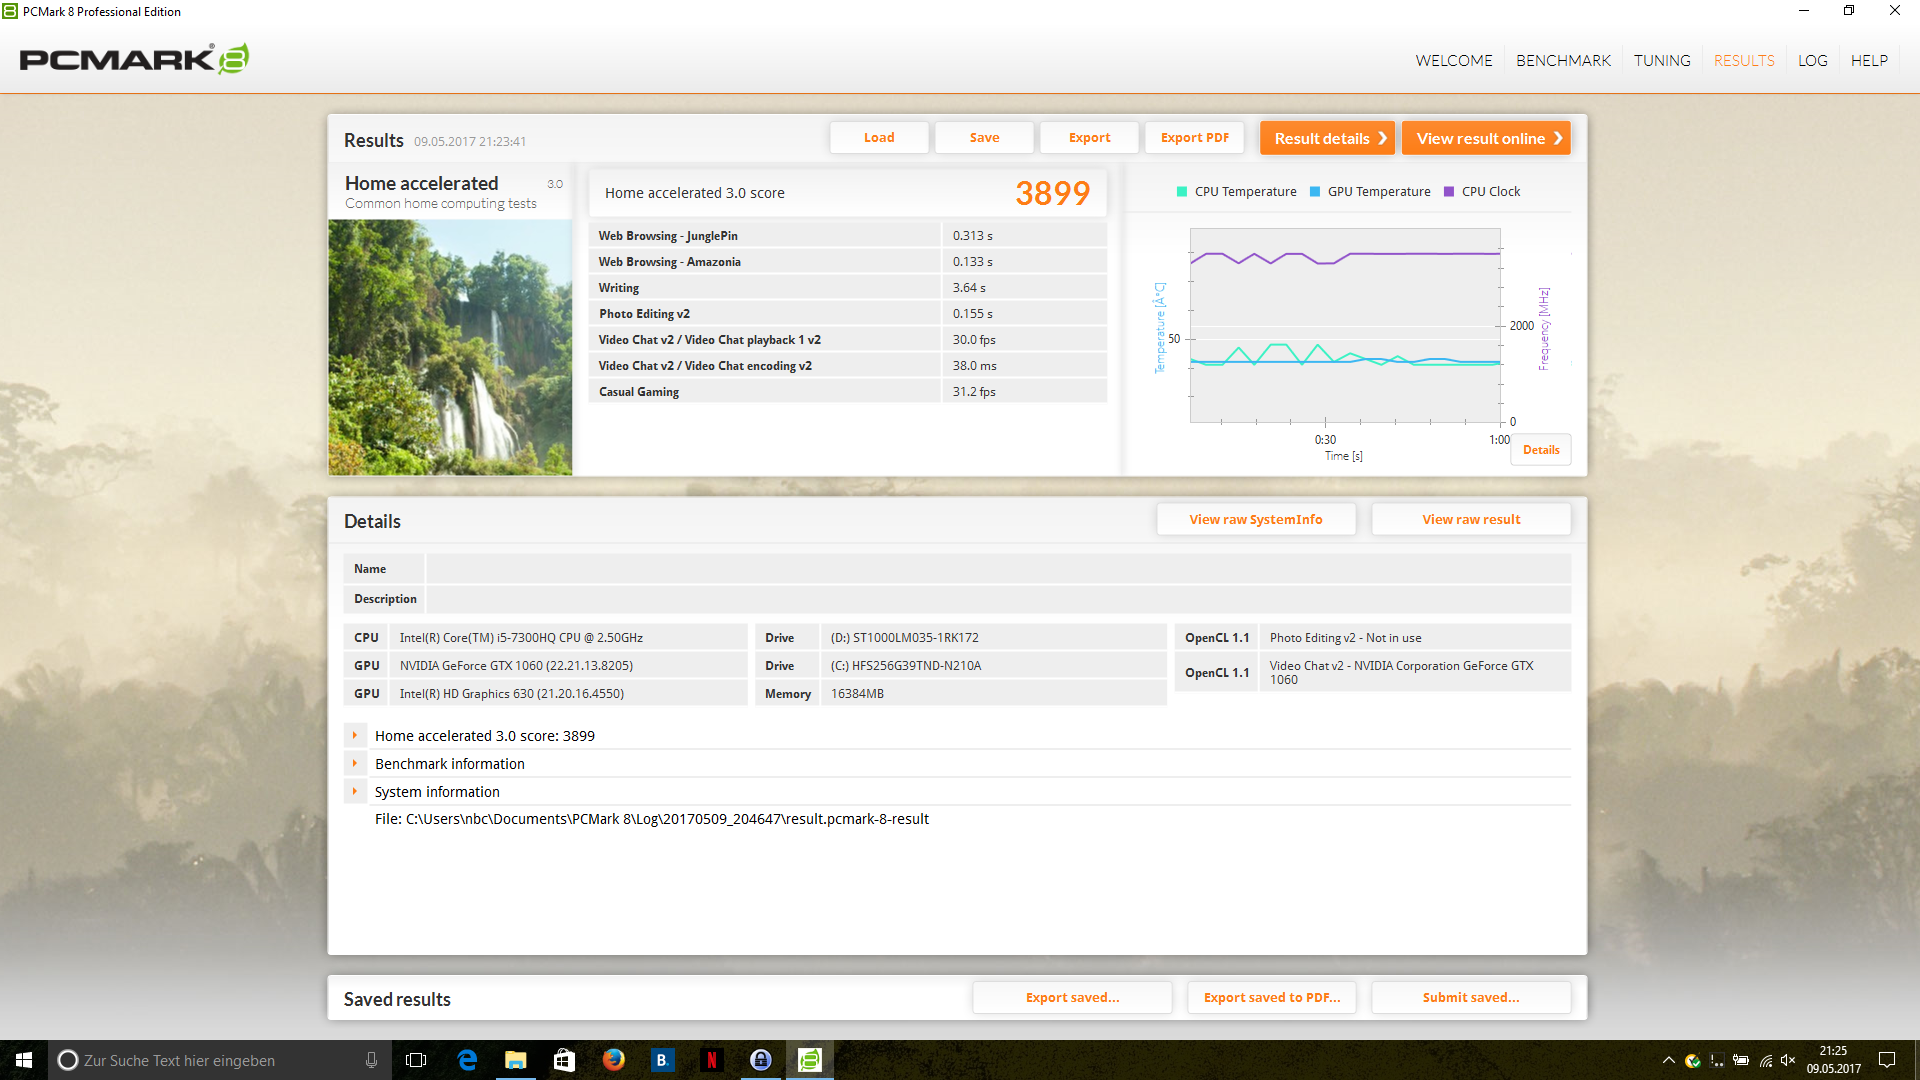
| PCMark 8 | |
| Home Score Accelerated v2 | |
| MSI GT72VR 7RE-433 | |
| HP Omen 17-w100ng | |
| HP Pavilion 17t-ab200 | |
| Asus Strix GL753VD-GC045T | |
| Acer Aspire V17 Nitro BE VN7-793G-52XN | |
| Gigabyte P57X v7 | |
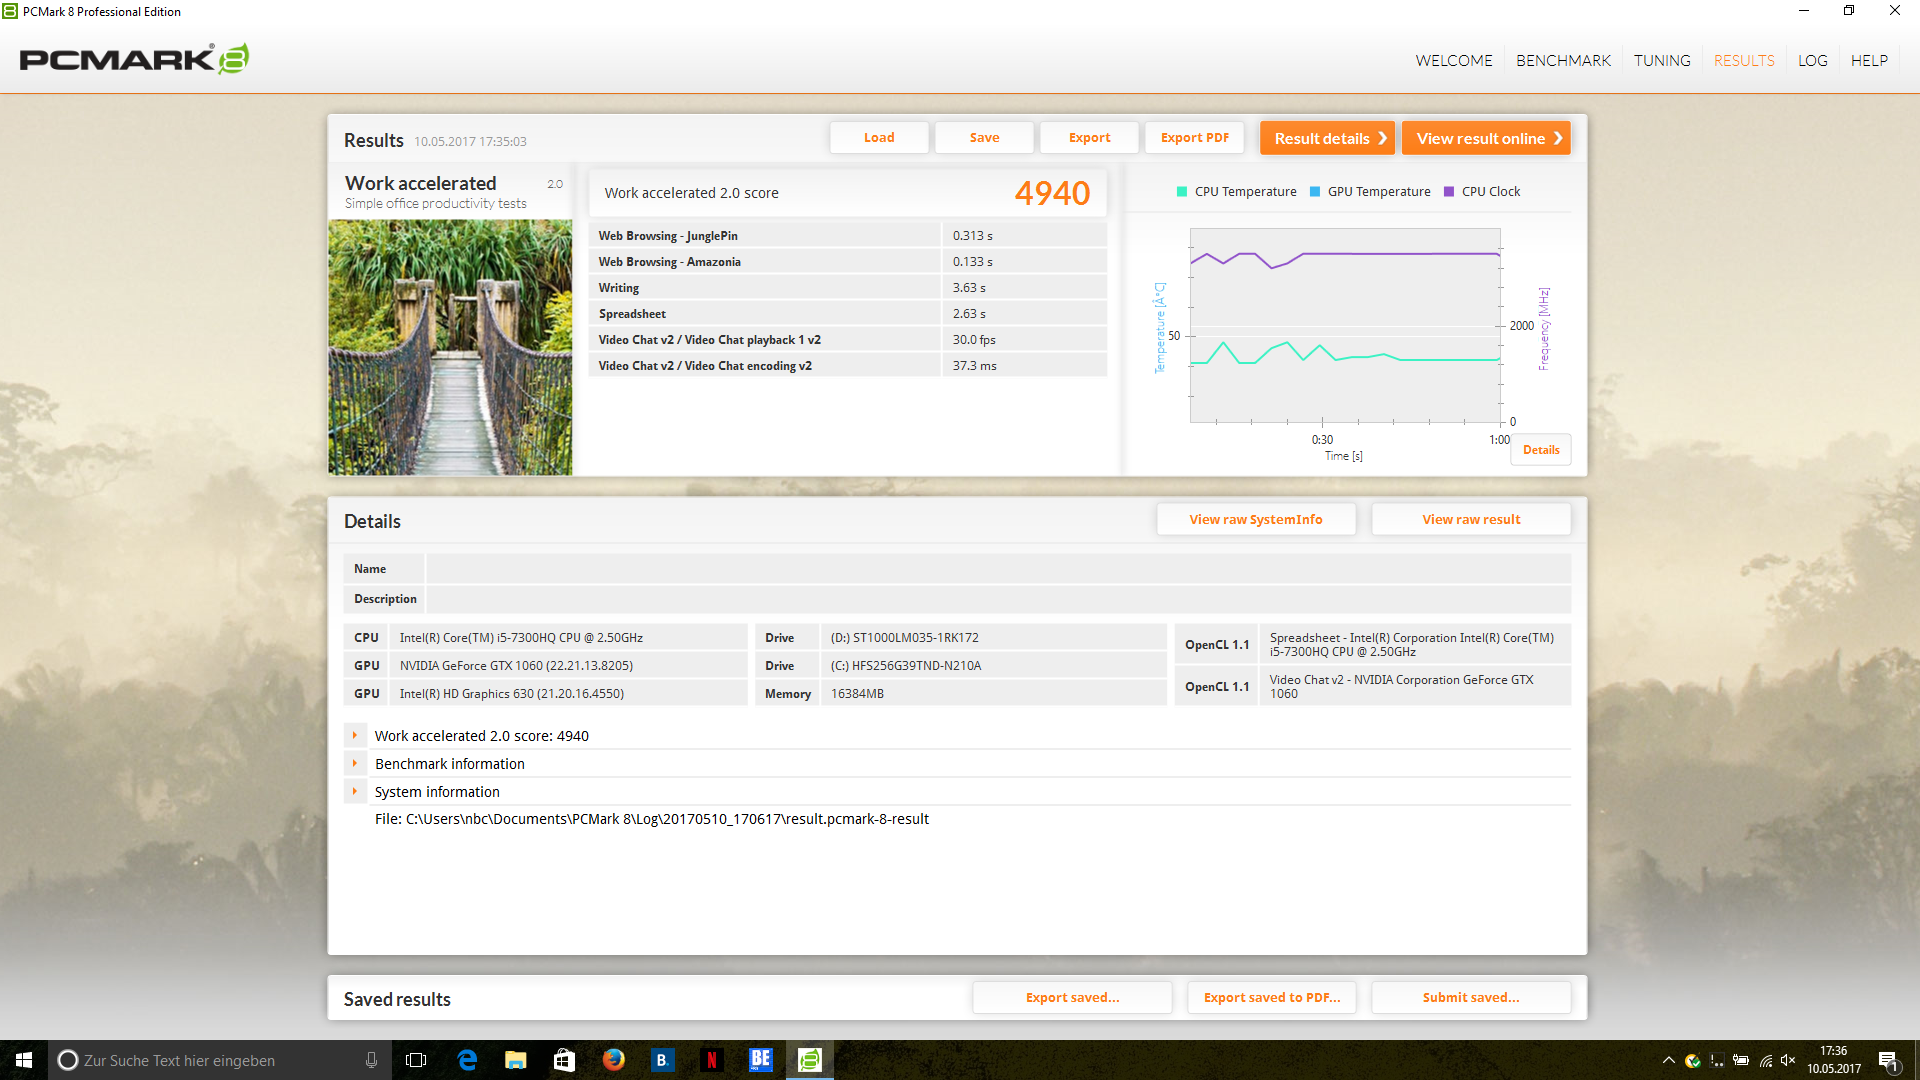
| Work Score Accelerated v2 | |
| MSI GT72VR 7RE-433 | |
| HP Omen 17-w100ng | |
| HP Pavilion 17t-ab200 | |
| Acer Aspire V17 Nitro BE VN7-793G-52XN | |
| Gigabyte P57X v7 | |
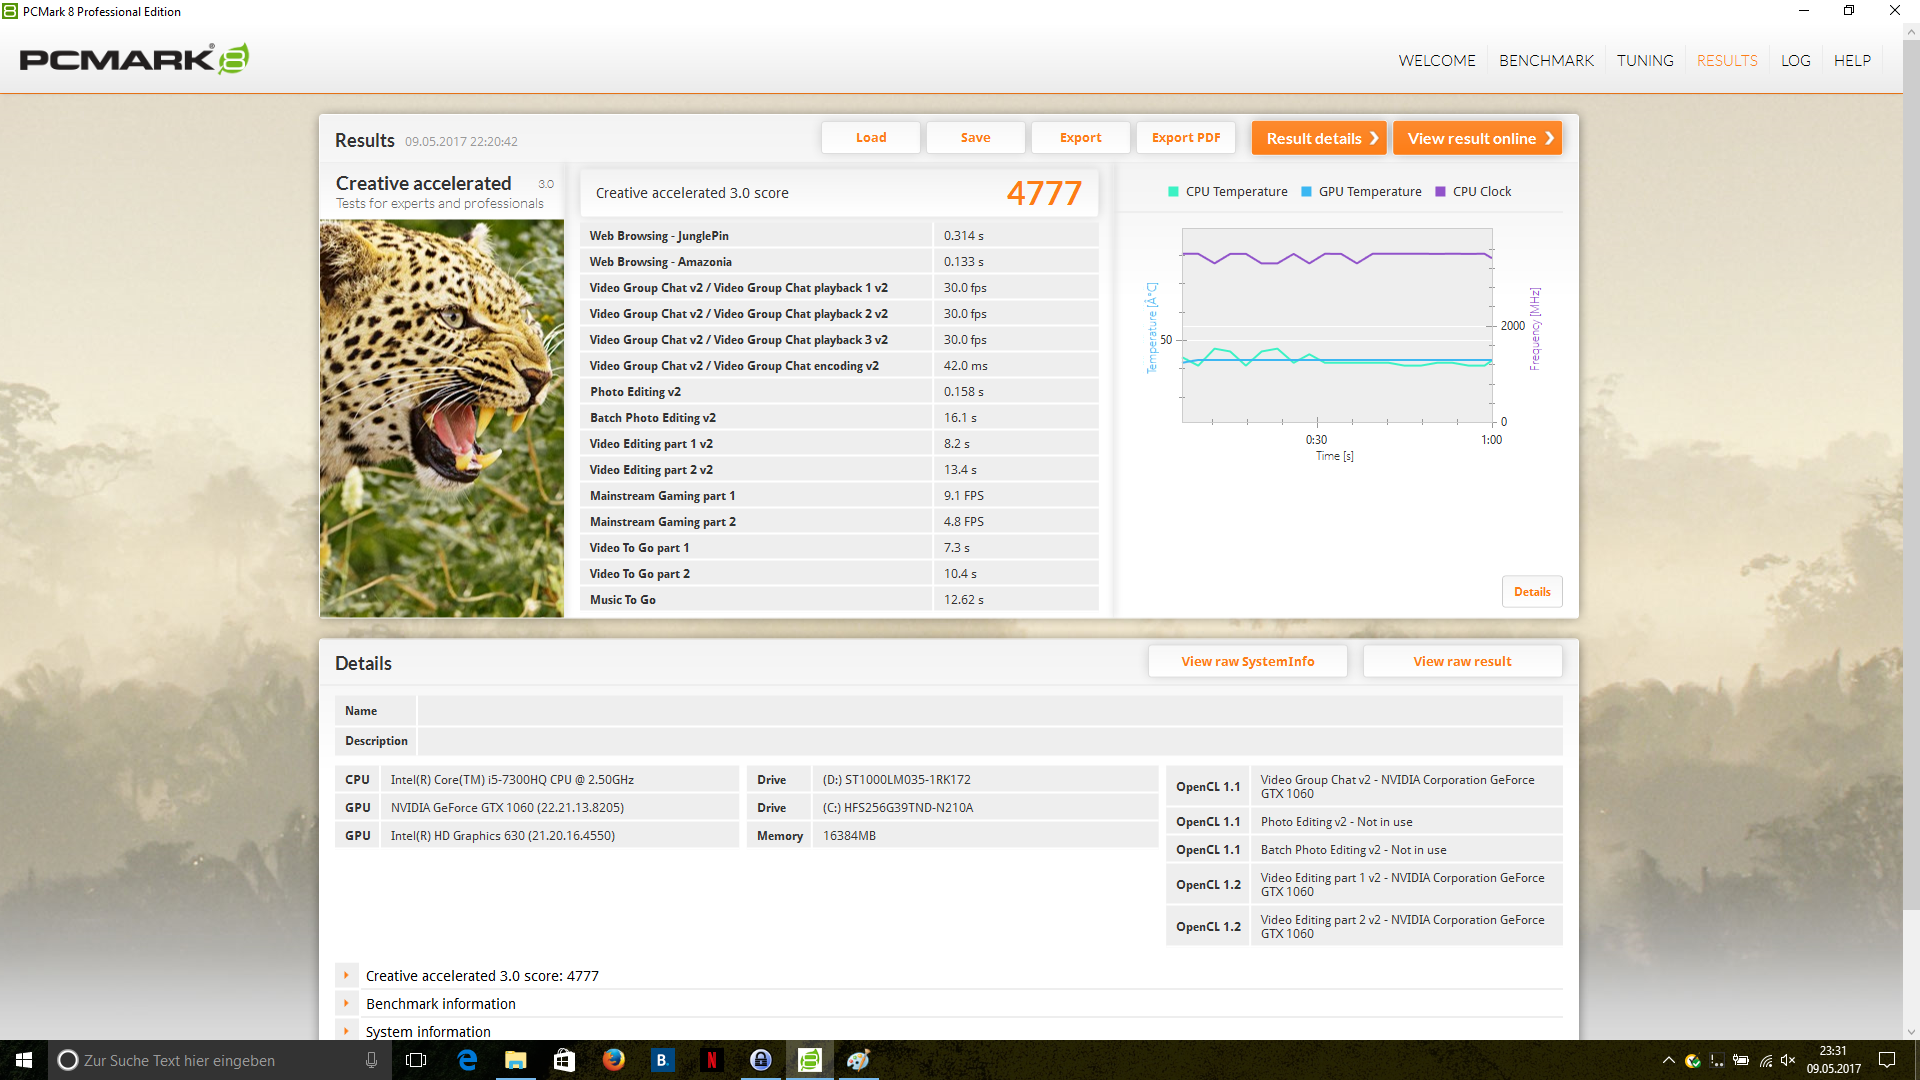
| Creative Score Accelerated v2 | |
| MSI GT72VR 7RE-433 | |
| HP Omen 17-w100ng | |
| HP Pavilion 17t-ab200 | |
| Gigabyte P57X v7 | |
| Acer Aspire V17 Nitro BE VN7-793G-52XN | |
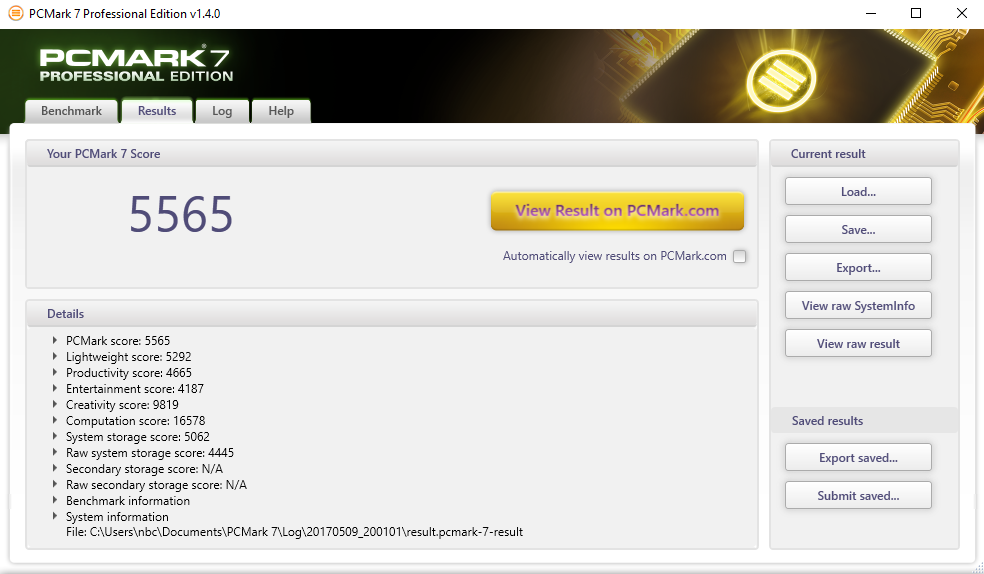
| PCMark 7 | |
| Productivity | |
| MSI GT72VR 7RE-433 | |
| Acer Aspire V17 Nitro BE VN7-793G-52XN | |
| HP Omen 17-w100ng | |
| Score | |
| MSI GT72VR 7RE-433 | |
| HP Omen 17-w100ng | |
| Acer Aspire V17 Nitro BE VN7-793G-52XN | |
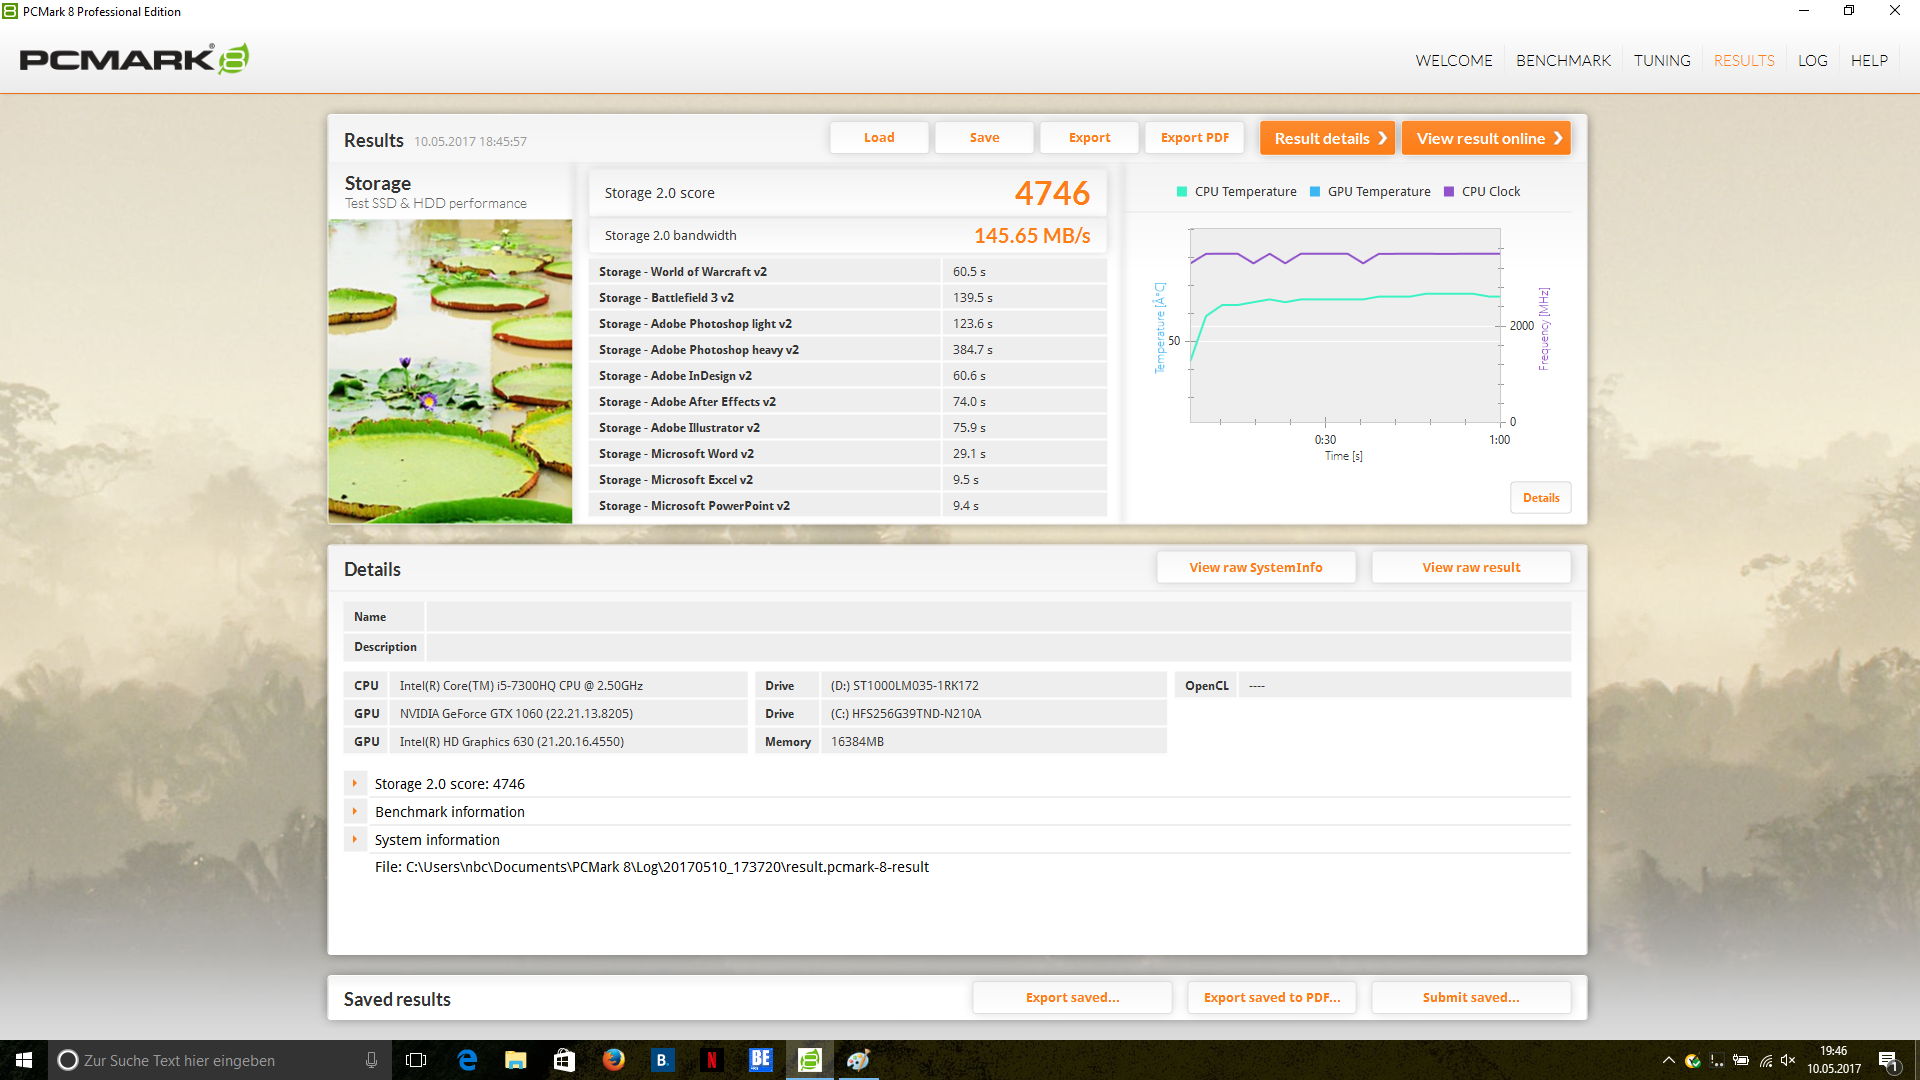
| PCMark 7 Score | 5565 puntos | |
| PCMark 8 Home Score Accelerated v2 | 3899 puntos | |
| PCMark 8 Creative Score Accelerated v2 | 4777 puntos | |
| PCMark 8 Work Score Accelerated v2 | 4940 puntos | |
ayuda | ||
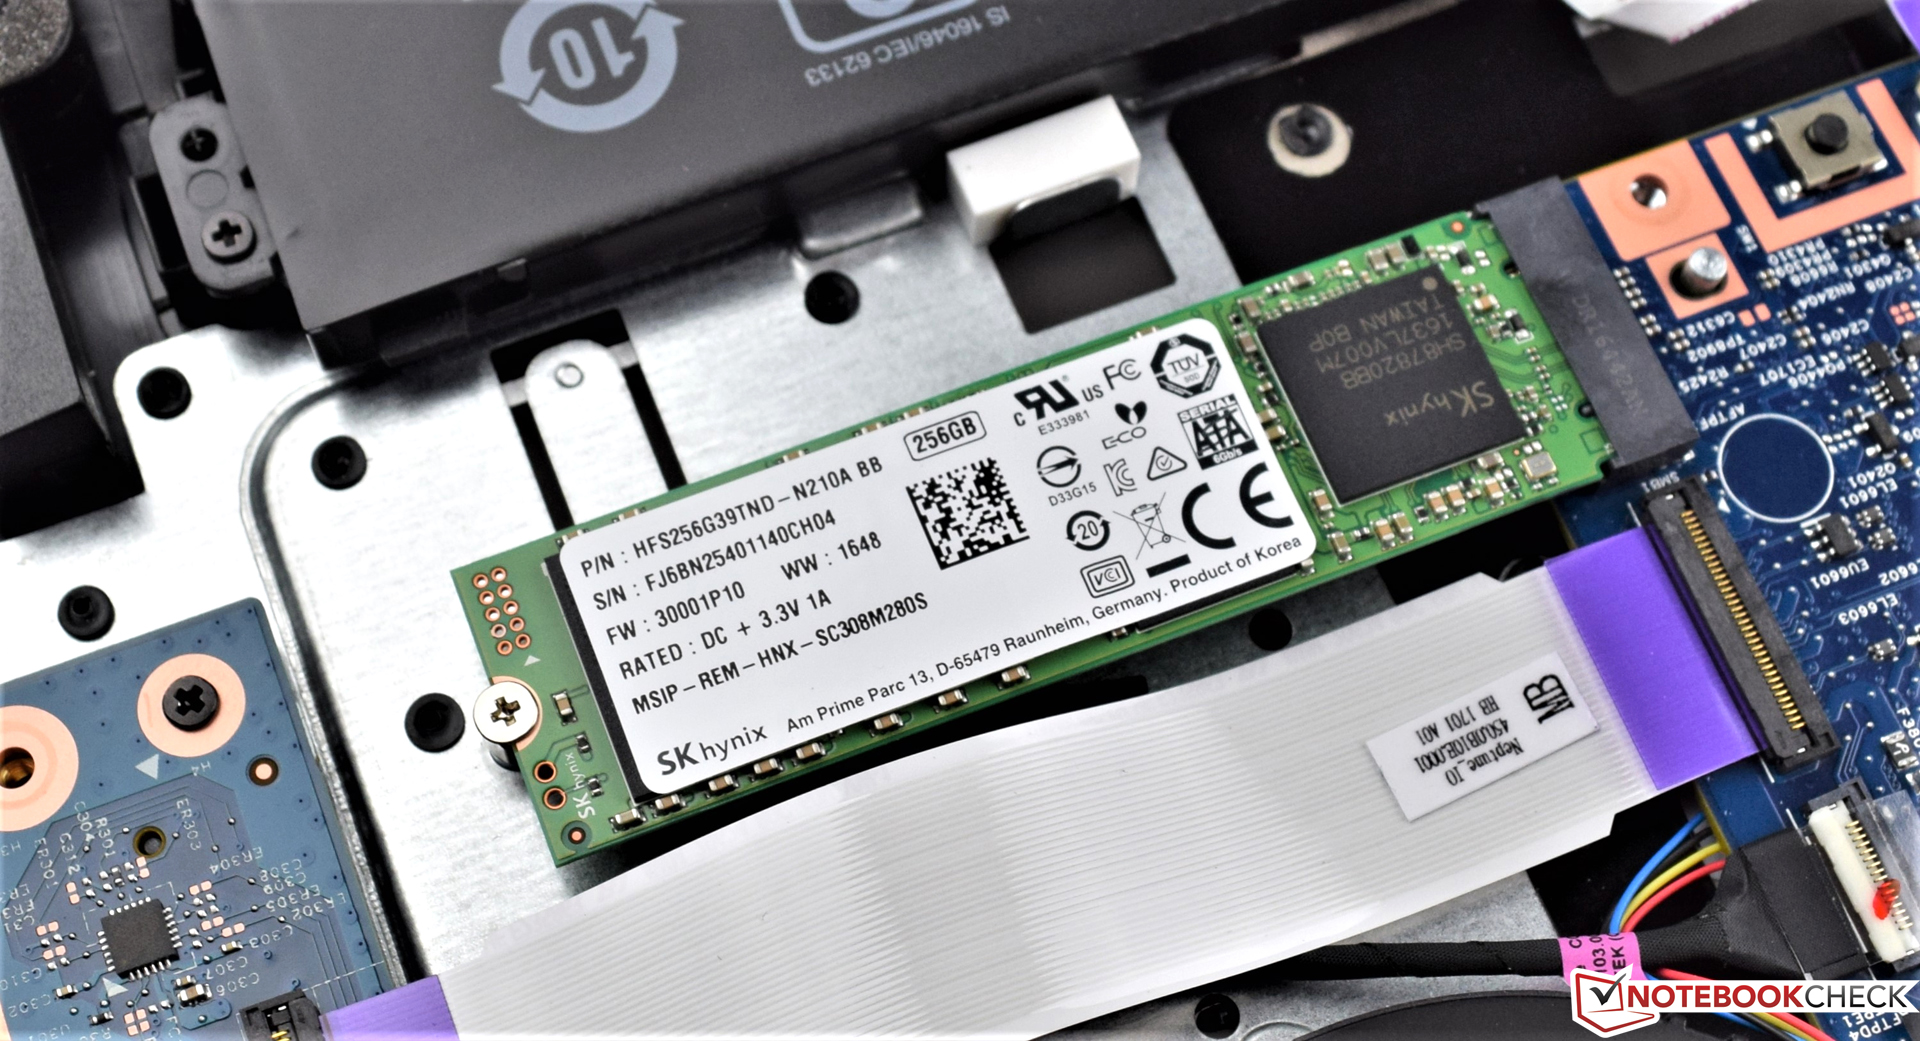
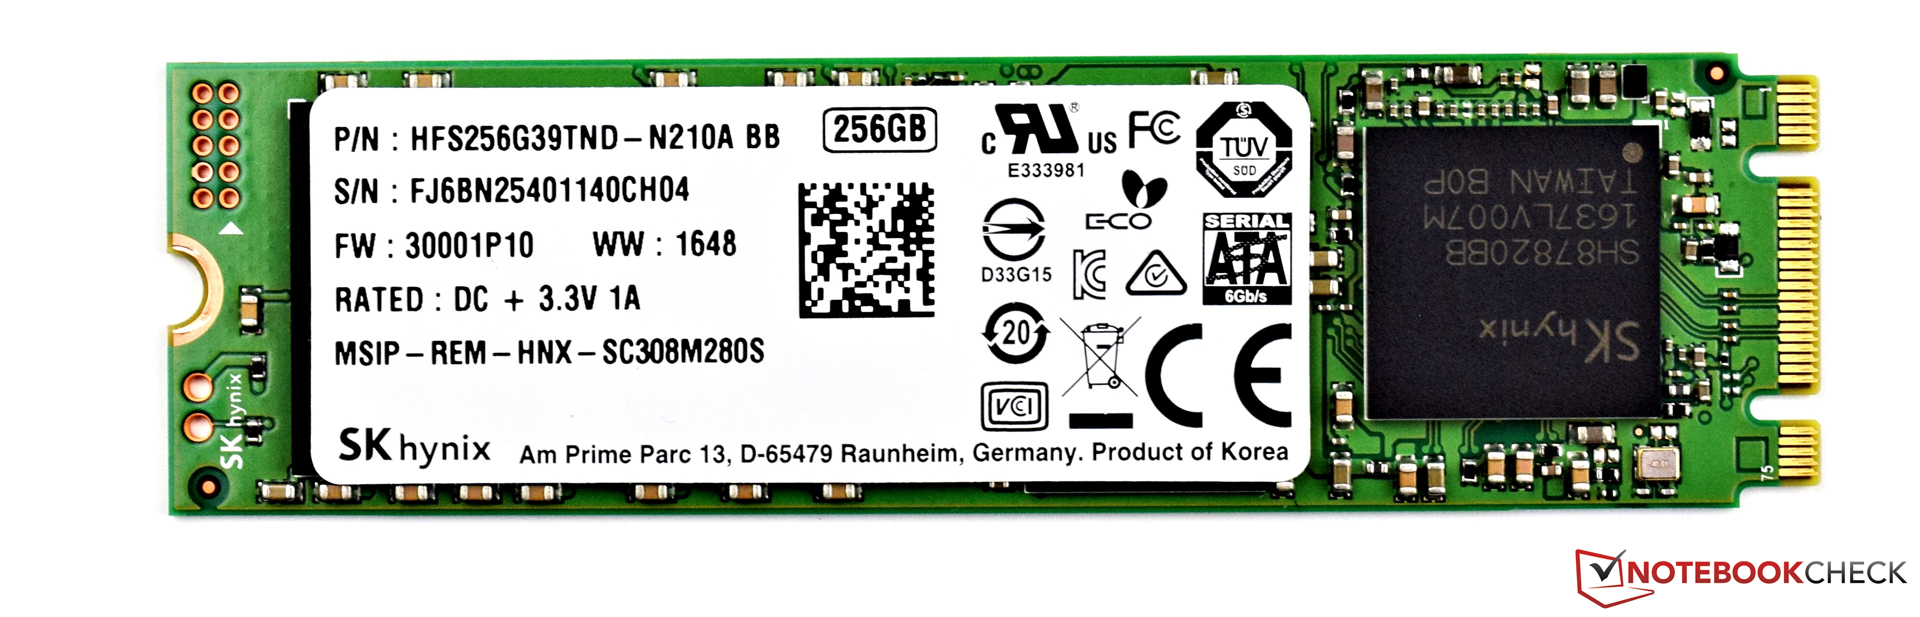
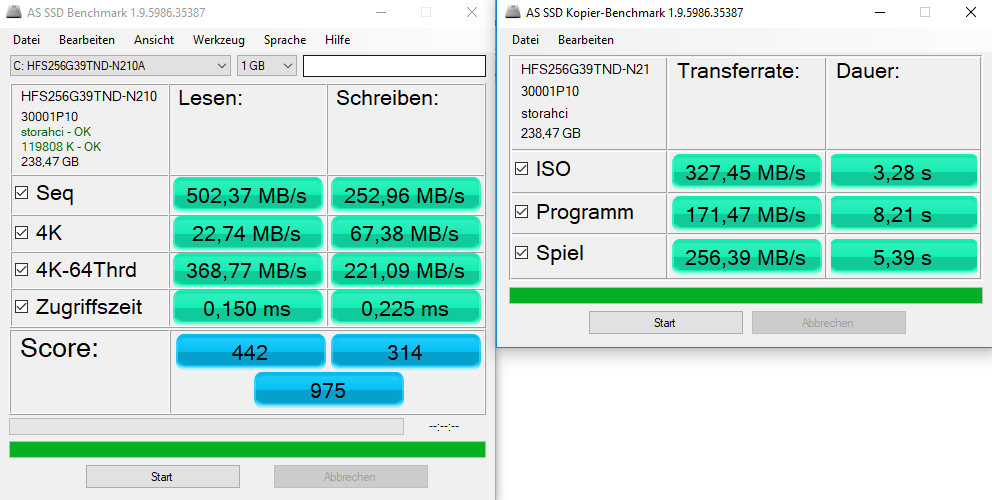
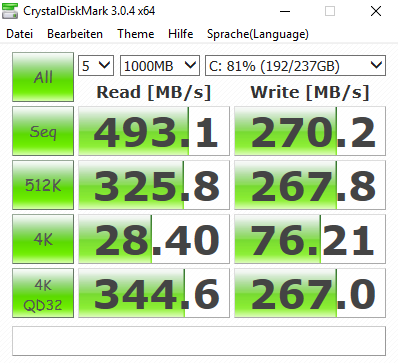
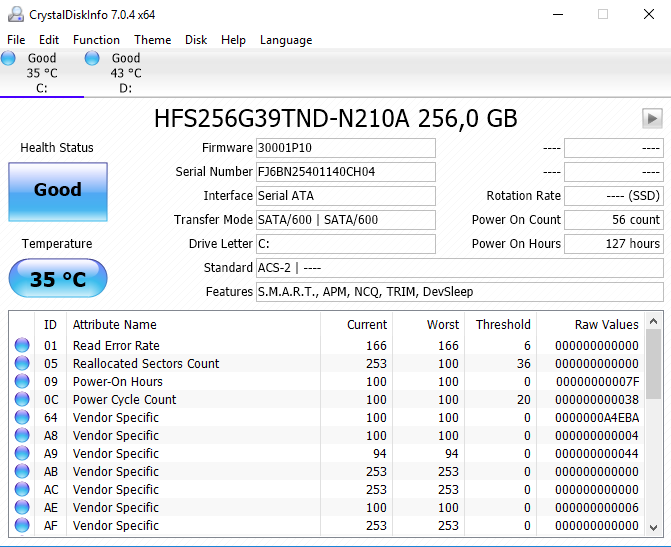
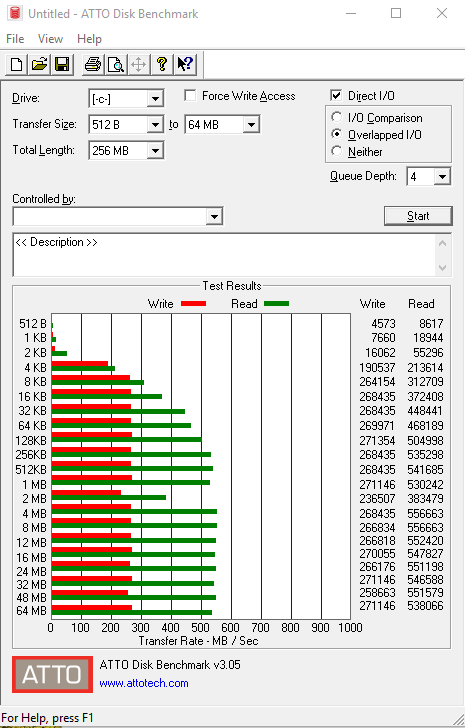
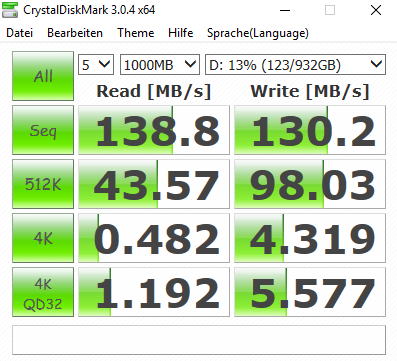
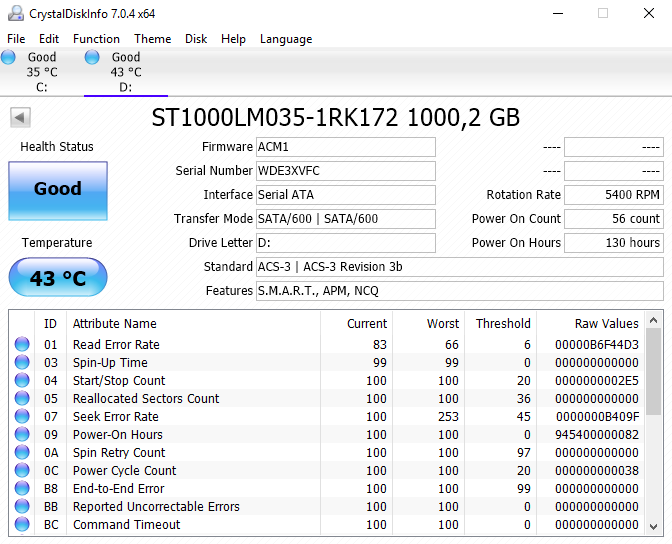
| Acer Aspire V17 Nitro BE VN7-793G-52XN SK Hynix HFS256G39TND-N210A | Asus Strix GL753VD-GC045T Micron SSD 1100 (MTFDDAV256TBN) | MSI GT72VR 7RE-433 Kingston RBU-SNS8152S3256GG5 | Gigabyte P57X v7 Transcend MTS800 256GB M.2 (TS256GMTS800) | HP Pavilion 17t-ab200 Samsung CM871a MZNTY128HDHP | HP Omen 17-w100ng SanDisk Z400s SD8SNAT-128G | |
|---|---|---|---|---|---|---|
| CrystalDiskMark 3.0 | 4% | 18% | 3% | -2% | -25% | |
| Read Seq (MB/s) | 493.1 | 475.7 -4% | 521 6% | 517 5% | 520 5% | 495 0% |
| Write Seq (MB/s) | 270.2 | 419.1 55% | 311.8 15% | 305.7 13% | 353.6 31% | 180.2 -33% |
| Read 512 (MB/s) | 325.8 | 336.1 3% | 403.1 24% | 315 -3% | 376.2 15% | 315.5 -3% |
| Write 512 (MB/s) | 267.8 | 346.6 29% | 332.3 24% | 306.1 14% | 118.5 -56% | 172.4 -36% |
| Read 4k (MB/s) | 28.4 | 24.7 -13% | 33.35 17% | 26.04 -8% | 32.7 15% | 20.25 -29% |
| Write 4k (MB/s) | 76.2 | 76.8 1% | 111.1 46% | 82.3 8% | 85.3 12% | 76.1 0% |
| Read 4k QD32 (MB/s) | 344.6 | 247.6 -28% | 331.1 -4% | 281.3 -18% | 399 16% | 141.6 -59% |
| Write 4k QD32 (MB/s) | 267 | 234.9 -12% | 318.3 19% | 296 11% | 132.5 -50% | 170.8 -36% |

| 3DMark | |
| 1280x720 Cloud Gate Standard Graphics | |
| MSI GT72VR 7RE-433 | |
| Gigabyte P57X v7 | |
| HP Omen 17-w100ng | |
| Acer Aspire V17 Nitro BE VN7-793G-52XN | |
| HP Pavilion 17t-ab200 | |
| Asus Strix GL753VD-GC045T | |
| 1920x1080 Fire Strike Graphics | |
| MSI GT72VR 7RE-433 | |
| Gigabyte P57X v7 | |
| HP Omen 17-w100ng | |
| Acer Aspire V17 Nitro BE VN7-793G-52XN | |
| HP Pavilion 17t-ab200 | |
| Asus Strix GL753VD-GC045T | |
| Asus Strix GL753VD-GC045T | |
| 3DMark 11 - 1280x720 Performance GPU | |
| Gigabyte P57X v7 | |
| MSI GT72VR 7RE-433 | |
| Acer Aspire V17 Nitro BE VN7-793G-52XN | |
| HP Omen 17-w100ng | |
| HP Pavilion 17t-ab200 | |
| Asus Strix GL753VD-GC045T | |
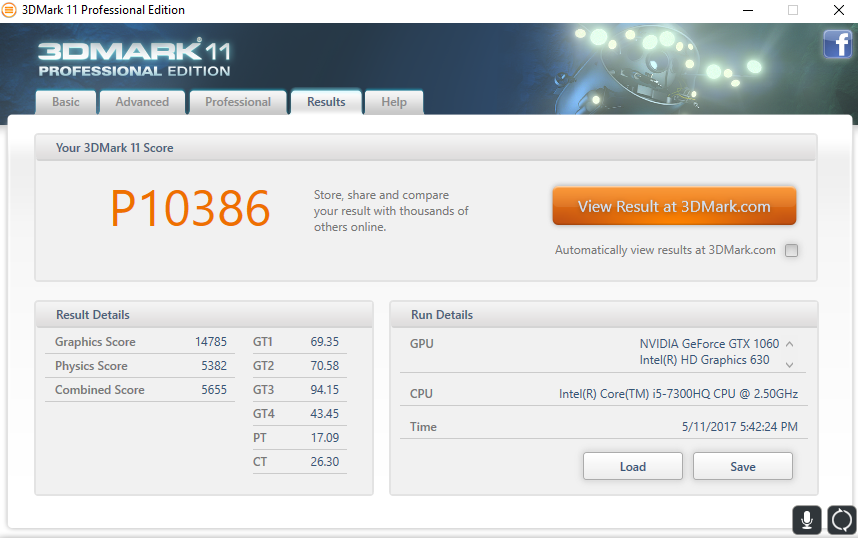
| 3DMark 11 Performance | 10386 puntos | |
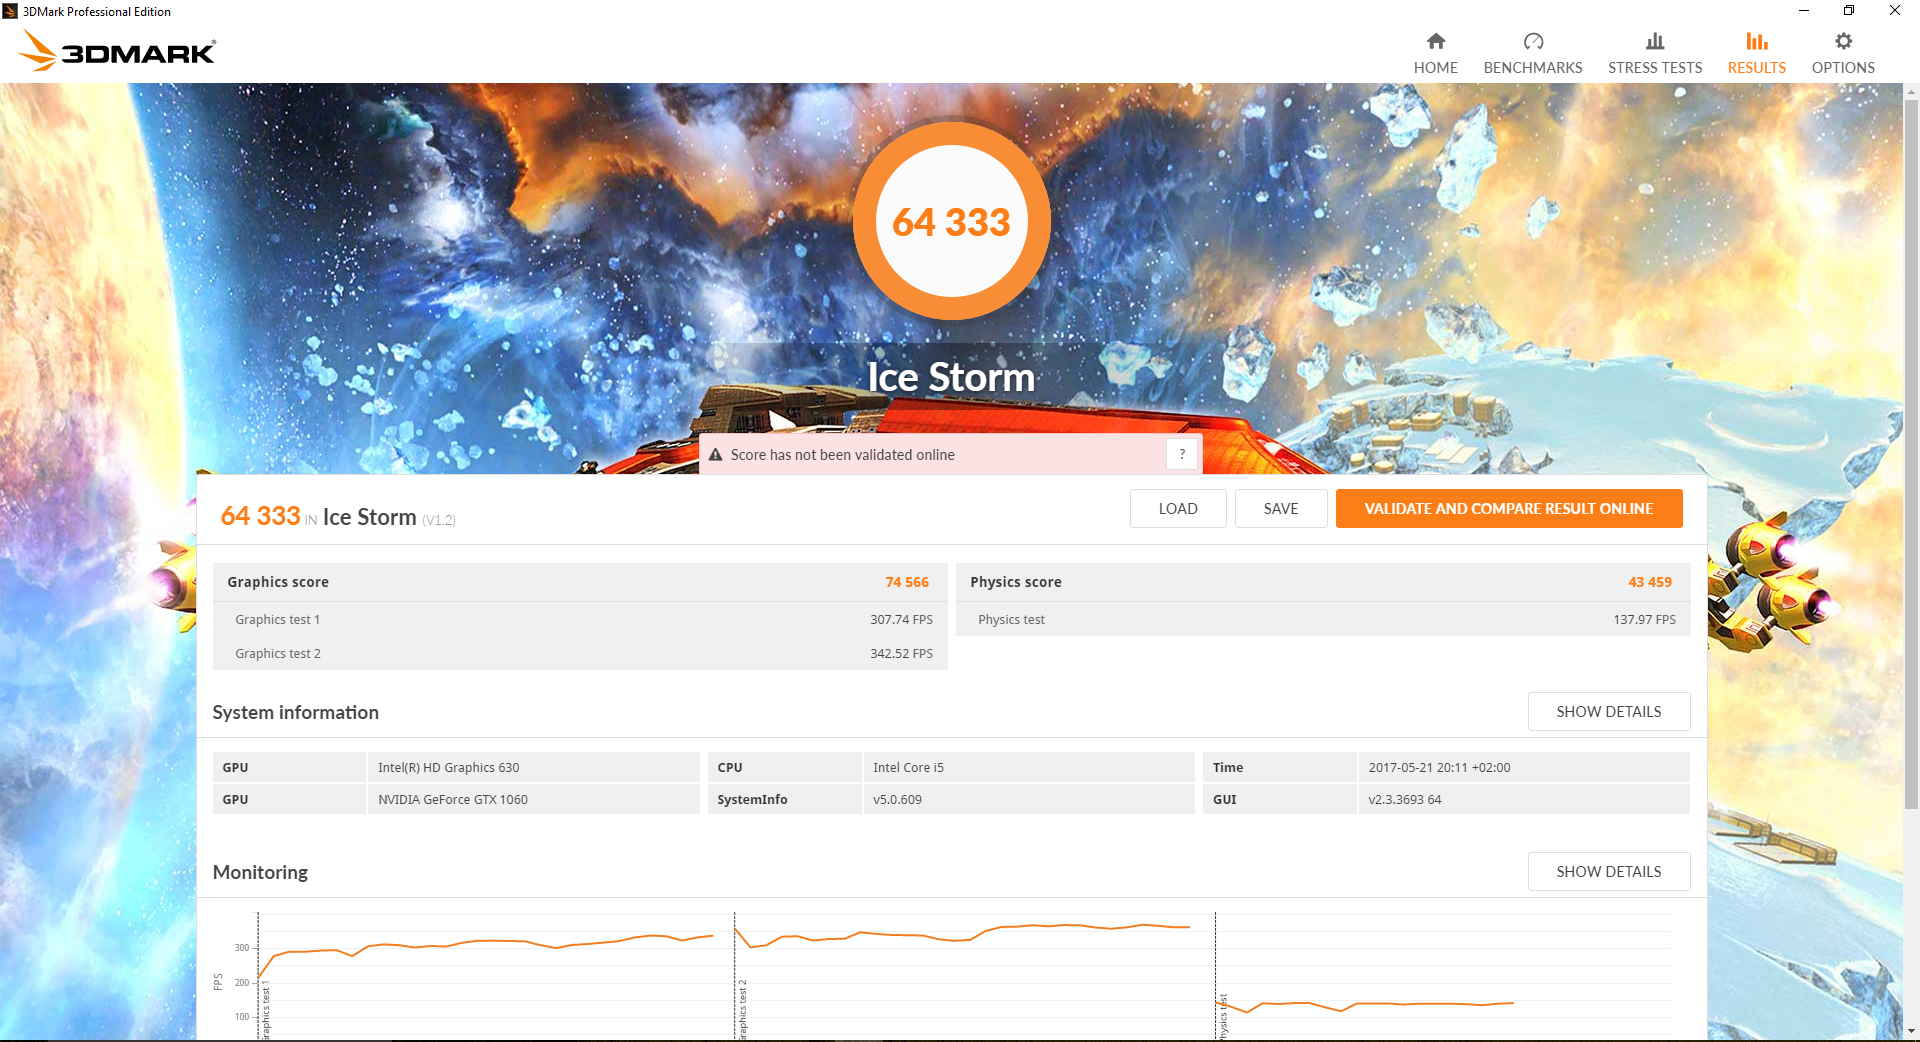
| 3DMark Ice Storm Standard Score | 64333 puntos | |
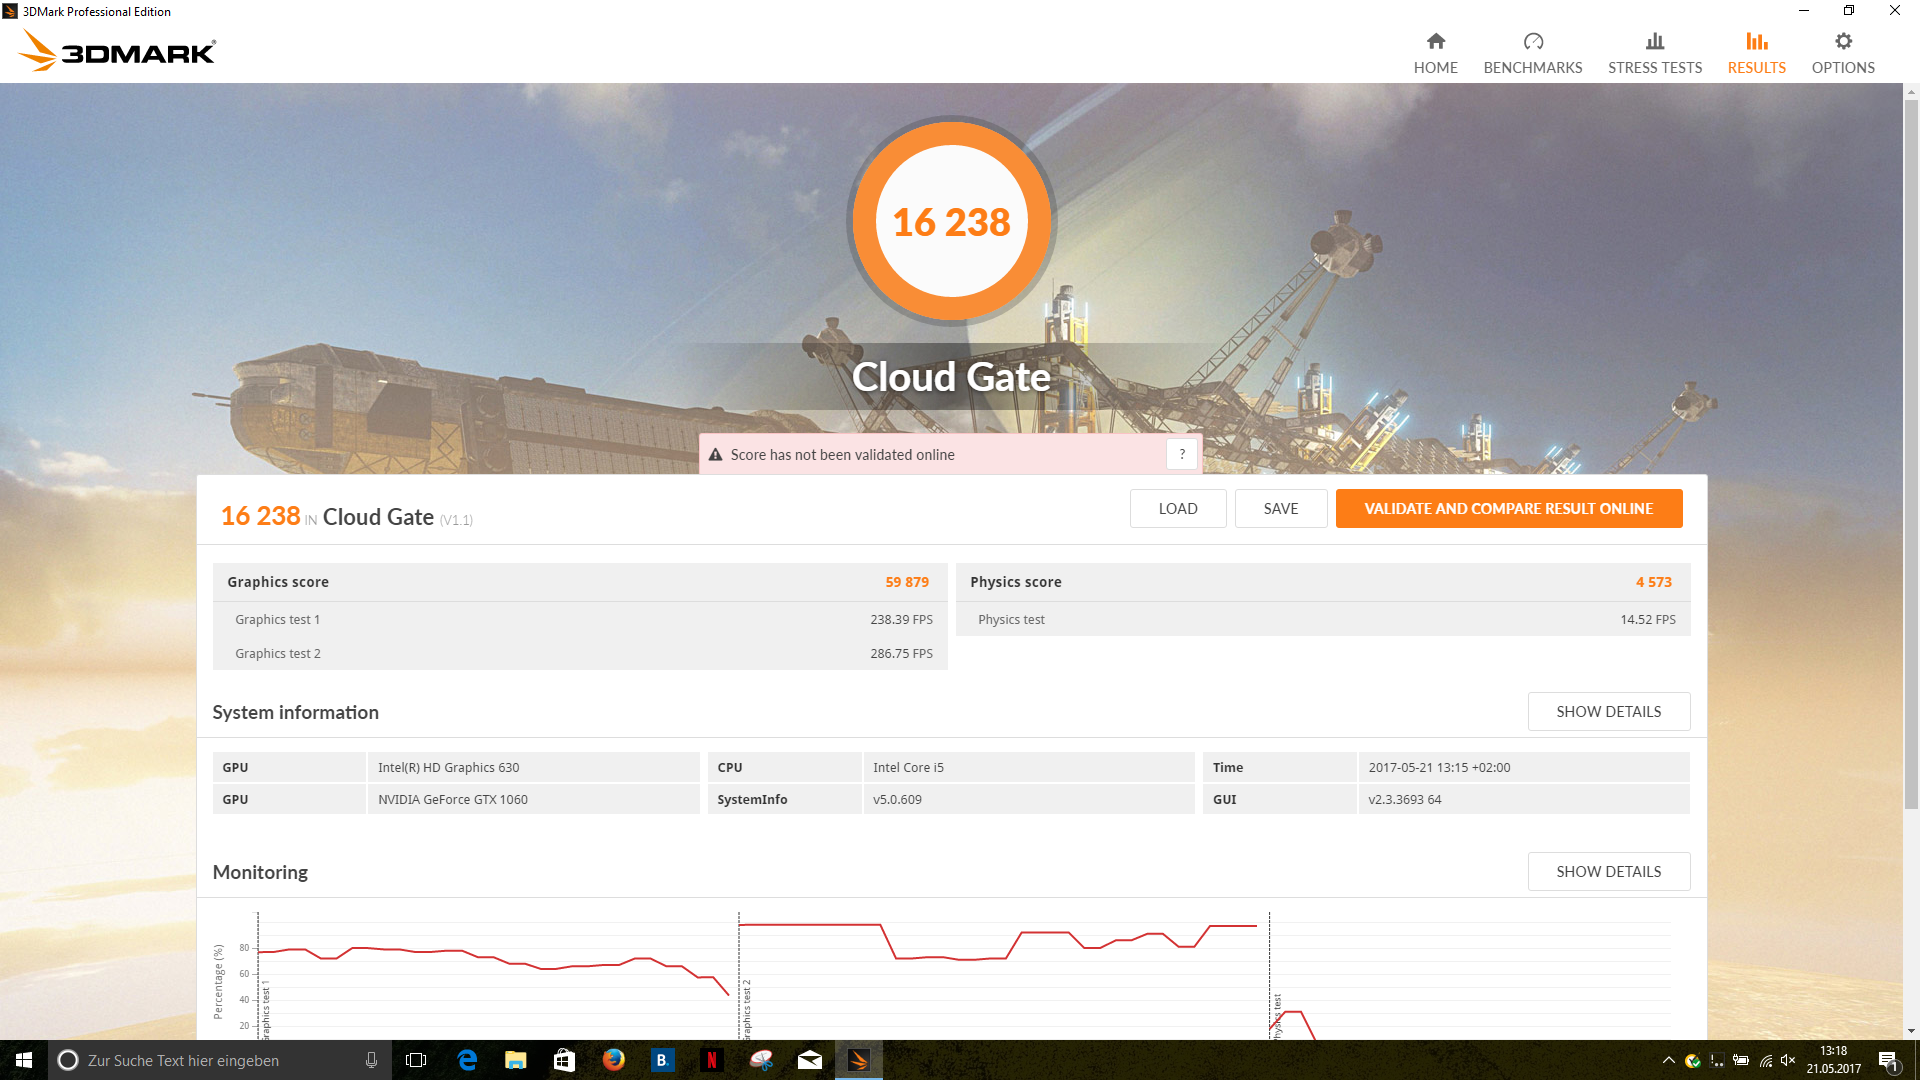
| 3DMark Cloud Gate Standard Score | 16238 puntos | |
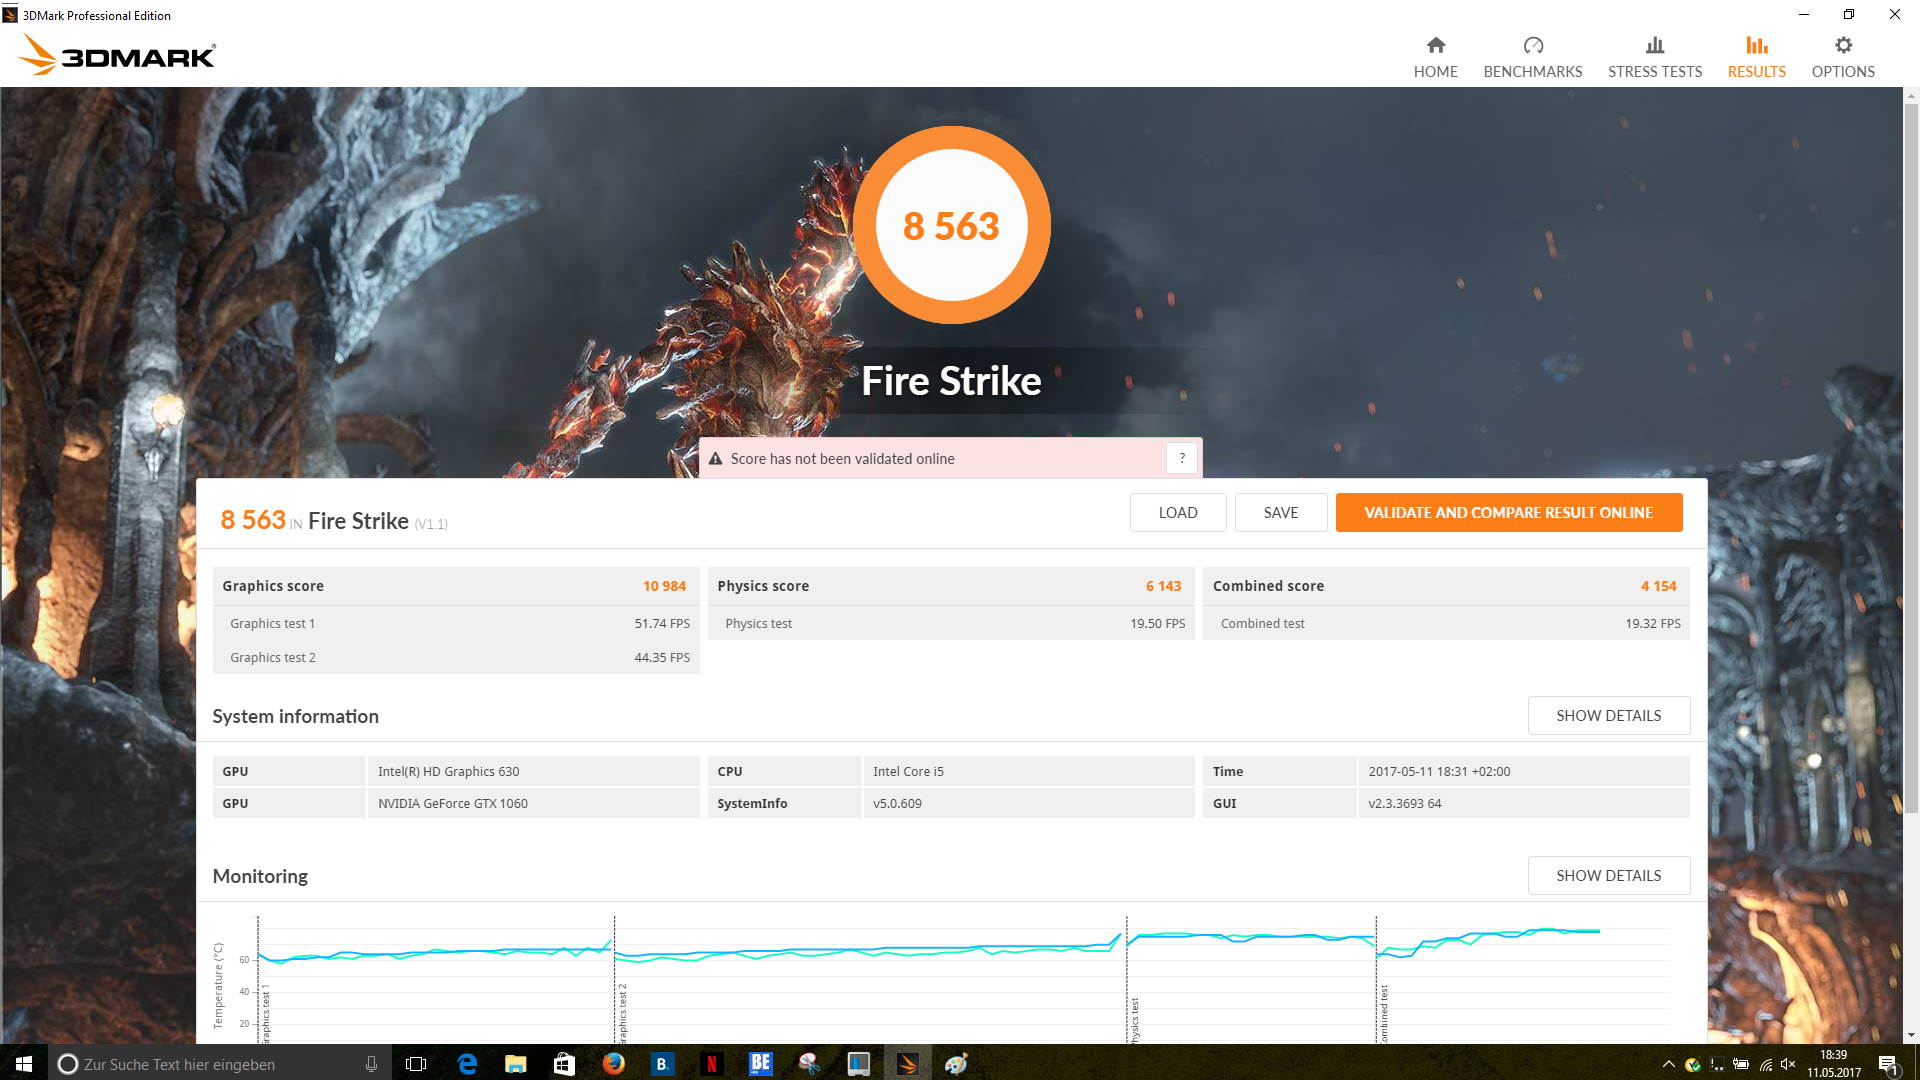
| 3DMark Fire Strike Score | 8563 puntos | |
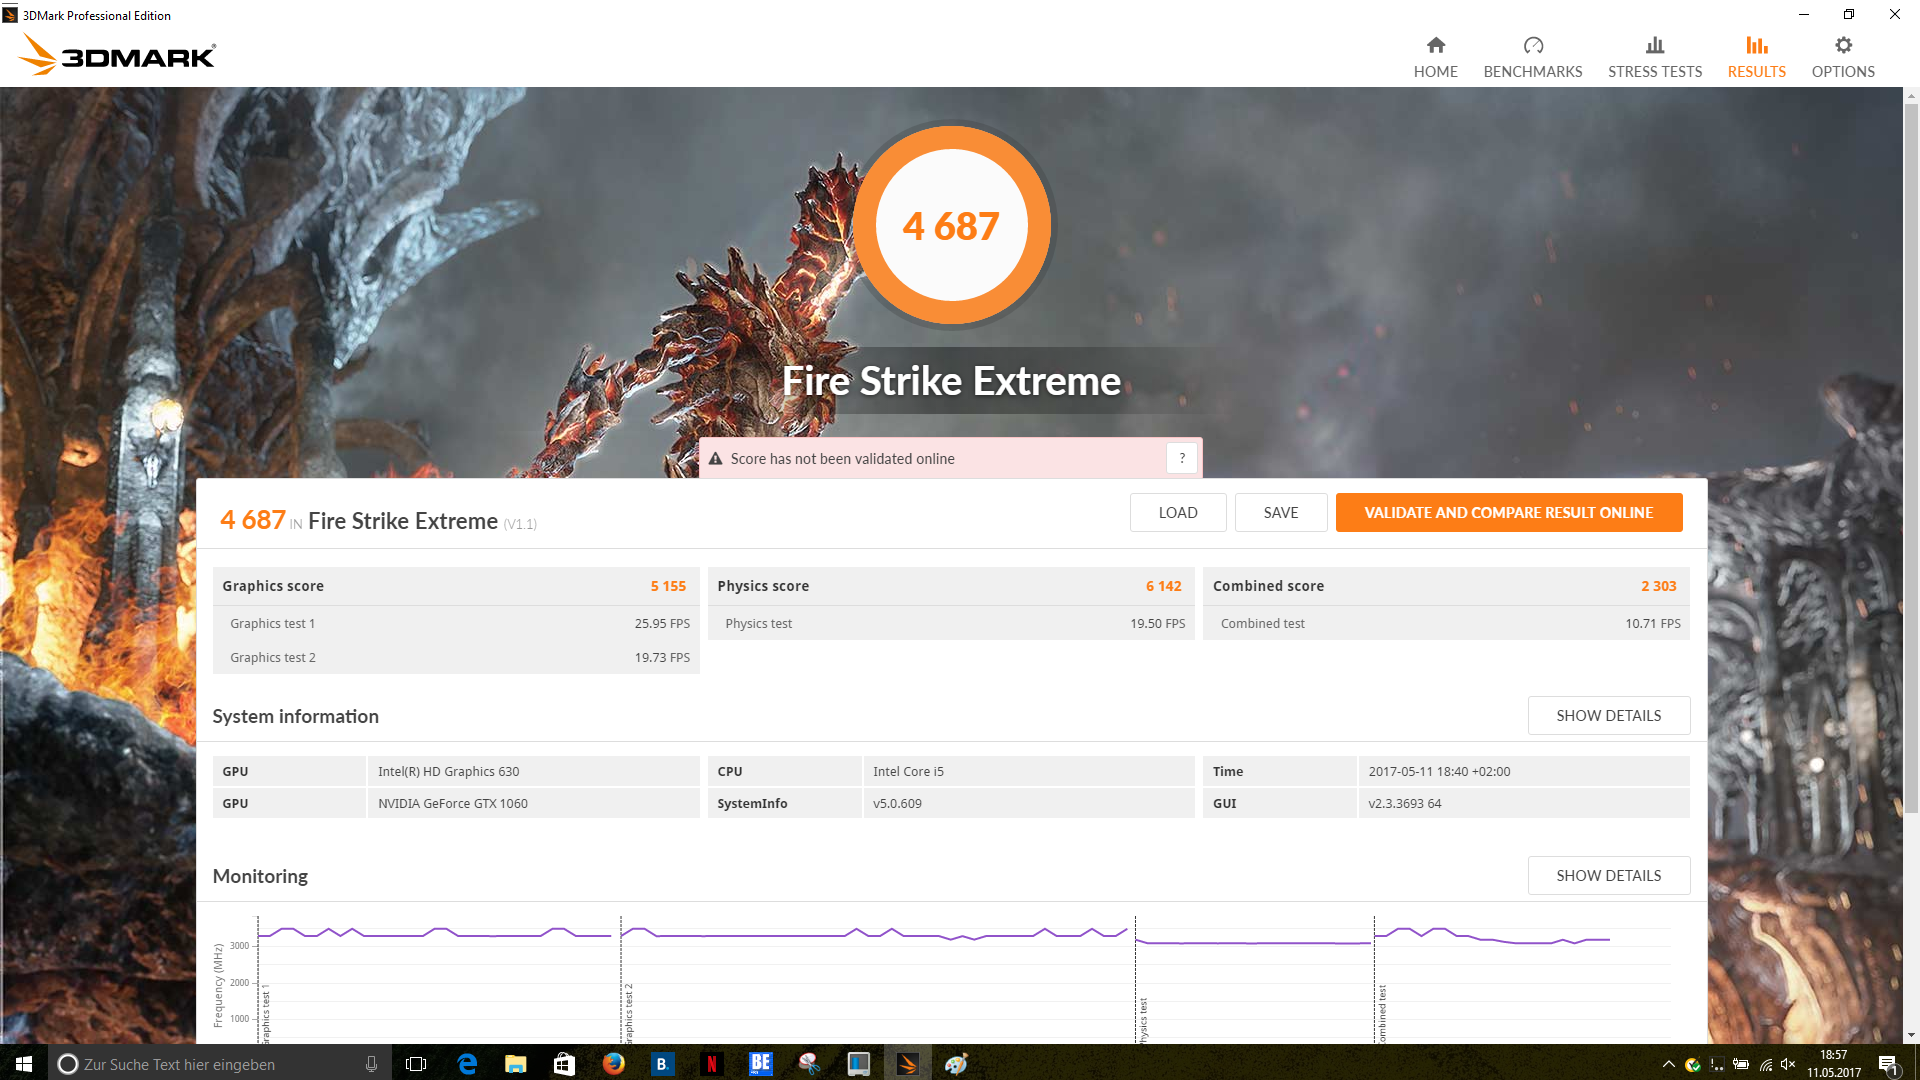
| 3DMark Fire Strike Extreme Score | 4687 puntos | |
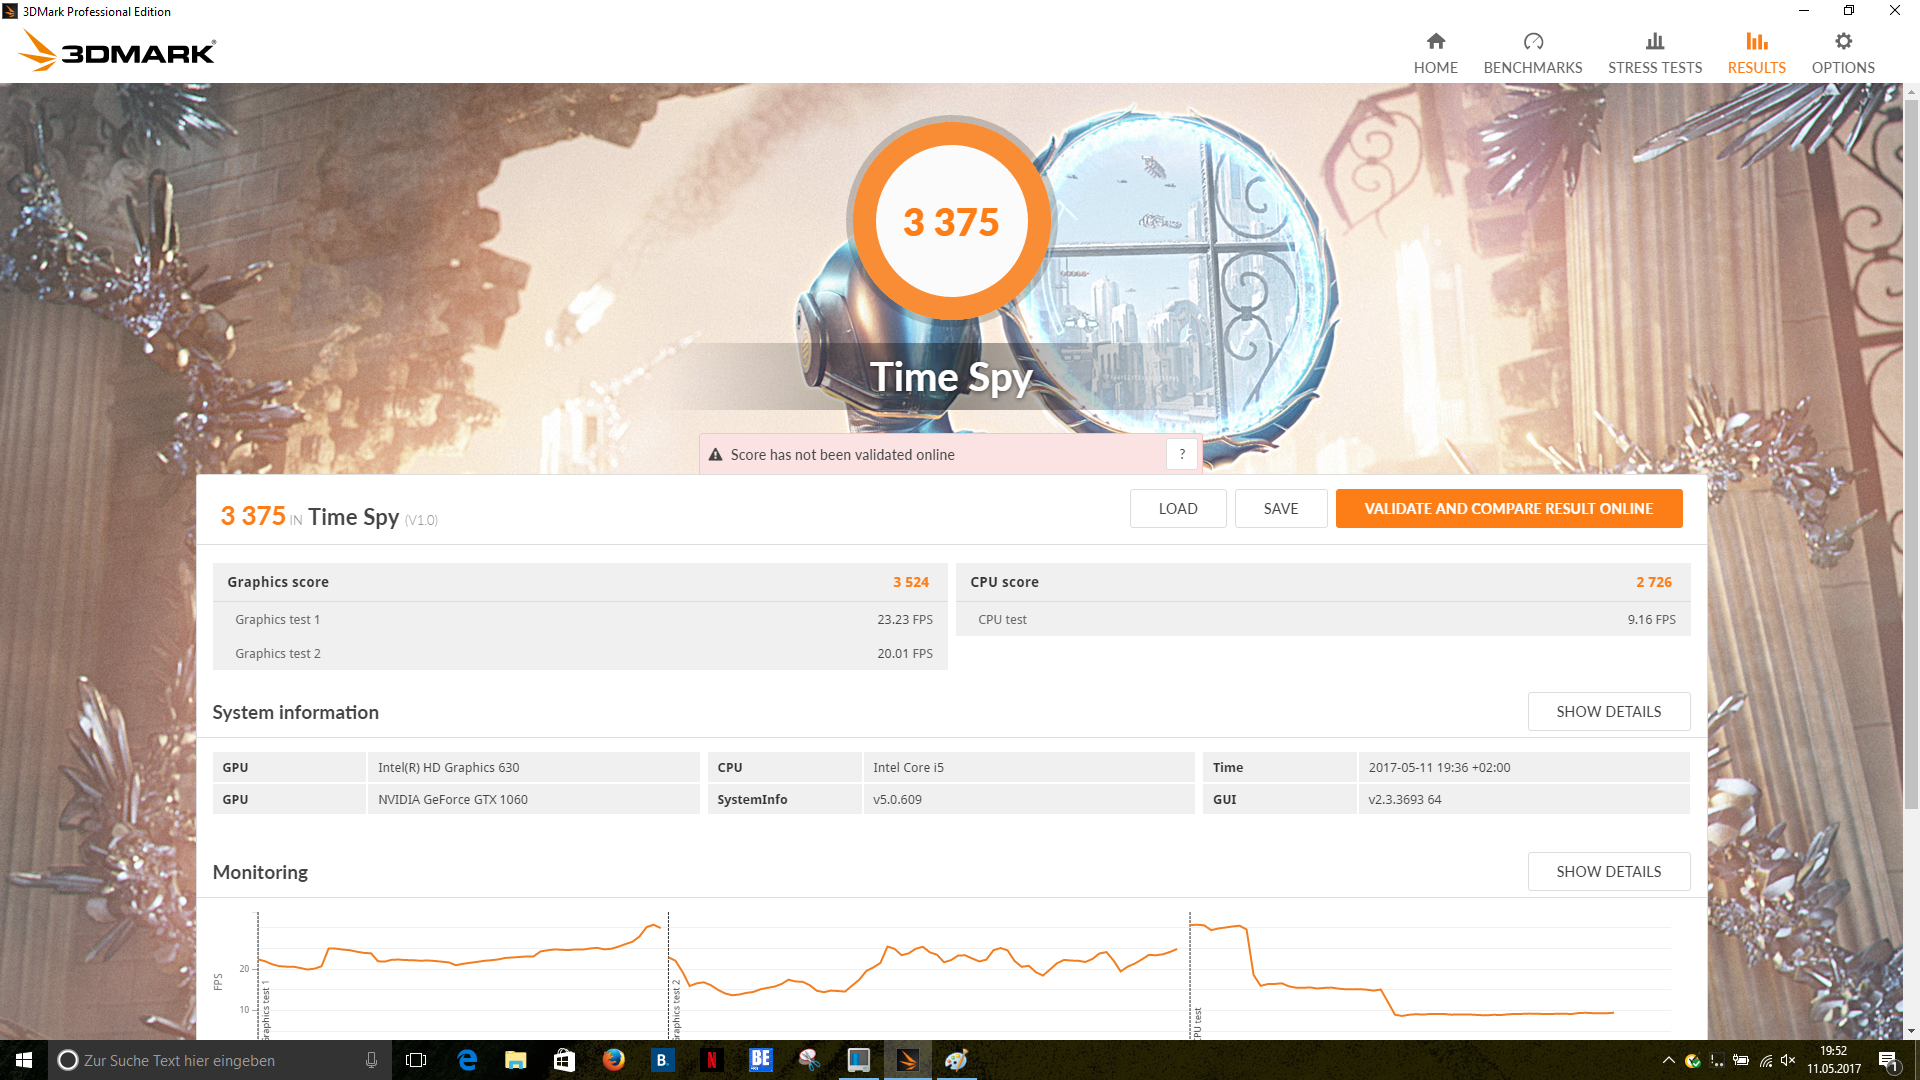
| 3DMark Time Spy Score | 3375 puntos | |
ayuda | ||
| bajo | medio | alto | ultra | |
|---|---|---|---|---|
| BioShock Infinite (2013) | 187 | 164.6 | 154.7 | 92.5 |
| Battlefield 4 (2013) | 182.6 | 169.5 | 153.1 | 98 |
| The Witcher 3 (2015) | 130.2 | 118.1 | 65.9 | 37.5 |
| Rise of the Tomb Raider (2016) | 115.4 | 111.4 | 68.7 | 58.4 |
| BioShock Infinite - 1920x1080 Ultra Preset, DX11 (DDOF) | |
| MSI GT72VR 7RE-433 | |
| Gigabyte P57X v7 | |
| HP Omen 17-w100ng | |
| Acer Aspire V17 Nitro BE VN7-793G-52XN | |
| HP Pavilion 17t-ab200 | |
| Battlefield 4 - 1920x1080 Ultra Preset AA:4x MS | |
| MSI GT72VR 7RE-433 | |
| HP Omen 17-w100ng | |
| Acer Aspire V17 Nitro BE VN7-793G-52XN | |
| Rise of the Tomb Raider - 1920x1080 Very High Preset AA:FX AF:16x | |
| Acer Aspire V17 Nitro BE VN7-793G-52XN | |
| Asus Strix GL753VD-GC045T | |
| HP Pavilion 17t-ab200 | |
| The Witcher 3 - 1920x1080 Ultra Graphics & Postprocessing (HBAO+) | |
| Acer Aspire V17 Nitro BE VN7-793G-52XN | |
| Asus Strix GL753VD-GC045T | |
Acer Aspire V17 Nitro BE VN7-793G-52XN análisis de audio
(-) | altavoces no muy altos (#42.8 dB)
Analysis not possible as maximum curve is missing or too high
Ruido
| Ocioso |
| 30.7 / 30.7 / 31.4 dB(A) |
| HDD |
| 30.7 dB(A) |
| Carga |
| 32.1 / 42.8 dB(A) |
 | ||
30 dB silencioso 40 dB(A) audible 50 dB(A) ruidosamente alto |
||
min: | ||
| Acer Aspire V17 Nitro BE VN7-793G-52XN i5-7300HQ, GeForce GTX 1060 Mobile | Asus Strix GL753VD-GC045T i7-7700HQ, GeForce GTX 1050 Mobile | MSI GT72VR 7RE-433 i7-7700HQ, GeForce GTX 1070 Mobile | Gigabyte P57X v7 i7-7700HQ, GeForce GTX 1070 Mobile | HP Pavilion 17t-ab200 i7-7700HQ, GeForce GTX 1050 Mobile | HP Omen 17-w100ng 6300HQ, GeForce GTX 1060 Mobile | |
|---|---|---|---|---|---|---|
| Noise | -13% | -10% | -10% | -18% | -19% | |
| apagado / medio ambiente * (dB) | 30.7 | 28.8 6% | 31 -1% | 29 6% | 30.8 -0% | 31 -1% |
| Idle Minimum * (dB) | 30.7 | 33.9 -10% | 34 -11% | 30.4 1% | 35.3 -15% | 35 -14% |
| Idle Average * (dB) | 30.7 | 33.9 -10% | 35 -14% | 32.1 -5% | 35.4 -15% | 36 -17% |
| Idle Maximum * (dB) | 31.4 | 37.8 -20% | 37 -18% | 32.1 -2% | 35.4 -13% | 37 -18% |
| Load Average * (dB) | 32.1 | 42.7 -33% | 37 -15% | 45.6 -42% | 48.6 -51% | 44 -37% |
| Witcher 3 ultra * (dB) | 42.8 | |||||
| Load Maximum * (dB) | 42.8 | 47.4 -11% | 44 -3% | 51.5 -20% | 49.8 -16% | 54 -26% |
* ... más pequeño es mejor
(-) La temperatura máxima en la parte superior es de 48.4 °C / 119 F, frente a la media de 36.8 °C / 98 F, que oscila entre 21 y 71 °C para la clase Multimedia.
(±) El fondo se calienta hasta un máximo de 44.2 °C / 112 F, frente a la media de 39.1 °C / 102 F
(+) En reposo, la temperatura media de la parte superior es de 23.2 °C / 74# F, frente a la media del dispositivo de 31.3 °C / 88 F.
(±) Jugando a The Witcher 3, la temperatura media de la parte superior es de 36.3 °C / 97 F, frente a la media del dispositivo de 31.3 °C / 88 F.
(+) El reposamanos y el panel táctil están a una temperatura inferior a la de la piel, con un máximo de 28.7 °C / 83.7 F y, por tanto, son fríos al tacto.
(±) La temperatura media de la zona del reposamanos de dispositivos similares fue de 28.7 °C / 83.7 F (0 °C / 0 F).
| Acer Aspire V17 Nitro BE VN7-793G-52XN i5-7300HQ, GeForce GTX 1060 Mobile | Asus Strix GL753VD-GC045T i7-7700HQ, GeForce GTX 1050 Mobile | MSI GT72VR 7RE-433 i7-7700HQ, GeForce GTX 1070 Mobile | Gigabyte P57X v7 i7-7700HQ, GeForce GTX 1070 Mobile | HP Pavilion 17t-ab200 i7-7700HQ, GeForce GTX 1050 Mobile | HP Omen 17-w100ng 6300HQ, GeForce GTX 1060 Mobile | |
|---|---|---|---|---|---|---|
| Heat | 11% | -1% | -16% | 10% | -7% | |
| Maximum Upper Side * (°C) | 48.4 | 37.7 22% | 41.5 14% | 51.2 -6% | 45.8 5% | 41.5 14% |
| Maximum Bottom * (°C) | 44.2 | 36.3 18% | 50.6 -14% | 56.8 -29% | 37 16% | 45.5 -3% |
| Idle Upper Side * (°C) | 25.8 | 25.7 -0% | 26.4 -2% | 29.2 -13% | 24 7% | 31.8 -23% |
| Idle Bottom * (°C) | 25.5 | 24.4 4% | 25.4 -0% | 29.2 -15% | 23 10% | 29.6 -16% |
* ... más pequeño es mejor
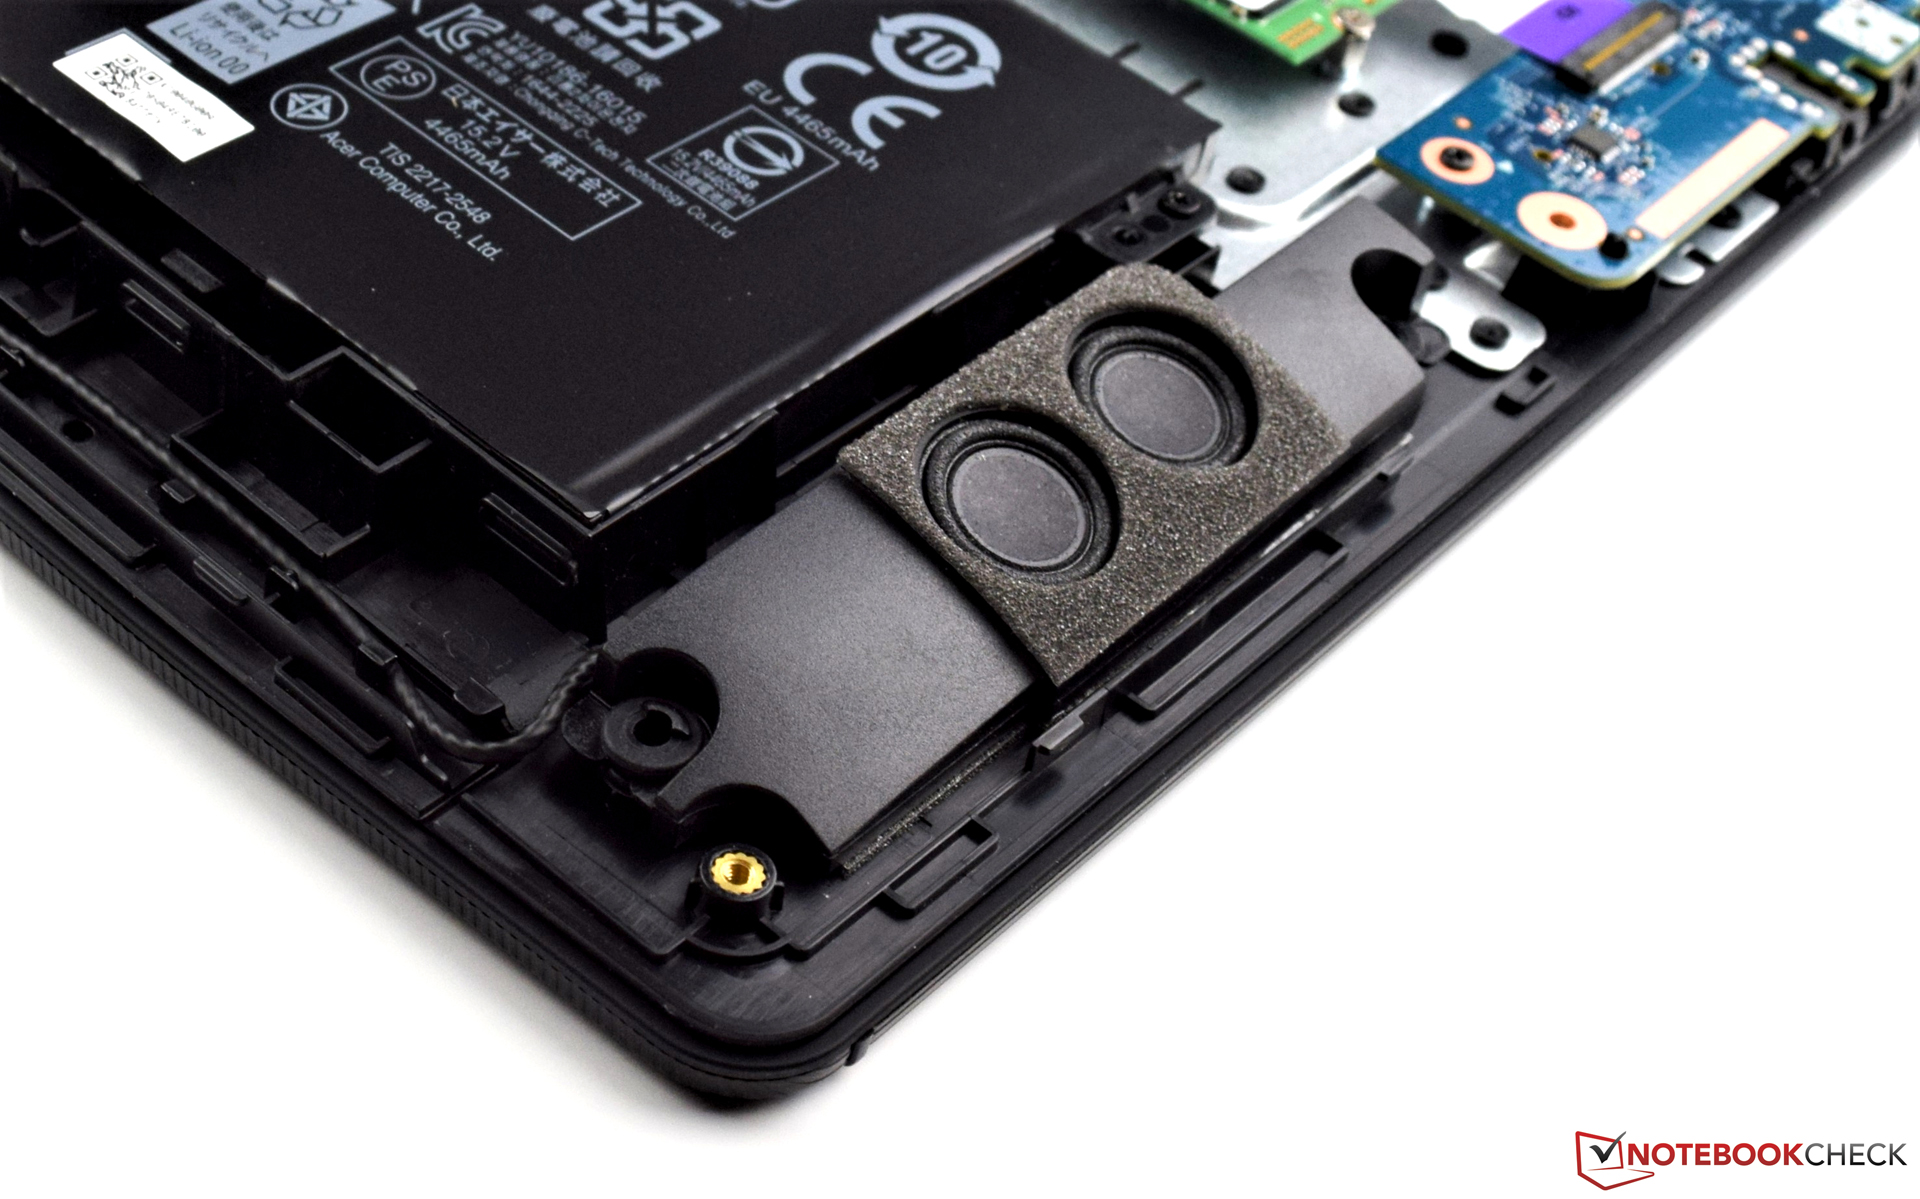
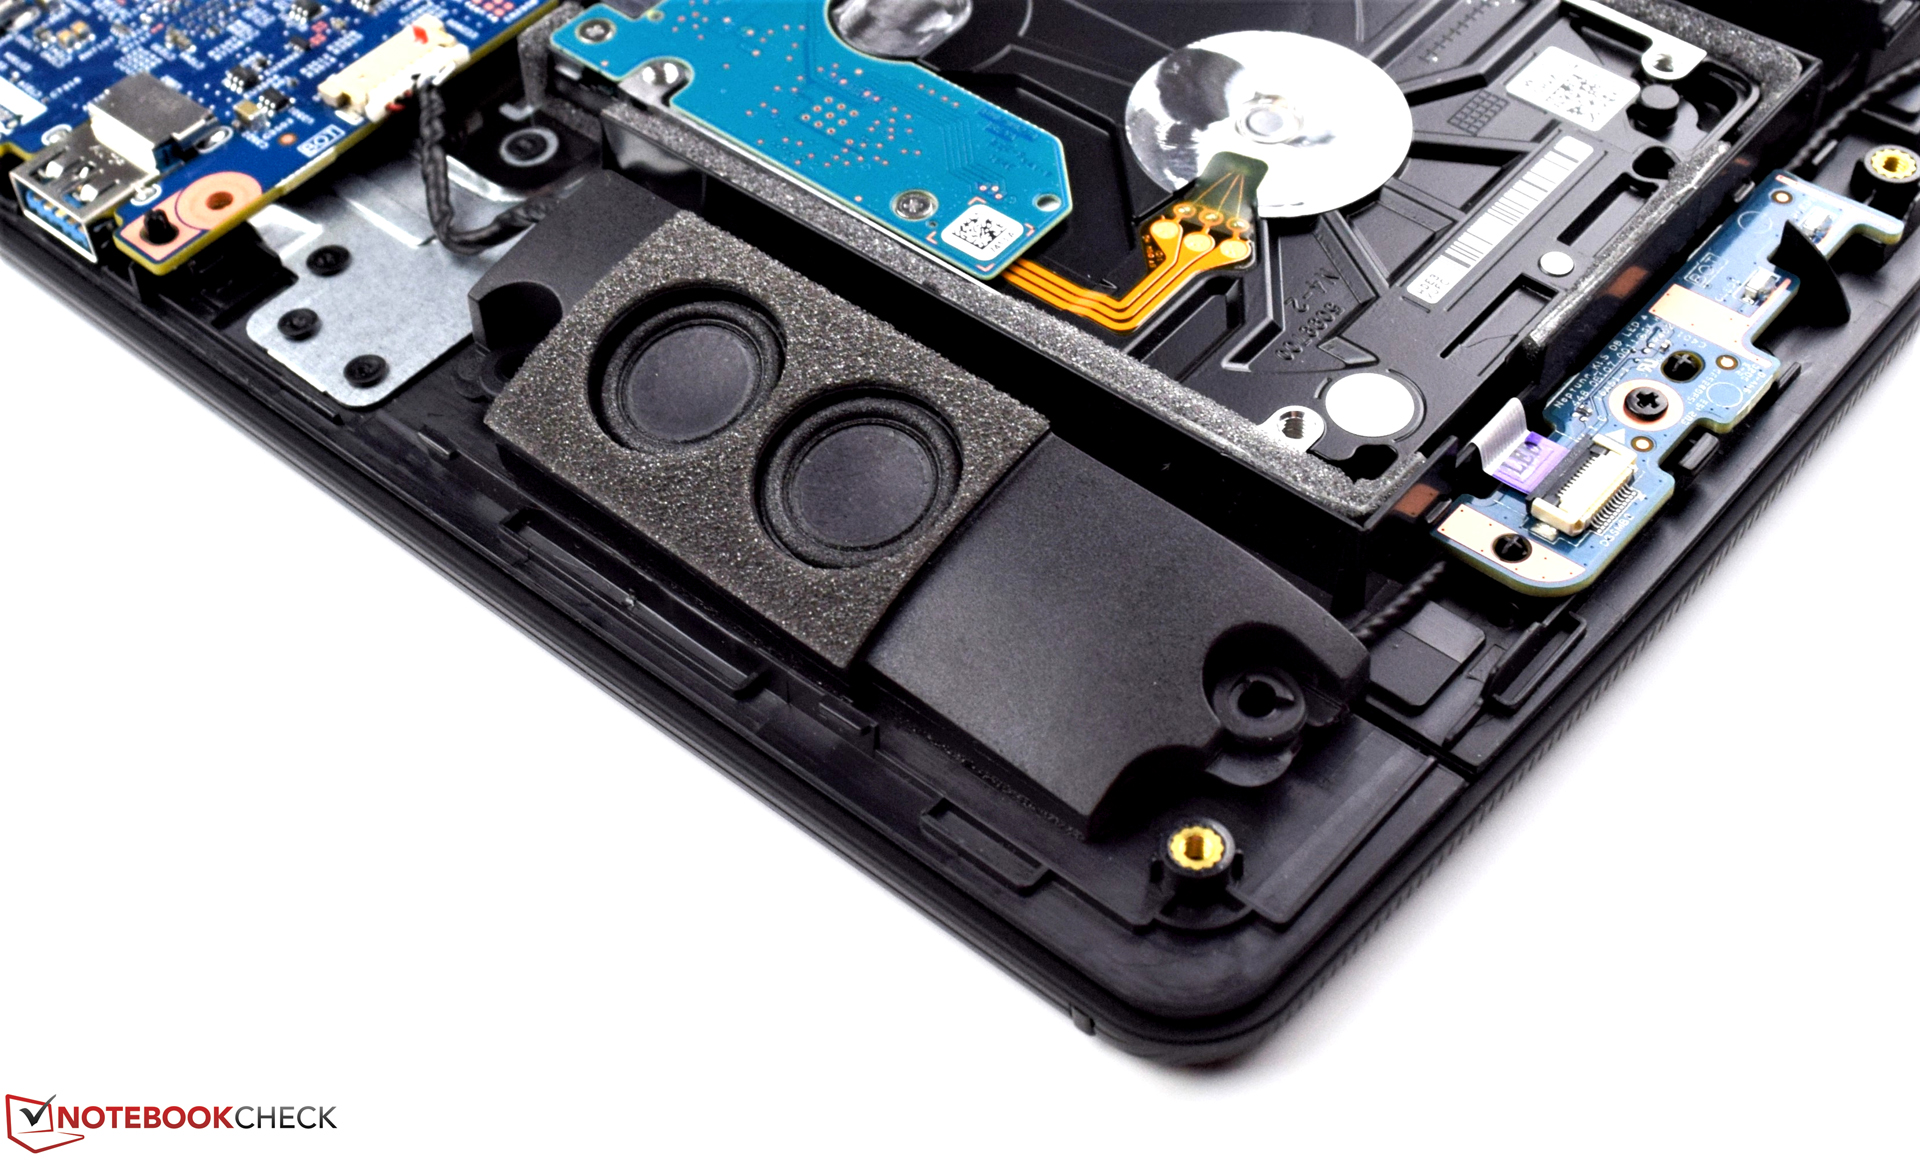
Acer Aspire V17 Nitro BE VN7-793G-52XN análisis de audio
(±) | la sonoridad del altavoz es media pero buena (72 dB)
Graves 100 - 315 Hz
(±) | lubina reducida - en promedio 5.7% inferior a la mediana
(+) | el bajo es lineal (5% delta a la frecuencia anterior)
Medios 400 - 2000 Hz
(+) | medios equilibrados - a sólo 4.4% de la mediana
(+) | los medios son lineales (6% delta a la frecuencia anterior)
Altos 2 - 16 kHz
(+) | máximos equilibrados - a sólo 3% de la mediana
(±) | la linealidad de los máximos es media (7.2% delta a frecuencia anterior)
Total 100 - 16.000 Hz
(+) | el sonido global es lineal (12.5% de diferencia con la mediana)
En comparación con la misma clase
» 24% de todos los dispositivos probados de esta clase eran mejores, 3% similares, 73% peores
» El mejor tuvo un delta de 5%, la media fue 17%, el peor fue ###max##%
En comparación con todos los dispositivos probados
» 11% de todos los dispositivos probados eran mejores, 2% similares, 87% peores
» El mejor tuvo un delta de 4%, la media fue 23%, el peor fue ###max##%
Asus Strix GL753VD-GC045T análisis de audio
(±) | la sonoridad del altavoz es media pero buena (81.5 dB)
Graves 100 - 315 Hz
(-) | casi sin bajos - de media 15.8% inferior a la mediana
(±) | la linealidad de los graves es media (12.2% delta a frecuencia anterior)
Medios 400 - 2000 Hz
(+) | medios equilibrados - a sólo 3.1% de la mediana
(±) | la linealidad de los medios es media (7% delta respecto a la frecuencia anterior)
Altos 2 - 16 kHz
(±) | máximos más altos - de media 6.3% más altos que la mediana
(+) | los máximos son lineales (5.4% delta a la frecuencia anterior)
Total 100 - 16.000 Hz
(±) | la linealidad del sonido global es media (17.2% de diferencia con la mediana)
En comparación con la misma clase
» 47% de todos los dispositivos probados de esta clase eran mejores, 11% similares, 42% peores
» El mejor tuvo un delta de 6%, la media fue 18%, el peor fue ###max##%
En comparación con todos los dispositivos probados
» 32% de todos los dispositivos probados eran mejores, 8% similares, 60% peores
» El mejor tuvo un delta de 4%, la media fue 23%, el peor fue ###max##%
| Off / Standby | |
| Ocioso | |
| Carga |
|
Clave:
min: | |
| Acer Aspire V17 Nitro BE VN7-793G-52XN i5-7300HQ, GeForce GTX 1060 Mobile, SK Hynix HFS256G39TND-N210A, a-Si TFT-LCD, WLED, 1920x1080, 17.3" | Asus Strix GL753VD-GC045T i7-7700HQ, GeForce GTX 1050 Mobile, Micron SSD 1100 (MTFDDAV256TBN), LED IPS, 1920x1080, 17.3" | MSI GT72VR 7RE-433 i7-7700HQ, GeForce GTX 1070 Mobile, Kingston RBU-SNS8152S3256GG5, TN LED, 1920x1080, 17.3" | Gigabyte P57X v7 i7-7700HQ, GeForce GTX 1070 Mobile, Transcend MTS800 256GB M.2 (TS256GMTS800), IPS, 3840x2160, 17.3" | HP Pavilion 17t-ab200 i7-7700HQ, GeForce GTX 1050 Mobile, Samsung CM871a MZNTY128HDHP, IPS, 1920x1080, 17.3" | HP Omen 17-w100ng 6300HQ, GeForce GTX 1060 Mobile, SanDisk Z400s SD8SNAT-128G, IPS, 1920x1080, 17.3" | |
|---|---|---|---|---|---|---|
| Power Consumption | 8% | -79% | -88% | 11% | -52% | |
| Idle Minimum * (Watt) | 7.8 | 6.2 21% | 20 -156% | 15.7 -101% | 8.2 -5% | 17 -118% |
| Idle Average * (Watt) | 13.3 | 12.2 8% | 27 -103% | 23.4 -76% | 11 17% | 22 -65% |
| Idle Maximum * (Watt) | 16.6 | 14.8 11% | 31 -87% | 23.5 -42% | 11.1 33% | 29 -75% |
| Load Average * (Watt) | 73 | 84.9 -16% | 86 -18% | 184.6 -153% | 77 -5% | 72 1% |
| Witcher 3 ultra * (Watt) | 118 | |||||
| Load Maximum * (Watt) | 140 | 120.7 14% | 184 -31% | 233.1 -67% | 116.9 16% | 141 -1% |
* ... más pequeño es mejor
| Acer Aspire V17 Nitro BE VN7-793G-52XN i5-7300HQ, GeForce GTX 1060 Mobile, 69 Wh | Asus Strix GL753VD-GC045T i7-7700HQ, GeForce GTX 1050 Mobile, 48 Wh | MSI GT72VR 7RE-433 i7-7700HQ, GeForce GTX 1070 Mobile, 83 Wh | Gigabyte P57X v7 i7-7700HQ, GeForce GTX 1070 Mobile, 75.81 Wh | HP Pavilion 17t-ab200 i7-7700HQ, GeForce GTX 1050 Mobile, 62 Wh | HP Omen 17-w100ng 6300HQ, GeForce GTX 1060 Mobile, 95.8 Wh | |
|---|---|---|---|---|---|---|
| Duración de Batería | -37% | -37% | -48% | -0% | -2% | |
| Reader / Idle (h) | 10.3 | 8.6 -17% | 5.3 -49% | 4.3 -58% | 11.5 12% | 9.1 -12% |
| H.264 (h) | 5.3 | 3.8 -28% | 5.2 -2% | |||
| WiFi v1.3 (h) | 6.2 | 4.4 -29% | 3.8 -39% | 2.6 -58% | 6.8 10% | 6.1 -2% |
| Load (h) | 2.2 | 0.8 -64% | 1.5 -32% | 1.6 -27% | 1.7 -23% | 2.4 9% |
Pro
Contra
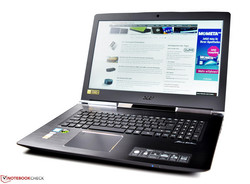
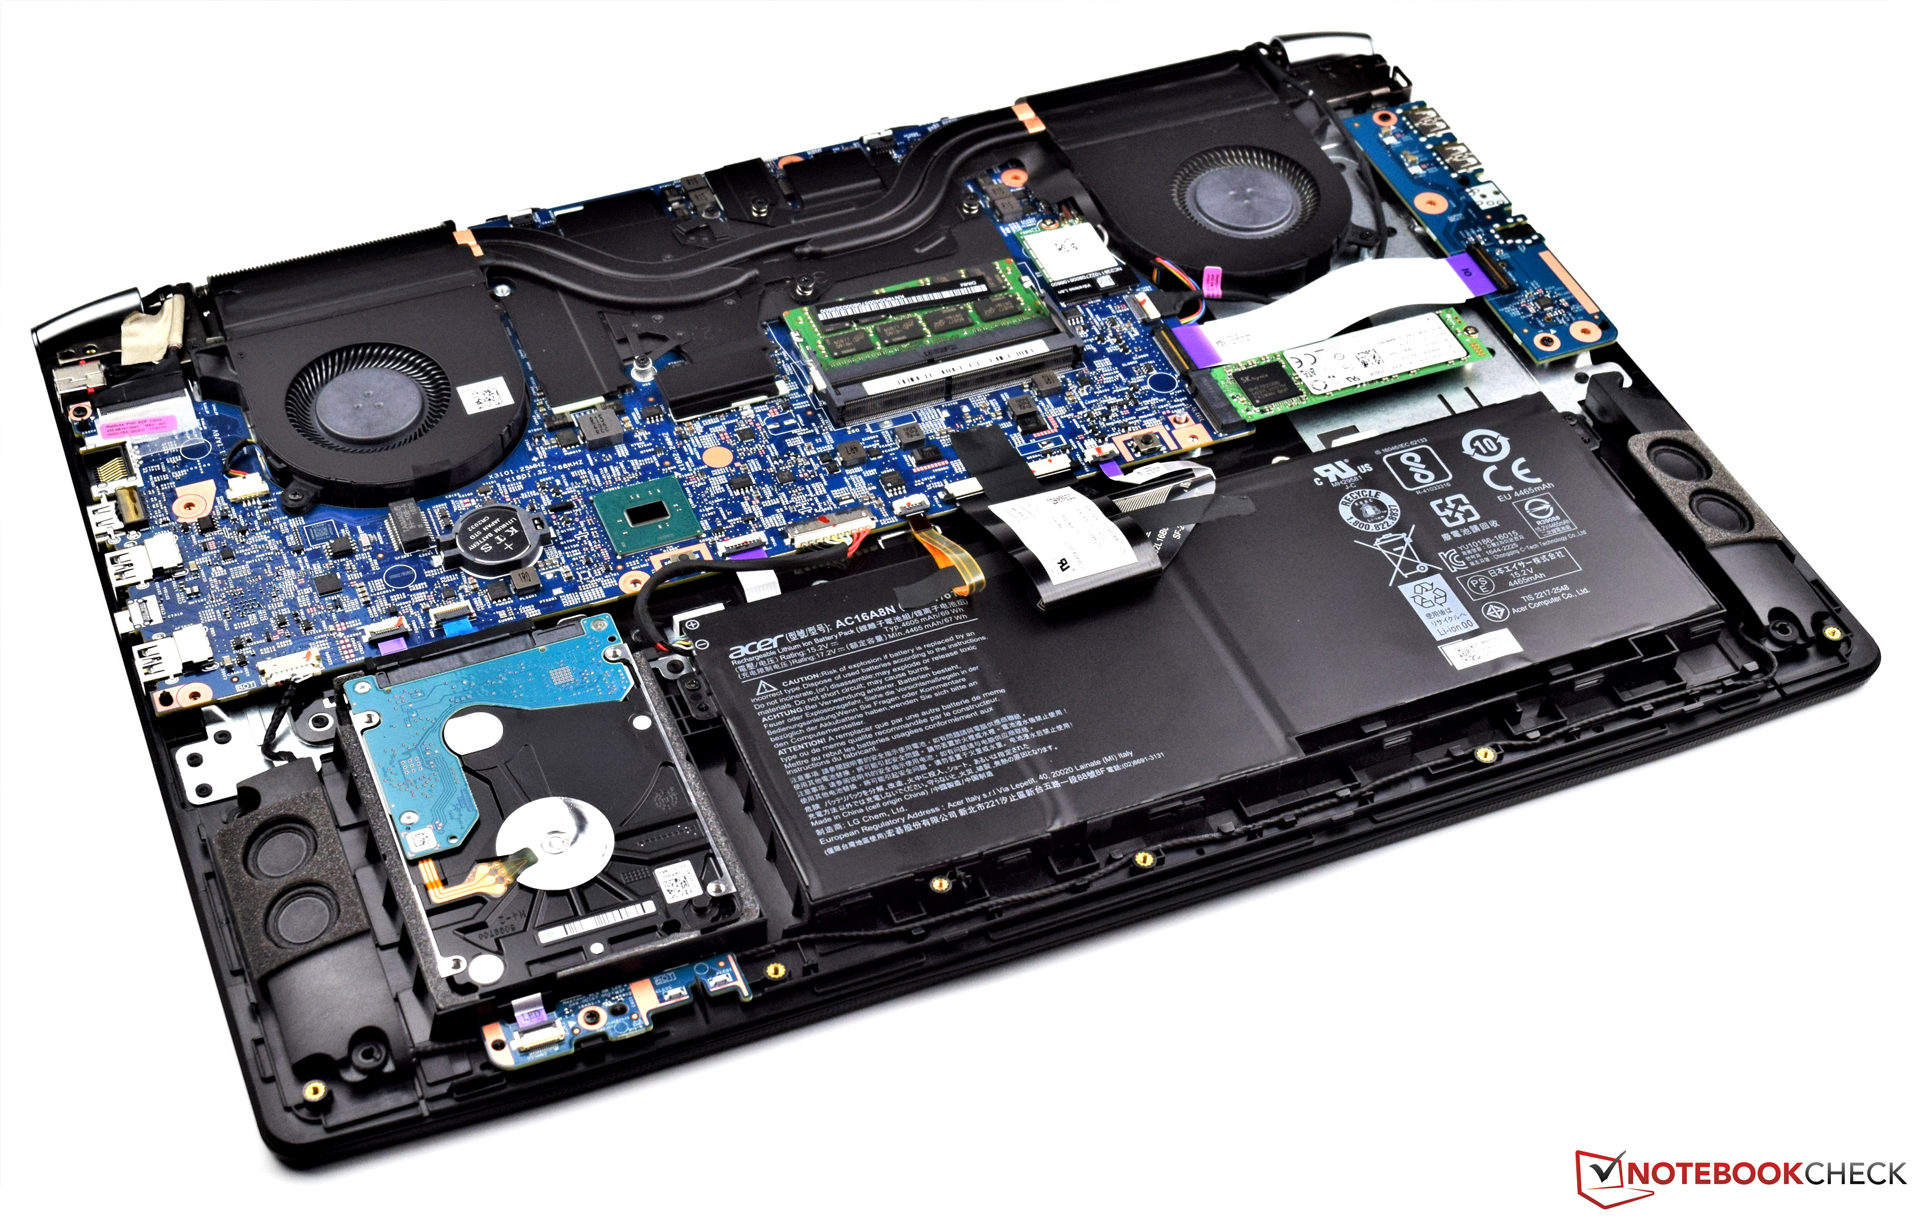
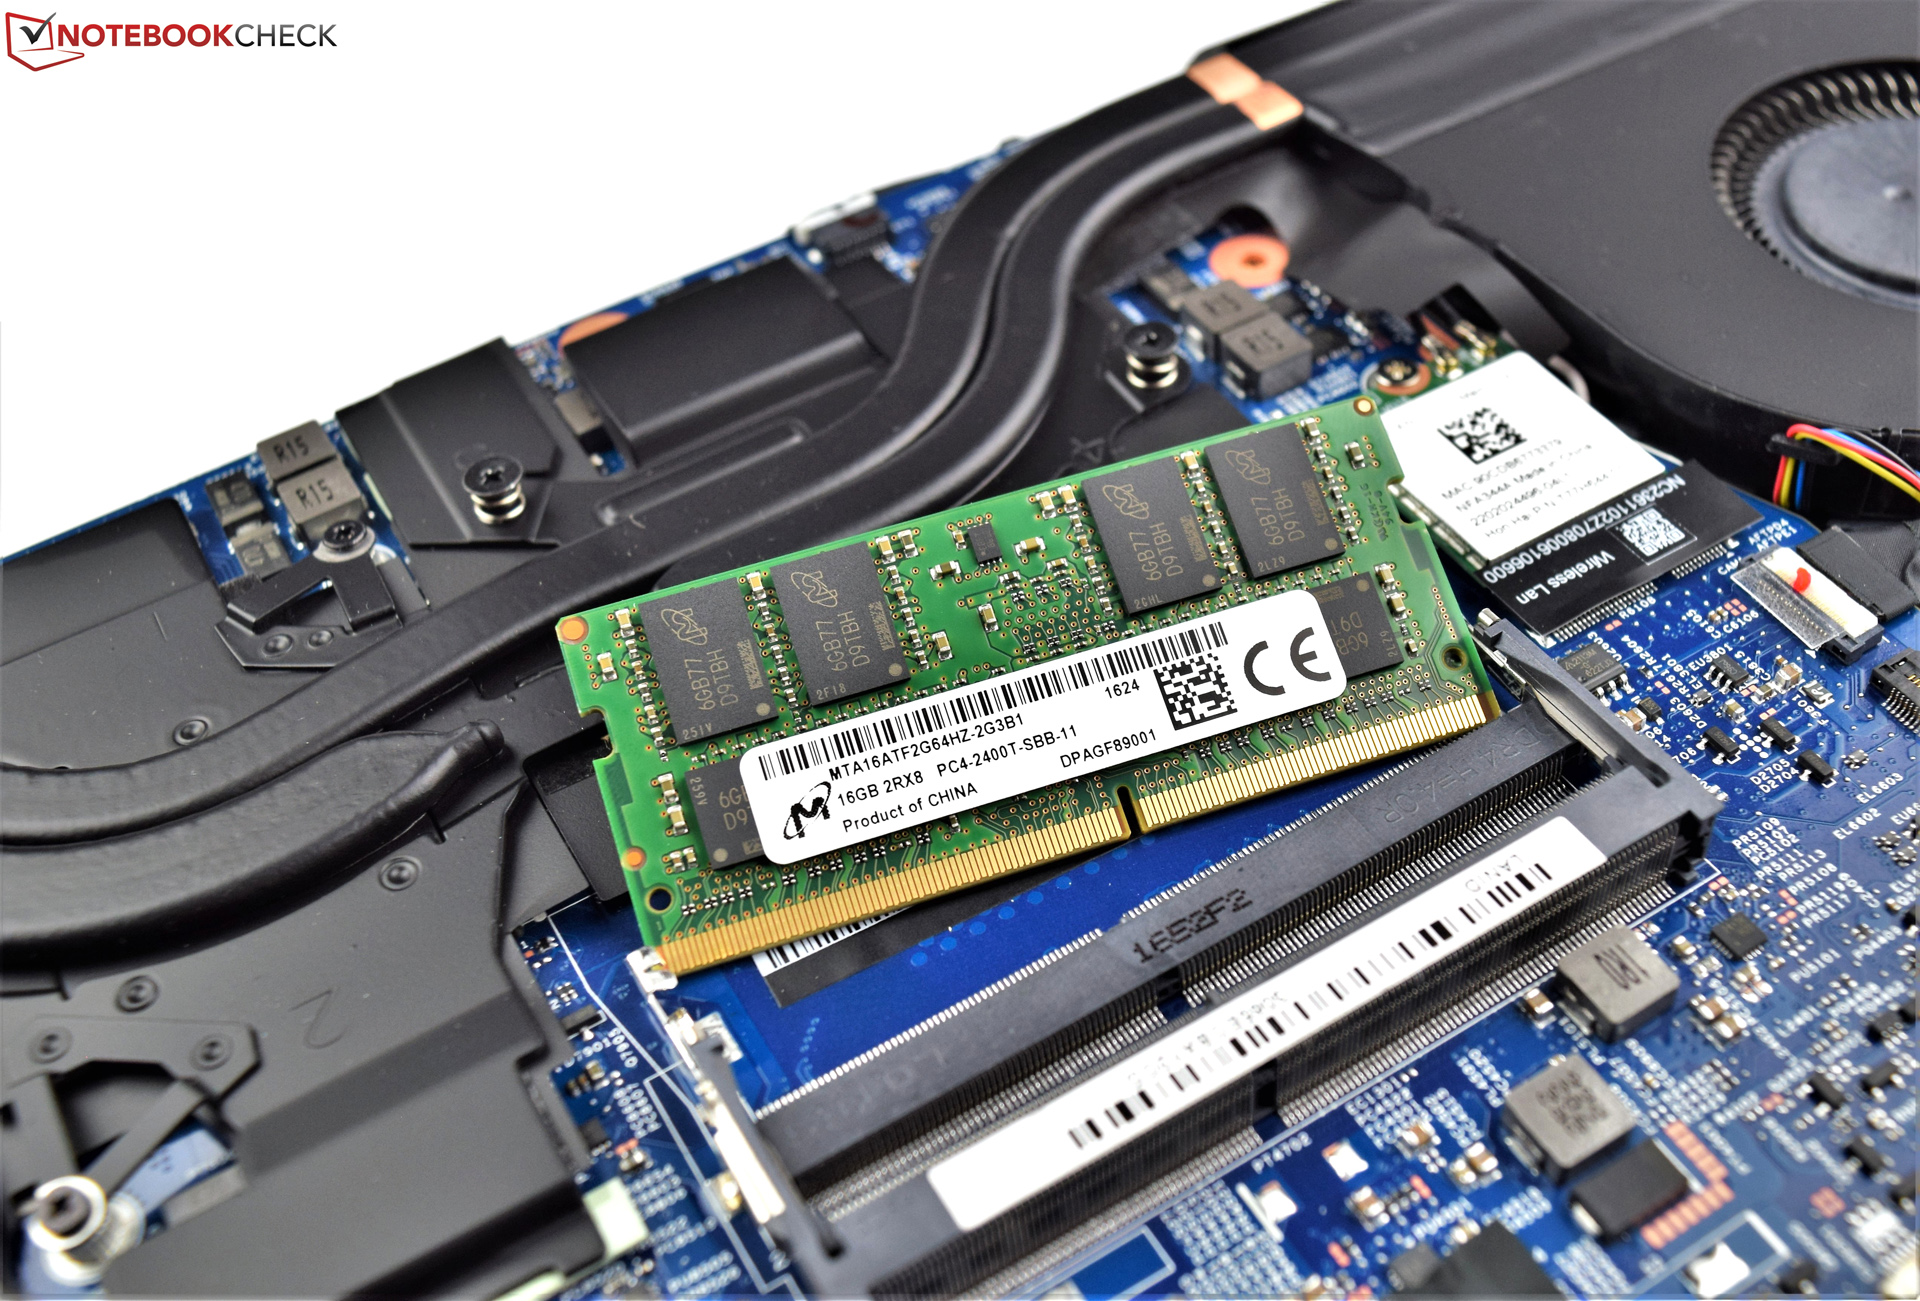
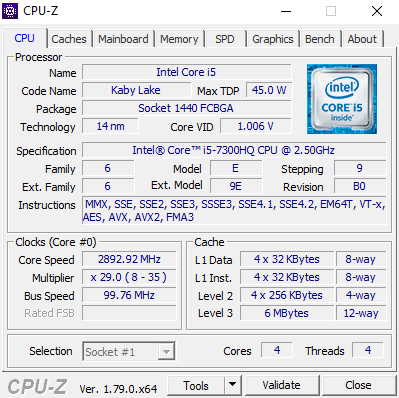
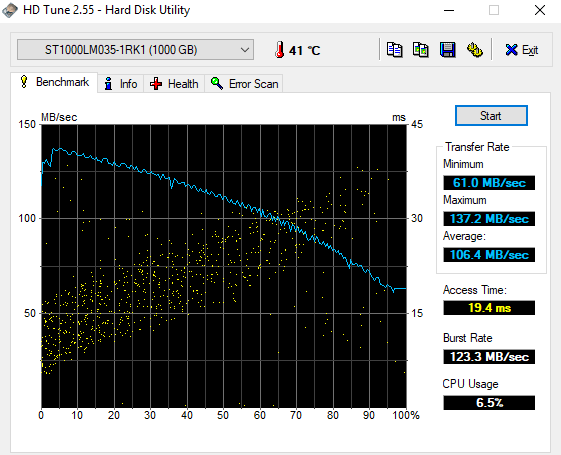
En general, el Nitro -visto desde la perspectiva de un jugón- rinde muy bien. Acer refuta la teoría de que los procesadores Core i5 no son adecuados para juegos y prueba que la tarjeta gráfica es mucho más importante. El Intel Core i5-7300HQ es un procesador de cuatro núcleos de 45 W y por tanteo no es el más eficiente de su clase. Sin embargo, al combinarlo con una buena cantidad de RAM y un almacenamiento razonablemente dimensionado (SSD + HDD) ofrece un muy buen rendimiento.
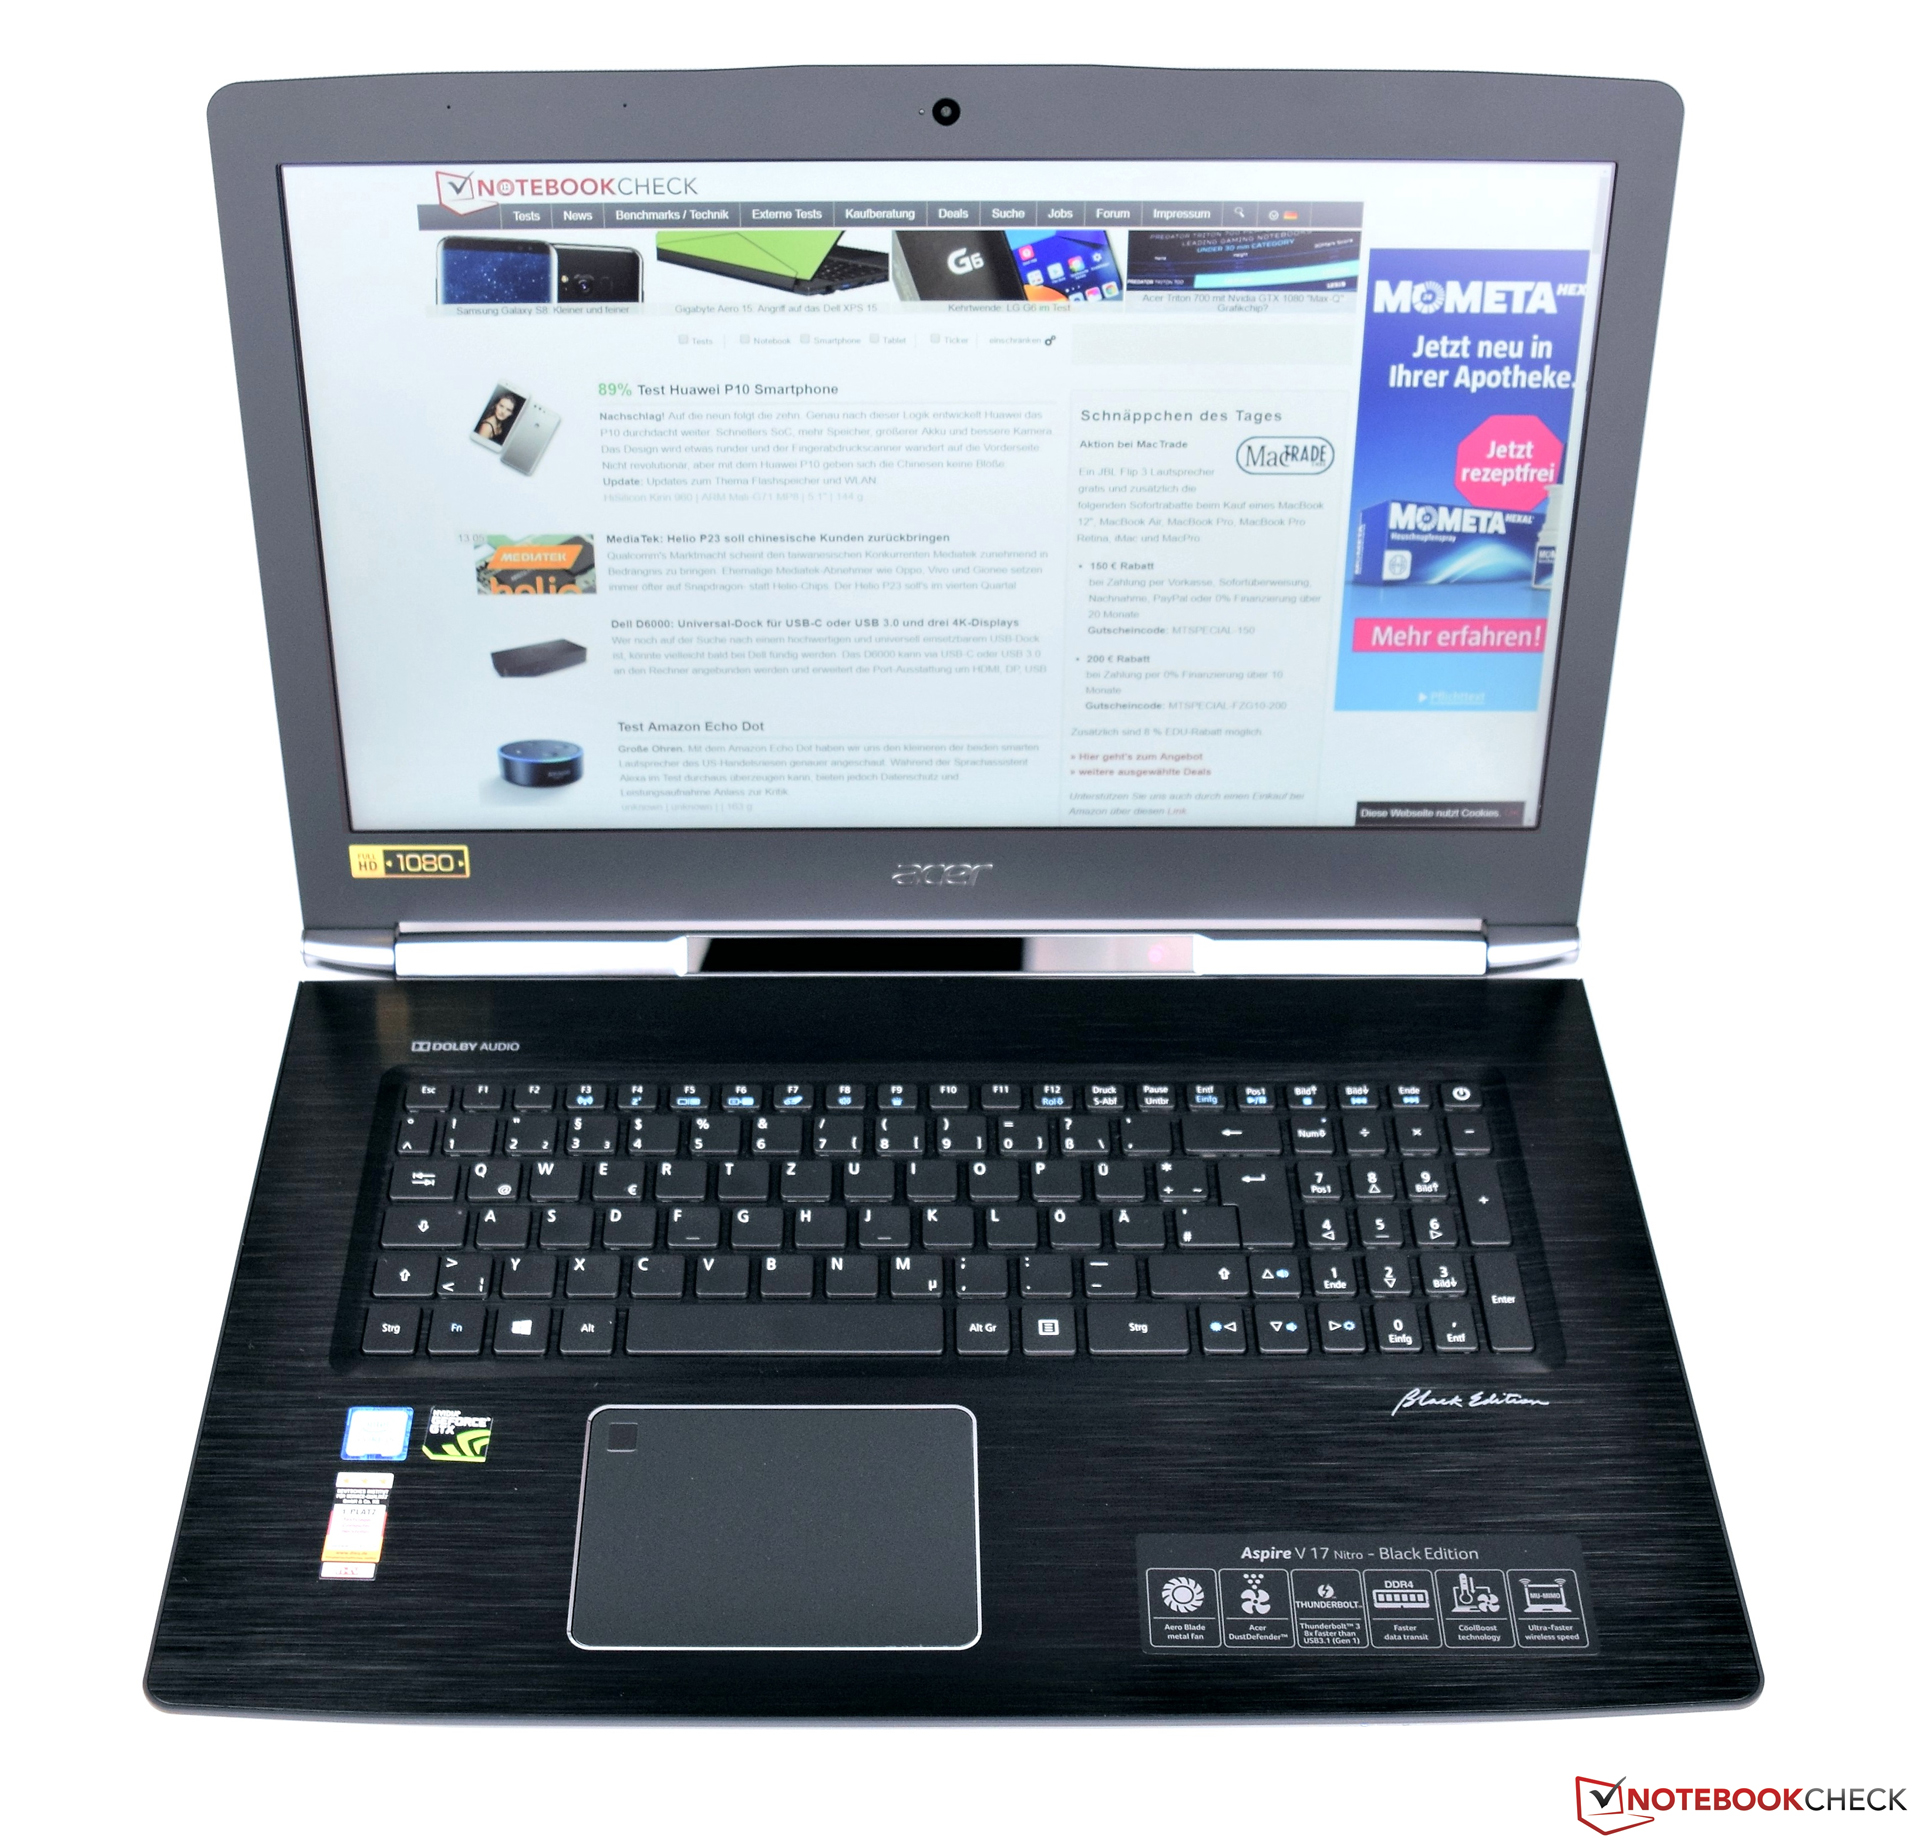
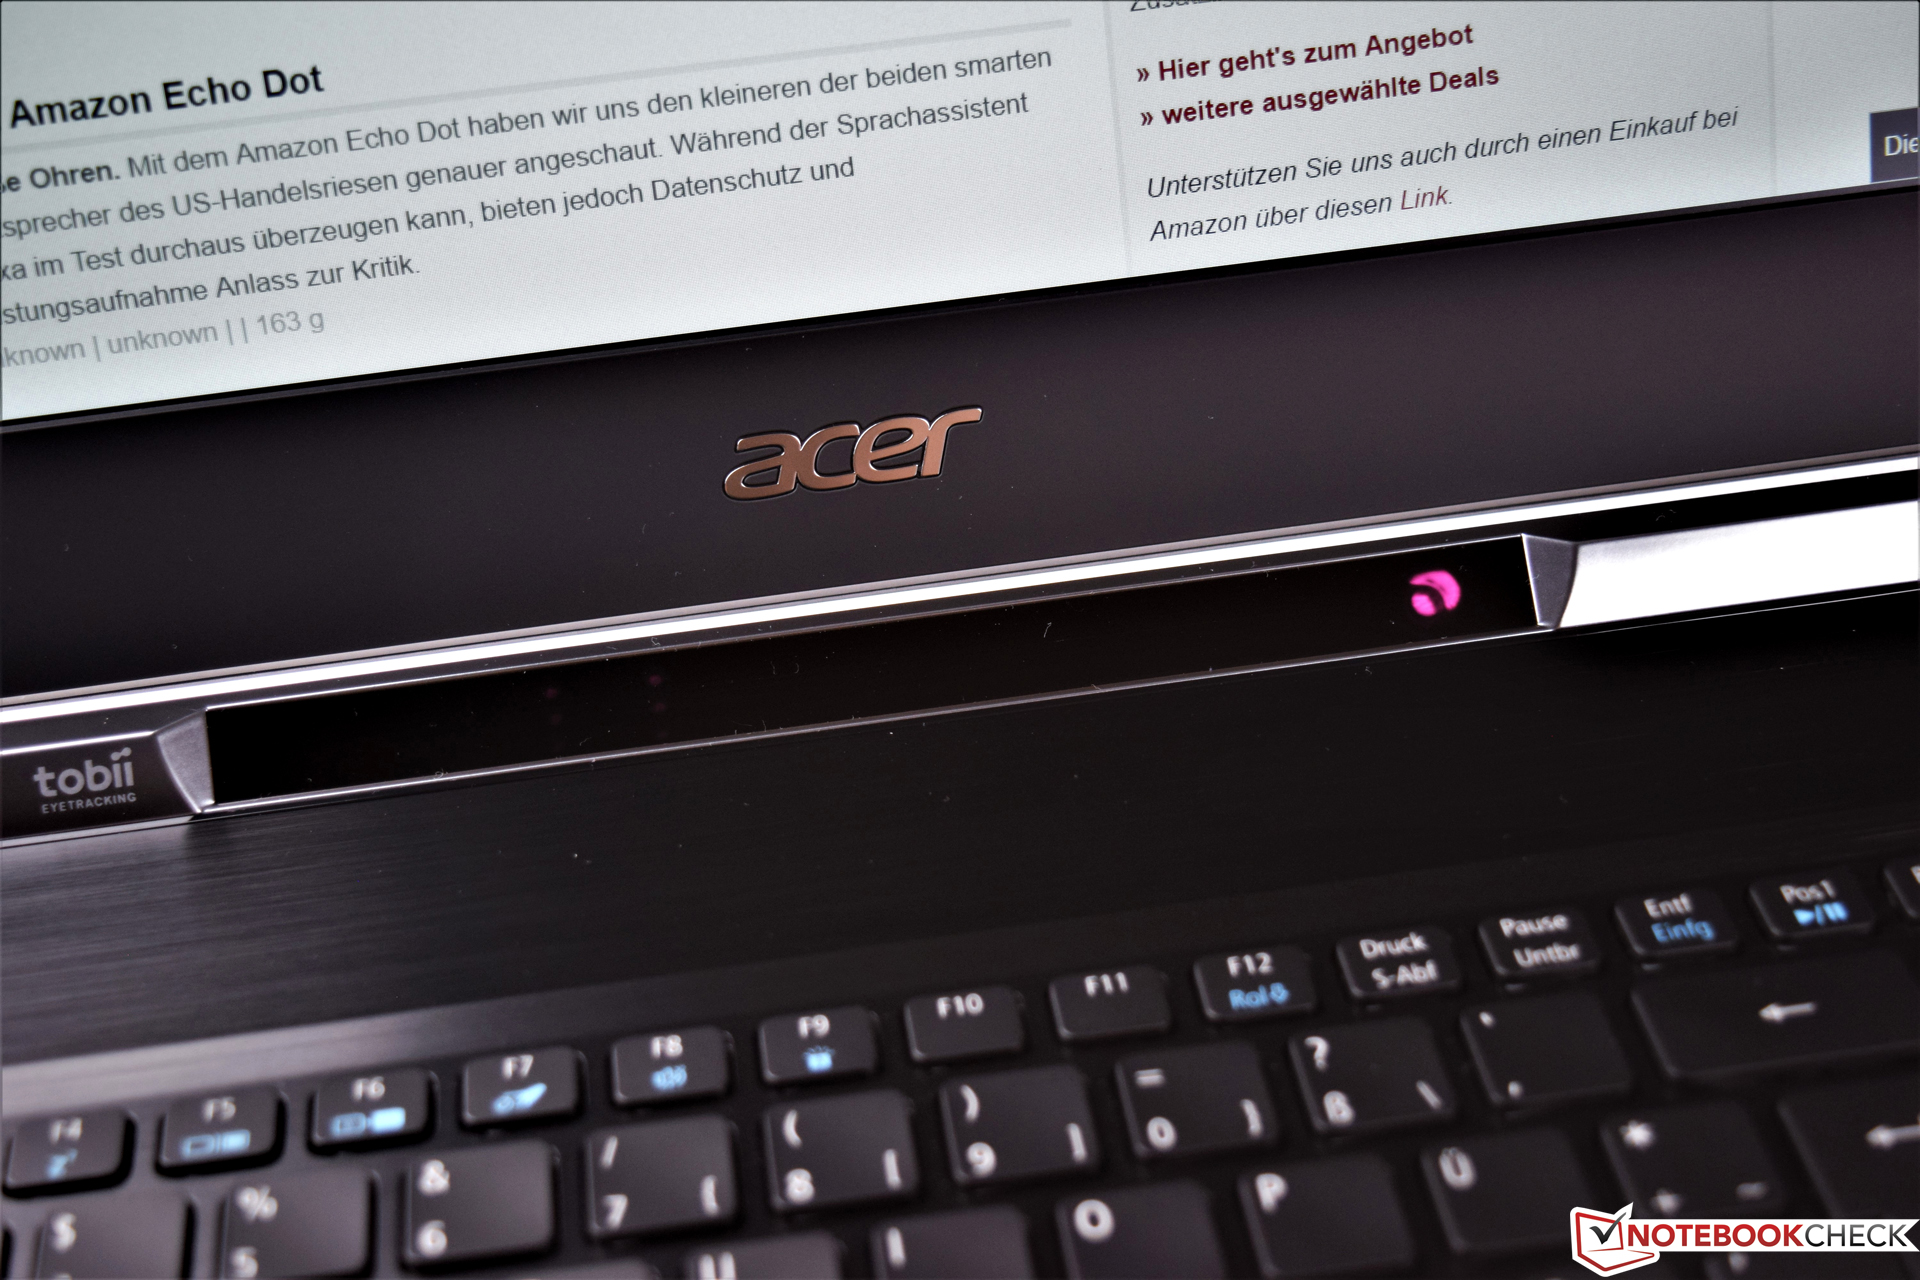
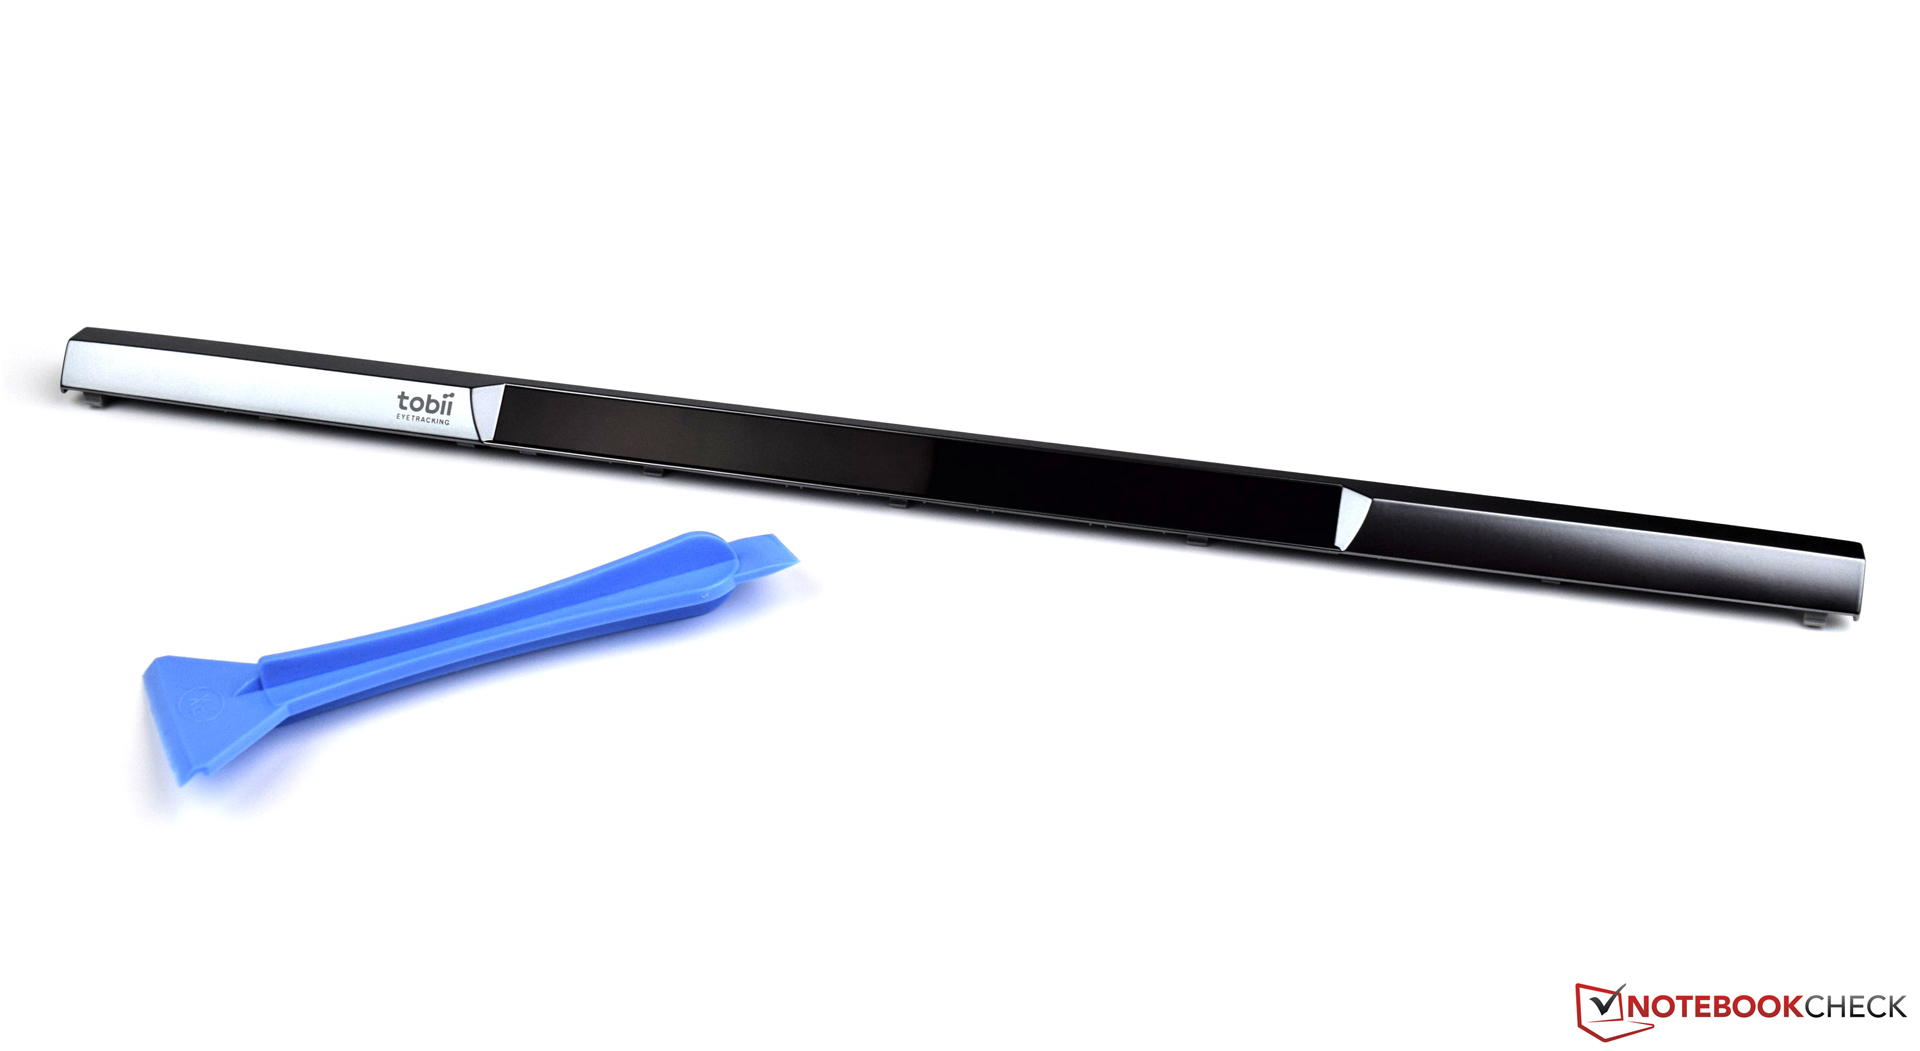
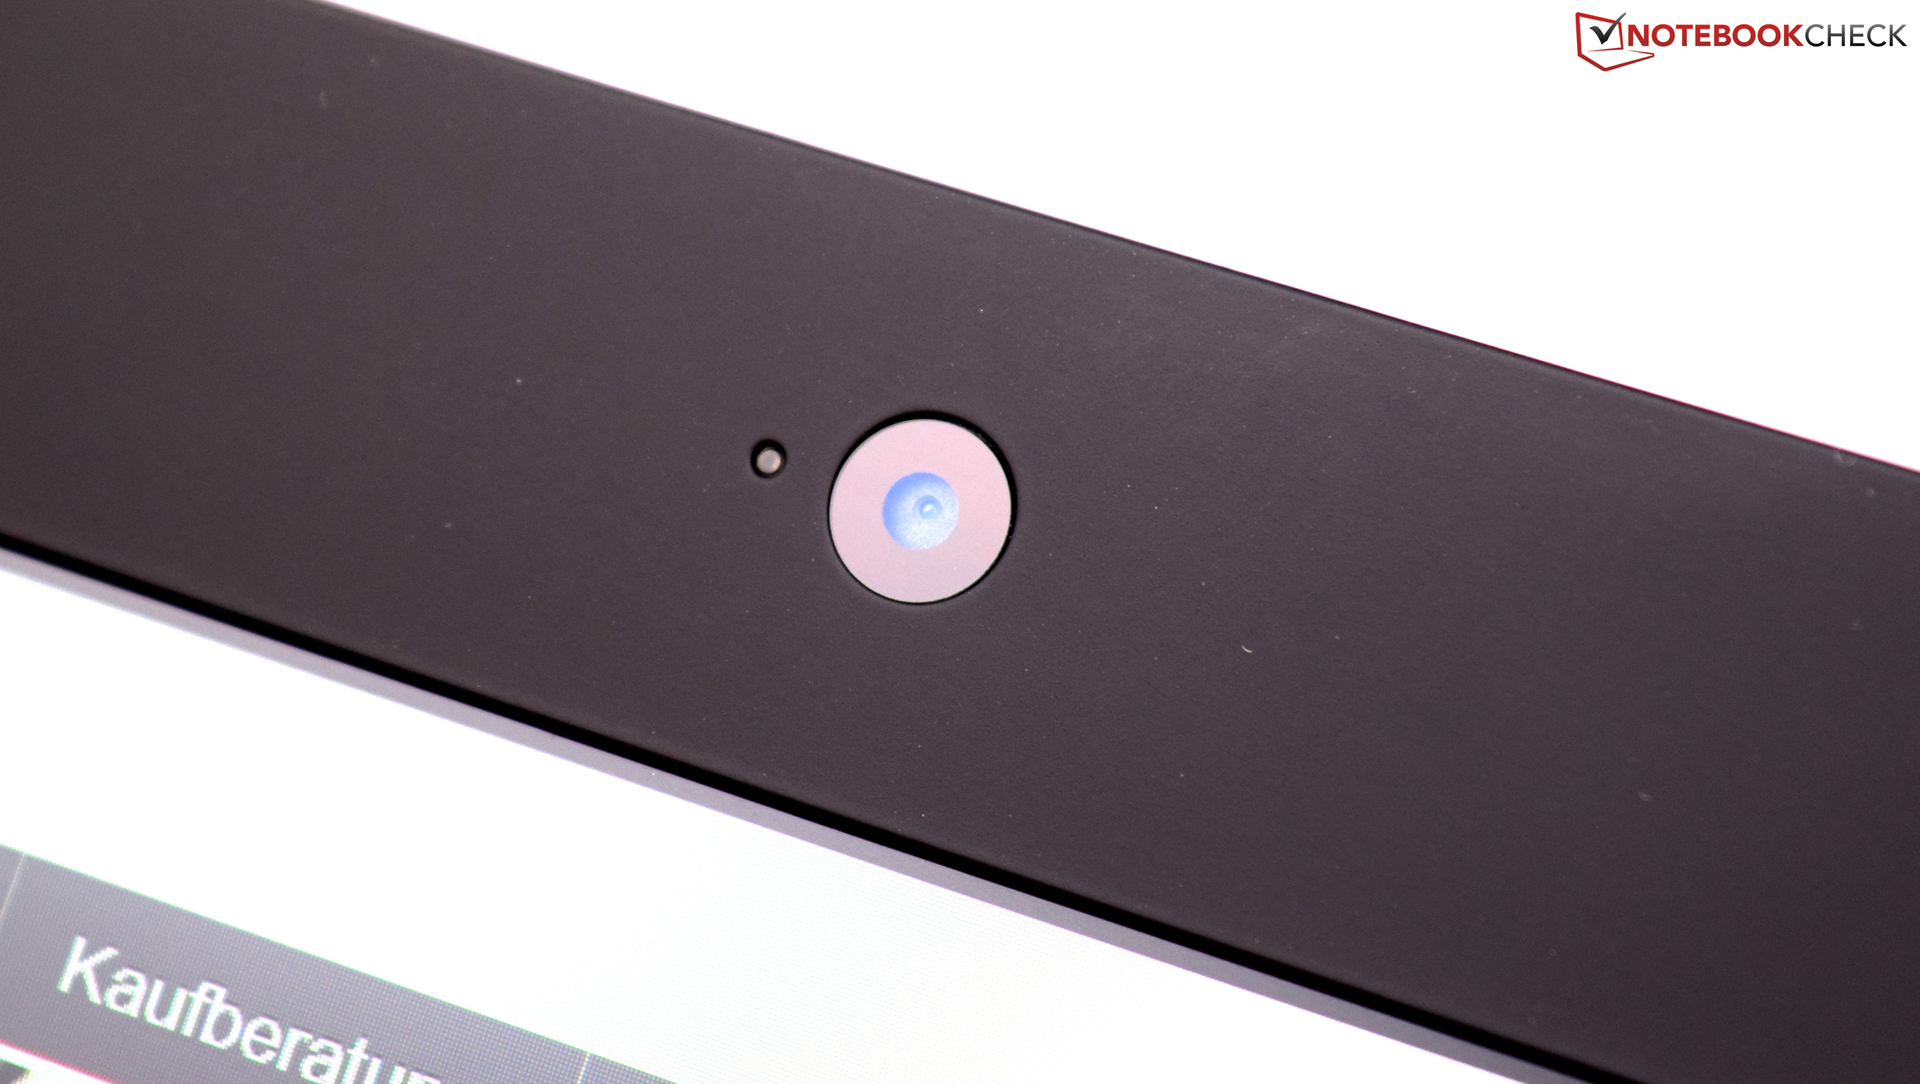
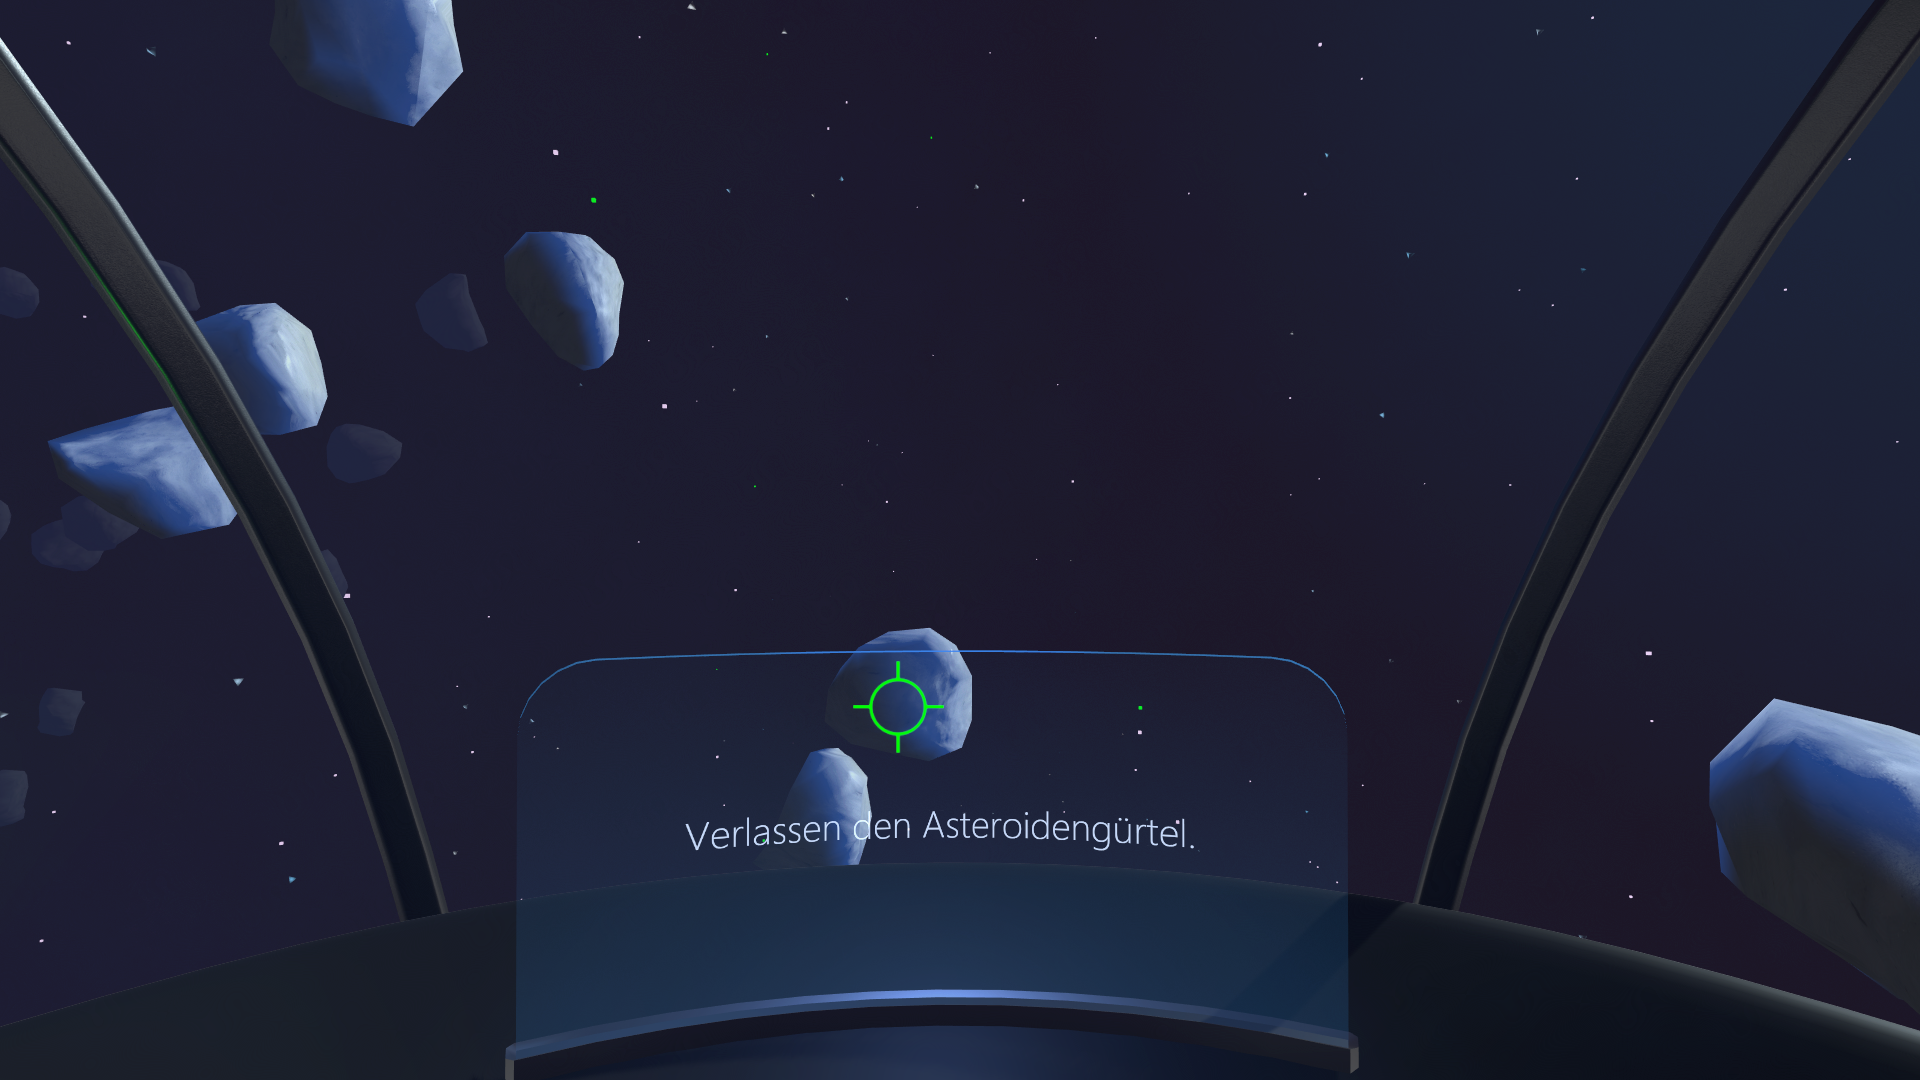
El Acer Aspire Nitro nos ha gustado gracias a un buen rendimiento y es suficientemente rápido para ejecutar sin problemas los juegos más exigentes. El módulo Tobii de seguimiento ocular es un buen añadido, y proporciona una experiencia totalmente nueva con juegos.
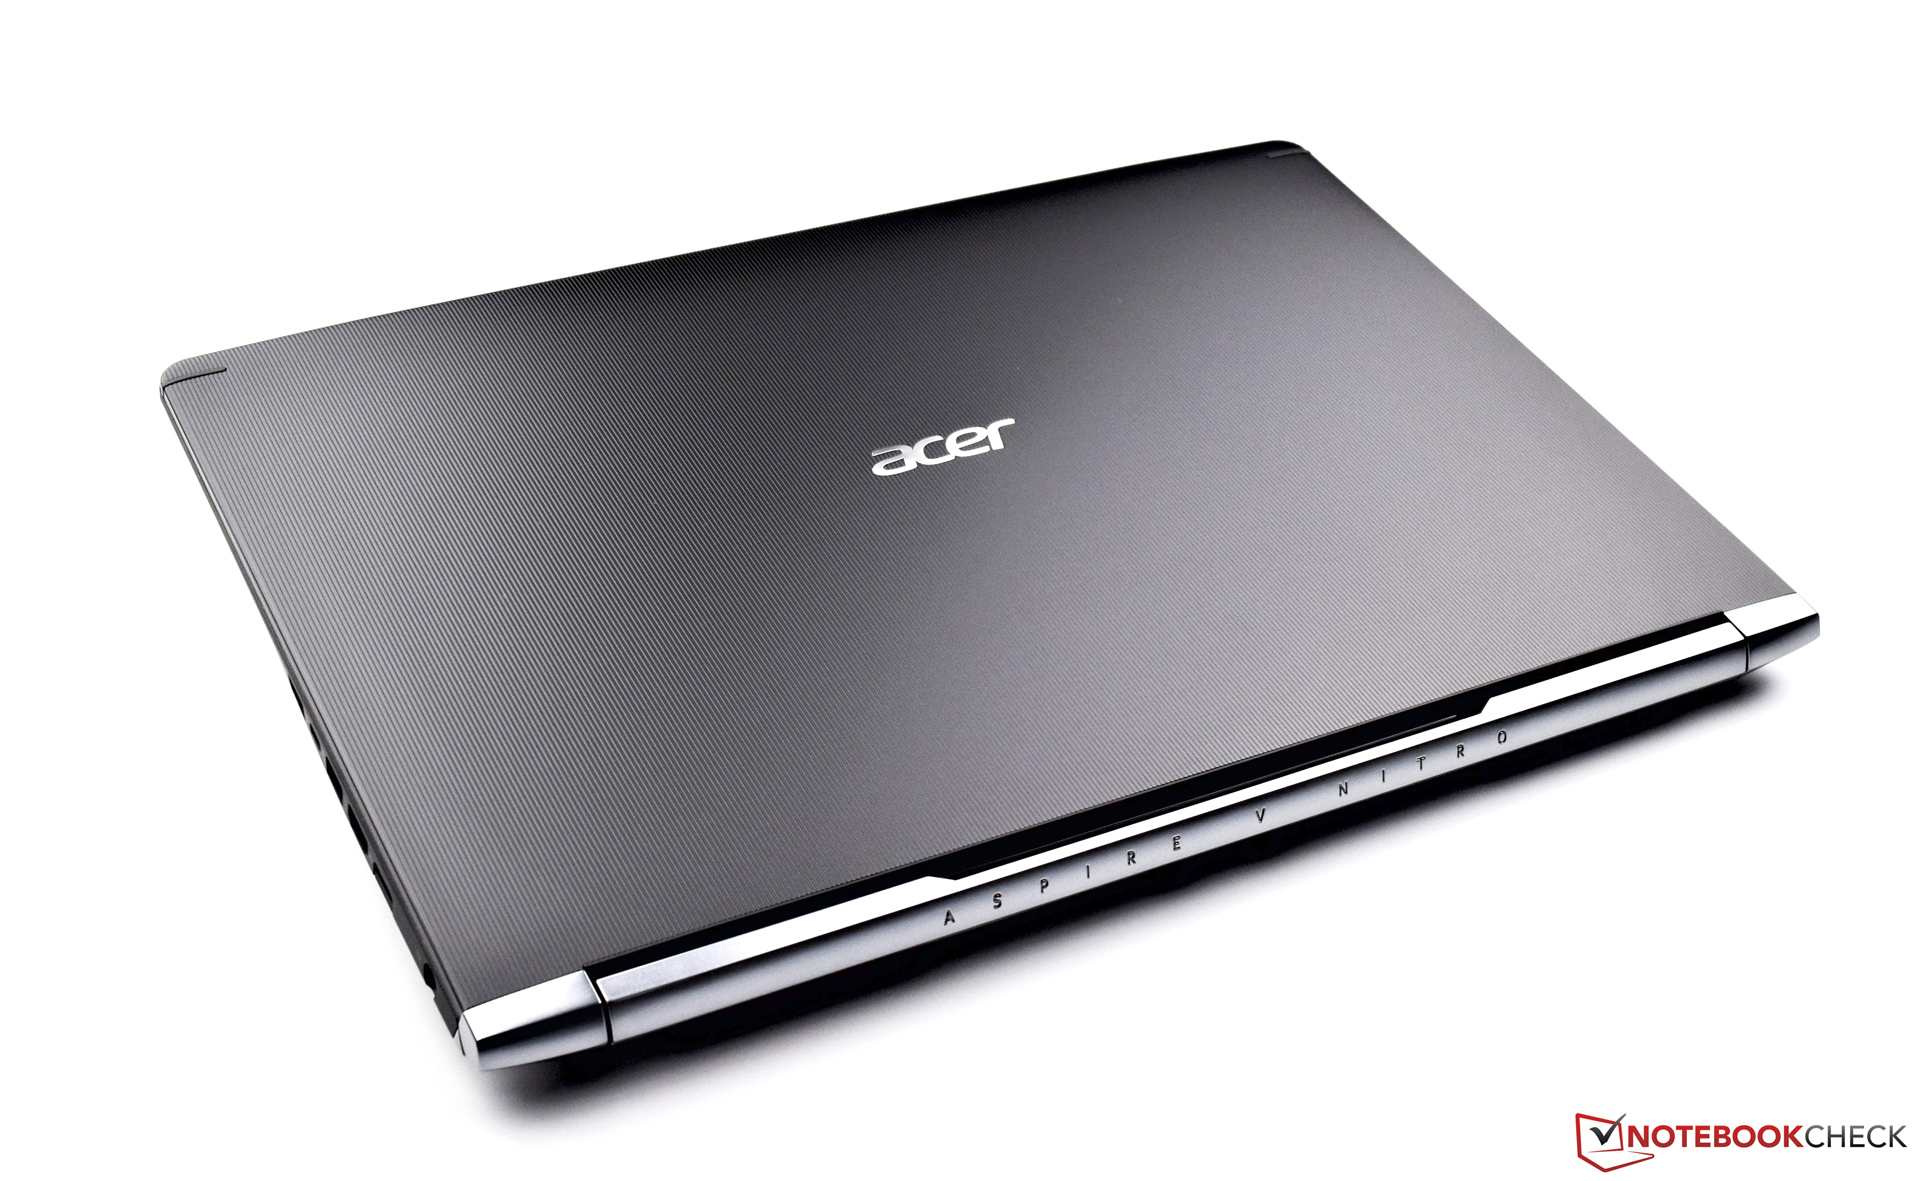
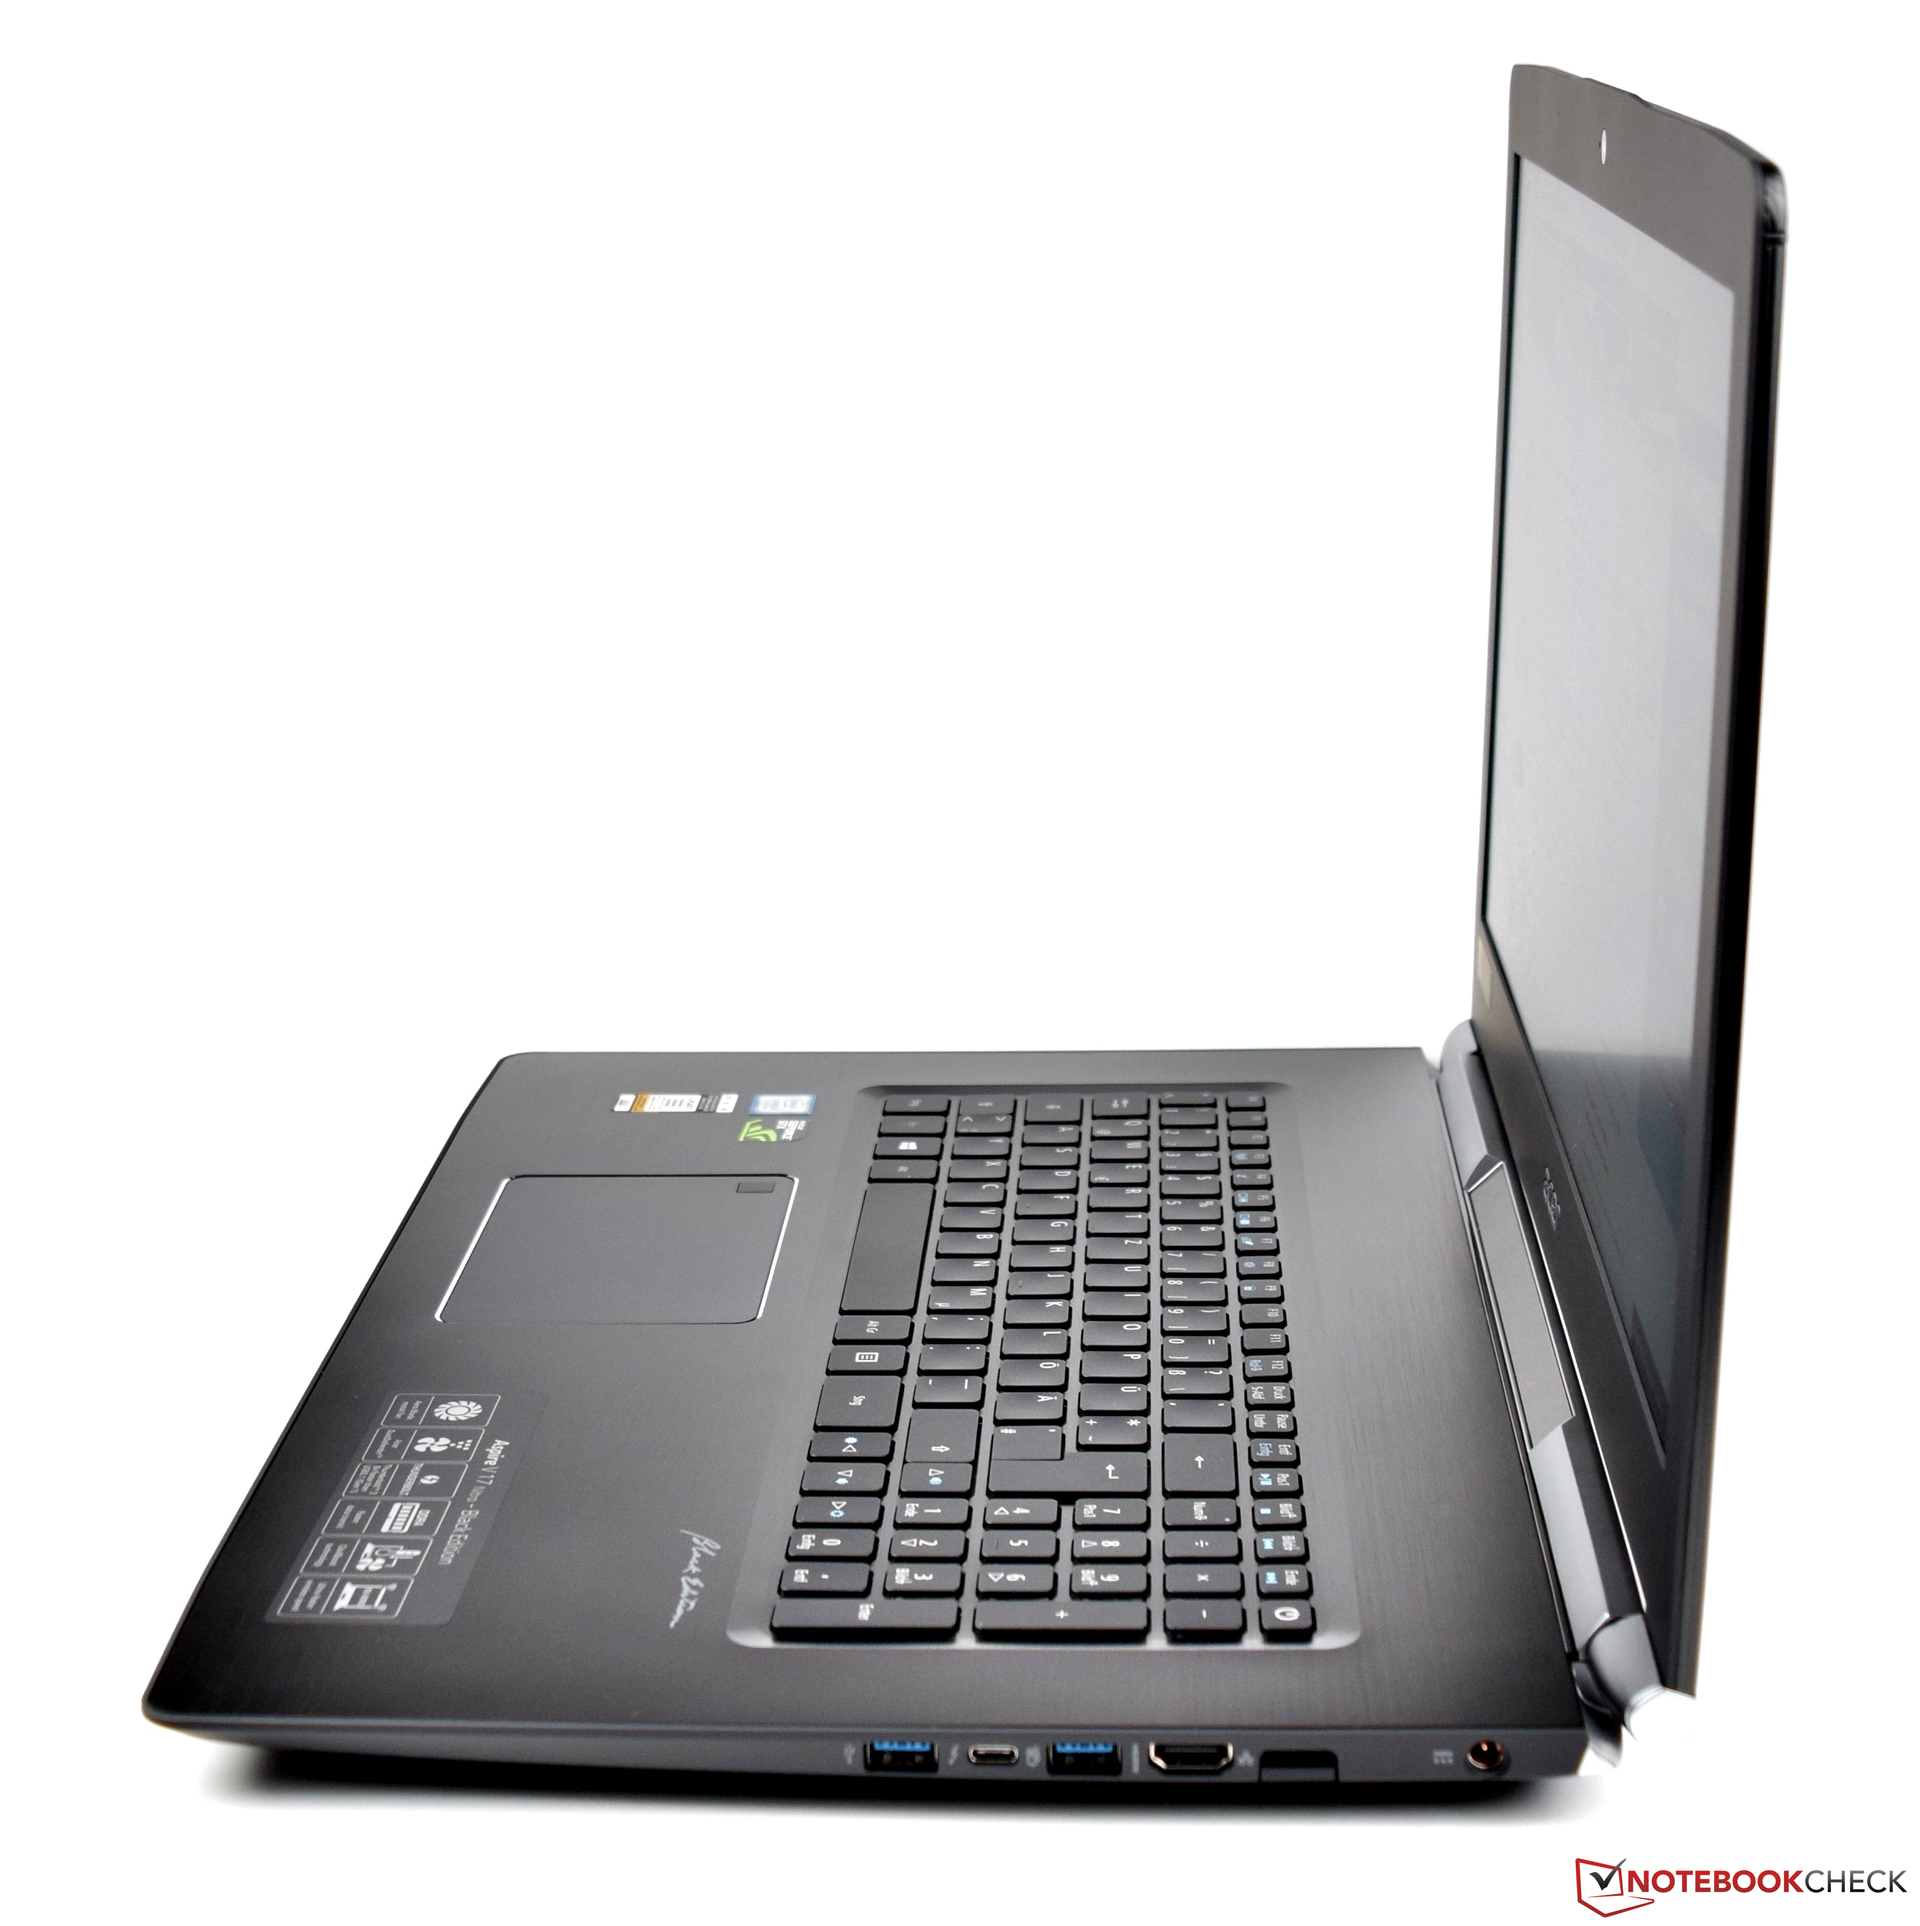
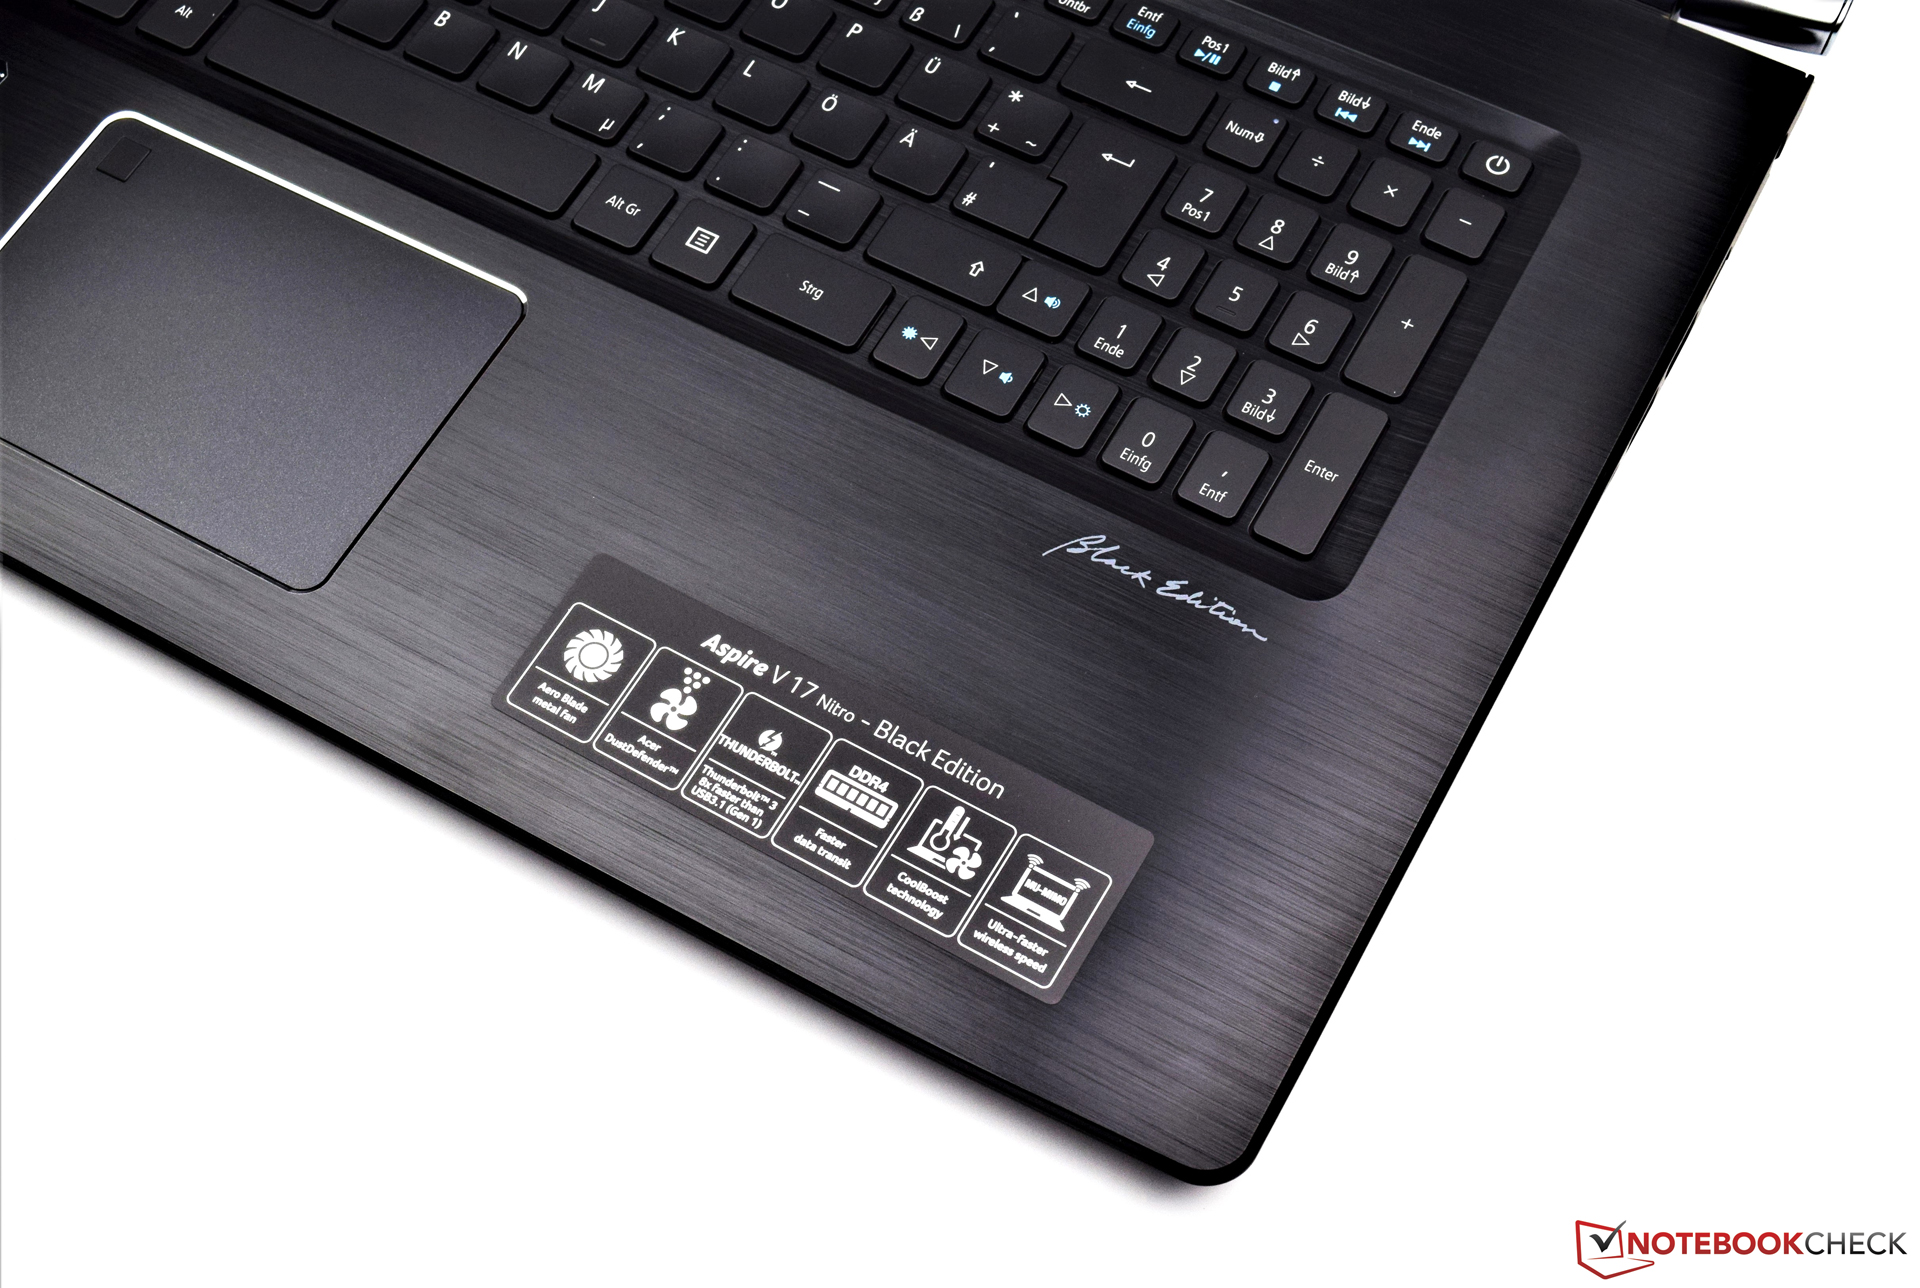
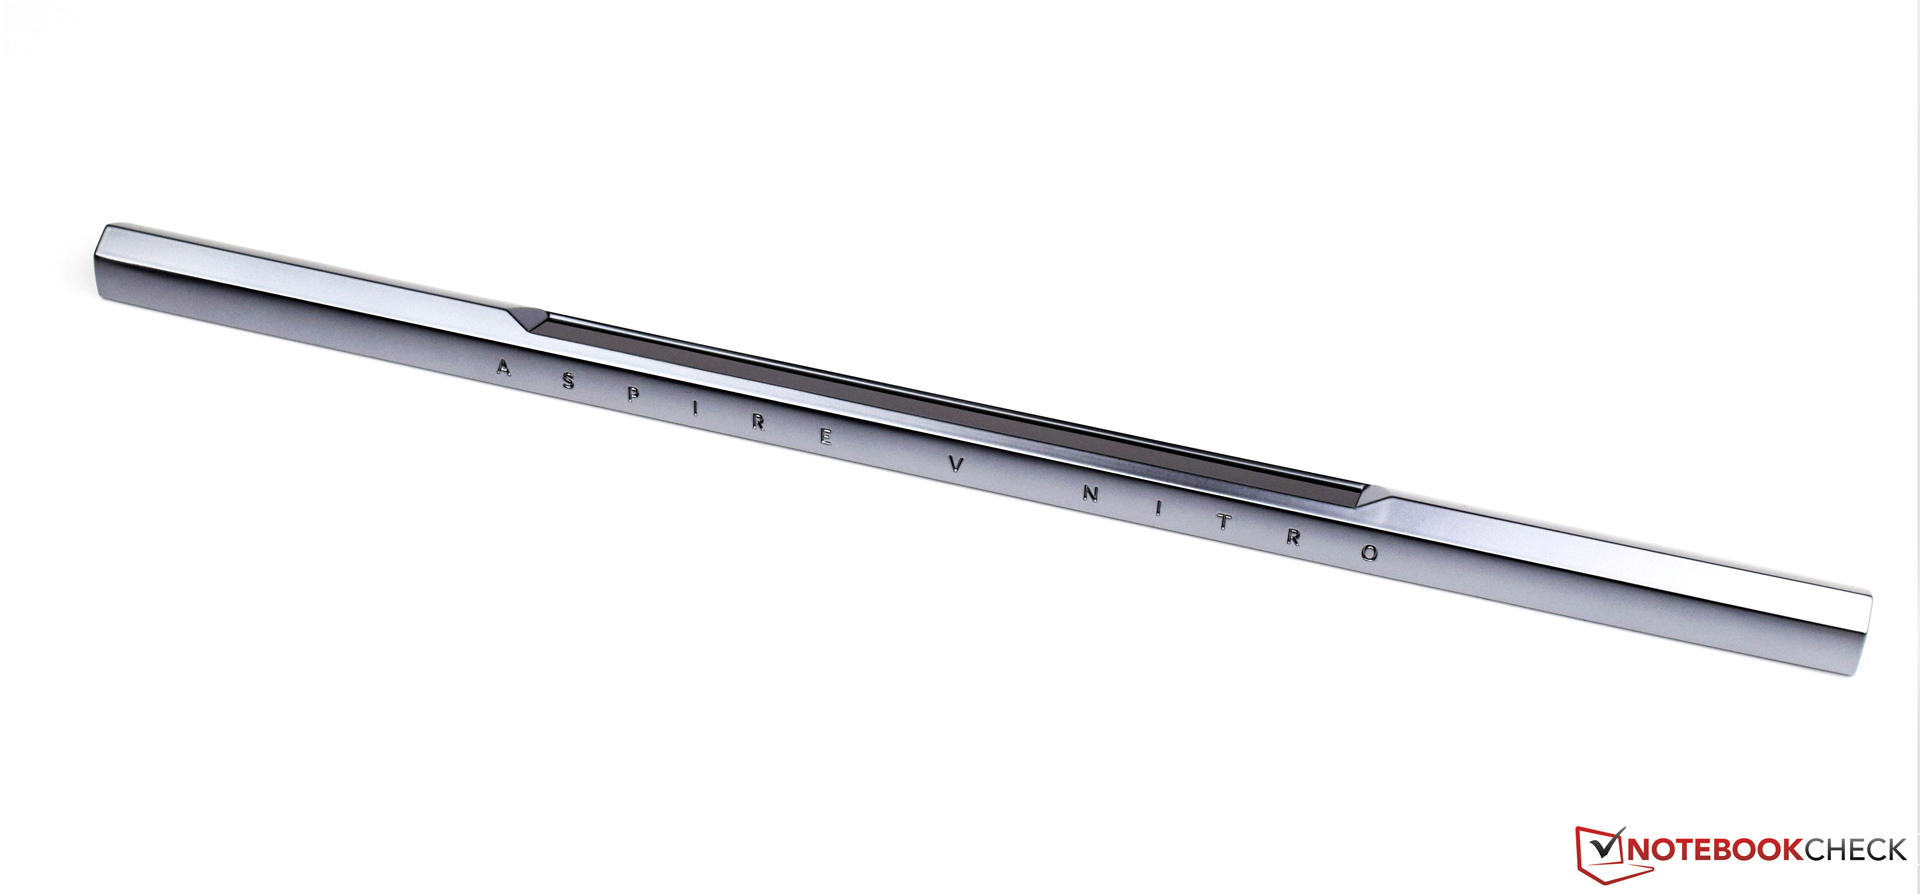
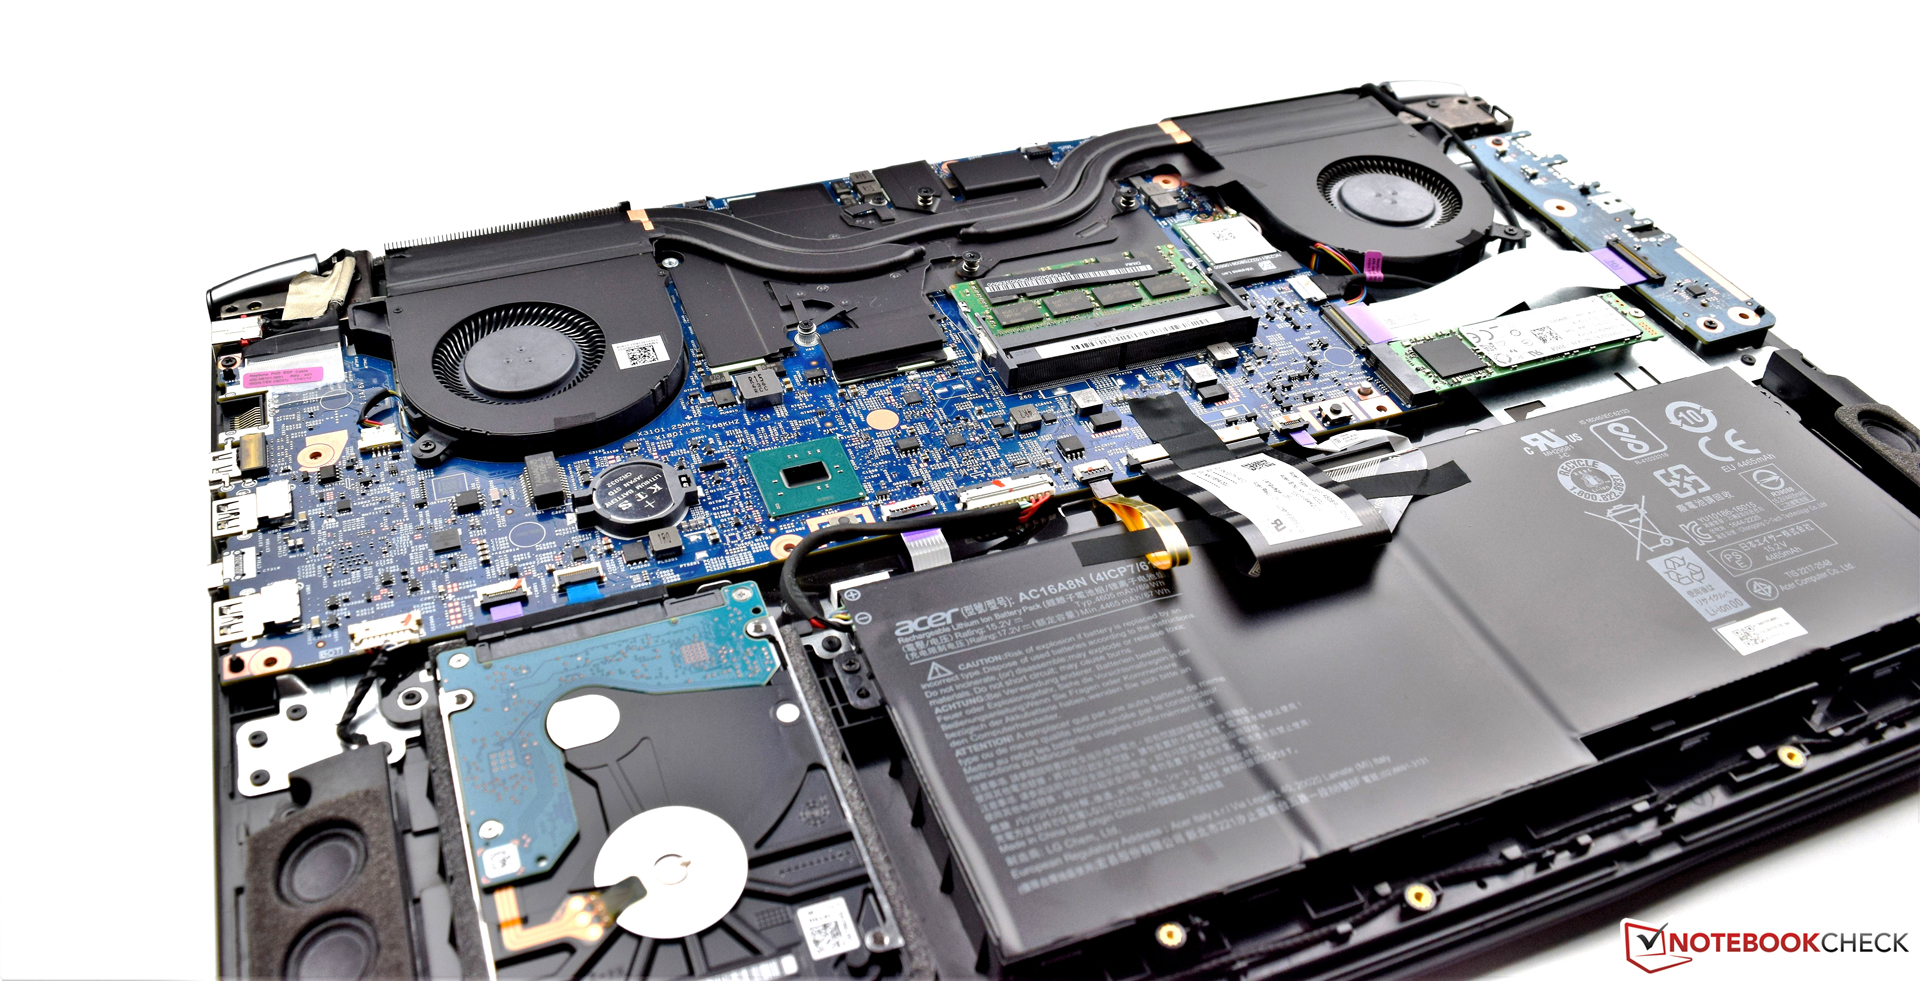
Nos ha gustado que el potente hardware se encuentre oculto tras un diseño bastante sencillo. La carcasa de alta calidad es rígida y la falta de una unidad óptica es aceptable teniendo en cuenta que el espacio sobrante se ha usado para acomodar una batería mayor. Con todo, el Acer Aspire V17 Nitro BE satisface las expectativas y su precio de alrededor de $1,800 (en Europe) está justificado.
Ésta es una versión acortada del análisis original. Puedes leer el análisis completo en inglés aquí.
Acer Aspire V17 Nitro BE VN7-793G-52XN
- 06/30/2017 v6 (old)
Sebastian Bade
Price comparison
