Breve análisis del portátil HP Pavilion 17t-ab200
| SD Card Reader | |
| average JPG Copy Test (av. of 3 runs) | |
| Gigabyte P57X v7 | |
| Asus Strix GL753VD-GC045T | |
| HP Omen 17-w100ng | |
| HP Pavilion 17 FHD V3A33AV | |
| HP Pavilion 17t-ab200 | |
| MSI GE72 7RE-046 | |
| maximum AS SSD Seq Read Test (1GB) | |
| HP Pavilion 17t-ab200 | |
| Gigabyte P57X v7 | |
| HP Omen 17-w100ng | |
| Asus Strix GL753VD-GC045T | |
| HP Pavilion 17 FHD V3A33AV | |
| MSI GE72 7RE-046 | |
| Networking | |
| iperf3 transmit AX12 | |
| Asus Strix GL753VD-GC045T | |
| HP Pavilion 17t-ab200 | |
| HP Omen 17-w100ng | |
| MSI GE72 7RE-046 | |
| iperf3 receive AX12 | |
| HP Omen 17-w100ng | |
| Asus Strix GL753VD-GC045T | |
| HP Pavilion 17t-ab200 | |
| MSI GE72 7RE-046 | |
| |||||||||||||||||||||||||
iluminación: 91 %
Brillo con batería: 278.8 cd/m²
Contraste: 996:1 (Negro: 0.28 cd/m²)
ΔE ColorChecker Calman: 5.8 | ∀{0.5-29.43 Ø4.71}
ΔE Greyscale Calman: 8.3 | ∀{0.09-98 Ø4.96}
87% sRGB (Argyll 1.6.3 3D)
57% AdobeRGB 1998 (Argyll 1.6.3 3D)
64.1% AdobeRGB 1998 (Argyll 3D)
87.6% sRGB (Argyll 3D)
65.2% Display P3 (Argyll 3D)
Gamma: 2.1
CCT: 5723 K
| HP Pavilion 17t-ab200 AUO109D, IPS, 17.3", 1920x1080 | HP Pavilion 17 FHD V3A33AV IPS, 17.3", 1920x1080 | Gigabyte P57X v7 SHP145E, IPS, 17.3", 3840x2160 | HP Omen 17-w100ng LG Philips LGD046E, IPS, 17.3", 1920x1080 | MSI GE72 7RE-046 N173HHE-G32 (CMN1747), TN LED, 17.3", 1920x1080 | |
|---|---|---|---|---|---|
| Display | 0% | 34% | 0% | 29% | |
| Display P3 Coverage (%) | 65.2 | 64.3 -1% | 87.8 35% | 67.2 3% | 90.7 39% |
| sRGB Coverage (%) | 87.6 | 88.1 1% | 100 14% | 86.6 -1% | 99.9 14% |
| AdobeRGB 1998 Coverage (%) | 64.1 | 64.4 0% | 98.9 54% | 63.3 -1% | 85.2 33% |
| Response Times | 6% | -59% | 8% | 48% | |
| Response Time Grey 50% / Grey 80% * (ms) | 36.8 | 31.2 ? 15% | 55.6 ? -51% | 35 ? 5% | 27 ? 27% |
| Response Time Black / White * (ms) | 28 | 29.2 ? -4% | 46.8 ? -67% | 25 ? 11% | 9 ? 68% |
| PWM Frequency (Hz) | 1000 ? | ||||
| Screen | 20% | 19% | 13% | 7% | |
| Brightness middle (cd/m²) | 278.8 | 327.2 17% | 441.3 58% | 342 23% | 253 -9% |
| Brightness (cd/m²) | 265 | 297 12% | 408 54% | 331 25% | 230 -13% |
| Brightness Distribution (%) | 91 | 86 -5% | 86 -5% | 84 -8% | 86 -5% |
| Black Level * (cd/m²) | 0.28 | 0.29 -4% | 0.44 -57% | 0.32 -14% | 0.24 14% |
| Contrast (:1) | 996 | 1128 13% | 1003 1% | 1069 7% | 1054 6% |
| Colorchecker dE 2000 * | 5.8 | 3.03 48% | 5.1 12% | 4.35 25% | 5.01 14% |
| Colorchecker dE 2000 max. * | 10.6 | 6.87 35% | 9.8 8% | 9.24 13% | 10.4 2% |
| Greyscale dE 2000 * | 8.3 | 1.8 78% | 4.3 48% | 3.73 55% | 7.26 13% |
| Gamma | 2.1 105% | 2.17 101% | 2.08 106% | 2.23 99% | 2.09 105% |
| CCT | 5723 114% | 6633 98% | 7345 88% | 6801 96% | 6329 103% |
| Color Space (Percent of AdobeRGB 1998) (%) | 57 | 57.2 0% | 87 53% | 57 0% | 76 33% |
| Color Space (Percent of sRGB) (%) | 87 | 87.6 1% | 100 15% | 86 -1% | 100 15% |
| Media total (Programa/Opciones) | 9% /
14% | -2% /
11% | 7% /
9% | 28% /
17% |
* ... más pequeño es mejor
Tiempos de respuesta del display
| ↔ Tiempo de respuesta de Negro a Blanco | ||
|---|---|---|
| 28 ms ... subida ↗ y bajada ↘ combinada | ↗ ms subida | 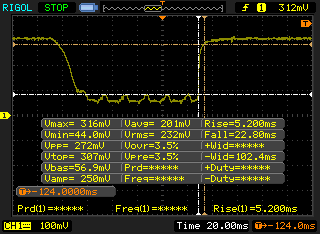 |
| ↘ ms bajada | ||
| La pantalla mostró tiempos de respuesta relativamente lentos en nuestros tests pero podría ser demasiado lenta para los jugones. En comparación, todos los dispositivos de prueba van de ##min### (mínimo) a 240 (máximo) ms. » 71 % de todos los dispositivos son mejores. Eso quiere decir que el tiempo de respuesta es peor que la media (19.8 ms) de todos los dispositivos testados. | ||
| ↔ Tiempo de respuesta 50% Gris a 80% Gris | ||
| 36.8 ms ... subida ↗ y bajada ↘ combinada | ↗ ms subida | 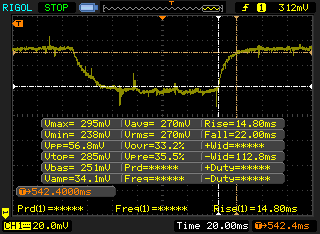 |
| ↘ ms bajada | ||
| La pantalla mostró tiempos de respuesta lentos en nuestros tests y podría ser demasiado lenta para los jugones. En comparación, todos los dispositivos de prueba van de ##min### (mínimo) a 636 (máximo) ms. » 53 % de todos los dispositivos son mejores. Eso quiere decir que el tiempo de respuesta es peor que la media (31 ms) de todos los dispositivos testados. | ||
Parpadeo de Pantalla / PWM (Pulse-Width Modulation)
| Parpadeo de Pantalla / PWM no detectado | 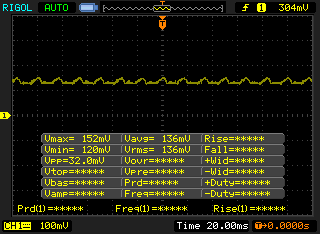 | ||
Comparación: 52 % de todos los dispositivos testados no usaron PWM para atenuar el display. Si se usó, medimos una media de 7754 (mínimo: 5 - máxmo: 343500) Hz. | |||
| Cinebench R11.5 | |
| CPU Single 64Bit | |
| Gigabyte P57X v7 | |
| HP Pavilion 17t-ab200 | |
| MSI GE72 7RE-046 | |
| HP Pavilion 17 FHD V3A33AV | |
| HP Omen 17-w100ng | |
| CPU Multi 64Bit | |
| HP Pavilion 17t-ab200 | |
| MSI GE72 7RE-046 | |
| Gigabyte P57X v7 | |
| HP Pavilion 17 FHD V3A33AV | |
| HP Omen 17-w100ng | |
| wPrime 2.10 - 1024m | |
| Gigabyte P57X v7 | |
| HP Pavilion 17t-ab200 | |
* ... más pequeño es mejor
| PCMark 8 | |
| Home Score Accelerated v2 | |
| HP Omen 17-w100ng | |
| HP Pavilion 17t-ab200 | |
| Asus Strix GL753VD-GC045T | |
| Gigabyte P57X v7 | |
| HP Pavilion 17 FHD V3A33AV | |
| Work Score Accelerated v2 | |
| HP Omen 17-w100ng | |
| HP Pavilion 17t-ab200 | |
| HP Pavilion 17 FHD V3A33AV | |
| Gigabyte P57X v7 | |
| Creative Score Accelerated v2 | |
| HP Omen 17-w100ng | |
| HP Pavilion 17t-ab200 | |
| Gigabyte P57X v7 | |
| HP Pavilion 17 FHD V3A33AV | |
| PCMark 8 Home Score Accelerated v2 | 4212 puntos | |
| PCMark 8 Creative Score Accelerated v2 | 5310 puntos | |
| PCMark 8 Work Score Accelerated v2 | 5214 puntos | |
ayuda | ||
| HP Pavilion 17t-ab200 Samsung CM871a MZNTY128HDHP | HP Pavilion 17 FHD V3A33AV SanDisk Z400s SD8SNAT-128G | Gigabyte P57X v7 Transcend MTS800 256GB M.2 (TS256GMTS800) | HP Omen 17-w100ng SanDisk Z400s SD8SNAT-128G | MSI GE72 7RE-046 Toshiba HG6 THNSNJ256G8NY | |
|---|---|---|---|---|---|
| CrystalDiskMark 3.0 | -13% | 25% | -14% | 53% | |
| Read Seq (MB/s) | 520 | 517 -1% | 517 -1% | 495 -5% | 540 4% |
| Write Seq (MB/s) | 353.6 | 185.1 -48% | 305.7 -14% | 180.2 -49% | 495.7 40% |
| Read 512 (MB/s) | 376.2 | 319.3 -15% | 315 -16% | 315.5 -16% | 455.1 21% |
| Write 512 (MB/s) | 118.5 | 179.5 51% | 306.1 158% | 172.4 45% | 481.4 306% |
| Read 4k (MB/s) | 32.7 | 20.99 -36% | 26.04 -20% | 20.25 -38% | 22.7 -31% |
| Write 4k (MB/s) | 85.3 | 68.3 -20% | 82.3 -4% | 76.1 -11% | 112.9 32% |
| Read 4k QD32 (MB/s) | 399 | 144.6 -64% | 281.3 -29% | 141.6 -65% | 372.5 -7% |
| Write 4k QD32 (MB/s) | 132.5 | 169.8 28% | 296 123% | 170.8 29% | 212.9 61% |

| 3DMark | |
| 1280x720 Cloud Gate Standard Graphics | |
| Gigabyte P57X v7 | |
| HP Omen 17-w100ng | |
| MSI GE72 7RE-046 | |
| HP Pavilion 17t-ab200 | |
| Asus Strix GL753VD-GC045T | |
| HP Pavilion 17 FHD V3A33AV | |
| Acer Aspire V17 Nitro BE VN7-793G-706L | |
| 1920x1080 Fire Strike Graphics | |
| Gigabyte P57X v7 | |
| HP Omen 17-w100ng | |
| Acer Aspire V17 Nitro BE VN7-793G-706L | |
| MSI GE72 7RE-046 | |
| HP Pavilion 17t-ab200 | |
| Asus Strix GL753VD-GC045T | |
| Asus Strix GL753VD-GC045T | |
| HP Pavilion 17 FHD V3A33AV | |
| 1920x1080 Ice Storm Extreme Graphics | |
| HP Omen 17-w100ng | |
| Gigabyte P57X v7 | |
| HP Pavilion 17 FHD V3A33AV | |
| 3DMark 06 Standard Score | 27027 puntos | |
| 3DMark 11 Performance | 7794 puntos | |
| 3DMark Ice Storm Standard Score | 82555 puntos | |
| 3DMark Cloud Gate Standard Score | 19749 puntos | |
| 3DMark Fire Strike Score | 5415 puntos | |
| 3DMark Fire Strike Extreme Score | 2675 puntos | |
ayuda | ||
| BioShock Infinite | |
| 1280x720 Very Low Preset (ordenar por valor) | |
| HP Pavilion 17t-ab200 | |
| HP Omen 17-w100ng | |
| 1366x768 Medium Preset (ordenar por valor) | |
| HP Pavilion 17t-ab200 | |
| HP Omen 17-w100ng | |
| 1366x768 High Preset (ordenar por valor) | |
| HP Pavilion 17t-ab200 | |
| HP Pavilion 17 FHD V3A33AV | |
| HP Omen 17-w100ng | |
| 1920x1080 Ultra Preset, DX11 (DDOF) (ordenar por valor) | |
| HP Pavilion 17t-ab200 | |
| HP Pavilion 17 FHD V3A33AV | |
| Gigabyte P57X v7 | |
| HP Omen 17-w100ng | |
| Mafia 2 - 1920x1080 high AA:0x AF:16x (ordenar por valor) | |
| HP Pavilion 17t-ab200 | |
| Gigabyte P57X v7 | |
| Batman: Arkham Knight | |
| 1920x1080 High / On (Interactive Smoke & Paper Debris Off) AA:SM AF:8x (ordenar por valor) | |
| HP Pavilion 17t-ab200 | |
| HP Pavilion 17 FHD V3A33AV | |
| MSI GE72 7RE-046 | |
| 1920x1080 High / On AA:SM AF:16x (ordenar por valor) | |
| HP Pavilion 17t-ab200 | |
| HP Pavilion 17 FHD V3A33AV | |
| MSI GE72 7RE-046 | |
| Fallout 4 | |
| 1280x720 Low Preset AA:FX (ordenar por valor) | |
| HP Pavilion 17t-ab200 | |
| Asus Strix GL753VD-GC045T | |
| Acer Aspire V17 Nitro BE VN7-793G-706L | |
| 1366x768 Medium Preset AA:T AF:16x (ordenar por valor) | |
| HP Pavilion 17t-ab200 | |
| Asus Strix GL753VD-GC045T | |
| Acer Aspire V17 Nitro BE VN7-793G-706L | |
| 1920x1080 High Preset AA:T AF:16x (ordenar por valor) | |
| HP Pavilion 17t-ab200 | |
| HP Pavilion 17 FHD V3A33AV | |
| MSI GE72 7RE-046 | |
| Asus Strix GL753VD-GC045T | |
| Acer Aspire V17 Nitro BE VN7-793G-706L | |
| 1920x1080 Ultra Preset AA:T AF:16x (ordenar por valor) | |
| HP Pavilion 17t-ab200 | |
| HP Pavilion 17 FHD V3A33AV | |
| MSI GE72 7RE-046 | |
| Asus Strix GL753VD-GC045T | |
| Acer Aspire V17 Nitro BE VN7-793G-706L | |
| Rise of the Tomb Raider | |
| 1024x768 Lowest Preset (ordenar por valor) | |
| HP Pavilion 17t-ab200 | |
| Asus Strix GL753VD-GC045T | |
| Acer Aspire V17 Nitro BE VN7-793G-706L | |
| 1366x768 Medium Preset AF:2x (ordenar por valor) | |
| HP Pavilion 17t-ab200 | |
| Asus Strix GL753VD-GC045T | |
| Acer Aspire V17 Nitro BE VN7-793G-706L | |
| 1920x1080 High Preset AA:FX AF:4x (ordenar por valor) | |
| HP Pavilion 17t-ab200 | |
| HP Pavilion 17 FHD V3A33AV | |
| MSI GE72 7RE-046 | |
| Asus Strix GL753VD-GC045T | |
| Acer Aspire V17 Nitro BE VN7-793G-706L | |
| 1920x1080 Very High Preset AA:FX AF:16x (ordenar por valor) | |
| HP Pavilion 17t-ab200 | |
| HP Pavilion 17 FHD V3A33AV | |
| MSI GE72 7RE-046 | |
| Asus Strix GL753VD-GC045T | |
| Acer Aspire V17 Nitro BE VN7-793G-706L | |
| bajo | medio | alto | ultra | |
|---|---|---|---|---|
| Mafia 2 (2010) | 152 | 152 | 66.1 | |
| BioShock Infinite (2013) | 207 | 155 | 143 | 59 |
| Batman: Arkham Knight (2015) | 90 | 78 | 45 | 42 |
| Fallout 4 (2015) | 108 | 70 | 38 | 31 |
| Rise of the Tomb Raider (2016) | 105 | 62 | 34 | 27 |
Ruido
| Ocioso |
| 35.3 / 35.4 / 35.4 dB(A) |
| Carga |
| 48.6 / 49.8 dB(A) |
 | ||
30 dB silencioso 40 dB(A) audible 50 dB(A) ruidosamente alto |
||
min: | ||
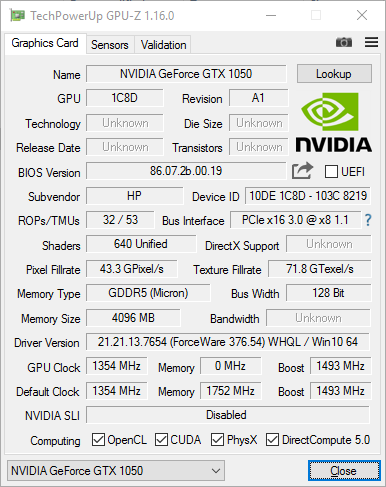
| HP Pavilion 17t-ab200 GeForce GTX 1050 Mobile, i7-7700HQ, Samsung CM871a MZNTY128HDHP | HP Pavilion 17 FHD V3A33AV GeForce GTX 960M, 6700HQ, SanDisk Z400s SD8SNAT-128G | Gigabyte P57X v7 GeForce GTX 1070 Mobile, i7-7700HQ, Transcend MTS800 256GB M.2 (TS256GMTS800) | HP Omen 17-w100ng GeForce GTX 1060 Mobile, 6300HQ, SanDisk Z400s SD8SNAT-128G | MSI GE72 7RE-046 GeForce GTX 1050 Ti Mobile, i7-7700HQ, Toshiba HG6 THNSNJ256G8NY | |
|---|---|---|---|---|---|
| Noise | 2% | 7% | -1% | 4% | |
| apagado / medio ambiente * (dB) | 30.8 | 29 6% | 29 6% | 31 -1% | 30 3% |
| Idle Minimum * (dB) | 35.3 | 34.6 2% | 30.4 14% | 35 1% | 34 4% |
| Idle Average * (dB) | 35.4 | 34.8 2% | 32.1 9% | 36 -2% | 35 1% |
| Idle Maximum * (dB) | 35.4 | 35.5 -0% | 32.1 9% | 37 -5% | 36 -2% |
| Load Average * (dB) | 48.6 | 45.4 7% | 45.6 6% | 44 9% | 41 16% |
| Load Maximum * (dB) | 49.8 | 52.3 -5% | 51.5 -3% | 54 -8% | 49 2% |
* ... más pequeño es mejor
(-) La temperatura máxima en la parte superior es de 45.8 °C / 114 F, frente a la media de 36.8 °C / 98 F, que oscila entre 21 y 71 °C para la clase Multimedia.
(+) El fondo se calienta hasta un máximo de 37 °C / 99 F, frente a la media de 39.1 °C / 102 F
(+) En reposo, la temperatura media de la parte superior es de 21.8 °C / 71# F, frente a la media del dispositivo de 31.3 °C / 88 F.
(+) El reposamanos y el panel táctil están a una temperatura inferior a la de la piel, con un máximo de 30 °C / 86 F y, por tanto, son fríos al tacto.
(±) La temperatura media de la zona del reposamanos de dispositivos similares fue de 28.7 °C / 83.7 F (-1.3 °C / -2.3 F).
HP Pavilion 17t-ab200 análisis de audio
(±) | la sonoridad del altavoz es media pero buena (73.9 dB)
Graves 100 - 315 Hz
(-) | casi sin bajos - de media 15.9% inferior a la mediana
(±) | la linealidad de los graves es media (11.8% delta a frecuencia anterior)
Medios 400 - 2000 Hz
(+) | medios equilibrados - a sólo 3.1% de la mediana
(+) | los medios son lineales (6.6% delta a la frecuencia anterior)
Altos 2 - 16 kHz
(+) | máximos equilibrados - a sólo 3.4% de la mediana
(±) | la linealidad de los máximos es media (9% delta a frecuencia anterior)
Total 100 - 16.000 Hz
(±) | la linealidad del sonido global es media (26.5% de diferencia con la mediana)
En comparación con la misma clase
» 92% de todos los dispositivos probados de esta clase eran mejores, 1% similares, 6% peores
» El mejor tuvo un delta de 5%, la media fue 17%, el peor fue ###max##%
En comparación con todos los dispositivos probados
» 82% de todos los dispositivos probados eran mejores, 4% similares, 15% peores
» El mejor tuvo un delta de 4%, la media fue 23%, el peor fue ###max##%
HP Omen 17-w100ng análisis de audio
(+) | los altavoces pueden reproducir a un volumen relativamente alto (#87 dB)
Graves 100 - 315 Hz
(-) | casi sin bajos - de media 23.9% inferior a la mediana
(±) | la linealidad de los graves es media (12.3% delta a frecuencia anterior)
Medios 400 - 2000 Hz
(+) | medios equilibrados - a sólo 2.2% de la mediana
(+) | los medios son lineales (4.6% delta a la frecuencia anterior)
Altos 2 - 16 kHz
(+) | máximos equilibrados - a sólo 4.6% de la mediana
(+) | los máximos son lineales (4.5% delta a la frecuencia anterior)
Total 100 - 16.000 Hz
(±) | la linealidad del sonido global es media (16.6% de diferencia con la mediana)
En comparación con la misma clase
» 43% de todos los dispositivos probados de esta clase eran mejores, 7% similares, 50% peores
» El mejor tuvo un delta de 6%, la media fue 18%, el peor fue ###max##%
En comparación con todos los dispositivos probados
» 29% de todos los dispositivos probados eran mejores, 6% similares, 65% peores
» El mejor tuvo un delta de 4%, la media fue 23%, el peor fue ###max##%
| Off / Standby | |
| Ocioso | |
| Carga |
|
Clave:
min: | |
| HP Pavilion 17t-ab200 i7-7700HQ, GeForce GTX 1050 Mobile, Samsung CM871a MZNTY128HDHP, IPS, 1920x1080, 17.3" | HP Pavilion 17 FHD V3A33AV 6700HQ, GeForce GTX 960M, SanDisk Z400s SD8SNAT-128G, IPS, 1920x1080, 17.3" | Gigabyte P57X v7 i7-7700HQ, GeForce GTX 1070 Mobile, Transcend MTS800 256GB M.2 (TS256GMTS800), IPS, 3840x2160, 17.3" | HP Omen 17-w100ng 6300HQ, GeForce GTX 1060 Mobile, SanDisk Z400s SD8SNAT-128G, IPS, 1920x1080, 17.3" | MSI GE72 7RE-046 i7-7700HQ, GeForce GTX 1050 Ti Mobile, Toshiba HG6 THNSNJ256G8NY, TN LED, 1920x1080, 17.3" | |
|---|---|---|---|---|---|
| Power Consumption | 8% | -111% | -77% | -60% | |
| Idle Minimum * (Watt) | 8.2 | 5.3 35% | 15.7 -91% | 17 -107% | 14 -71% |
| Idle Average * (Watt) | 11 | 10.6 4% | 23.4 -113% | 22 -100% | 20 -82% |
| Idle Maximum * (Watt) | 11.1 | 11.8 -6% | 23.5 -112% | 29 -161% | 25 -125% |
| Load Average * (Watt) | 77 | 70.9 8% | 184.6 -140% | 72 6% | 82 -6% |
| Load Maximum * (Watt) | 116.9 | 119.8 -2% | 233.1 -99% | 141 -21% | 135 -15% |
* ... más pequeño es mejor
| HP Pavilion 17t-ab200 i7-7700HQ, GeForce GTX 1050 Mobile, 62 Wh | HP Pavilion 17 FHD V3A33AV 6700HQ, GeForce GTX 960M, 62 Wh | Gigabyte P57X v7 i7-7700HQ, GeForce GTX 1070 Mobile, 75.81 Wh | HP Omen 17-w100ng 6300HQ, GeForce GTX 1060 Mobile, 95.8 Wh | MSI GE72 7RE-046 i7-7700HQ, GeForce GTX 1050 Ti Mobile, 51.4 Wh | Asus Strix GL753VD-GC045T i7-7700HQ, GeForce GTX 1050 Mobile, 48 Wh | |
|---|---|---|---|---|---|---|
| Duración de Batería | -1% | -44% | 3% | -54% | -38% | |
| Reader / Idle (h) | 11.5 | 12.5 9% | 4.3 -63% | 9.1 -21% | 8.6 -25% | |
| WiFi v1.3 (h) | 6.8 | 5.9 -13% | 2.6 -62% | 6.1 -10% | 3.1 -54% | 4.4 -35% |
| Load (h) | 1.7 | 1.7 0% | 1.6 -6% | 2.4 41% | 0.8 -53% |
Pro
Contra

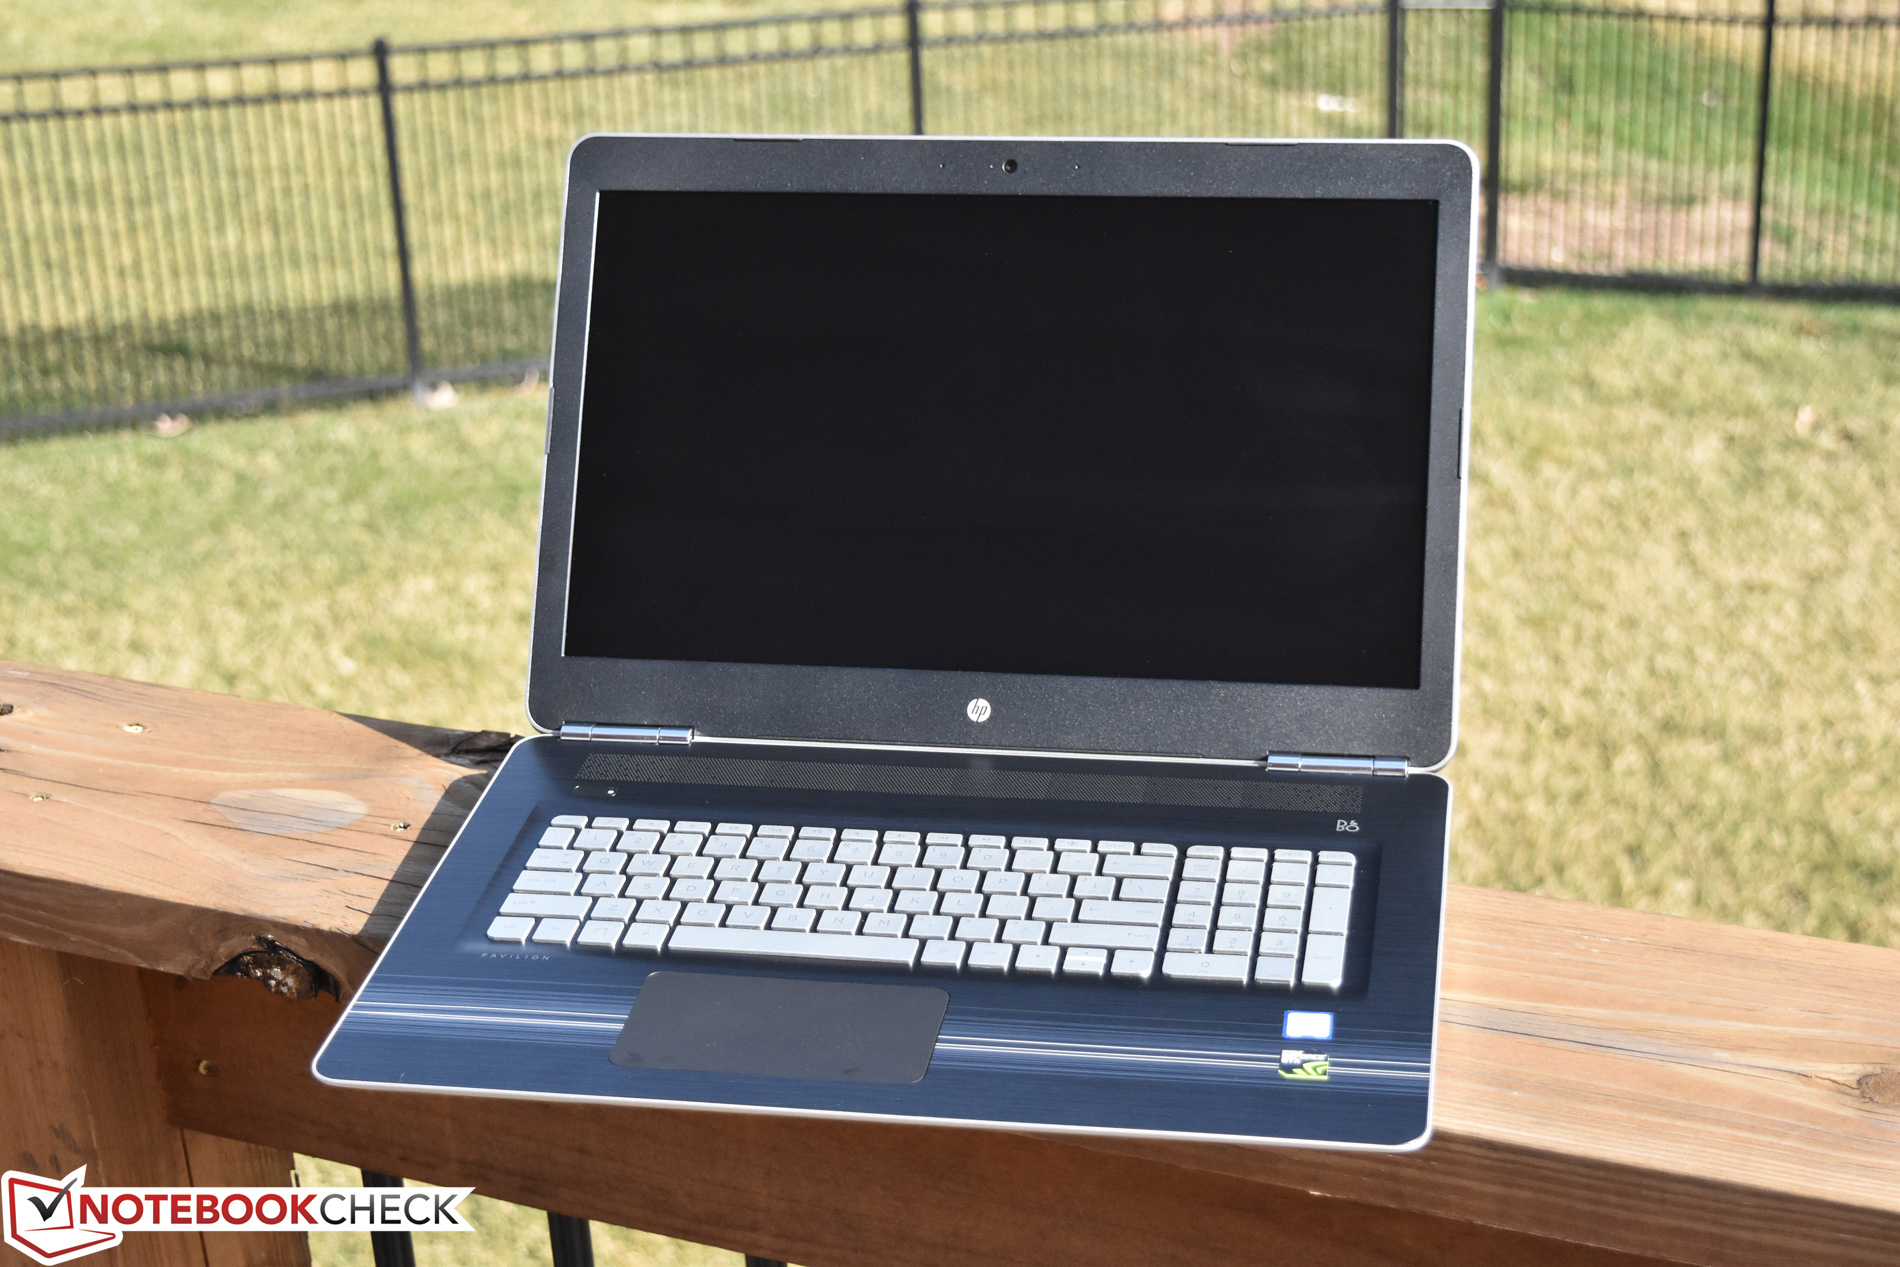
El Pavilion 17t se parece mucho a la máquina que analizamos hace seis meses y, por tanto, mantiene la mayoría de los pros y los contras. Sigue siendo una máquina para juegos barata y asequible y puede mover la mayoría de los juegos modernos en resolución nativa (1080p) con bastantes detalles, gracias a su nueva GPU (la modesta pero respetable GTX 1050). Se mantiene también bastante más transportable que muchos competidores con similar tamaño de pantalla, lo que es un punto a favor. El rendimiento es bueno y en general impresiona, especialmente cuando se le exige mucho: apenas protesta.
Si exiges mucho rendimiento por el precio y el mantenimiento y las actualizaciones no son un problema serio, encontraras en el Pavilion 17t-ab200 una opción bastante rápida.
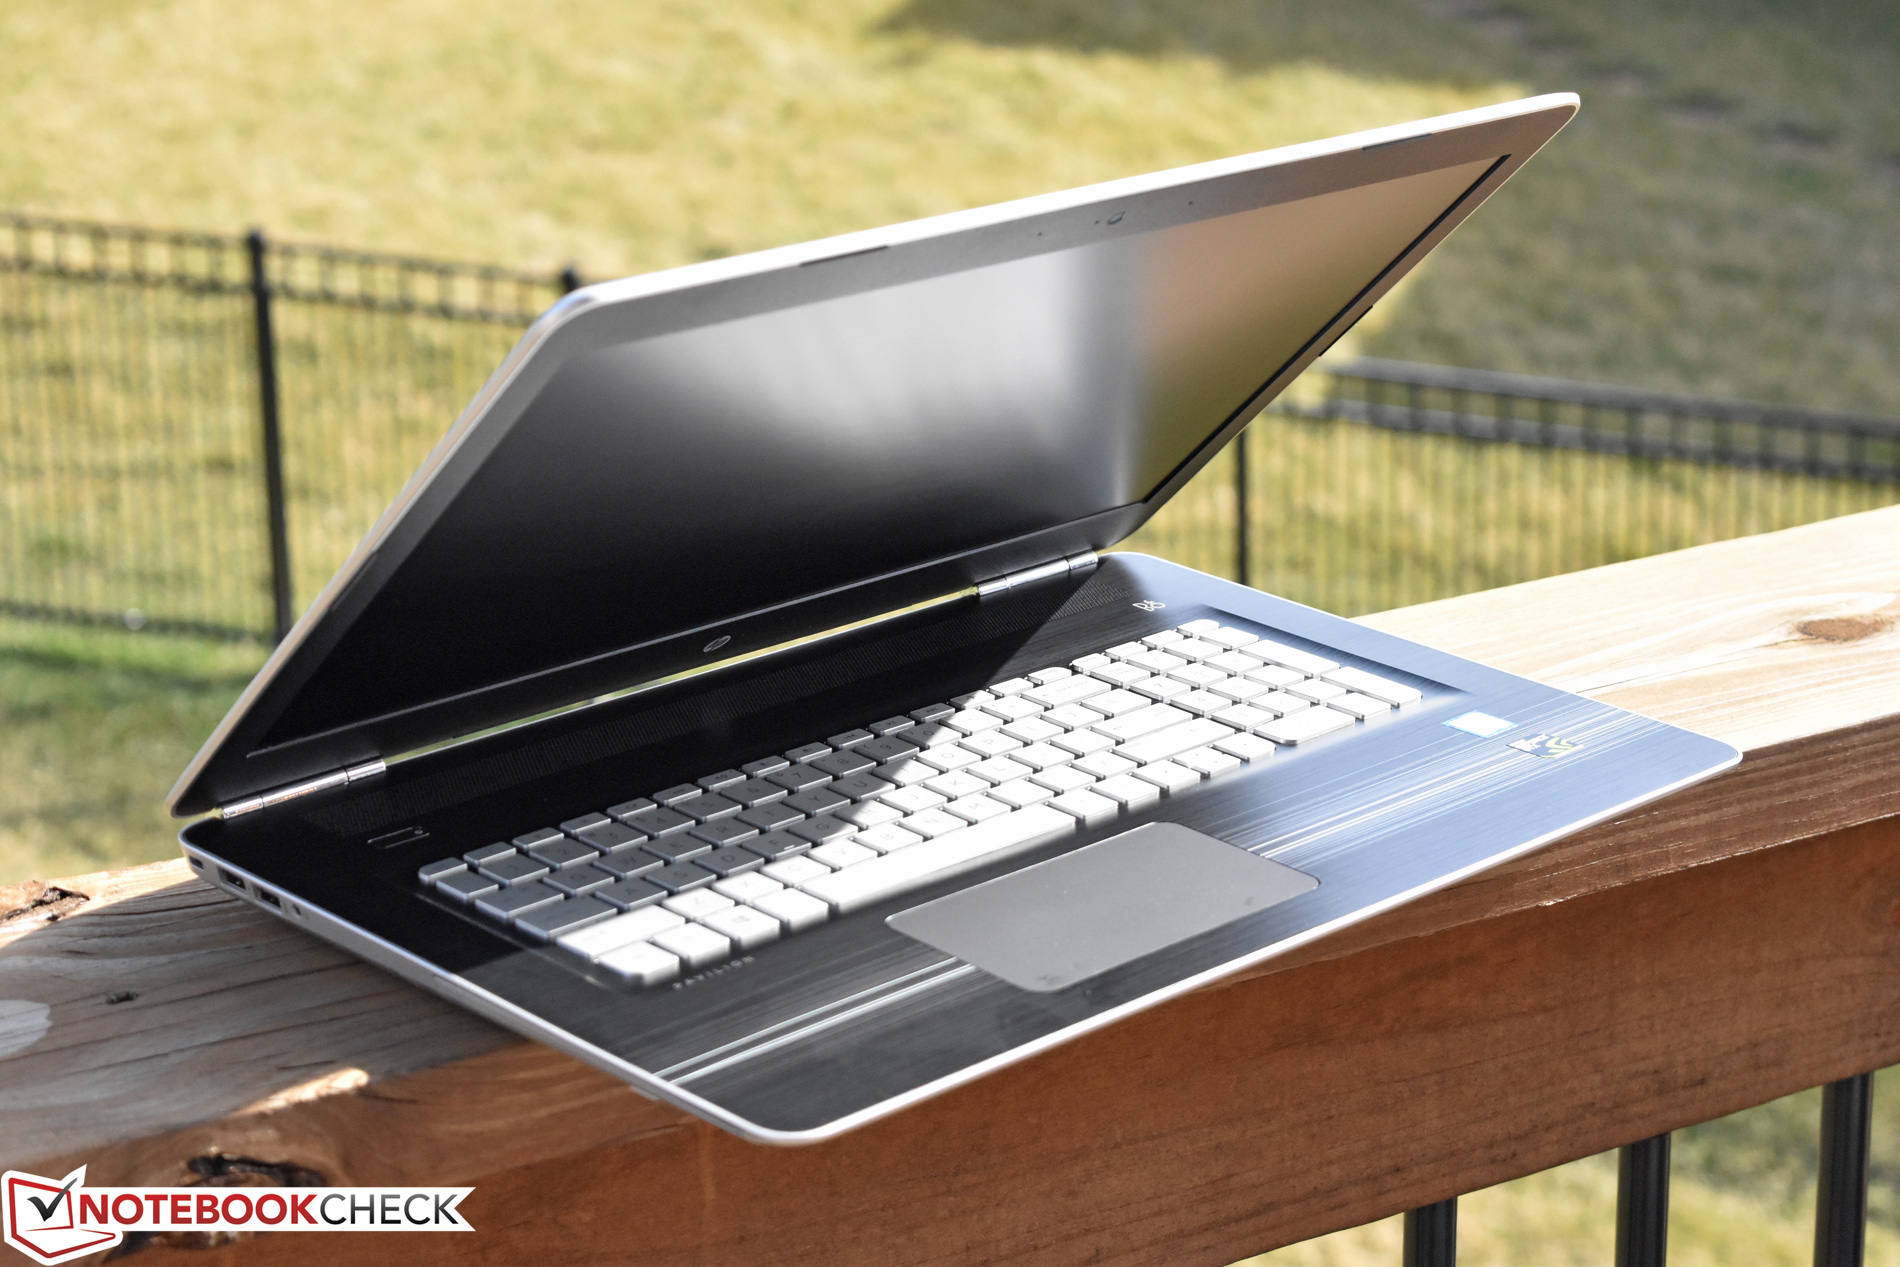
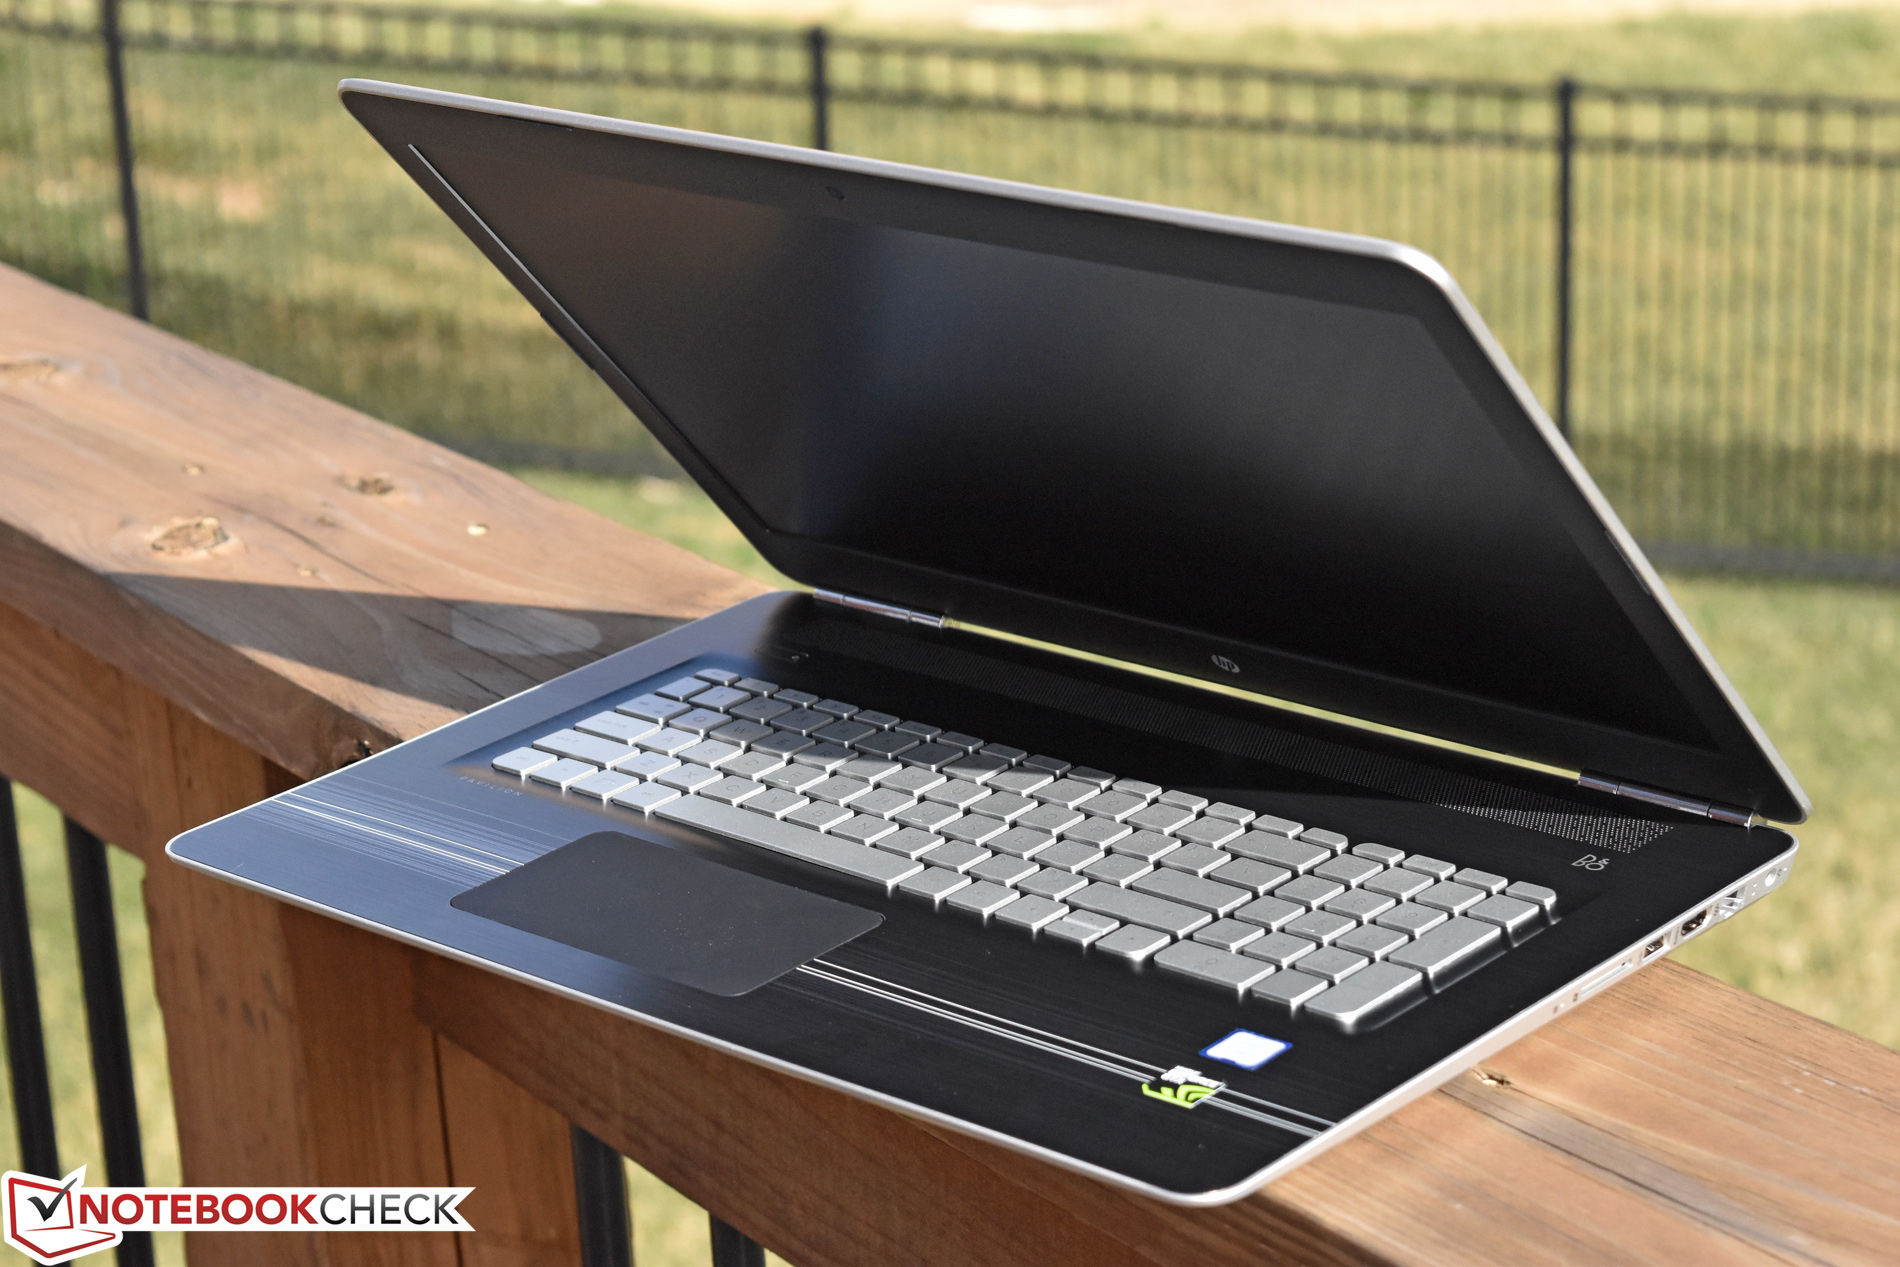
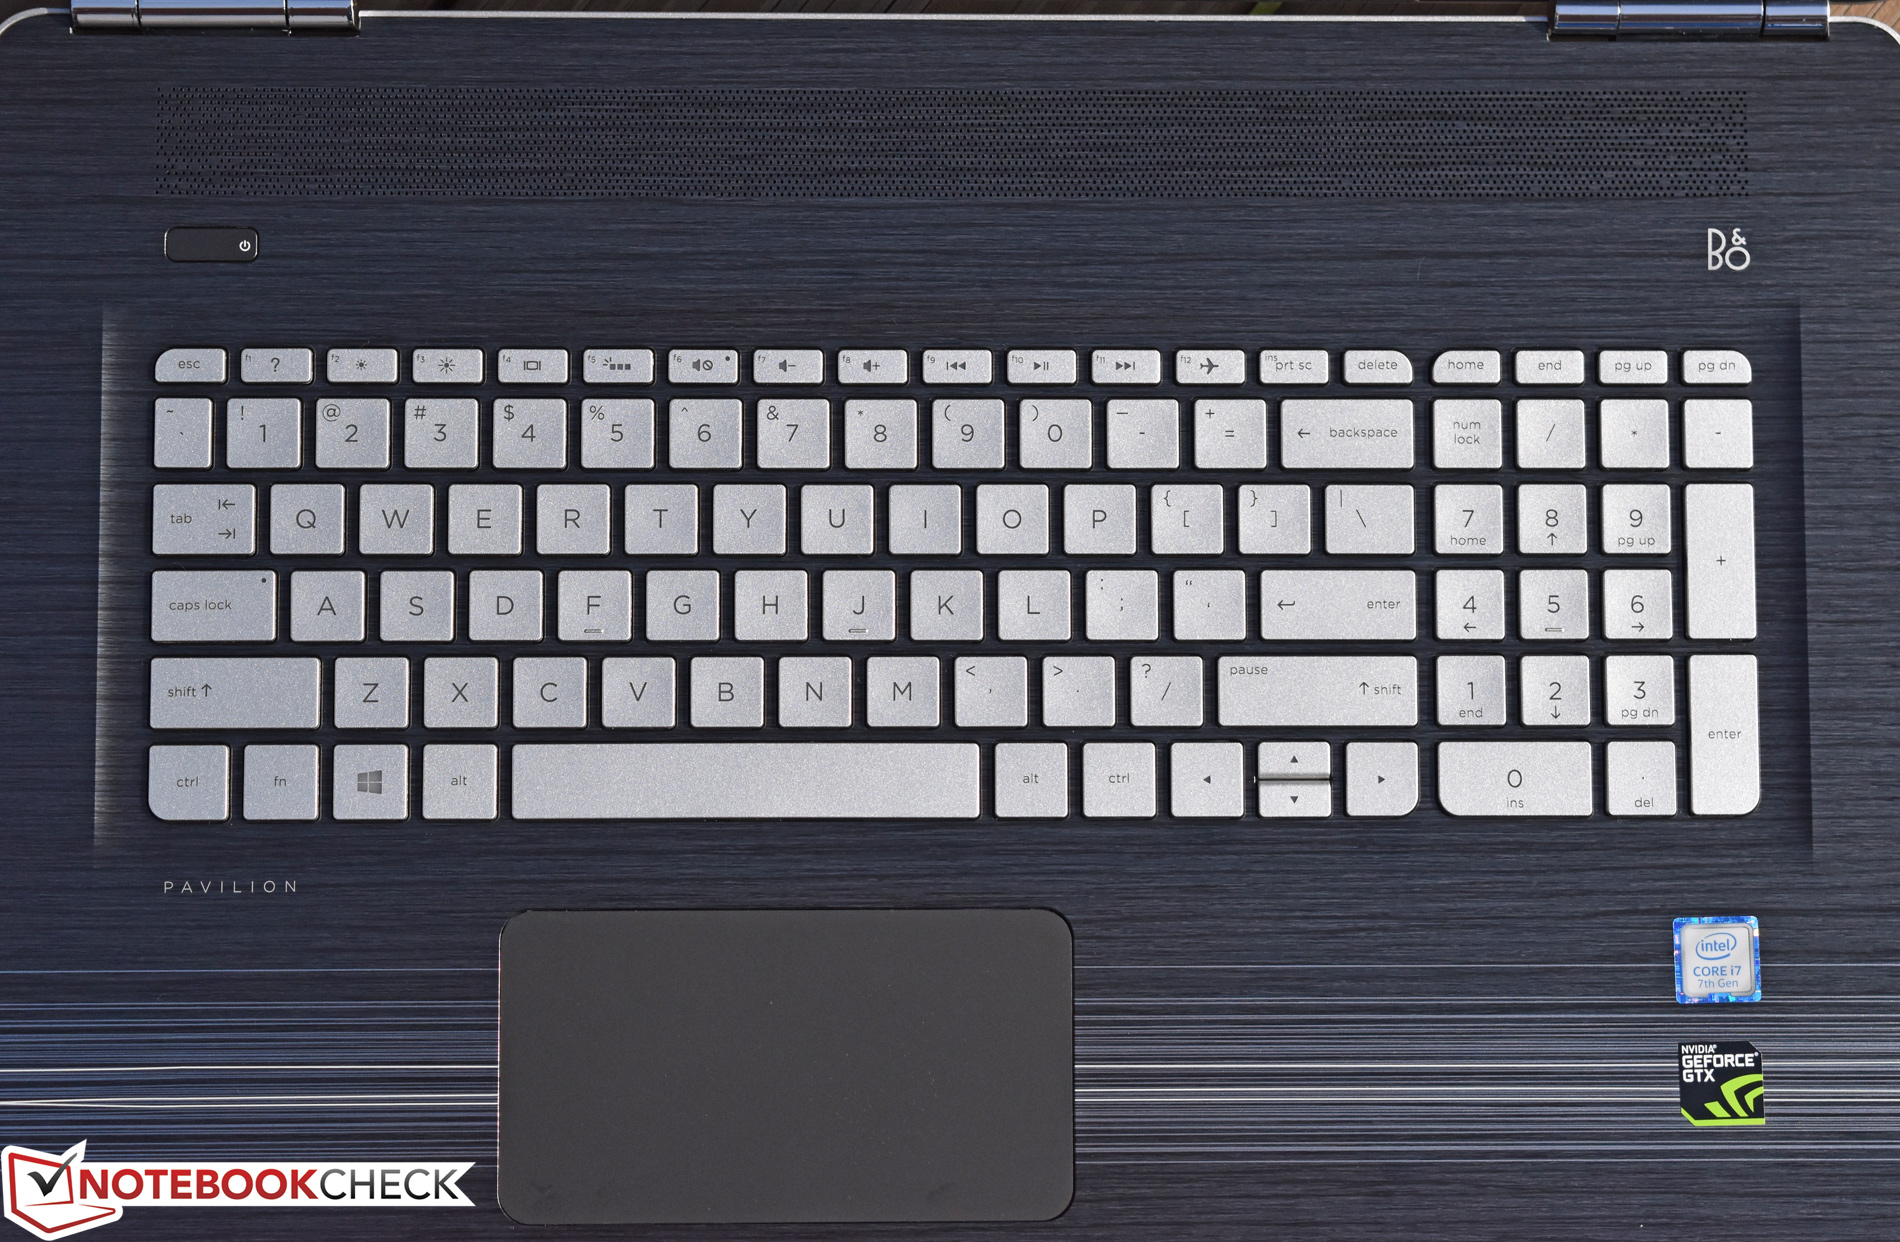
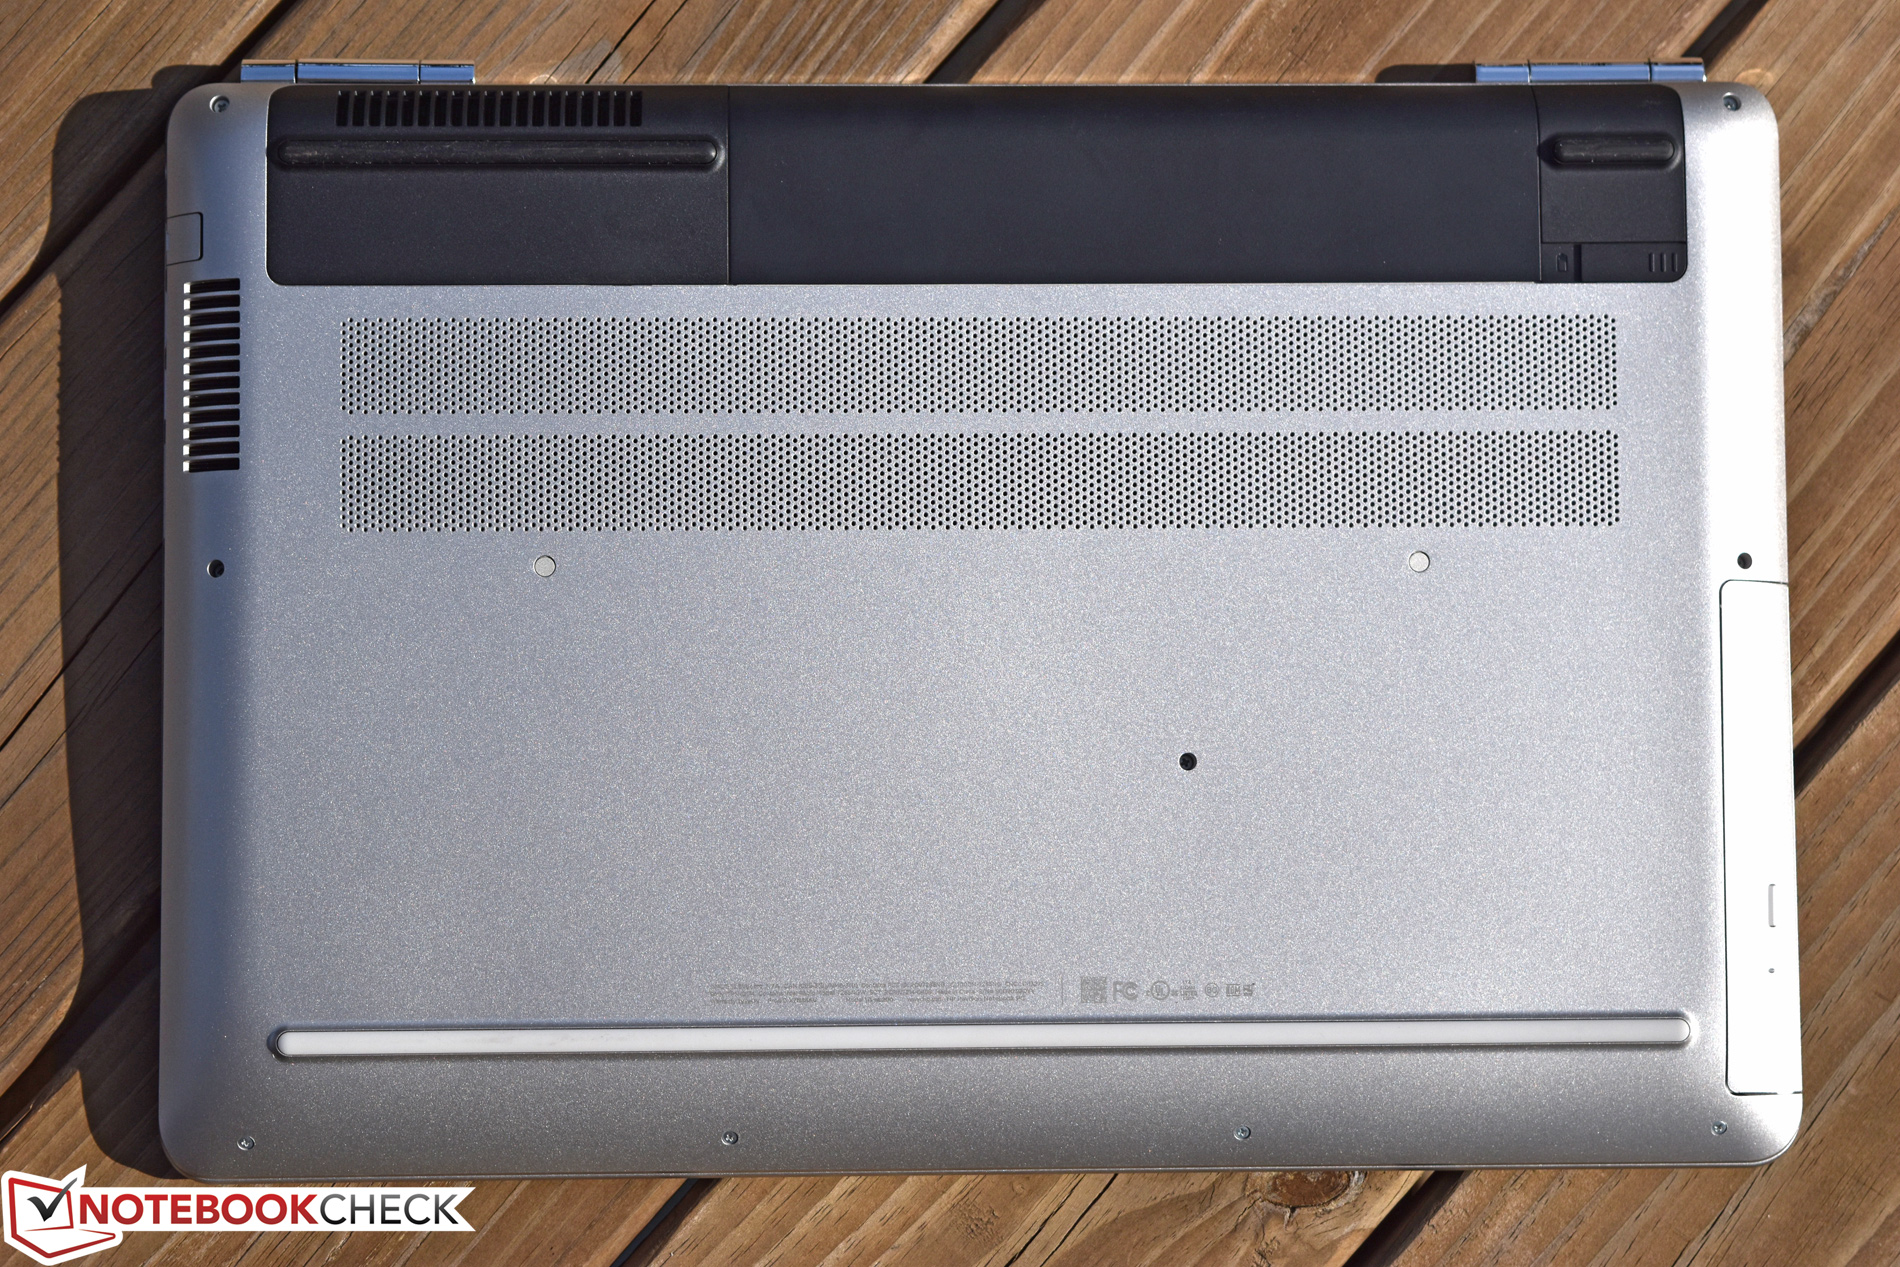
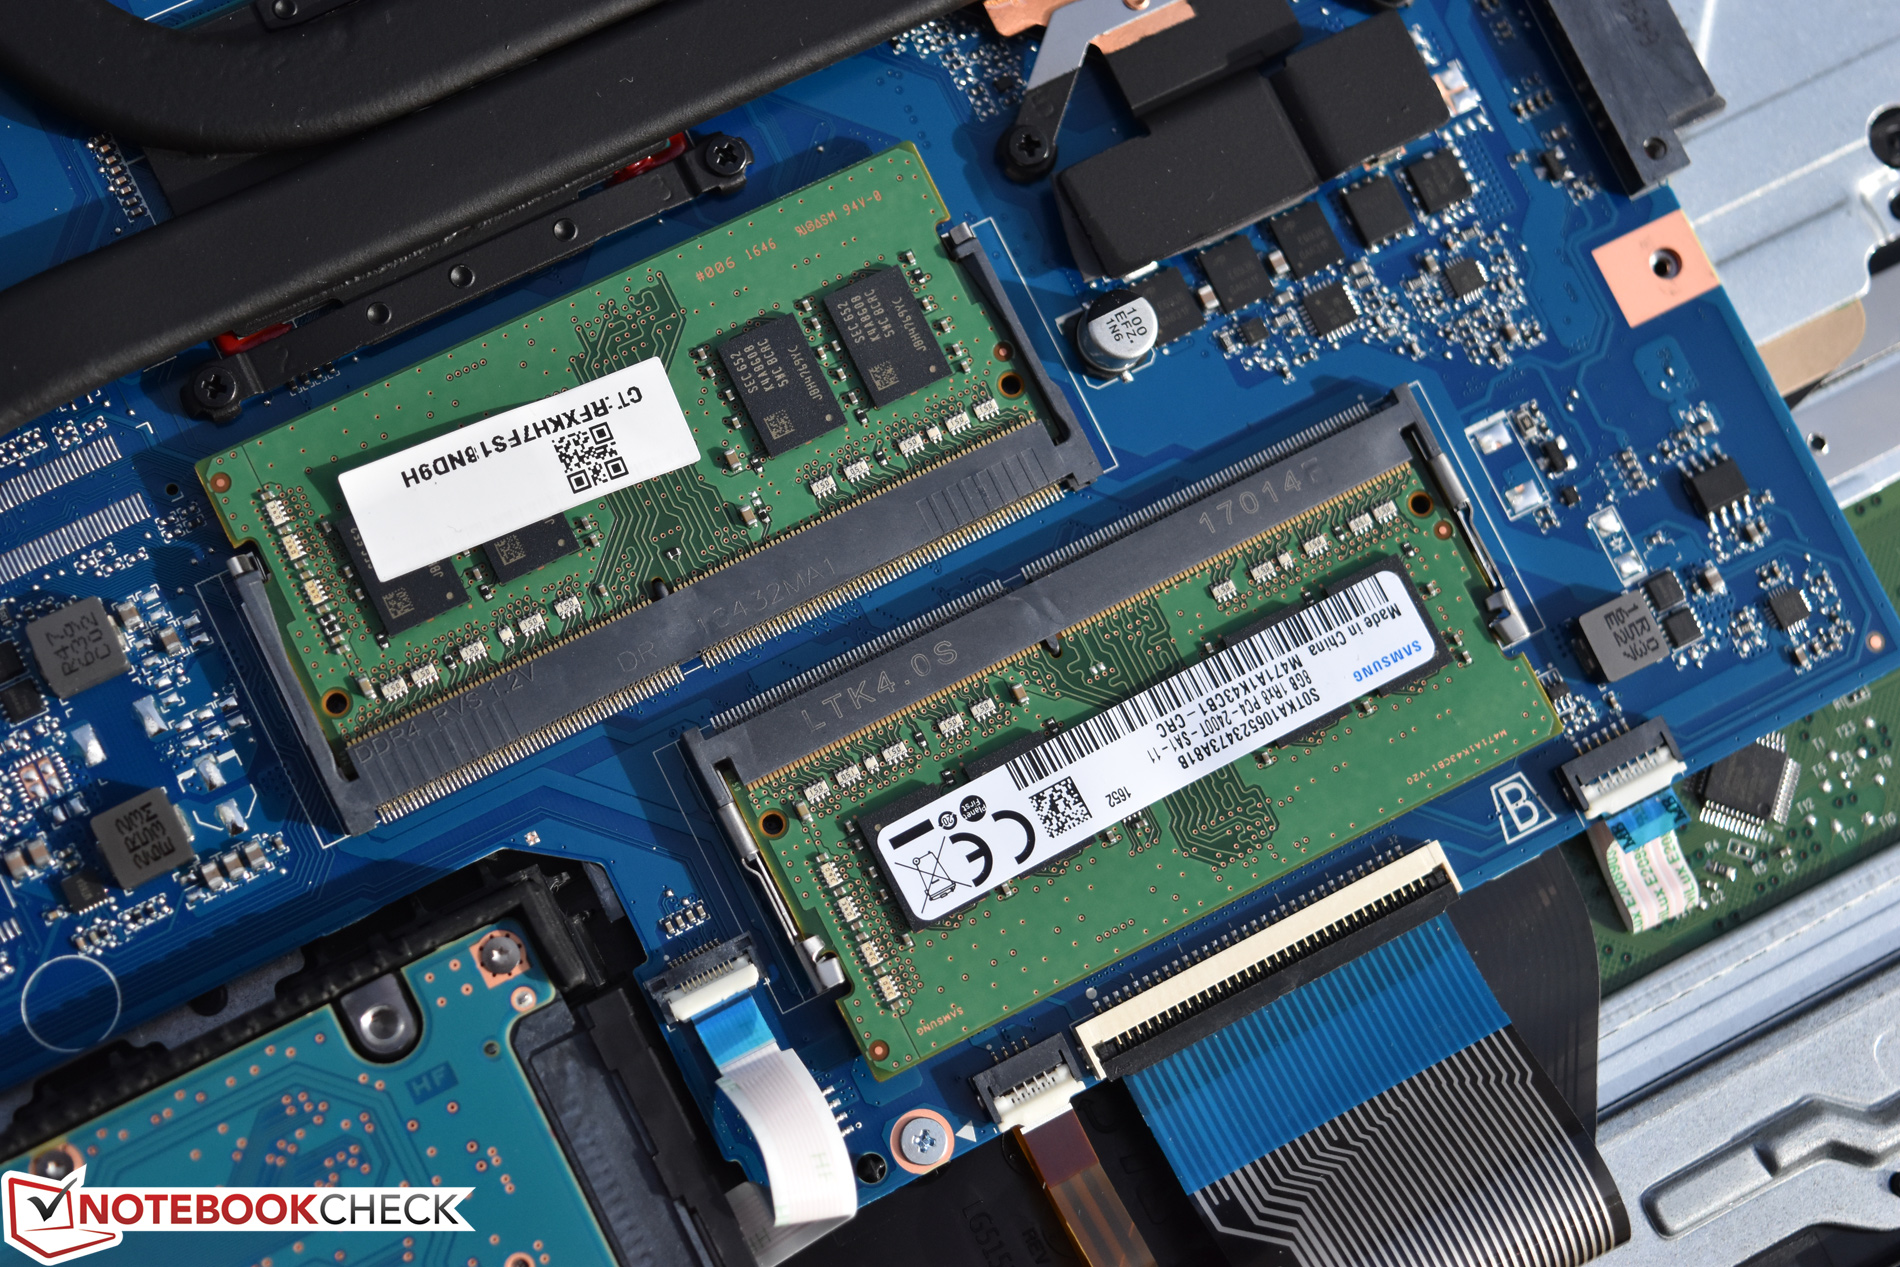
Aparte de esto, no tiene mucho más que ofrecer. La carcasad e plástico es una razón para su escaso peso, pero a la vez también hace que la pantalla oscile más de lo que nos gustaría y le da un aspecto barato. Los dispositivos de entrada están entre normales y malos. El mantenimiento es innecesariamente complicad, con serio riesgo de romper algo durante el proceso de desmontaje. La selección de puertos es escasa (apenas HDMI, no tiene USB type-C y no tiene NVMe para poder añadir un SDD), lo que hace que la máquina no sea recomendable para profesionales. Además es bastante ruidoso en funcionamiento, incluso con poca carga de trabajo, a pesar de que las temperaturas se han mejorado repecto al modelo anterior gracias a una CPU y a una GPU más eficientes.
A la luz de estos inconvenientes solo se nos ocurre un usuario para el que pueda resultar una buena elección, y es el jugón que tenga muy en cuenta el precio. Si el precio y el rendimiento son lo que más tienes en cuenta y la durabilidad, la ergonomía y el mantenimiento/actualizaciones no son un problema serio, entonces el Pavilion 17t-ab200 es una opción buena y rápida. Si no, si puedes ampliar tu presupuesto, no lo recomendamos.
Ésta es una versión acortada del análisis original. Puedes leer el análisis completo en inglés aquí.
HP Pavilion 17t-ab200
- 02/21/2017 v6 (old)
Steve Schardein
Price comparison
