Breve análisis del MSI GT72VR 7RE Dominator Pro
| SD Card Reader | |
| average JPG Copy Test (av. of 3 runs) | |
| MSI GT72VR 6RE-015US | |
| MSI GT72VR 7RE-433 | |
| Gigabyte P57X v6 | |
| HP Omen 17-w110ng | |
| Asus GL702VM-GC102D | |
| maximum AS SSD Seq Read Test (1GB) | |
| MSI GT72VR 7RE-433 | |
| MSI GT72VR 6RE-015US | |
| Gigabyte P57X v6 | |
| HP Omen 17-w110ng | |
| Asus GL702VM-GC102D | |
| Networking | |
| iperf3 transmit AX12 | |
| MSI GT72VR 7RE-433 | |
| HP Omen 17-w110ng | |
| iperf3 receive AX12 | |
| HP Omen 17-w110ng | |
| MSI GT72VR 7RE-433 | |
| |||||||||||||||||||||||||
iluminación: 87 %
Brillo con batería: 299 cd/m²
Contraste: 1107:1 (Negro: 0.27 cd/m²)
ΔE ColorChecker Calman: 9.65 | ∀{0.5-29.43 Ø4.73}
ΔE Greyscale Calman: 9.68 | ∀{0.09-98 Ø4.97}
100% sRGB (Argyll 1.6.3 3D)
75% AdobeRGB 1998 (Argyll 1.6.3 3D)
63.4% AdobeRGB 1998 (Argyll 3D)
86.7% sRGB (Argyll 3D)
68.3% Display P3 (Argyll 3D)
Gamma: 1.89
CCT: 11652 K
| MSI GT72VR 7RE-433 Chi Mei N173HHE-G32 (CMN1747), 1920x1080 | MSI GT72VR 6RE-015US LG Philips LGD046E, 1920x1080 | Asus GL702VM-GC102D LG Philips LP173WF4-SPF3, 1920x1080 | HP Omen 17-w110ng LG Philips LGD046E, 1920x1080 | Gigabyte P57X v6 LGD0469, 1920x1080 | |
|---|---|---|---|---|---|
| Display | 0% | -4% | -3% | 1% | |
| Display P3 Coverage (%) | 68.3 | 68.3 0% | 65.1 -5% | 66.6 -2% | 68 0% |
| sRGB Coverage (%) | 86.7 | 86.7 0% | 83.5 -4% | 84.1 -3% | 87.5 1% |
| AdobeRGB 1998 Coverage (%) | 63.4 | 63.4 0% | 61.1 -4% | 61.5 -3% | 64 1% |
| Response Times | -140% | -130% | -136% | -141% | |
| Response Time Grey 50% / Grey 80% * (ms) | 29 ? | 34.4 ? -19% | 38 ? -31% | 37 ? -28% | 33.6 ? -16% |
| Response Time Black / White * (ms) | 7 ? | 25.2 ? -260% | 23 ? -229% | 24 ? -243% | 25.6 ? -266% |
| PWM Frequency (Hz) | |||||
| Screen | 16% | -6% | 15% | 11% | |
| Brightness middle (cd/m²) | 299 | 348.7 17% | 326 9% | 362 21% | 329.2 10% |
| Brightness (cd/m²) | 277 | 327 18% | 312 13% | 342 23% | 321 16% |
| Brightness Distribution (%) | 87 | 89 2% | 91 5% | 87 0% | 93 7% |
| Black Level * (cd/m²) | 0.27 | 0.323 -20% | 0.5 -85% | 0.31 -15% | 0.267 1% |
| Contrast (:1) | 1107 | 1080 -2% | 652 -41% | 1168 6% | 1233 11% |
| Colorchecker dE 2000 * | 9.65 | 4.09 58% | 6.3 35% | 4.5 53% | 5.93 39% |
| Colorchecker dE 2000 max. * | 15.43 | 9.02 42% | 11.69 24% | 9.31 40% | 11.07 28% |
| Greyscale dE 2000 * | 9.68 | 2.14 78% | 7.37 24% | 3.48 64% | 6.72 31% |
| Gamma | 1.89 116% | 2.25 98% | 2.37 93% | 2.23 99% | 2.12 104% |
| CCT | 11652 56% | 6885 94% | 7116 91% | 6144 106% | 7611 85% |
| Color Space (Percent of AdobeRGB 1998) (%) | 75 | 56.9 -24% | 55 -27% | 55 -27% | 57 -24% |
| Color Space (Percent of sRGB) (%) | 100 | 86.5 -13% | 83 -17% | 84 -16% | 87 -13% |
| Media total (Programa/Opciones) | -41% /
-8% | -47% /
-22% | -41% /
-9% | -43% /
-12% |
* ... más pequeño es mejor
Parpadeo de Pantalla / PWM (Pulse-Width Modulation)
| Parpadeo de Pantalla / PWM no detectado | 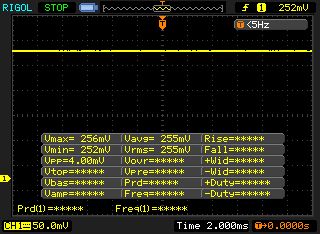 | ||
Comparación: 52 % de todos los dispositivos testados no usaron PWM para atenuar el display. Si se usó, medimos una media de 7798 (mínimo: 5 - máxmo: 343500) Hz. | |||
Tiempos de respuesta del display
| ↔ Tiempo de respuesta de Negro a Blanco | ||
|---|---|---|
| 7 ms ... subida ↗ y bajada ↘ combinada | ↗ 4 ms subida | 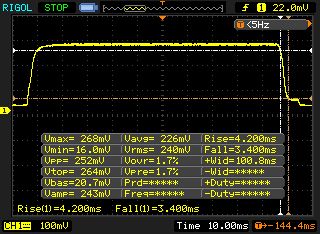 |
| ↘ 3 ms bajada | ||
| La pantalla mostró tiempos de respuesta muy rápidos en nuestros tests y debería ser adecuada para juegos frenéticos. En comparación, todos los dispositivos de prueba van de ##min### (mínimo) a 240 (máximo) ms. » 21 % de todos los dispositivos son mejores. Esto quiere decir que el tiempo de respuesta medido es mejor que la media (19.9 ms) de todos los dispositivos testados. | ||
| ↔ Tiempo de respuesta 50% Gris a 80% Gris | ||
| 29 ms ... subida ↗ y bajada ↘ combinada | ↗ 13 ms subida | 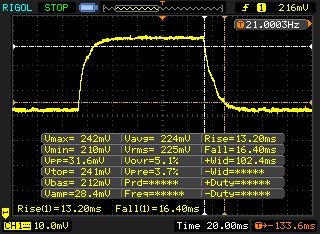 |
| ↘ 16 ms bajada | ||
| La pantalla mostró tiempos de respuesta relativamente lentos en nuestros tests pero podría ser demasiado lenta para los jugones. En comparación, todos los dispositivos de prueba van de ##min### (mínimo) a 636 (máximo) ms. » 39 % de todos los dispositivos son mejores. Eso quiere decir que el tiempo de respuesta es similar al dispositivo testado medio (31.1 ms). | ||
| Cinebench R15 | |
| CPU Single 64Bit | |
| MSI GT72VR 7RE-433 | |
| HP Omen 17-w110ng | |
| Gigabyte P57X v6 | |
| Asus GL702VM-GC102D | |
| MSI GT72VR 6RE-015US | |
| CPU Multi 64Bit | |
| MSI GT72VR 7RE-433 | |
| HP Omen 17-w110ng | |
| Asus GL702VM-GC102D | |
| MSI GT72VR 6RE-015US | |
| Gigabyte P57X v6 | |
| Cinebench R11.5 | |
| CPU Multi 64Bit | |
| MSI GT72VR 7RE-433 | |
| HP Omen 17-w110ng | |
| Asus GL702VM-GC102D | |
| Gigabyte P57X v6 | |
| MSI GT72VR 6RE-015US | |
| CPU Single 64Bit | |
| MSI GT72VR 7RE-433 | |
| HP Omen 17-w110ng | |
| MSI GT72VR 6RE-015US | |
| Gigabyte P57X v6 | |
| Asus GL702VM-GC102D | |
| Cinebench R10 | |
| Rendering Multiple CPUs 32Bit | |
| MSI GT72VR 7RE-433 | |
| HP Omen 17-w110ng | |
| Asus GL702VM-GC102D | |
| MSI GT72VR 6RE-015US | |
| Rendering Single 32Bit | |
| MSI GT72VR 7RE-433 | |
| HP Omen 17-w110ng | |
| Asus GL702VM-GC102D | |
| MSI GT72VR 6RE-015US | |
| Geekbench 3 | |
| 32 Bit Single-Core Score | |
| MSI GT72VR 7RE-433 | |
| Asus GL702VM-GC102D | |
| 32 Bit Multi-Core Score | |
| MSI GT72VR 7RE-433 | |
| Asus GL702VM-GC102D | |
| Geekbench 4.0 | |
| 64 Bit Single-Core Score | |
| MSI GT72VR 7RE-433 | |
| Asus GL702VM-GC102D | |
| 64 Bit Multi-Core Score | |
| MSI GT72VR 7RE-433 | |
| Asus GL702VM-GC102D | |
| JetStream 1.1 - 1.1 Total | |
| HP Omen 17-w110ng | |
| MSI GT72VR 7RE-433 | |
| Gigabyte P57X v6 | |
| MSI GT72VR 6RE-015US | |
| Asus GL702VM-GC102D | |
| Octane V2 - Total Score | |
| MSI GT72VR 7RE-433 | |
| HP Omen 17-w110ng | |
| Asus GL702VM-GC102D | |
| MSI GT72VR 6RE-015US | |
| Mozilla Kraken 1.1 - Total | |
| Gigabyte P57X v6 | |
| Asus GL702VM-GC102D | |
| HP Omen 17-w110ng | |
| MSI GT72VR 7RE-433 | |
* ... más pequeño es mejor
| PCMark 7 Score | 6618 puntos | |
| PCMark 8 Home Score Accelerated v2 | 5009 puntos | |
| PCMark 8 Creative Score Accelerated v2 | 7765 puntos | |
| PCMark 8 Work Score Accelerated v2 | 5404 puntos | |
ayuda | ||
| PCMark 8 | |
| Home Score Accelerated v2 | |
| MSI GT72VR 7RE-433 | |
| HP Omen 17-w110ng | |
| Asus GL702VM-GC102D | |
| MSI GT72VR 6RE-015US | |
| Gigabyte P57X v6 | |
| Work Score Accelerated v2 | |
| MSI GT72VR 7RE-433 | |
| HP Omen 17-w110ng | |
| MSI GT72VR 6RE-015US | |
| Gigabyte P57X v6 | |
| Asus GL702VM-GC102D | |

| MSI GT72VR 7RE-433 Kingston RBU-SNS8152S3256GG5 | MSI GT72VR 6RE-015US SanDisk SD8SNAT256G1122 | Asus GL702VM-GC102D HGST Travelstar 7K1000 HTS721010A9E630 | HP Omen 17-w110ng Samsung PM951 NVMe MZVLV256 | Gigabyte P57X v6 Transcend MTS800 256GB M.2 (TS256GMTS800) | |
|---|---|---|---|---|---|
| CrystalDiskMark 3.0 | -18% | -87% | 37% | -14% | |
| Read Seq (MB/s) | 521 | 529 2% | 134.6 -74% | 1156 122% | 481.7 -8% |
| Write Seq (MB/s) | 311.8 | 338.5 9% | 130.6 -58% | 294.9 -5% | 315.4 1% |
| Read 512 (MB/s) | 403.1 | 288.9 -28% | 44.85 -89% | 616 53% | 303.1 -25% |
| Write 512 (MB/s) | 332.3 | 319.2 -4% | 63.3 -81% | 294.7 -11% | 314.4 -5% |
| Read 4k (MB/s) | 33.35 | 23.1 -31% | 0.602 -98% | 42.7 28% | 25.93 -22% |
| Write 4k (MB/s) | 111.1 | 99.4 -11% | 1.146 -99% | 153.3 38% | 84.6 -24% |
| Read 4k QD32 (MB/s) | 331.1 | 147.5 -55% | 1.106 -100% | 600 81% | 273.9 -17% |
| Write 4k QD32 (MB/s) | 318.3 | 236.9 -26% | 1.186 -100% | 295.3 -7% | 274.9 -14% |
| 3DMark 06 Standard Score | 30145 puntos | |
| 3DMark 11 Performance | 15575 puntos | |
| 3DMark Ice Storm Standard Score | 133525 puntos | |
| 3DMark Cloud Gate Standard Score | 26904 puntos | |
| 3DMark Fire Strike Score | 13685 puntos | |
| 3DMark Fire Strike Extreme Score | 7506 puntos | |
| 3DMark Time Spy Score | 5097 puntos | |
ayuda | ||
| 3DMark | |
| 1280x720 Cloud Gate Standard Graphics | |
| MSI GT72VR 7RE-433 | |
| MSI GT72VR 6RE-015US | |
| HP Omen 17-w110ng | |
| Gigabyte P57X v6 | |
| Asus GL702VM-GC102D | |
| 1920x1080 Fire Strike Graphics | |
| MSI GT72VR 7RE-433 | |
| MSI GT72VR 6RE-015US | |
| HP Omen 17-w110ng | |
| Asus GL702VM-GC102D | |
| 3DMark 11 - 1280x720 Performance GPU | |
| Gigabyte P57X v6 | |
| MSI GT72VR 7RE-433 | |
| HP Omen 17-w110ng | |
| Asus GL702VM-GC102D | |
| MSI GT72VR 6RE-015US | |
| bajo | medio | alto | ultra | |
|---|---|---|---|---|
| Tomb Raider (2013) | 437.3 | 411.1 | 392.1 | 207.4 |
| BioShock Infinite (2013) | 219.2 | 188.7 | 182.5 | 133.2 |
| Battlefield 4 (2013) | 195.7 | 186.9 | 185.7 | 144.8 |
| Ashes of the Singularity (2016) | 60.2 | 59.1 | 55.3 | |
| Deus Ex Mankind Divided (2016) | 99.9 | 93.3 | 76.3 | 43.7 |
| Battlefield 1 (2016) | 147.3 | 129.5 | 114.7 | 106 |
| Civilization 6 (2016) | 72 | 58.7 | 51.7 | 52.1 |
| Titanfall 2 (2016) | 144 | 144 | 130.6 | 121.5 |
| BioShock Infinite - 1920x1080 Ultra Preset, DX11 (DDOF) | |
| MSI GT72VR 7RE-433 | |
| MSI GT72VR 6RE-015US | |
| Gigabyte P57X v6 | |
| HP Omen 17-w110ng | |
| Asus GL702VM-GC102D | |
| Battlefield 4 - 1920x1080 Ultra Preset AA:4x MS | |
| MSI GT72VR 7RE-433 | |
| Asus GL702VM-GC102D | |
Ruido
| Ocioso |
| 34 / 35 / 37 dB(A) |
| Carga |
| 37 / 44 dB(A) |
 | ||
30 dB silencioso 40 dB(A) audible 50 dB(A) ruidosamente alto |
||
min: | ||
| MSI GT72VR 7RE-433 i7-7700HQ, GeForce GTX 1070 Mobile | MSI GT72VR 6RE-015US 6700HQ, GeForce GTX 1070 Mobile | Asus GL702VM-GC102D 6700HQ, GeForce GTX 1060 Mobile | HP Omen 17-w110ng 6700HQ, GeForce GTX 1070 Mobile | Gigabyte P57X v6 6700HQ, GeForce GTX 1070 Mobile | |
|---|---|---|---|---|---|
| Noise | 1% | 3% | -4% | -4% | |
| apagado / medio ambiente * (dB) | 31 | 28.9 7% | 30.5 2% | 30 3% | 29.7 4% |
| Idle Minimum * (dB) | 34 | 32.4 5% | 31.4 8% | 33 3% | 33.2 2% |
| Idle Average * (dB) | 35 | 32.4 7% | 31.4 10% | 34 3% | 33.2 5% |
| Idle Maximum * (dB) | 37 | 32.4 12% | 31.5 15% | 35 5% | 33.2 10% |
| Load Average * (dB) | 37 | 39.4 -6% | 40.9 -11% | 45 -22% | 47.5 -28% |
| Load Maximum * (dB) | 44 | 52 -18% | 46.2 -5% | 52 -18% | 52.5 -19% |
* ... más pequeño es mejor
(±) La temperatura máxima en la parte superior es de 41.5 °C / 107 F, frente a la media de 40.4 °C / 105 F, que oscila entre 21.2 y 68.8 °C para la clase Gaming.
(-) El fondo se calienta hasta un máximo de 50.6 °C / 123 F, frente a la media de 43.2 °C / 110 F
(+) En reposo, la temperatura media de la parte superior es de 24.3 °C / 76# F, frente a la media del dispositivo de 33.9 °C / 93 F.
(+) El reposamanos y el panel táctil están a una temperatura inferior a la de la piel, con un máximo de 27 °C / 80.6 F y, por tanto, son fríos al tacto.
(±) La temperatura media de la zona del reposamanos de dispositivos similares fue de 28.8 °C / 83.8 F (+1.8 °C / 3.2 F).
| MSI GT72VR 7RE-433 i7-7700HQ, GeForce GTX 1070 Mobile | MSI GT72VR 6RE-015US 6700HQ, GeForce GTX 1070 Mobile | Asus GL702VM-GC102D 6700HQ, GeForce GTX 1060 Mobile | HP Omen 17-w110ng 6700HQ, GeForce GTX 1070 Mobile | Gigabyte P57X v6 6700HQ, GeForce GTX 1070 Mobile | |
|---|---|---|---|---|---|
| Heat | -8% | -18% | -10% | -30% | |
| Maximum Upper Side * (°C) | 41.5 | 40.6 2% | 53.1 -28% | 45 -8% | 59 -42% |
| Maximum Bottom * (°C) | 50.6 | 59.4 -17% | 44.9 11% | 54.3 -7% | 66 -30% |
| Idle Upper Side * (°C) | 26.4 | 28.2 -7% | 32.9 -25% | 29.6 -12% | 33.2 -26% |
| Idle Bottom * (°C) | 25.4 | 27.8 -9% | 33.4 -31% | 28.6 -13% | 30.6 -20% |
* ... más pequeño es mejor
MSI GT72VR 7RE-433 análisis de audio
(+) | los altavoces pueden reproducir a un volumen relativamente alto (#87 dB)
Graves 100 - 315 Hz
(±) | lubina reducida - en promedio 5.4% inferior a la mediana
(±) | la linealidad de los graves es media (11.3% delta a frecuencia anterior)
Medios 400 - 2000 Hz
(±) | medias más altas - de media 5% más altas que la mediana
(+) | los medios son lineales (4.1% delta a la frecuencia anterior)
Altos 2 - 16 kHz
(+) | máximos equilibrados - a sólo 4.7% de la mediana
(+) | los máximos son lineales (5.7% delta a la frecuencia anterior)
Total 100 - 16.000 Hz
(+) | el sonido global es lineal (11.7% de diferencia con la mediana)
En comparación con la misma clase
» 11% de todos los dispositivos probados de esta clase eran mejores, 4% similares, 85% peores
» El mejor tuvo un delta de 6%, la media fue 18%, el peor fue ###max##%
En comparación con todos los dispositivos probados
» 8% de todos los dispositivos probados eran mejores, 3% similares, 89% peores
» El mejor tuvo un delta de 4%, la media fue 24%, el peor fue ###max##%
Asus G752VS-XB78K análisis de audio
(±) | la sonoridad del altavoz es media pero buena (76 dB)
Graves 100 - 315 Hz
(±) | lubina reducida - en promedio 9.6% inferior a la mediana
(±) | la linealidad de los graves es media (10.7% delta a frecuencia anterior)
Medios 400 - 2000 Hz
(+) | medios equilibrados - a sólo 4.7% de la mediana
(±) | la linealidad de los medios es media (10.3% delta respecto a la frecuencia anterior)
Altos 2 - 16 kHz
(±) | máximos reducidos - de media 8.3% inferior a la mediana
(±) | la linealidad de los máximos es media (9.7% delta a frecuencia anterior)
Total 100 - 16.000 Hz
(±) | la linealidad del sonido global es media (22.4% de diferencia con la mediana)
En comparación con la misma clase
» 80% de todos los dispositivos probados de esta clase eran mejores, 6% similares, 14% peores
» El mejor tuvo un delta de 6%, la media fue 18%, el peor fue ###max##%
En comparación con todos los dispositivos probados
» 65% de todos los dispositivos probados eran mejores, 6% similares, 29% peores
» El mejor tuvo un delta de 4%, la media fue 24%, el peor fue ###max##%
| Off / Standby | |
| Ocioso | |
| Carga |
|
Clave:
min: | |
| MSI GT72VR 7RE-433 i7-7700HQ, GeForce GTX 1070 Mobile | MSI GT72VR 6RE-015US 6700HQ, GeForce GTX 1070 Mobile | Asus GL702VM-GC102D 6700HQ, GeForce GTX 1060 Mobile | HP Omen 17-w110ng 6700HQ, GeForce GTX 1070 Mobile | Gigabyte P57X v6 6700HQ, GeForce GTX 1070 Mobile | |
|---|---|---|---|---|---|
| Power Consumption | -20% | 19% | 0% | -16% | |
| Idle Minimum * (Watt) | 20 | 22.3 -12% | 15.6 22% | 19 5% | 18.4 8% |
| Idle Average * (Watt) | 27 | 27.3 -1% | 20.2 25% | 25 7% | 22.8 16% |
| Idle Maximum * (Watt) | 31 | 30 3% | 21.4 31% | 31 -0% | 24 23% |
| Load Average * (Watt) | 86 | 152.2 -77% | 90 -5% | 90 -5% | 175.5 -104% |
| Load Maximum * (Watt) | 184 | 204.2 -11% | 147 20% | 193 -5% | 229.5 -25% |
* ... más pequeño es mejor
| MSI GT72VR 7RE-433 i7-7700HQ, GeForce GTX 1070 Mobile, 83 Wh | MSI GT72VR 6RE-015US 6700HQ, GeForce GTX 1070 Mobile, 83 Wh | Asus GL702VM-GC102D 6700HQ, GeForce GTX 1060 Mobile, 76 Wh | HP Omen 17-w110ng 6700HQ, GeForce GTX 1070 Mobile, 95 Wh | Gigabyte P57X v6 6700HQ, GeForce GTX 1070 Mobile, 75.81 Wh | |
|---|---|---|---|---|---|
| Duración de Batería | -3% | 10% | 19% | 11% | |
| Reader / Idle (h) | 5.3 | 5.4 2% | 5.9 11% | 7.2 36% | 7 32% |
| H.264 (h) | 3.8 | 4.4 16% | 3.9 3% | ||
| WiFi v1.3 (h) | 3.8 | 3.7 -3% | 4.2 11% | 4.1 8% | 3.4 -11% |
| Load (h) | 1.5 | 1.4 -7% | 1.5 0% | 1.9 27% | 1.7 13% |
Pro
Contra
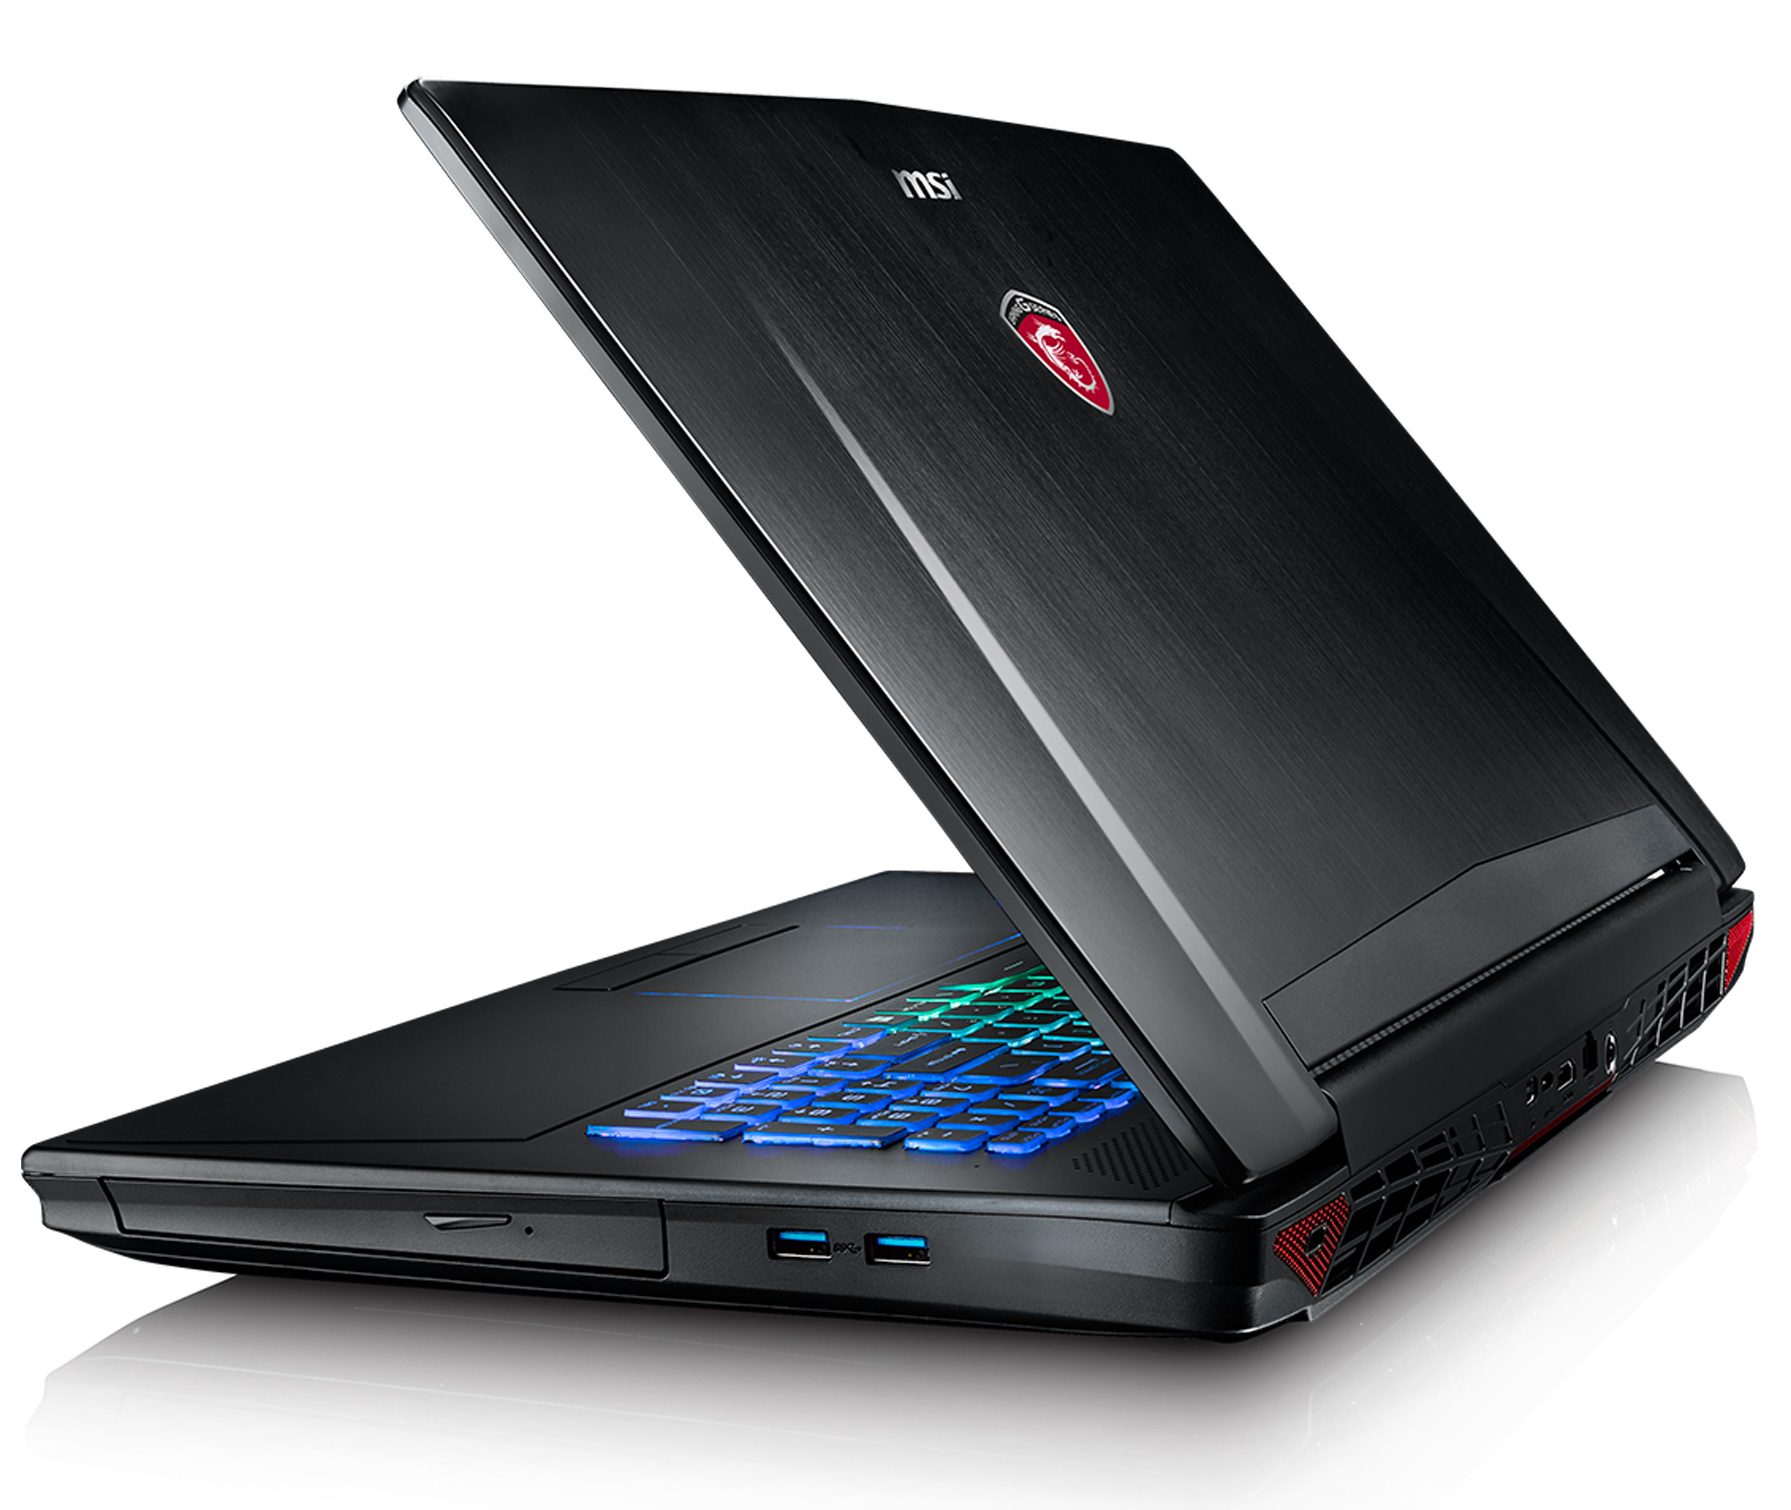
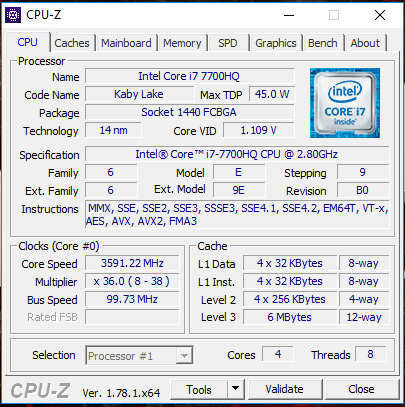
El potente hardware del GT72VR 7RE puedejugar a todos los juegos modernos en su resolución nativa Full HD con detalles altos a máximos. La tecnología Nvidia G-Sync asegura una presentación fluida en el display 120 Hz. El nuevo procesador quad-core Core i7-7700HQ Kaby Lake deja una buena impresión. Es ligeramente más rápida que su predecesor (Core i7-6700HQ), algo soportado por las puntuaciones de las pruebas. Sin embargo, las mejoras no son enormes.
El MSI GT72VR Dominator Pro es una máquina gaming exitosa.
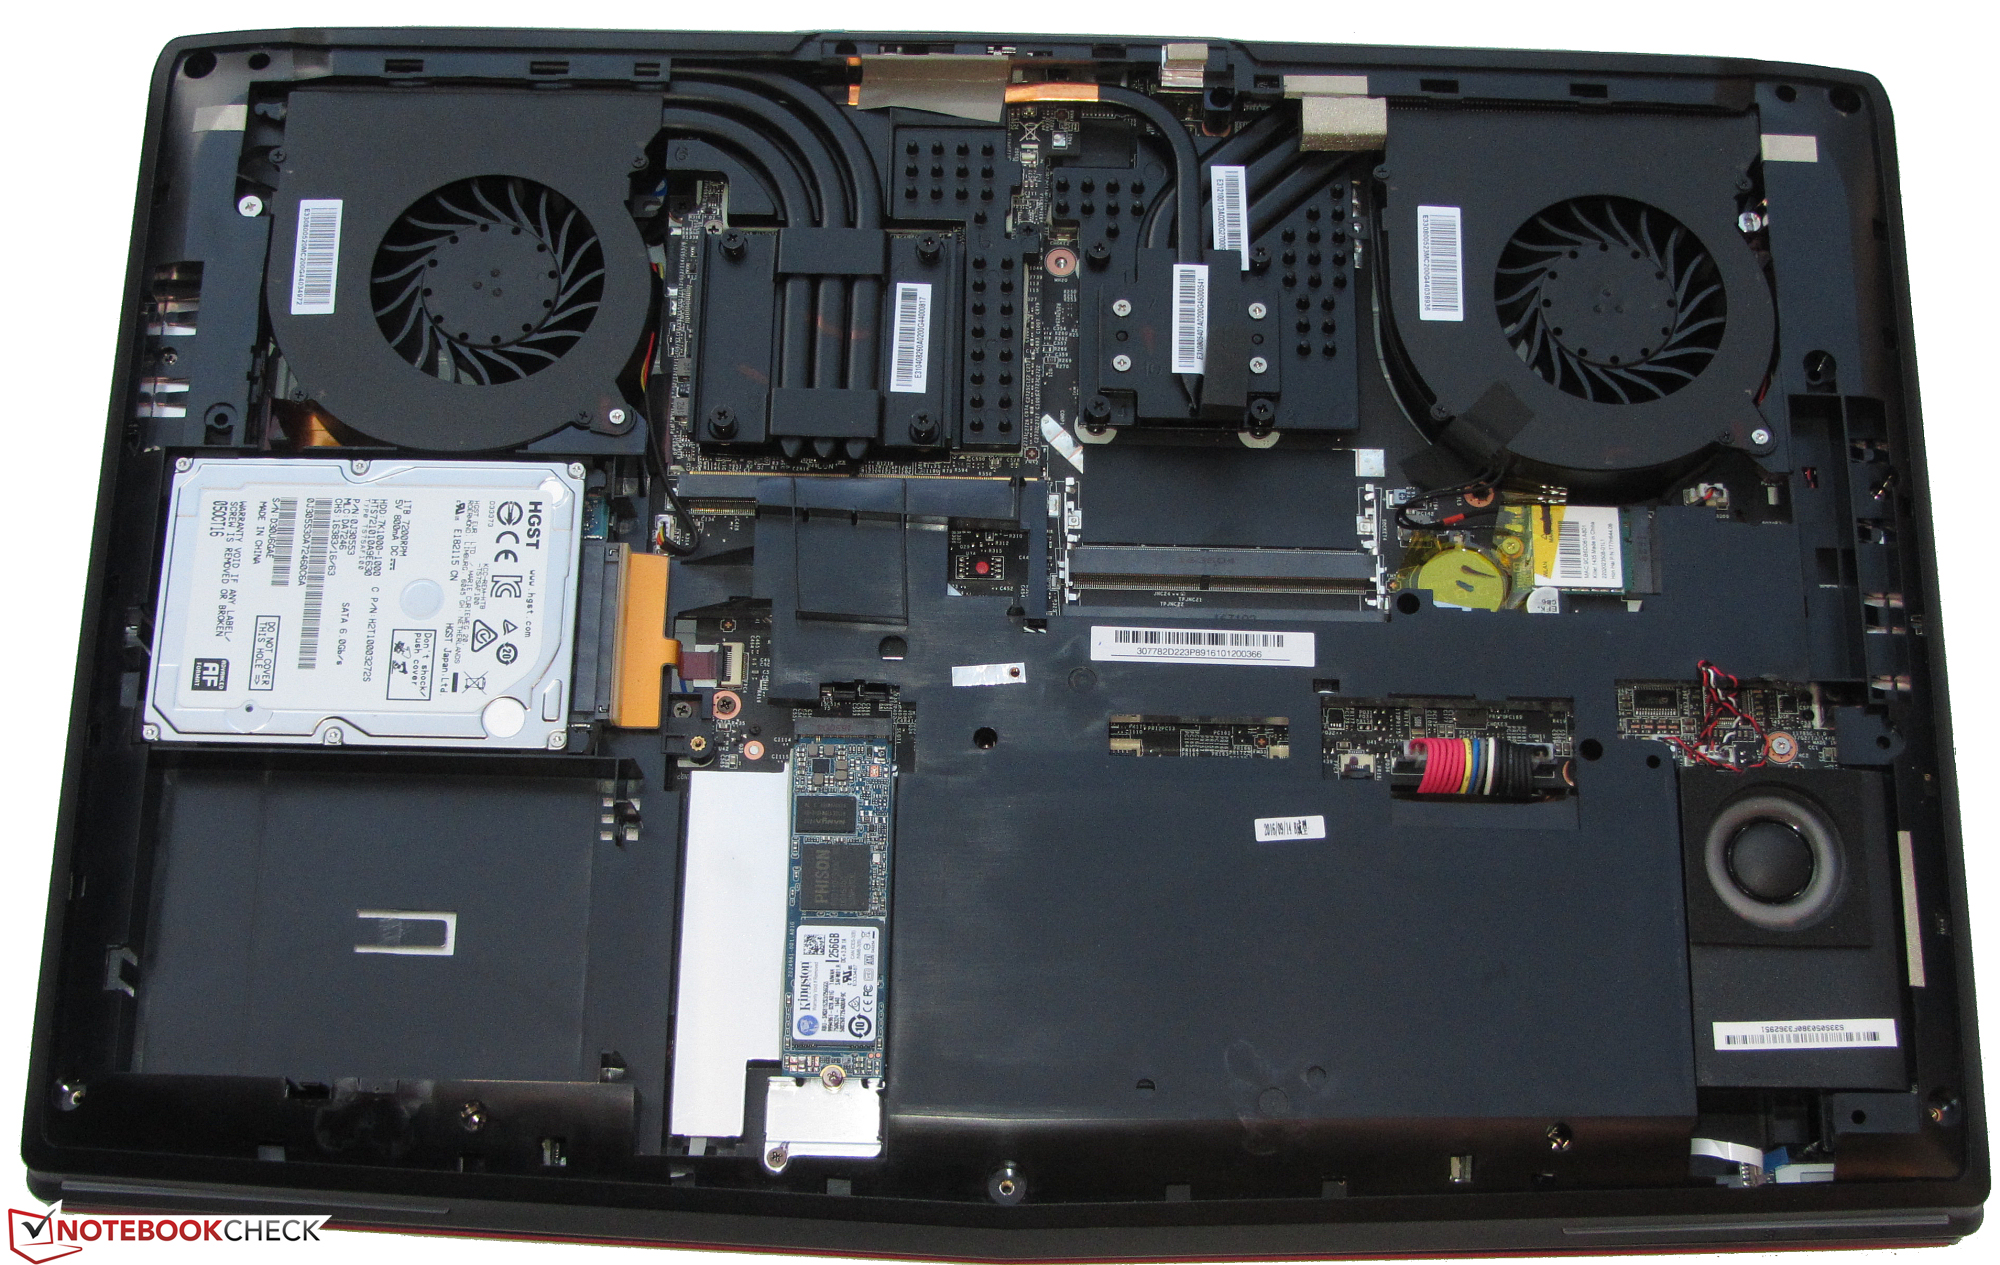
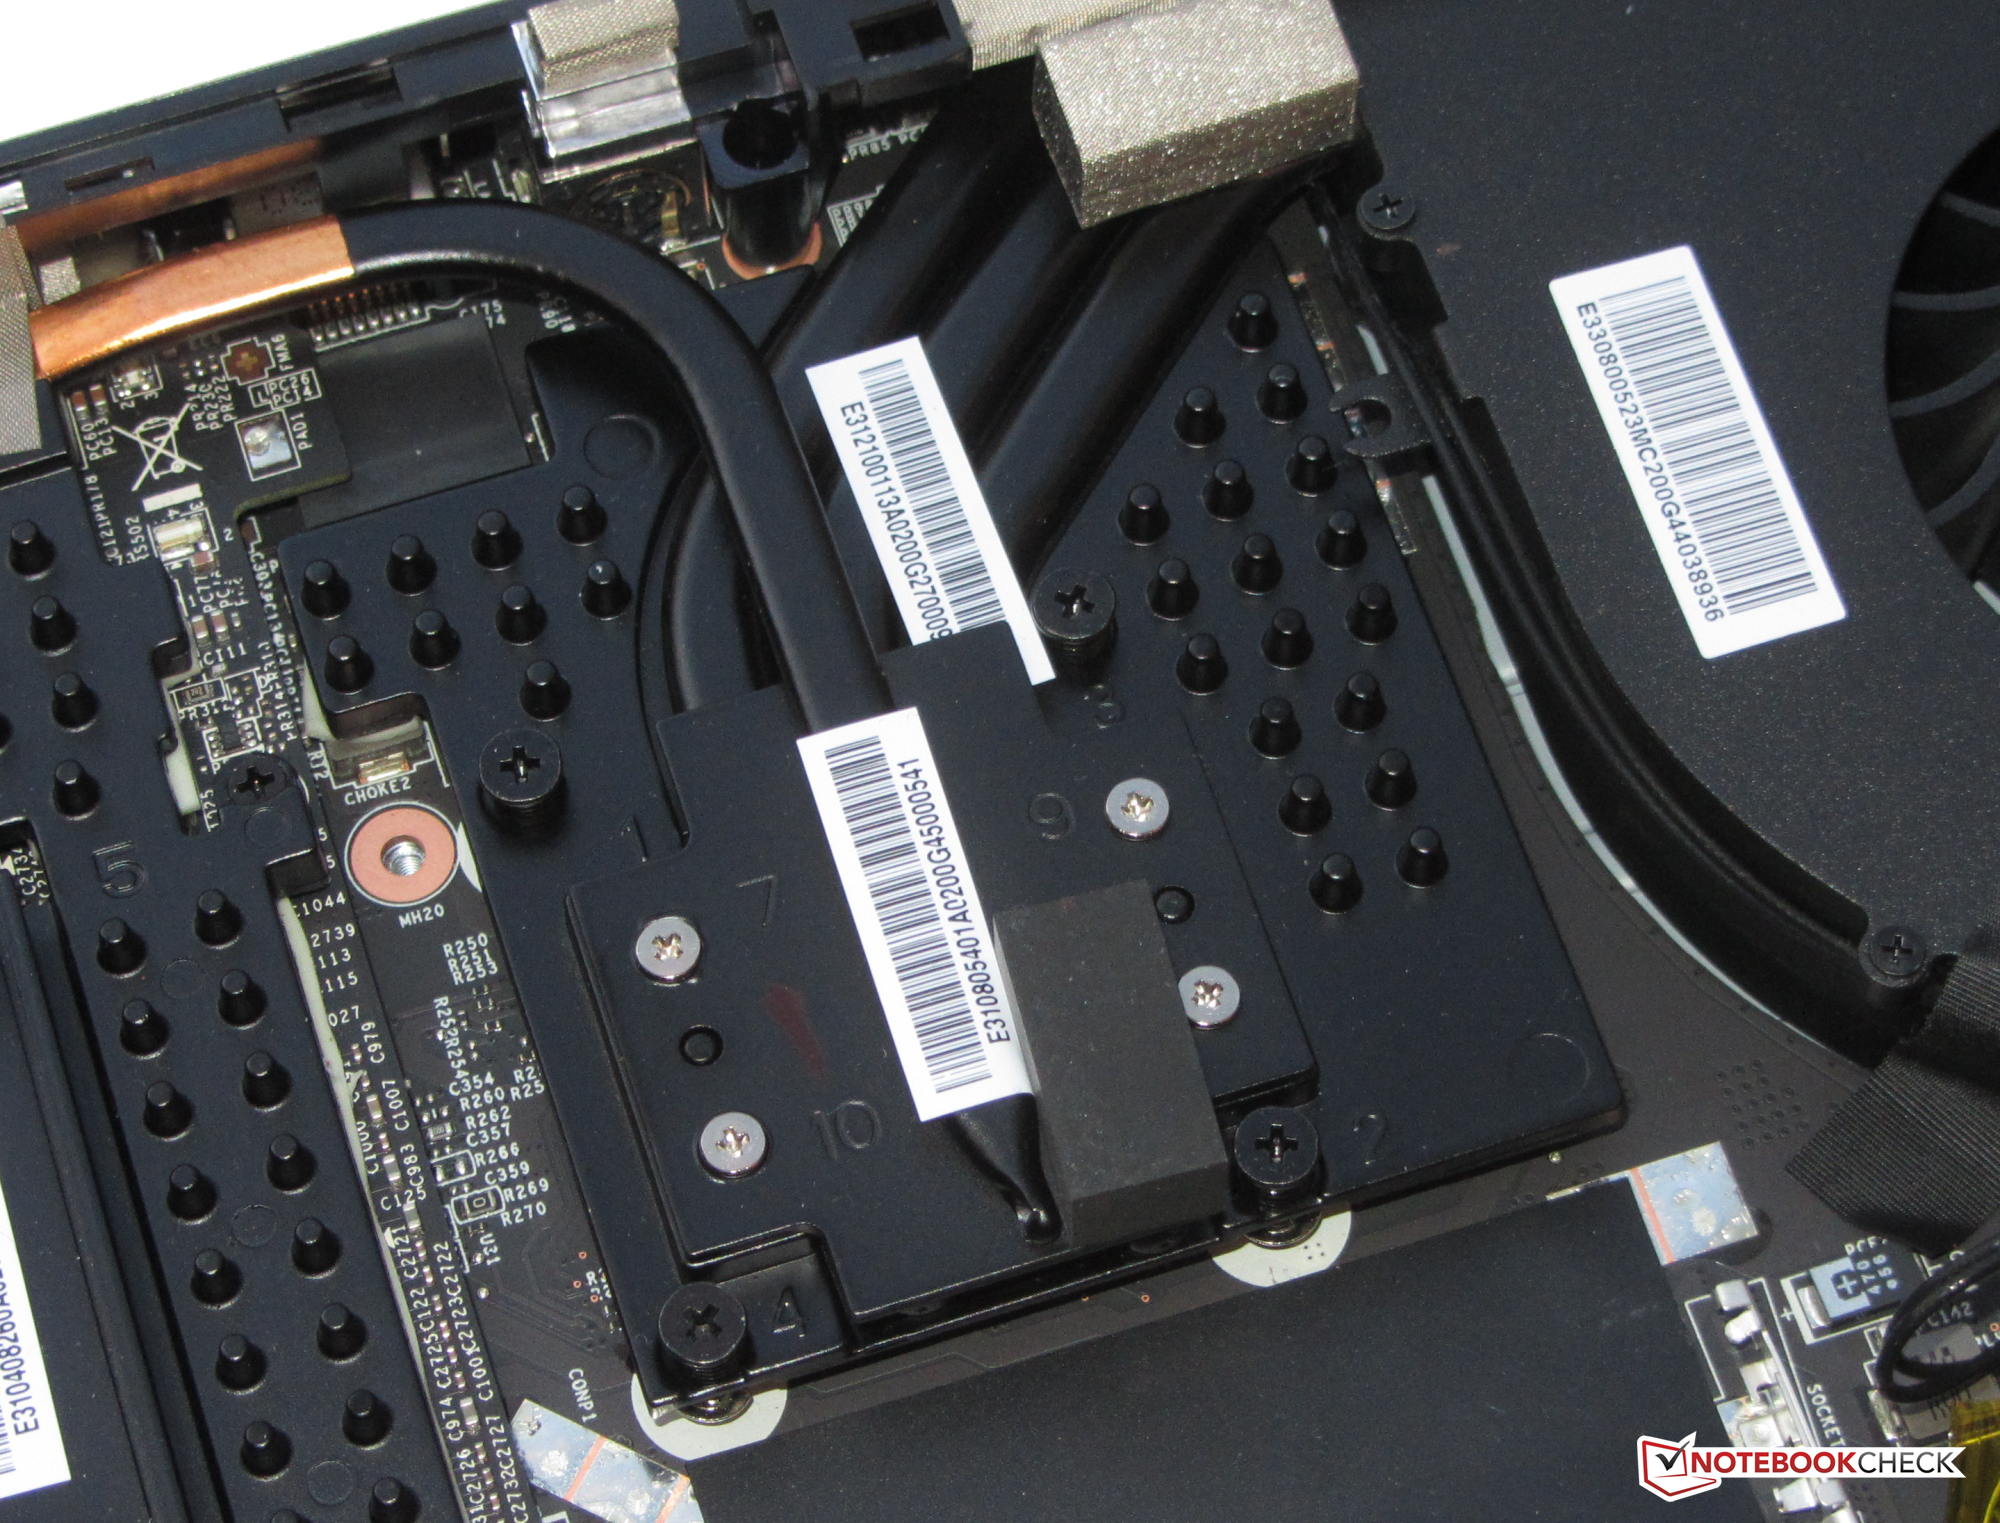
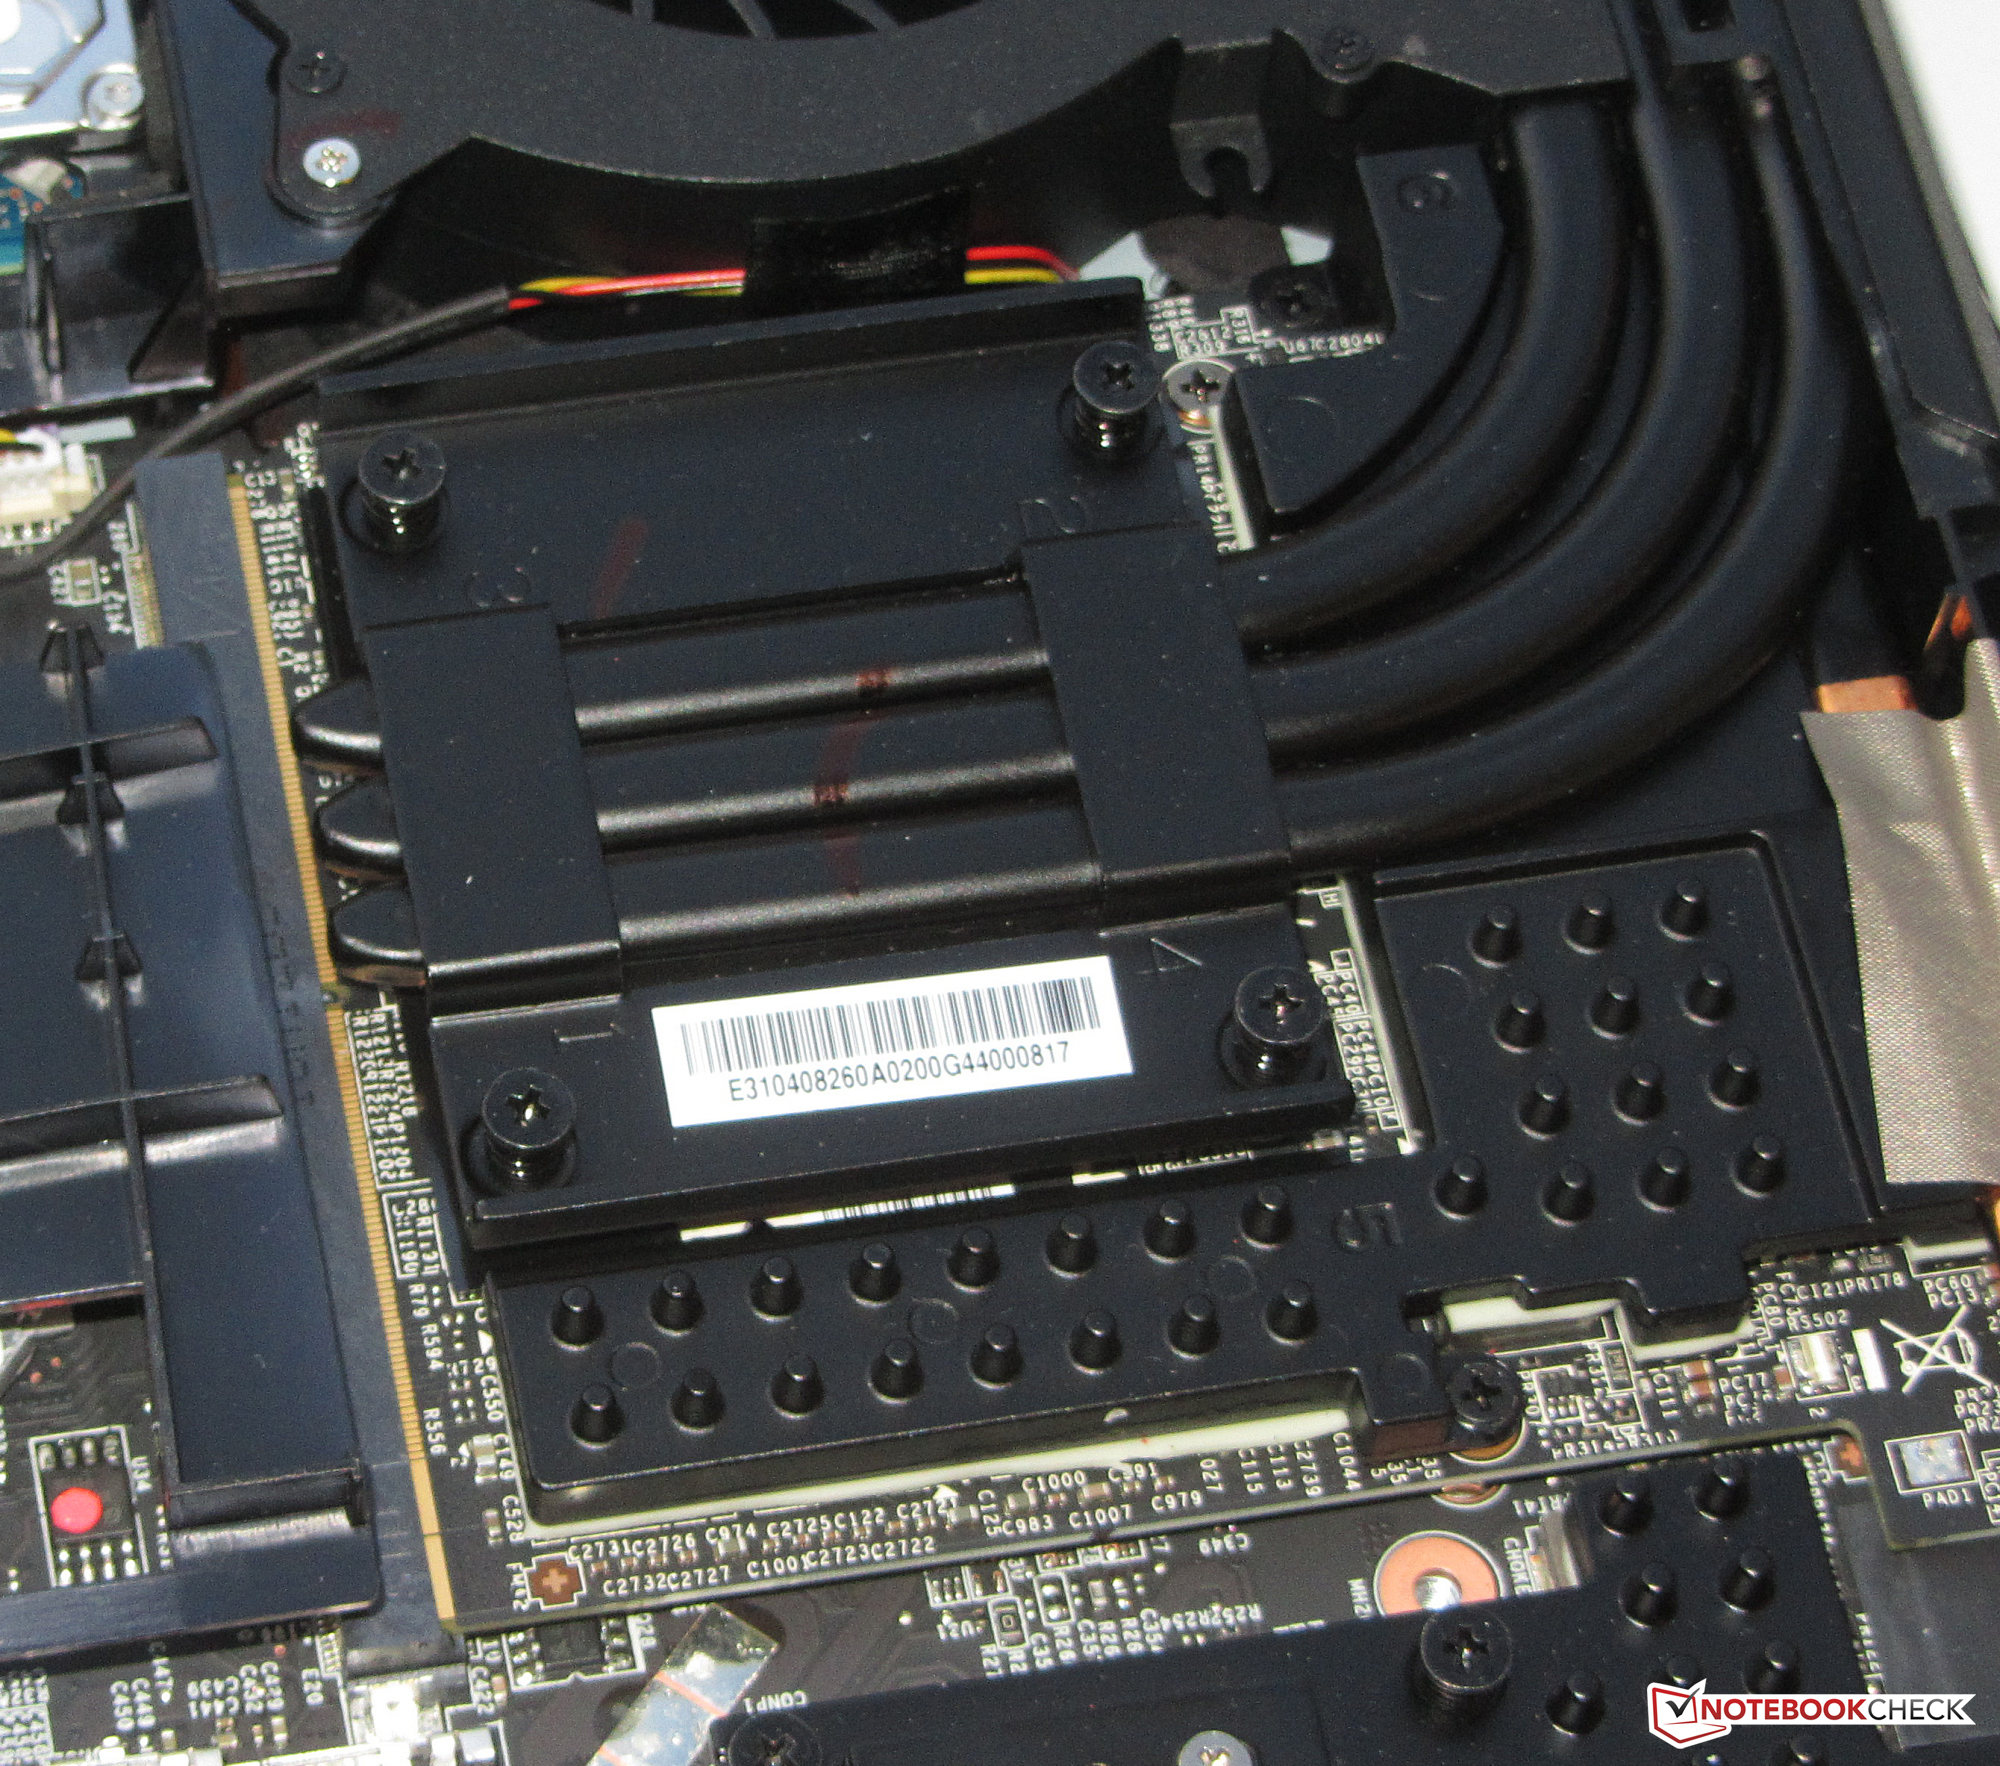
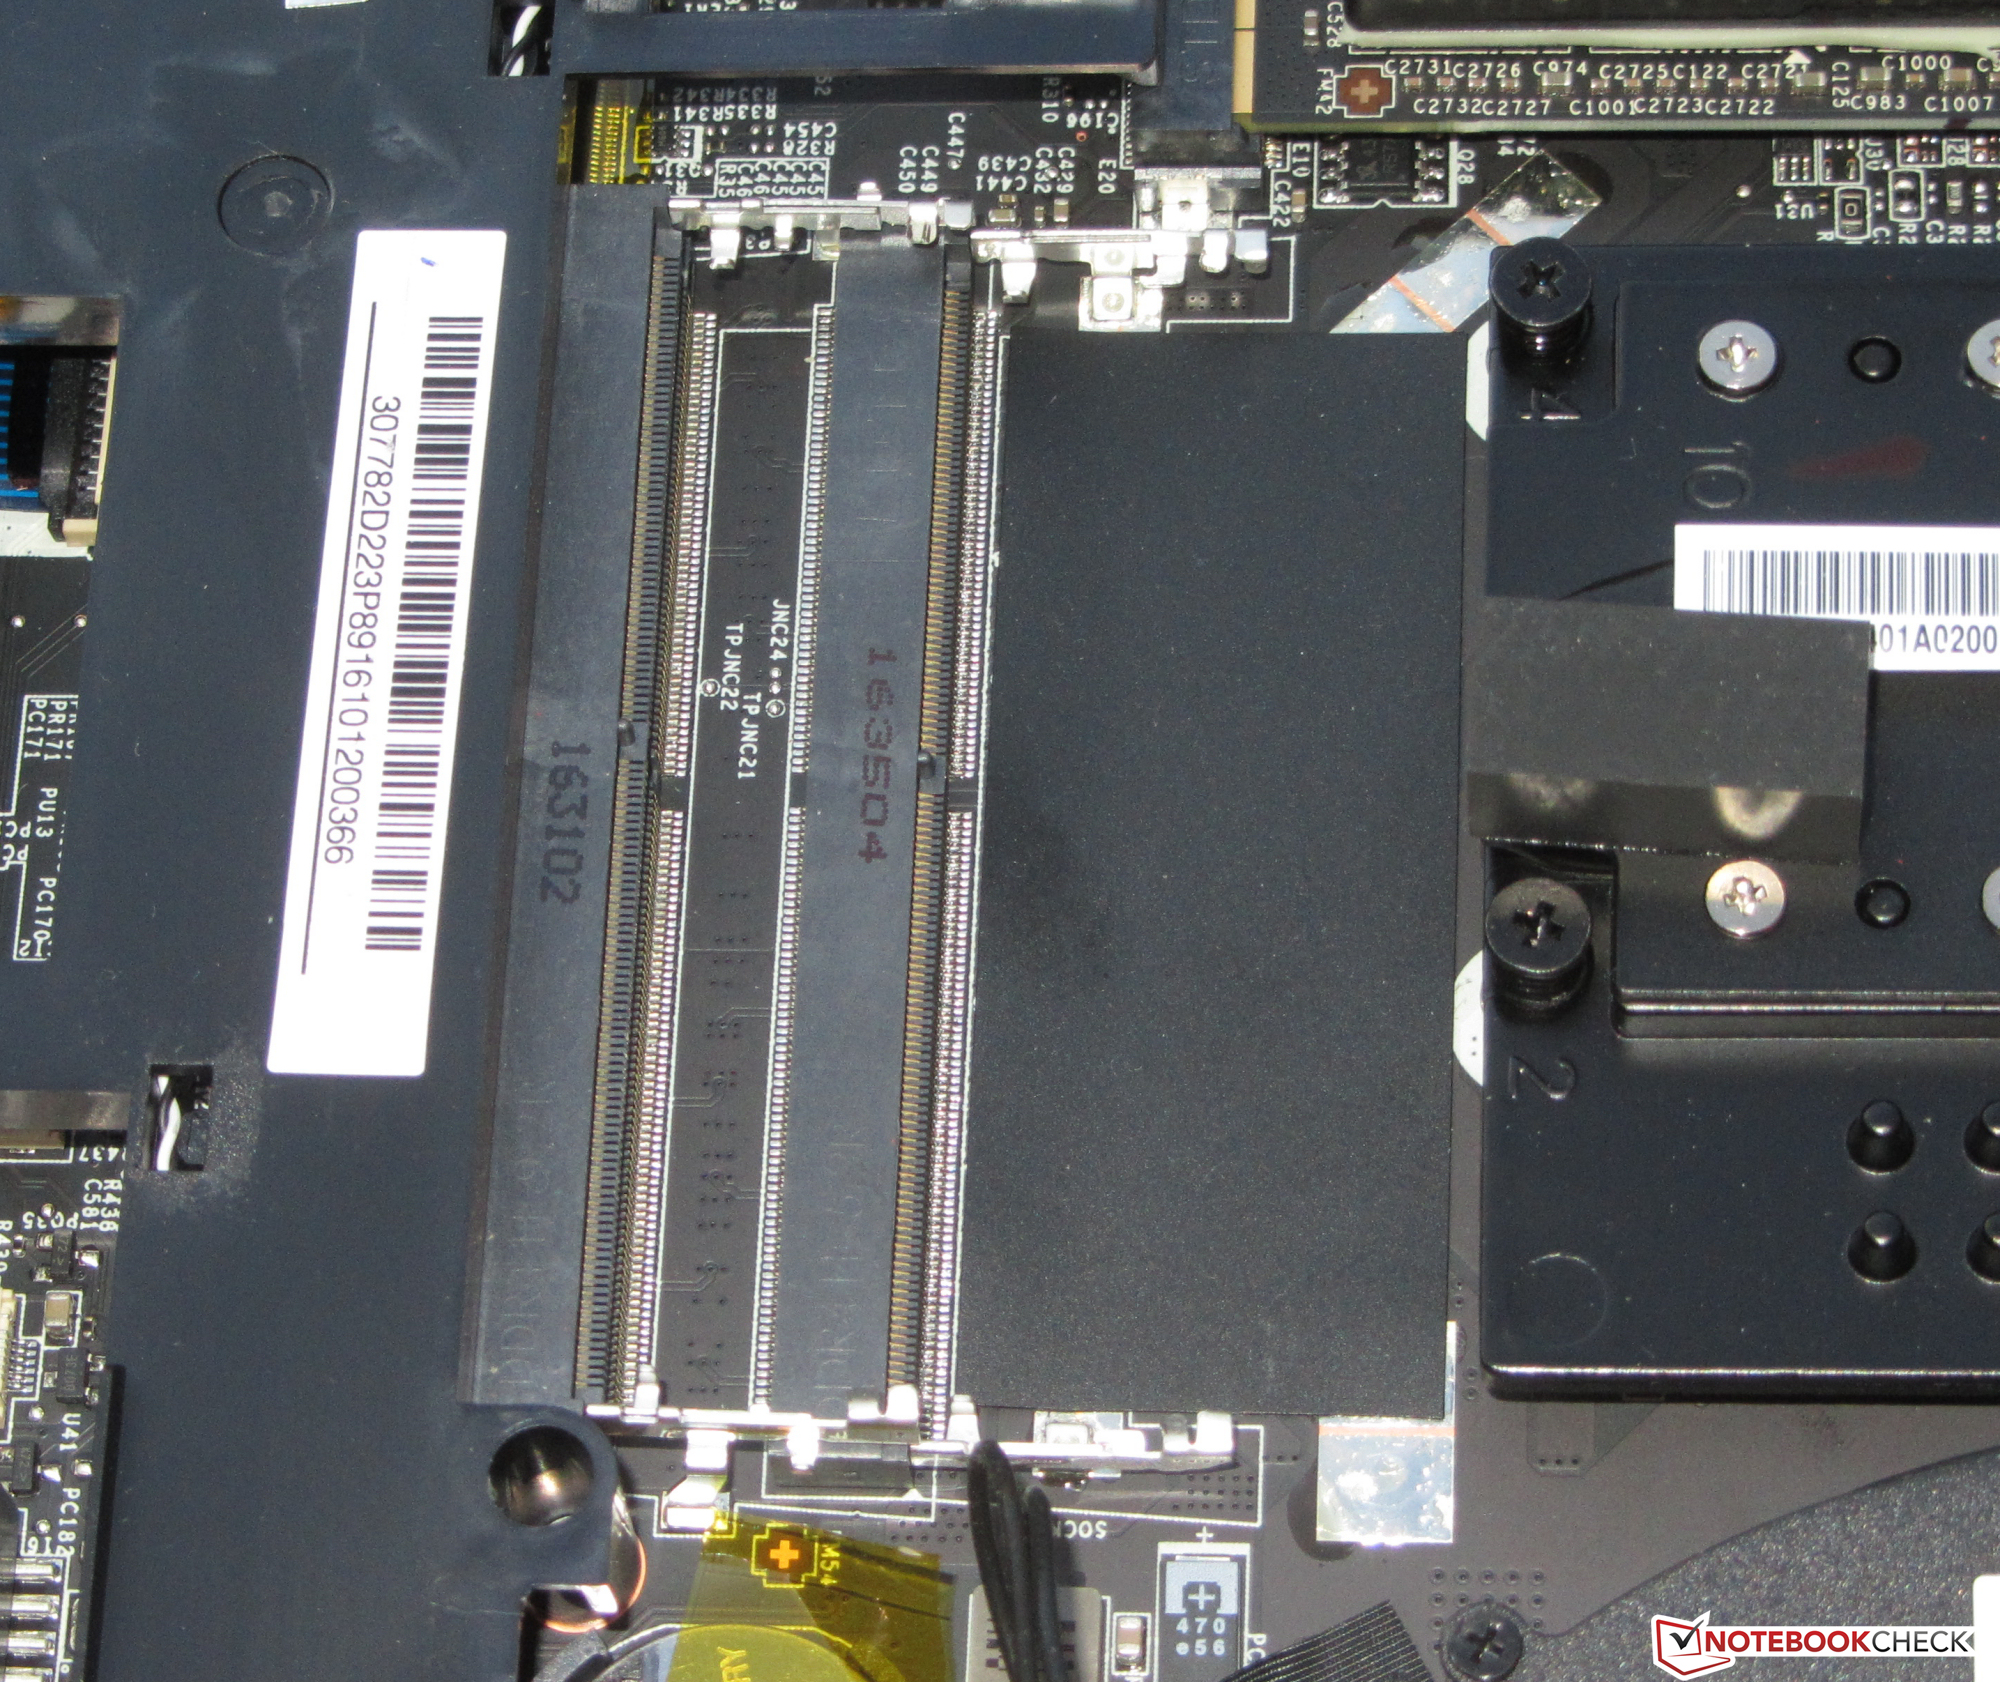
Un veloz SSD SATA-III asegura un sistema rápido, e incluso se puede sustituir por un disco PCIe/NVMe aún más rápido si es necesario. El espacio de almacenamiento requerido para juegos lo ofrece el HDD de 2.5" adicional. El modelo de 1 TB también podría cambiarse por uno aún mayor. Sólo tienes que sacar el panel inferior para cambiar los discos, lo que no tiene problema alguno.
La pantalla mate Full HD tiene una tasa de refresco de 120 Hz. Logra resultados decentes de brillo y un buen contraste. Sin embargo, no es un display IPS con amplios ángulos de visión, pero deja atrás a los paneles TN comunes en este aspecto.
Ésta es una versión acortada del análisis original. Puedes leer el análisis completo en inglés aquí.
MSI GT72VR 7RE-433
- 01/05/2017 v6 (old)
Sascha Mölck
Price comparison
