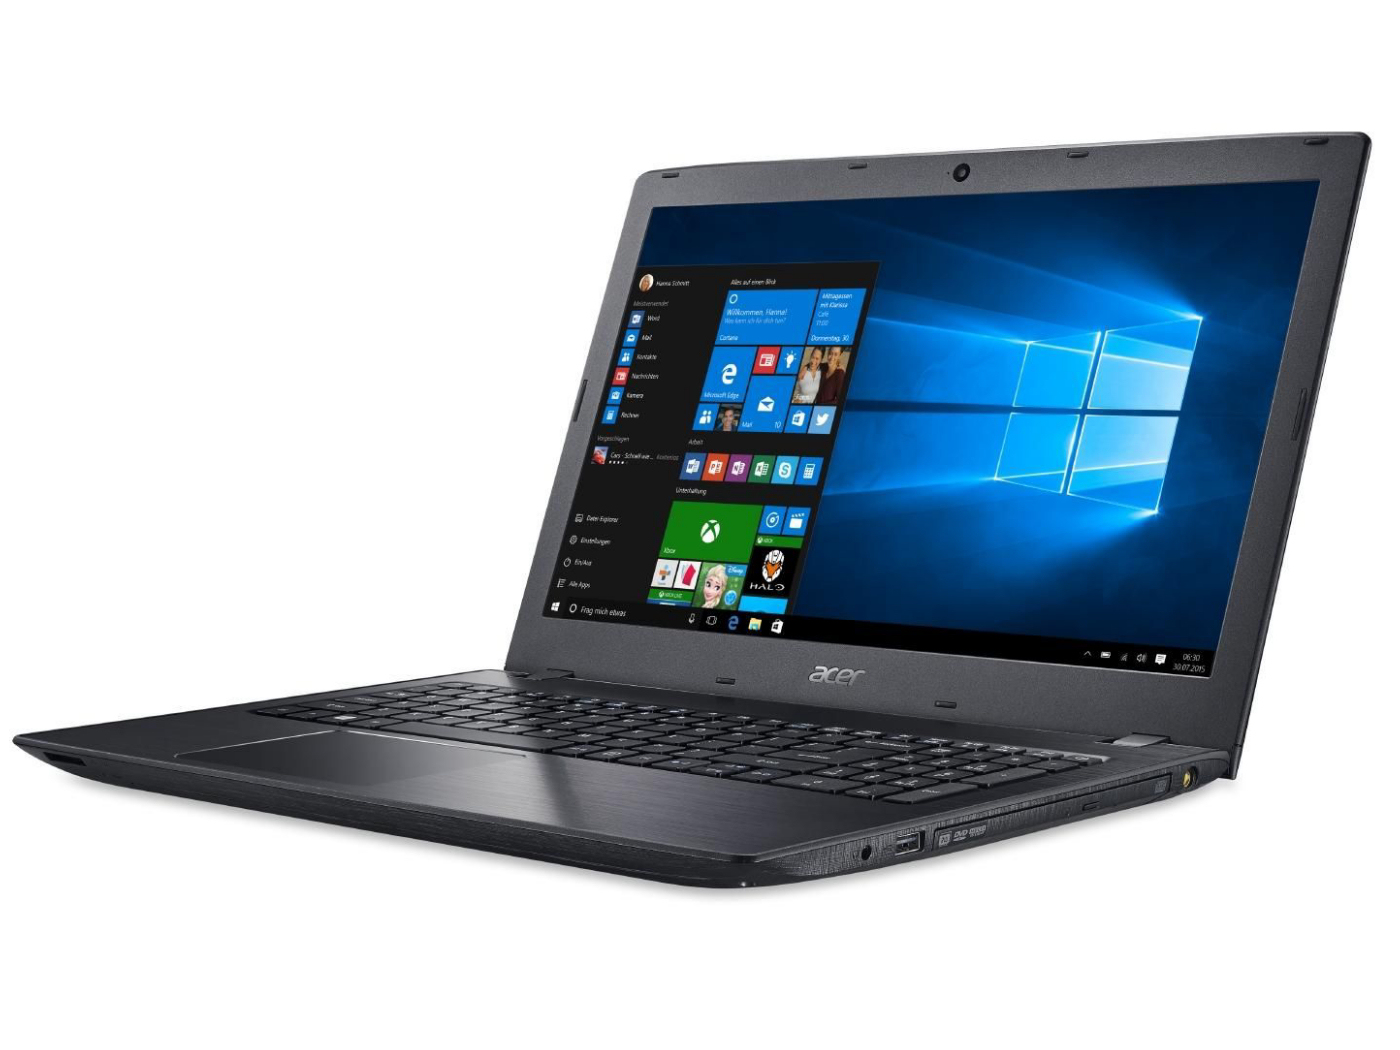
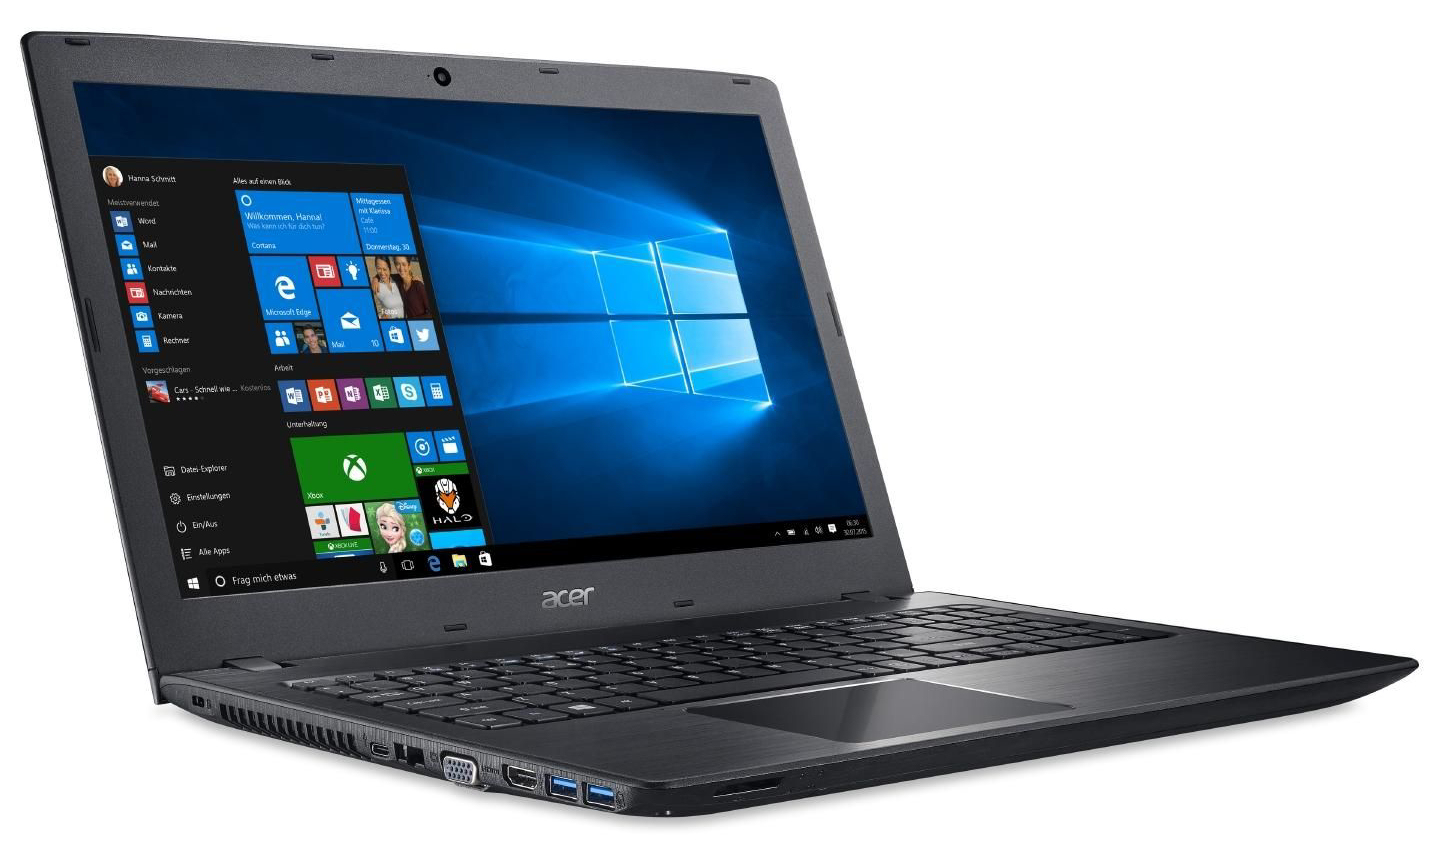
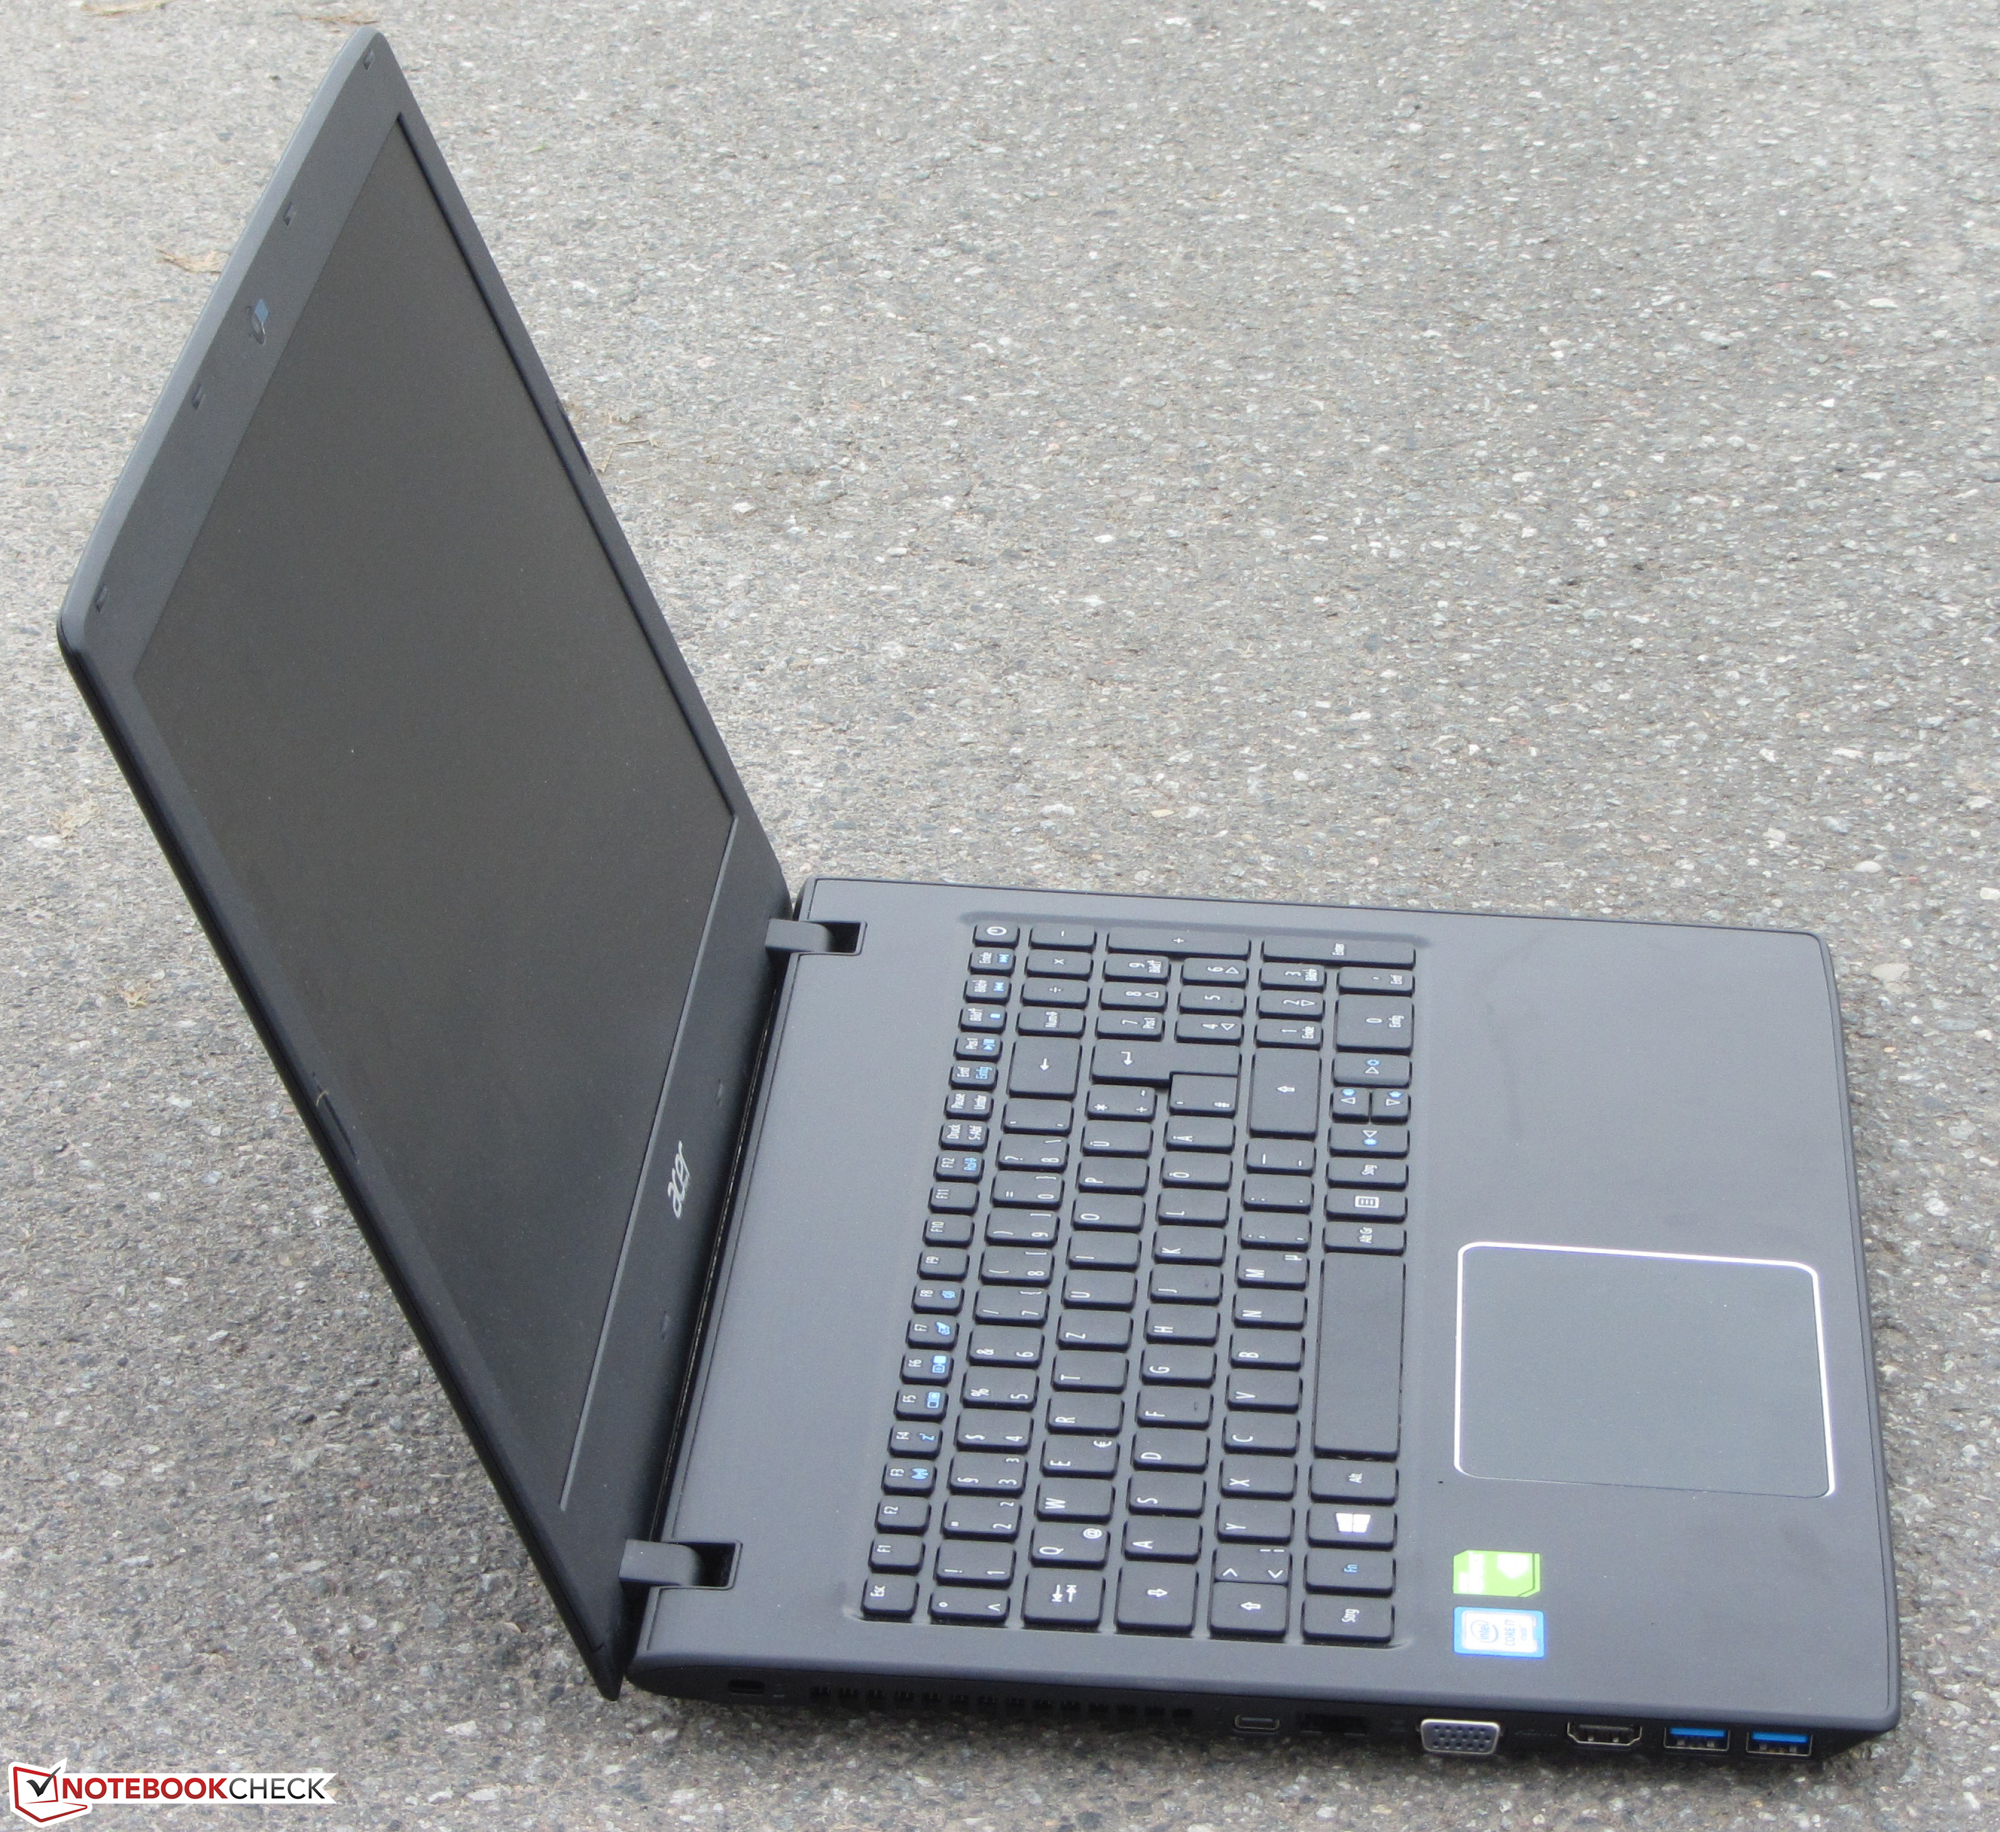
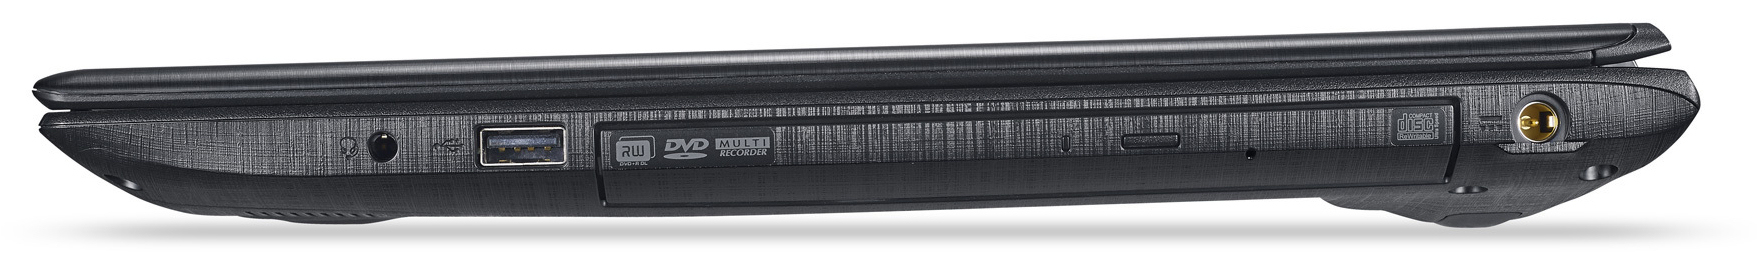
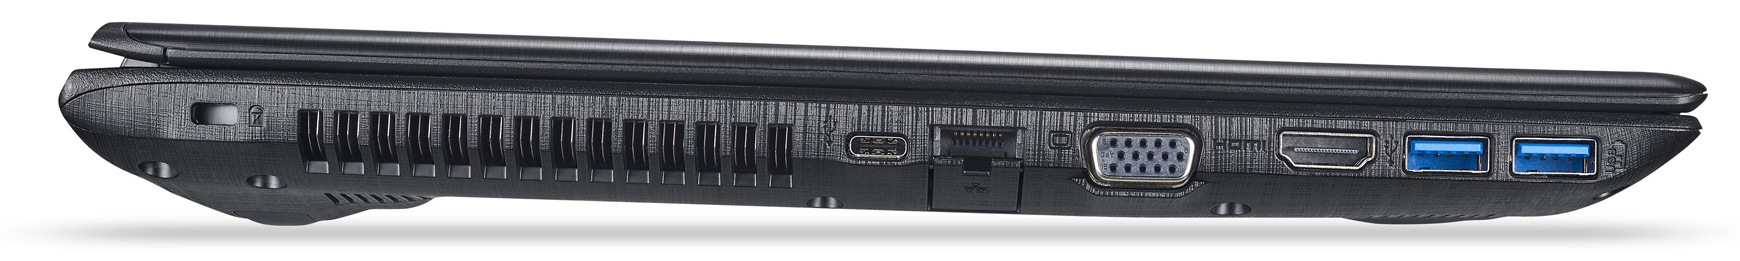
Breve análisis del Acer TravelMate P259-MG-71UU

| SD Card Reader | |
| average JPG Copy Test (av. of 3 runs) | |
| HP ProBook 450 G4 Y8B60EA | |
| Acer TravelMate P259-MG-71UU | |
| Lenovo ThinkPad E560-20EWS00000 | |
| Dell Latitude 15-3570 | |
| maximum AS SSD Seq Read Test (1GB) | |
| HP ProBook 450 G4 Y8B60EA | |
| Lenovo ThinkPad E560-20EWS00000 | |
| Dell Latitude 15-3570 | |
| Networking | |
| iperf Server (receive) TCP 1 m | |
| HP ProBook 450 G4 Y8B60EA | |
| iperf Client (transmit) TCP 1 m | |
| HP ProBook 450 G4 Y8B60EA | |
| iperf3 receive AX12 | |
| Acer TravelMate P259-MG-71UU | |
| iperf3 transmit AX12 | |
| Acer TravelMate P259-MG-71UU | |
| |||||||||||||||||||||||||
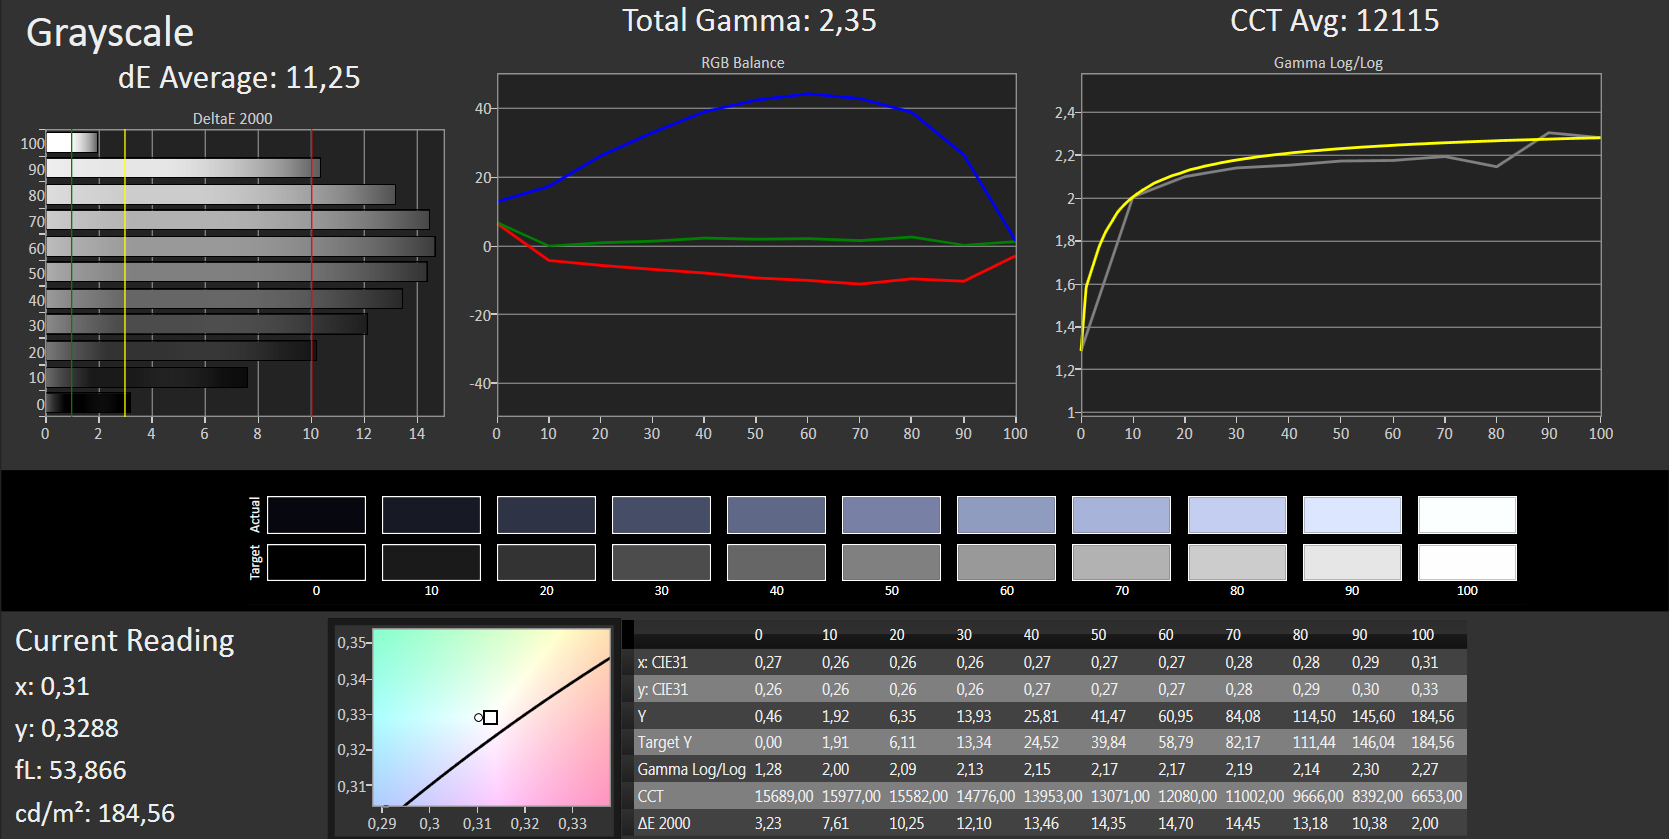
iluminación: 93 %
Brillo con batería: 180 cd/m²
Contraste: 400:1 (Negro: 0.45 cd/m²)
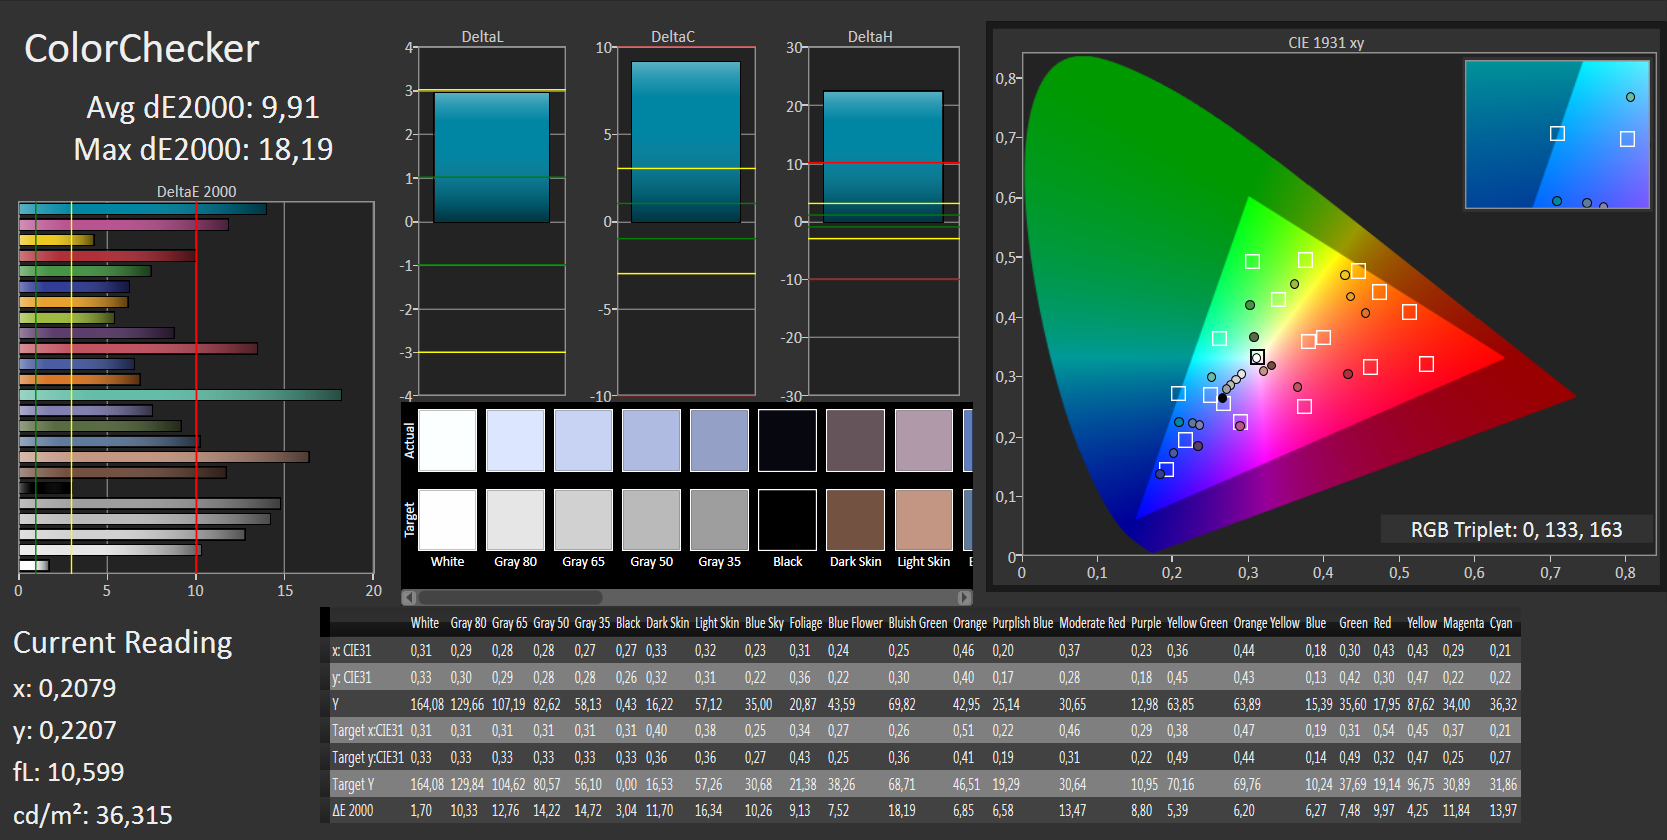
ΔE ColorChecker Calman: 9.91 | ∀{0.5-29.43 Ø4.71}
ΔE Greyscale Calman: 11.25 | ∀{0.09-98 Ø4.96}
58% sRGB (Argyll 1.6.3 3D)
37% AdobeRGB 1998 (Argyll 1.6.3 3D)
39.85% AdobeRGB 1998 (Argyll 3D)
58% sRGB (Argyll 3D)
38.58% Display P3 (Argyll 3D)
Gamma: 2.35
CCT: 12115 K
| Acer TravelMate P259-MG-71UU TN LED, 1920x1080, 15.6" | HP ProBook 450 G4 Y8B60EA TN LED, 1920x1080, 15.6" | Lenovo ThinkPad E560-20EWS00000 IPS-Panel, 1920x1080, 15.6" | Dell Latitude 15-3570 TN LED, 1366x768, 15.6" | Fujitsu LifeBook A556 PL 1366x768, 15.6" | |
|---|---|---|---|---|---|
| Display | 3% | -0% | 5% | 6% | |
| Display P3 Coverage (%) | 38.58 | 39.89 3% | 38.5 0% | 40.61 5% | 41.18 7% |
| sRGB Coverage (%) | 58 | 59.5 3% | 57.5 -1% | 61.1 5% | 60.9 5% |
| AdobeRGB 1998 Coverage (%) | 39.85 | 41.24 3% | 39.8 0% | 41.96 5% | 42.7 7% |
| Response Times | -28% | 5% | -27% | ||
| Response Time Grey 50% / Grey 80% * (ms) | 43 ? | 51 ? -19% | 38.4 ? 11% | 37 ? 14% | |
| Response Time Black / White * (ms) | 22 ? | 30 ? -36% | 22.4 ? -2% | 37 ? -68% | |
| PWM Frequency (Hz) | 50 ? | ||||
| Screen | 4% | 35% | -7% | -35% | |
| Brightness middle (cd/m²) | 180 | 214 19% | 257 43% | 202 12% | 250.7 39% |
| Brightness (cd/m²) | 178 | 201 13% | 234 31% | 211 19% | 249 40% |
| Brightness Distribution (%) | 93 | 77 -17% | 83 -11% | 88 -5% | 83 -11% |
| Black Level * (cd/m²) | 0.45 | 0.43 4% | 0.27 40% | 0.62 -38% | 1.3 -189% |
| Contrast (:1) | 400 | 498 25% | 952 138% | 326 -18% | 193 -52% |
| Colorchecker dE 2000 * | 9.91 | 10.68 -8% | 7.16 28% | 12.35 -25% | |
| Colorchecker dE 2000 max. * | 18.19 | 18.07 1% | 19.9 -9% | ||
| Greyscale dE 2000 * | 11.25 | 11.32 -1% | 6.28 44% | 13.46 -20% | |
| Gamma | 2.35 94% | 2.26 97% | 2.44 90% | 2.44 90% | |
| CCT | 12115 54% | 12204 53% | 6806 96% | 15217 43% | |
| Color Space (Percent of AdobeRGB 1998) (%) | 37 | 38 3% | 36.6 -1% | 39 5% | |
| Color Space (Percent of sRGB) (%) | 58 | 59 2% | 57.3 -1% | 61 5% | |
| Media total (Programa/Opciones) | -7% /
-0% | 13% /
23% | -10% /
-8% | -15% /
-19% |
* ... más pequeño es mejor
Parpadeo de Pantalla / PWM (Pulse-Width Modulation)
| Parpadeo de Pantalla / PWM no detectado | ||
Comparación: 52 % de todos los dispositivos testados no usaron PWM para atenuar el display. Si se usó, medimos una media de 7754 (mínimo: 5 - máxmo: 343500) Hz. | ||
Tiempos de respuesta del display
| ↔ Tiempo de respuesta de Negro a Blanco | ||
|---|---|---|
| 22 ms ... subida ↗ y bajada ↘ combinada | ↗ 6 ms subida | 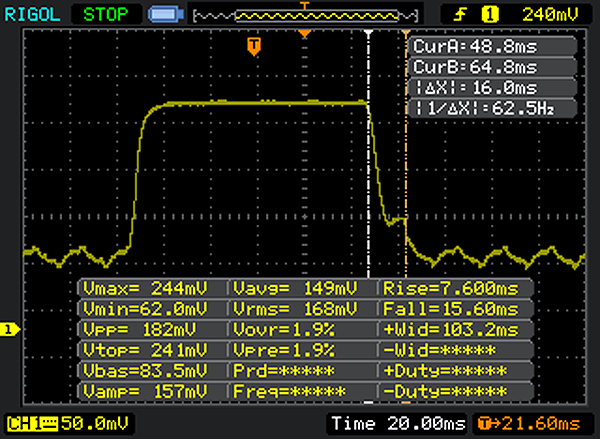 |
| ↘ 16 ms bajada | ||
| La pantalla mostró buenos tiempos de respuesta en nuestros tests pero podría ser demasiado lenta para los jugones competitivos. En comparación, todos los dispositivos de prueba van de ##min### (mínimo) a 240 (máximo) ms. » 49 % de todos los dispositivos son mejores. Eso quiere decir que el tiempo de respuesta es peor que la media (19.8 ms) de todos los dispositivos testados. | ||
| ↔ Tiempo de respuesta 50% Gris a 80% Gris | ||
| 43 ms ... subida ↗ y bajada ↘ combinada | ↗ 20 ms subida | 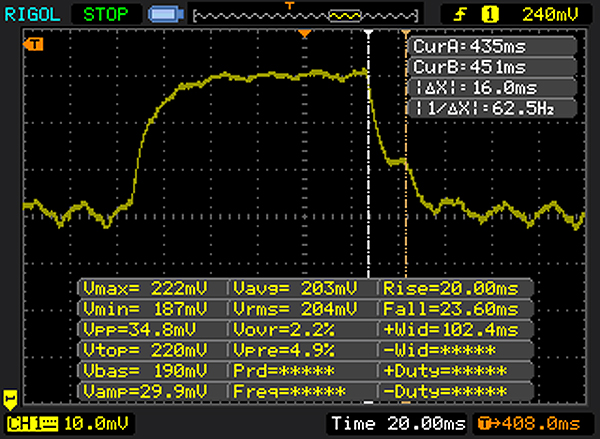 |
| ↘ 23 ms bajada | ||
| La pantalla mostró tiempos de respuesta lentos en nuestros tests y podría ser demasiado lenta para los jugones. En comparación, todos los dispositivos de prueba van de ##min### (mínimo) a 636 (máximo) ms. » 71 % de todos los dispositivos son mejores. Eso quiere decir que el tiempo de respuesta es peor que la media (31 ms) de todos los dispositivos testados. | ||
| Cinebench R15 | |
| CPU Single 64Bit | |
| HP ProBook 450 G4 Y8B60EA | |
| Acer TravelMate P259-MG-71UU | |
| Lenovo ThinkPad E560-20EWS00000 | |
| Dell Latitude 15-3570 | |
| Fujitsu LifeBook A556 PL | |
| CPU Multi 64Bit | |
| HP ProBook 450 G4 Y8B60EA | |
| Acer TravelMate P259-MG-71UU | |
| Lenovo ThinkPad E560-20EWS00000 | |
| Dell Latitude 15-3570 | |
| Fujitsu LifeBook A556 PL | |
| Cinebench R11.5 | |
| CPU Multi 64Bit | |
| Lenovo ThinkPad E560-20EWS00000 | |
| Acer TravelMate P259-MG-71UU | |
| CPU Single 64Bit | |
| Acer TravelMate P259-MG-71UU | |
| Lenovo ThinkPad E560-20EWS00000 | |
| Cinebench R10 | |
| Rendering Multiple CPUs 32Bit | |
| Acer TravelMate P259-MG-71UU | |
| Lenovo ThinkPad E560-20EWS00000 | |
| Rendering Single 32Bit | |
| Lenovo ThinkPad E560-20EWS00000 | |
| Acer TravelMate P259-MG-71UU | |
| Geekbench 3 | |
| 32 Bit Single-Core Score | |
| Acer TravelMate P259-MG-71UU | |
| Lenovo ThinkPad E560-20EWS00000 | |
| 32 Bit Multi-Core Score | |
| Acer TravelMate P259-MG-71UU | |
| Lenovo ThinkPad E560-20EWS00000 | |
| Geekbench 4.0 | |
| 64 Bit Single-Core Score | |
| Acer TravelMate P259-MG-71UU | |
| 64 Bit Multi-Core Score | |
| Acer TravelMate P259-MG-71UU | |
| JetStream 1.1 - 1.1 Total | |
| HP ProBook 450 G4 Y8B60EA | |
| Lenovo ThinkPad E560-20EWS00000 | |
| Acer TravelMate P259-MG-71UU | |
| Mozilla Kraken 1.1 - Total | |
| Acer TravelMate P259-MG-71UU | |
| Lenovo ThinkPad E560-20EWS00000 | |
| HP ProBook 450 G4 Y8B60EA | |
* ... más pequeño es mejor
| PCMark 7 Score | 4890 puntos | |
| PCMark 8 Home Score Accelerated v2 | 3823 puntos | |
| PCMark 8 Creative Score Accelerated v2 | 4112 puntos | |
| PCMark 8 Work Score Accelerated v2 | 4699 puntos | |
ayuda | ||
| PCMark 8 | |
| Home Score Accelerated v2 | |
| Acer TravelMate P259-MG-71UU | |
| Lenovo ThinkPad E560-20EWS00000 | |
| Dell Latitude 15-3570 | |
| HP ProBook 450 G4 Y8B60EA | |
| Work Score Accelerated v2 | |
| HP ProBook 450 G4 Y8B60EA | |
| Acer TravelMate P259-MG-71UU | |
| Lenovo ThinkPad E560-20EWS00000 | |
| Dell Latitude 15-3570 | |

| Acer TravelMate P259-MG-71UU Liteonit CV3-8D256 | Lenovo ThinkPad E560-20EWS00000 Samsung CM871 MZ7LF192HCGS | Dell Latitude 15-3570 Samsung CM871 MZNLF128HCHP | Fujitsu LifeBook A556 PL Toshiba MQ02ABF050H (SSHD 500 + 8 GB) | |
|---|---|---|---|---|
| CrystalDiskMark 3.0 | -38% | -44% | -89% | |
| Read Seq (MB/s) | 478.5 | 462 -3% | 453.2 -5% | 105.8 -78% |
| Write Seq (MB/s) | 258.2 | 174.5 -32% | 137.7 -47% | 88.8 -66% |
| Read 512 (MB/s) | 254.3 | 306.8 21% | 308.5 21% | 29.45 -88% |
| Write 512 (MB/s) | 264.8 | 168.6 -36% | 134.1 -49% | 36.9 -86% |
| Read 4k (MB/s) | 28.32 | 16.14 -43% | 19.06 -33% | 0.428 -98% |
| Write 4k (MB/s) | 76.3 | 36.24 -53% | 21.31 -72% | 0.646 -99% |
| Read 4k QD32 (MB/s) | 346.2 | 95.7 -72% | 93.5 -73% | 0.978 -100% |
| Write 4k QD32 (MB/s) | 240.2 | 36.23 -85% | 23.3 -90% | 0.615 -100% |
| 3DMark 06 Standard Score | 14930 puntos | |
| 3DMark 11 Performance | 3027 puntos | |
| 3DMark Ice Storm Standard Score | 48176 puntos | |
| 3DMark Cloud Gate Standard Score | 5606 puntos | |
| 3DMark Fire Strike Score | 2025 puntos | |
| 3DMark Fire Strike Extreme Score | 953 puntos | |
ayuda | ||
| 3DMark 11 - 1280x720 Performance GPU | |
| Acer TravelMate P259-MG-71UU | |
| Dell Inspiron 17 7778 | |
| Lenovo ThinkPad E470-20H2S00400 | |
| Lenovo ThinkPad E560-20EWS00000 | |
| HP ProBook 450 G4 Y8B60EA | |
| Fujitsu LifeBook A556 PL | |
| Dell Latitude 15-3570 | |
| 3DMark | |
| 1280x720 Cloud Gate Standard Graphics | |
| Acer TravelMate P259-MG-71UU | |
| Dell Inspiron 17 7778 | |
| Lenovo ThinkPad E560-20EWS00000 | |
| Lenovo ThinkPad E470-20H2S00400 | |
| HP ProBook 450 G4 Y8B60EA | |
| Fujitsu LifeBook A556 PL | |
| Dell Latitude 15-3570 | |
| 1920x1080 Fire Strike Graphics | |
| Acer TravelMate P259-MG-71UU | |
| Dell Inspiron 17 7778 | |
| Lenovo ThinkPad E560-20EWS00000 | |
| Lenovo ThinkPad E470-20H2S00400 | |
| HP ProBook 450 G4 Y8B60EA | |
| Fujitsu LifeBook A556 PL | |
| bajo | medio | alto | ultra | |
|---|---|---|---|---|
| Tomb Raider (2013) | 182.8 | 95.9 | 62.6 | 29.4 |
| BioShock Infinite (2013) | 117 | 70.9 | 61.9 | 24 |
| Battlefield 4 (2013) | 82.7 | 58.3 | 42.9 | 17.4 |
| FIFA 17 (2016) | 135.4 | 105.3 | 58.3 | 55 |
| Battlefield 1 (2016) | 61.7 | 40.5 | 19 | 17 |
| Civilization 6 (2016) | 48.8 | 26 | 13.5 | 10.5 |
| Farming Simulator 17 (2016) | 146.2 | 99.6 | 42.8 | 28.2 |
| Titanfall 2 (2016) | 68.6 | 44.8 | 20 | 16.4 |
| Call of Duty Infinite Warfare (2016) | 42.8 | 39.2 | 21.8 | 16.4 |
| Dishonored 2 (2016) | 33.4 | 26 | 13.6 | 11.3 |
| Watch Dogs 2 (2016) | 33.2 | 28.6 | 13.8 | 8.5 |
| BioShock Infinite - 1366x768 High Preset | |
| Acer TravelMate P259-MG-71UU | |
| Dell Inspiron 17 7778 | |
| Dell Vostro 15 5568 | |
| Lenovo ThinkPad E560-20EWS00000 | |
| Lenovo ThinkPad E470-20H2S00400 | |
| HP ProBook 450 G4 Y8B60EA | |
| Fujitsu LifeBook A556 PL | |
| Dell Latitude 15-3570 | |
| Battlefield 4 - 1366x768 Medium Preset | |
| Acer TravelMate P259-MG-71UU | |
| Lenovo ThinkPad E560-20EWS00000 | |
| Lenovo ThinkPad E470-20H2S00400 | |
| Dell Inspiron 17 7778 | |
Ruido
| Ocioso |
| 31.6 / 31.6 / 32 dB(A) |
| DVD |
| 35.8 / dB(A) |
| Carga |
| 35.5 / 38.3 dB(A) |
 | ||
30 dB silencioso 40 dB(A) audible 50 dB(A) ruidosamente alto |
||
min: | ||
| Acer TravelMate P259-MG-71UU 6500U, GeForce 940MX | HP ProBook 450 G4 Y8B60EA i7-7500U, GeForce 930MX | Lenovo ThinkPad E560-20EWS00000 6500U, Radeon R7 M370 | Dell Latitude 15-3570 6200U, HD Graphics 520 | Fujitsu LifeBook A556 PL 6200U, HD Graphics 520 | |
|---|---|---|---|---|---|
| Noise | -4% | 7% | 3% | -0% | |
| apagado / medio ambiente * (dB) | 30.5 | 31.6 -4% | 31 -2% | ||
| Idle Minimum * (dB) | 31.6 | 32.6 -3% | 29.2 8% | 31 2% | 30.9 2% |
| Idle Average * (dB) | 31.6 | 32.6 -3% | 29.2 8% | 31 2% | 31 2% |
| Idle Maximum * (dB) | 32 | 33 -3% | 29.2 9% | 31 3% | 31.1 3% |
| Load Average * (dB) | 35.5 | 38.9 -10% | 33.6 5% | 34.2 4% | 36.9 -4% |
| Load Maximum * (dB) | 38.3 | 38.9 -2% | 35.5 7% | 34.3 10% | 39.8 -4% |
* ... más pequeño es mejor
(+) La temperatura máxima en la parte superior es de 35.1 °C / 95 F, frente a la media de 34.3 °C / 94 F, que oscila entre 21.2 y 62.5 °C para la clase Office.
(-) El fondo se calienta hasta un máximo de 46.7 °C / 116 F, frente a la media de 36.8 °C / 98 F
(+) En reposo, la temperatura media de la parte superior es de 25.1 °C / 77# F, frente a la media del dispositivo de 29.5 °C / 85 F.
(+) Los reposamanos y el panel táctil alcanzan como máximo la temperatura de la piel (34 °C / 93.2 F) y, por tanto, no están calientes.
(-) La temperatura media de la zona del reposamanos de dispositivos similares fue de 27.5 °C / 81.5 F (-6.5 °C / -11.7 F).
| Acer TravelMate P259-MG-71UU 6500U, GeForce 940MX | HP ProBook 450 G4 Y8B60EA i7-7500U, GeForce 930MX | Lenovo ThinkPad E560-20EWS00000 6500U, Radeon R7 M370 | Dell Latitude 15-3570 6200U, HD Graphics 520 | Fujitsu LifeBook A556 PL 6200U, HD Graphics 520 | |
|---|---|---|---|---|---|
| Heat | -7% | -3% | -10% | 14% | |
| Maximum Upper Side * (°C) | 35.1 | 44.3 -26% | 45 -28% | 36.1 -3% | 33.2 5% |
| Maximum Bottom * (°C) | 46.7 | 46.3 1% | 39.8 15% | 47 -1% | 30.1 36% |
| Idle Upper Side * (°C) | 27 | 27.8 -3% | 26.1 3% | 31.7 -17% | 25.3 6% |
| Idle Bottom * (°C) | 27.4 | 27.7 -1% | 27.7 -1% | 32.9 -20% | 25 9% |
* ... más pequeño es mejor
Acer TravelMate P259-MG-71UU análisis de audio
(±) | la sonoridad del altavoz es media pero buena (73 dB)
Graves 100 - 315 Hz
(-) | casi sin bajos - de media 24.4% inferior a la mediana
(±) | la linealidad de los graves es media (11.7% delta a frecuencia anterior)
Medios 400 - 2000 Hz
(+) | medios equilibrados - a sólo 4.1% de la mediana
(±) | la linealidad de los medios es media (11.3% delta respecto a la frecuencia anterior)
Altos 2 - 16 kHz
(±) | máximos más altos - de media 7.5% más altos que la mediana
(±) | la linealidad de los máximos es media (8.5% delta a frecuencia anterior)
Total 100 - 16.000 Hz
(±) | la linealidad del sonido global es media (26.8% de diferencia con la mediana)
En comparación con la misma clase
» 82% de todos los dispositivos probados de esta clase eran mejores, 6% similares, 11% peores
» El mejor tuvo un delta de 7%, la media fue 21%, el peor fue ###max##%
En comparación con todos los dispositivos probados
» 82% de todos los dispositivos probados eran mejores, 4% similares, 14% peores
» El mejor tuvo un delta de 4%, la media fue 23%, el peor fue ###max##%
Apple MacBook 12 (Early 2016) 1.1 GHz análisis de audio
(+) | los altavoces pueden reproducir a un volumen relativamente alto (#83.6 dB)
Graves 100 - 315 Hz
(±) | lubina reducida - en promedio 11.3% inferior a la mediana
(±) | la linealidad de los graves es media (14.2% delta a frecuencia anterior)
Medios 400 - 2000 Hz
(+) | medios equilibrados - a sólo 2.4% de la mediana
(+) | los medios son lineales (5.5% delta a la frecuencia anterior)
Altos 2 - 16 kHz
(+) | máximos equilibrados - a sólo 2% de la mediana
(+) | los máximos son lineales (4.5% delta a la frecuencia anterior)
Total 100 - 16.000 Hz
(+) | el sonido global es lineal (10.2% de diferencia con la mediana)
En comparación con la misma clase
» 7% de todos los dispositivos probados de esta clase eran mejores, 2% similares, 90% peores
» El mejor tuvo un delta de 5%, la media fue 18%, el peor fue ###max##%
En comparación con todos los dispositivos probados
» 5% de todos los dispositivos probados eran mejores, 1% similares, 94% peores
» El mejor tuvo un delta de 4%, la media fue 23%, el peor fue ###max##%
| Off / Standby | |
| Ocioso | |
| Carga |
|
Clave:
min: | |
| Acer TravelMate P259-MG-71UU 6500U, GeForce 940MX | HP ProBook 450 G4 Y8B60EA i7-7500U, GeForce 930MX | Lenovo ThinkPad E560-20EWS00000 6500U, Radeon R7 M370 | Dell Latitude 15-3570 6200U, HD Graphics 520 | Fujitsu LifeBook A556 PL 6200U, HD Graphics 520 | |
|---|---|---|---|---|---|
| Power Consumption | 15% | 3% | 30% | 23% | |
| Idle Minimum * (Watt) | 7 | 3.8 46% | 4.2 40% | 4.9 30% | 4.5 36% |
| Idle Average * (Watt) | 8 | 6.6 17% | 7.5 6% | 7.2 10% | 6.1 24% |
| Idle Maximum * (Watt) | 10.6 | 11.3 -7% | 8.2 23% | 7.5 29% | 10.5 1% |
| Load Average * (Watt) | 39.7 | 38 4% | 49.6 -25% | 25.4 36% | 29.9 25% |
| Load Maximum * (Watt) | 51.9 | 45 13% | 65.8 -27% | 28 46% | 37.2 28% |
* ... más pequeño es mejor
| Acer TravelMate P259-MG-71UU 6500U, GeForce 940MX, 41 Wh | HP ProBook 450 G4 Y8B60EA i7-7500U, GeForce 930MX, 45 Wh | Lenovo ThinkPad E560-20EWS00000 6500U, Radeon R7 M370, 48 Wh | Dell Latitude 15-3570 6200U, HD Graphics 520, 65 Wh | Fujitsu LifeBook A556 PL 6200U, HD Graphics 520, 45 Wh | |
|---|---|---|---|---|---|
| Duración de Batería | 79% | 55% | 115% | -5% | |
| Reader / Idle (h) | 10.3 | 12.4 20% | 14.7 43% | 17.1 66% | 9.8 -5% |
| H.264 (h) | 4.1 | 6.9 68% | |||
| WiFi v1.3 (h) | 4.7 | 8.6 83% | 5.7 21% | 9 91% | |
| Load (h) | 0.9 | 2.1 133% | 1.7 89% | 2.6 189% | |
| WiFi (h) | 5.8 |
Pro
Contra
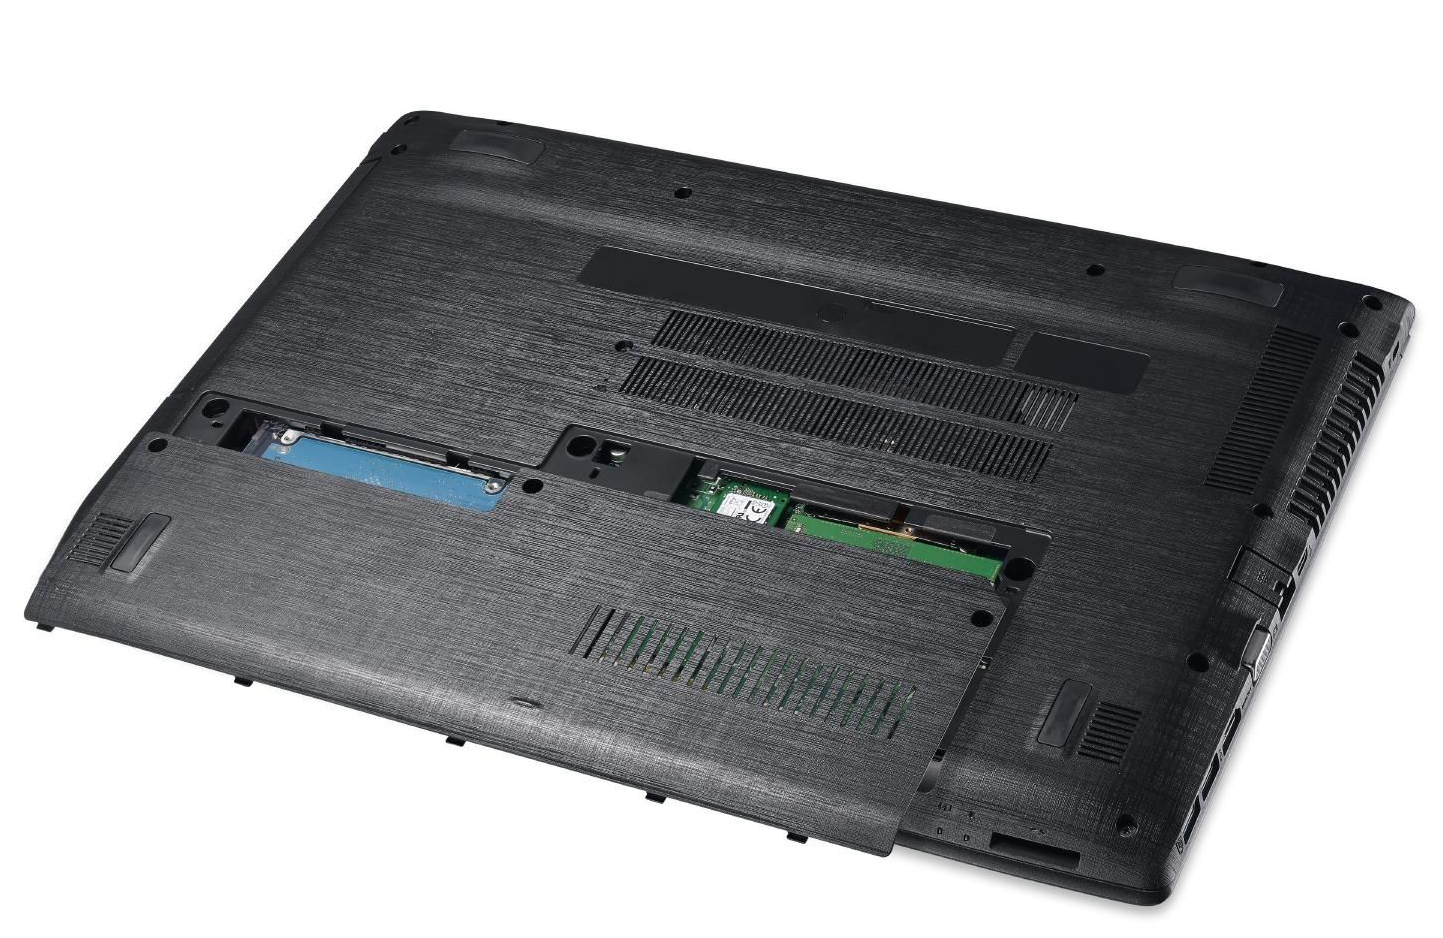
Kaby Lake no ha llegado aún al Travelmate. El procesador instalado Core i7 Skylake, empero, ofrece rendimiento de aplicación más que suficiente. Gracias a la gráfica GeForce, muchos juegos actuales y la mayoría de los viejos son jugables. El portátil no hace mucho ruido durante todo el rango de carga. Incluso va en silencio en inactivo bajo ciertas condiciones. Las temperaturas también son moderadas. Un veloz SSD mantiene rápido el sistema. También tiene mucha capacidad de almacenamiento. La escotilla de mantenimiento presente facilita sustituir los discos. El teclado instalado es satisfactorio en general. Esto lo remata una garantía de tres años.
Acer ha hecho una buena labor con el Travelmate P259-MG-71UU, pero su pobre elección de pantalla frustra una mejor valoración.
La pantalla instalada es oscura, de poco contraste, y dependiente del ángulo de visión. Esperamos un panel IPS mucho mejor en un dispositivo de 1000 Euros como el Travelmate. Un teclado retroiluminado también debería ser parte de la configuración básica. Tenemos que mencionar el mediocre aguante de batería: Un portátil dirigido explícitamente a usuarios profesionales debería ofrecer más en este aspecto. El Travelmate P259-MG antes será un todoterreno de 15.6" para el escritorio en casa que un portátil business.
Ésta es una versión acortada del análisis original. Puedes leer el análisis completo en inglés aquí.
Acer TravelMate P259-MG-71UU
- 01/01/2017 v6 (old)
Sascha Mölck