Breve análisis del HP ProBook 450 G4 Y8B60EA
| SD Card Reader | |
| average JPG Copy Test (av. of 3 runs) | |
| HP ProBook 450 G4 Y8B60EA | |
| Lenovo ThinkPad E560-20EWS00000 | |
| Dell Latitude 15-3570 | |
| maximum AS SSD Seq Read Test (1GB) | |
| HP ProBook 450 G4 Y8B60EA | |
| Lenovo ThinkPad E560-20EWS00000 | |
| Dell Latitude 15-3570 | |
| Networking | |
| iperf Server (receive) TCP 1 m | |
| Xiaomi Mi Notebook Air 13.3 2016 | |
| HP ProBook 450 G4 Y8B60EA | |
| Lenovo Ideapad 310-15IKB | |
| Dell Latitude 14 3470 | |
| iperf Client (transmit) TCP 1 m | |
| HP ProBook 450 G4 Y8B60EA | |
| Xiaomi Mi Notebook Air 13.3 2016 | |
| Lenovo Ideapad 310-15IKB | |
| Dell Latitude 14 3470 | |
| |||||||||||||||||||||||||
iluminación: 77 %
Brillo con batería: 214 cd/m²
Contraste: 498:1 (Negro: 0.43 cd/m²)
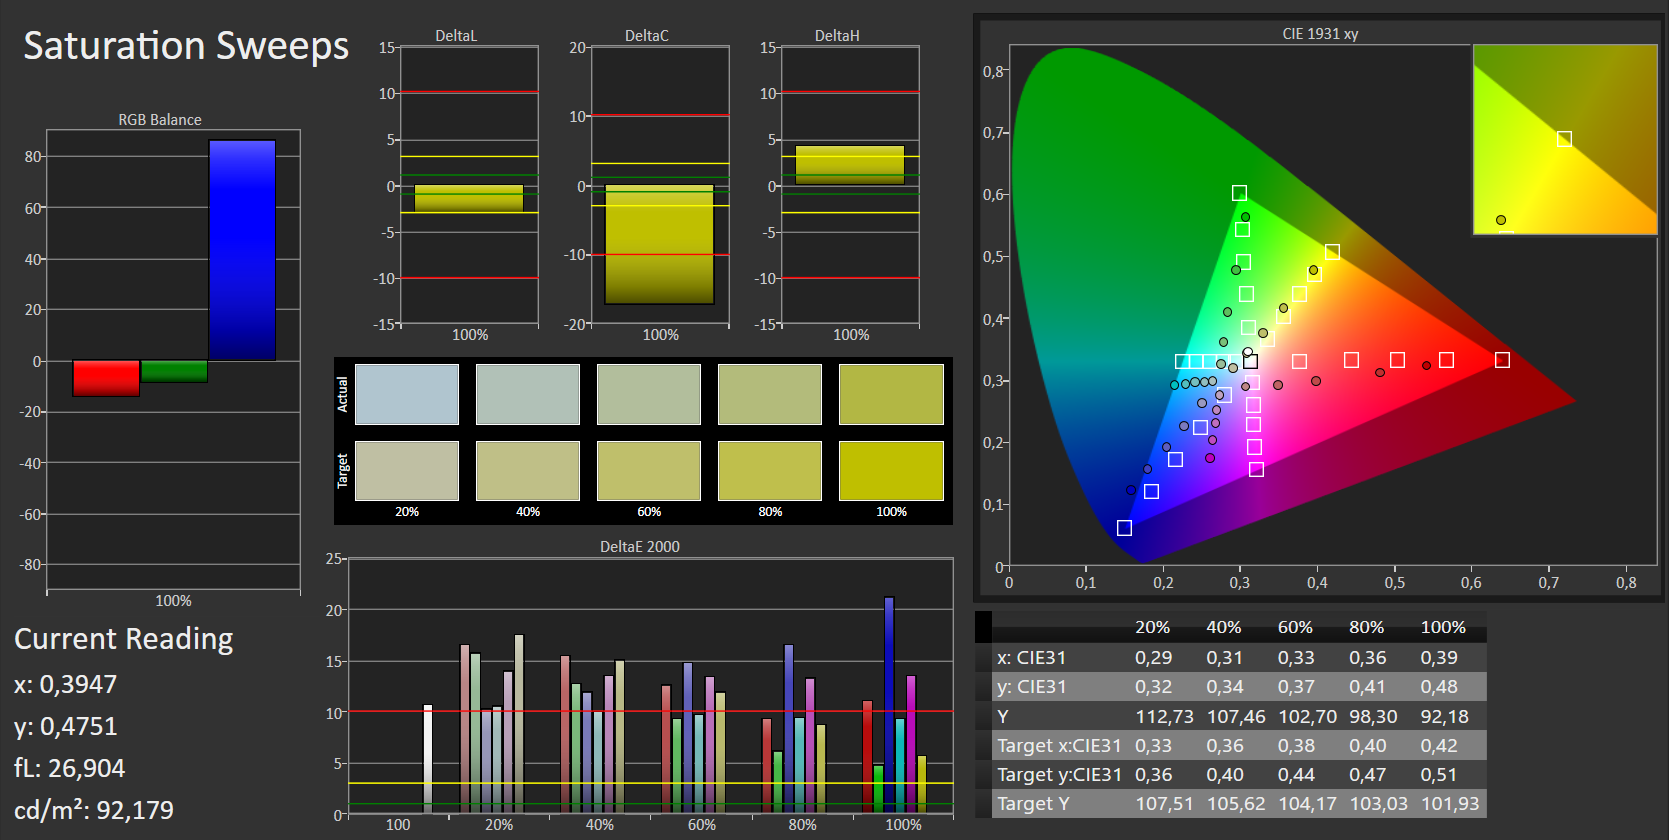
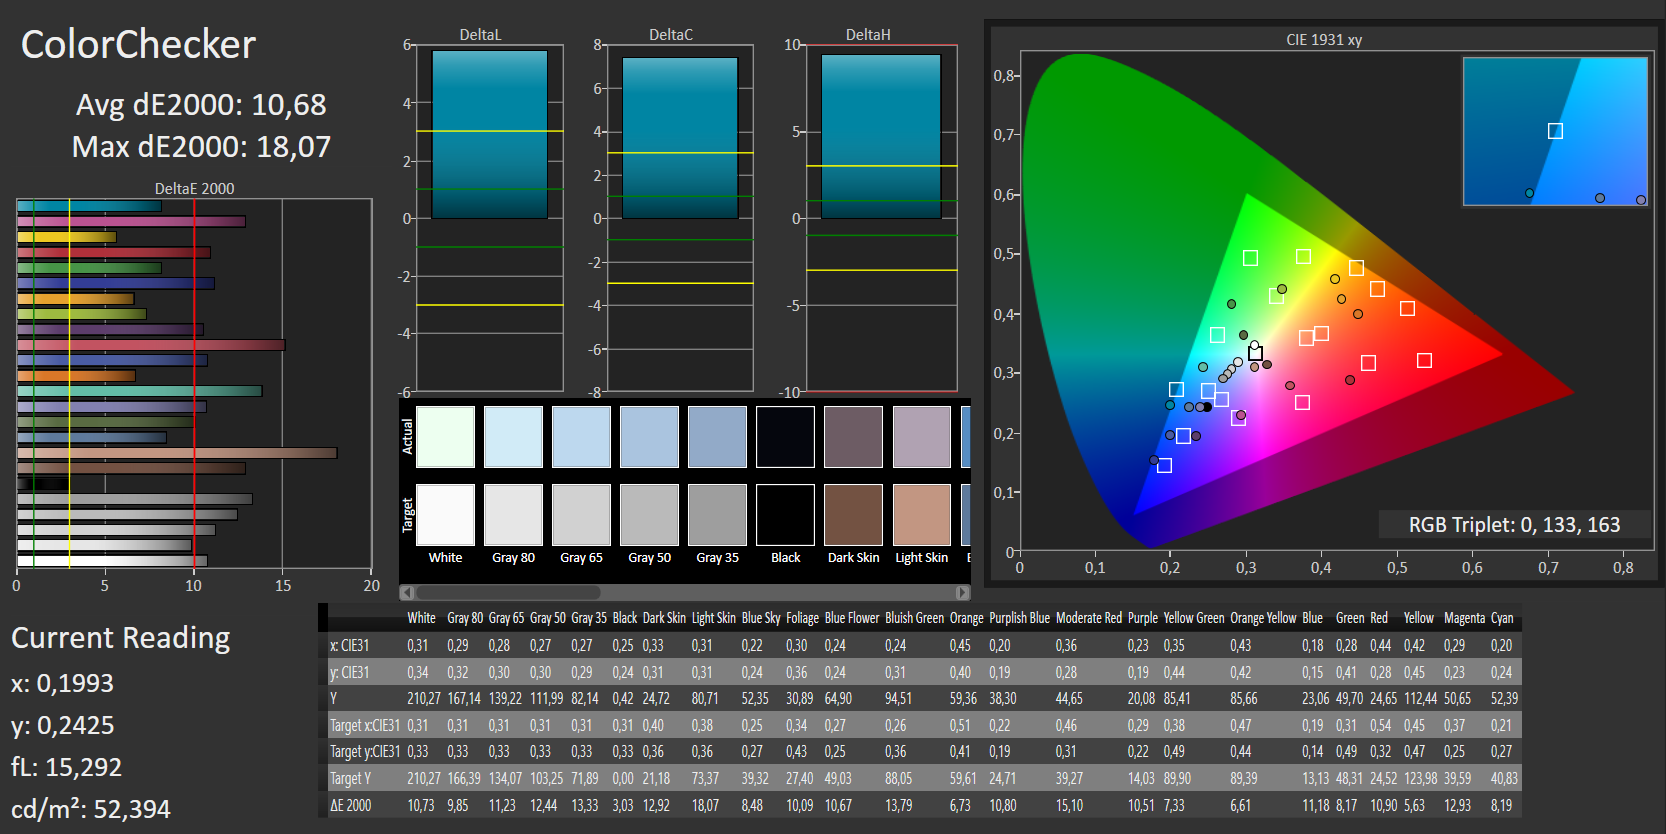
ΔE ColorChecker Calman: 10.68 | ∀{0.5-29.43 Ø4.72}
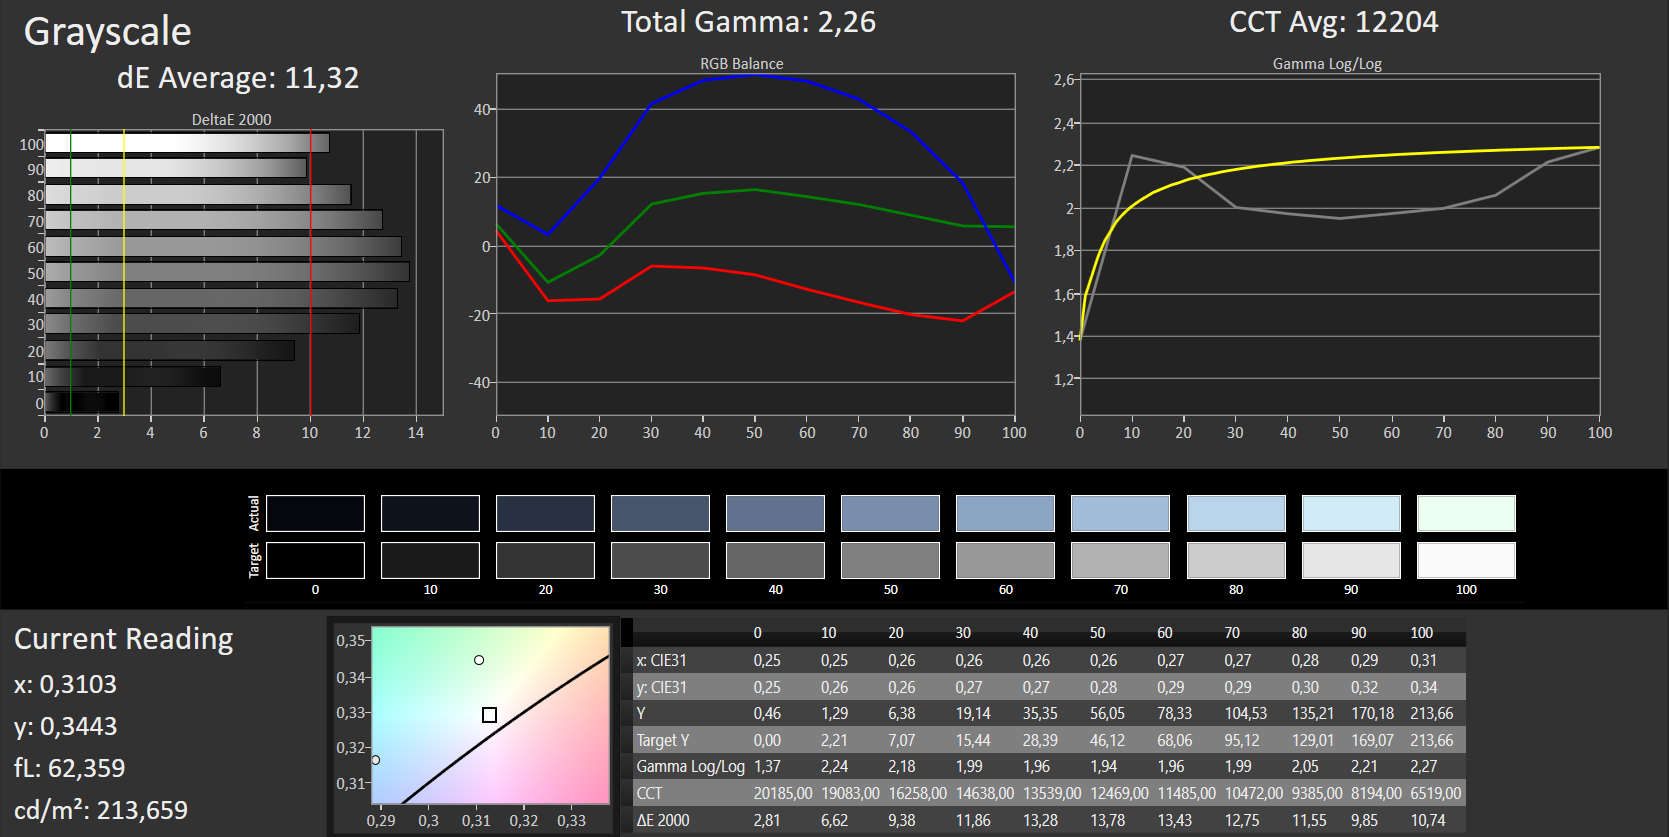
ΔE Greyscale Calman: 11.32 | ∀{0.09-98 Ø4.97}
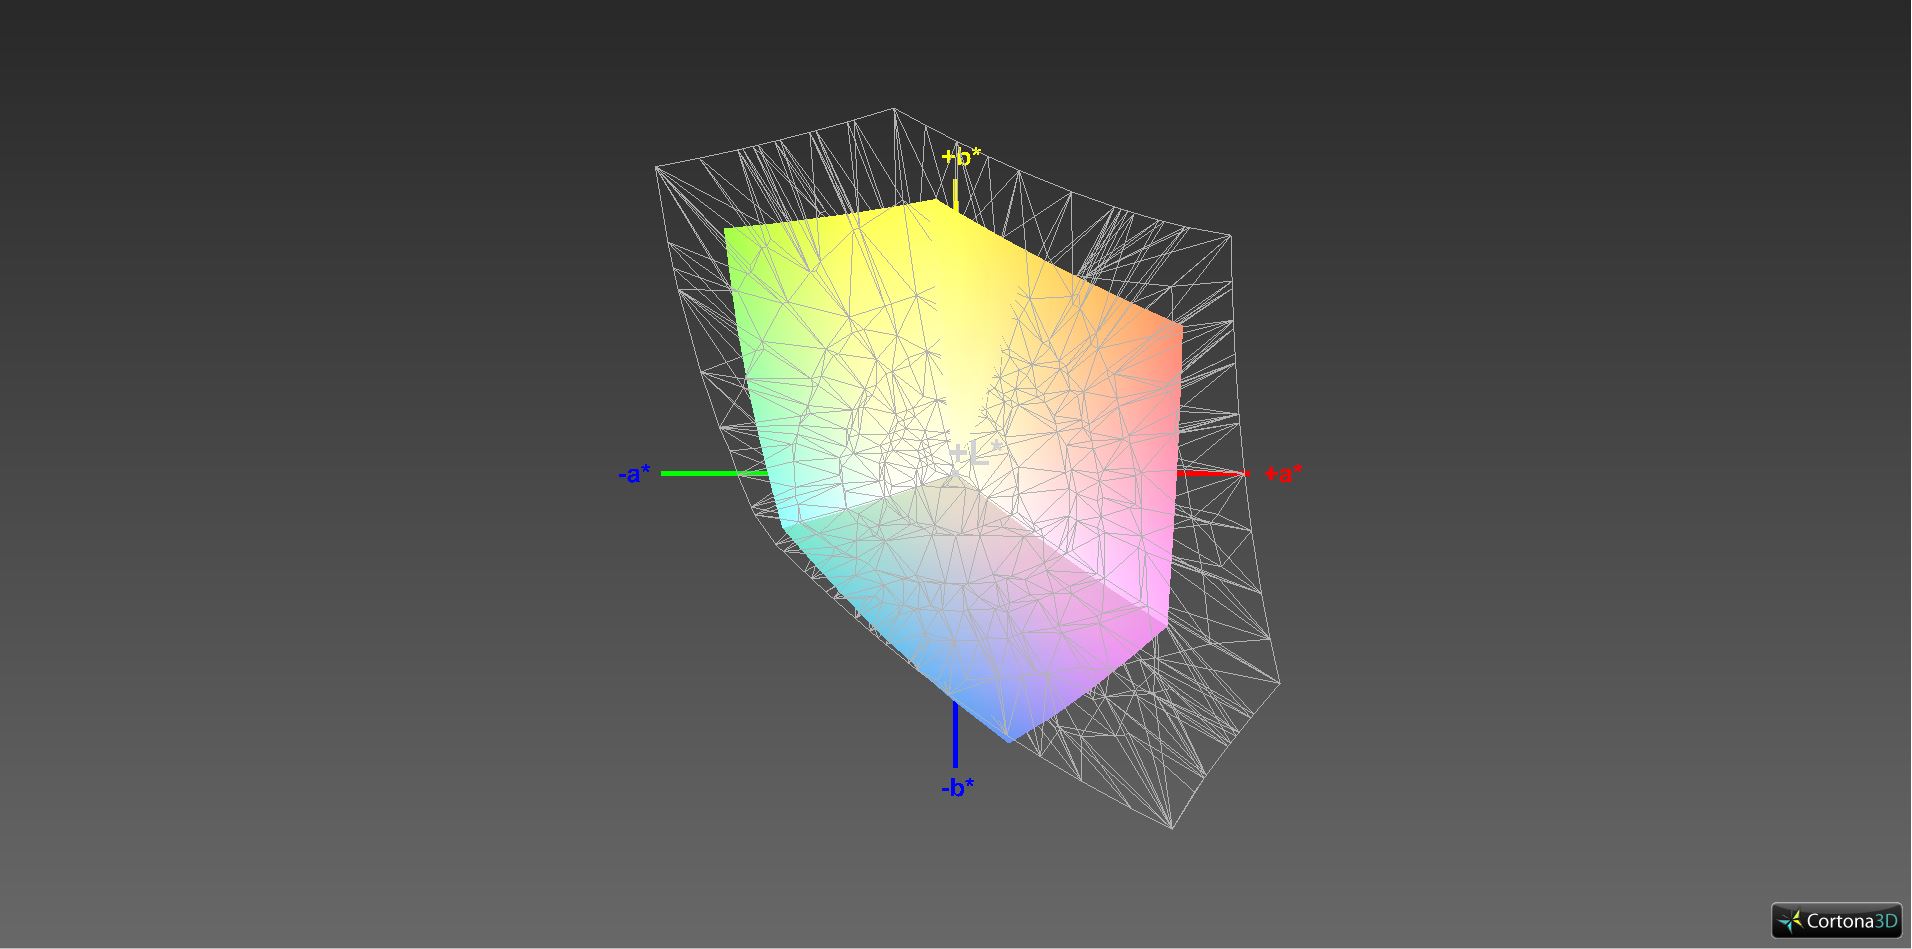
59% sRGB (Argyll 1.6.3 3D)
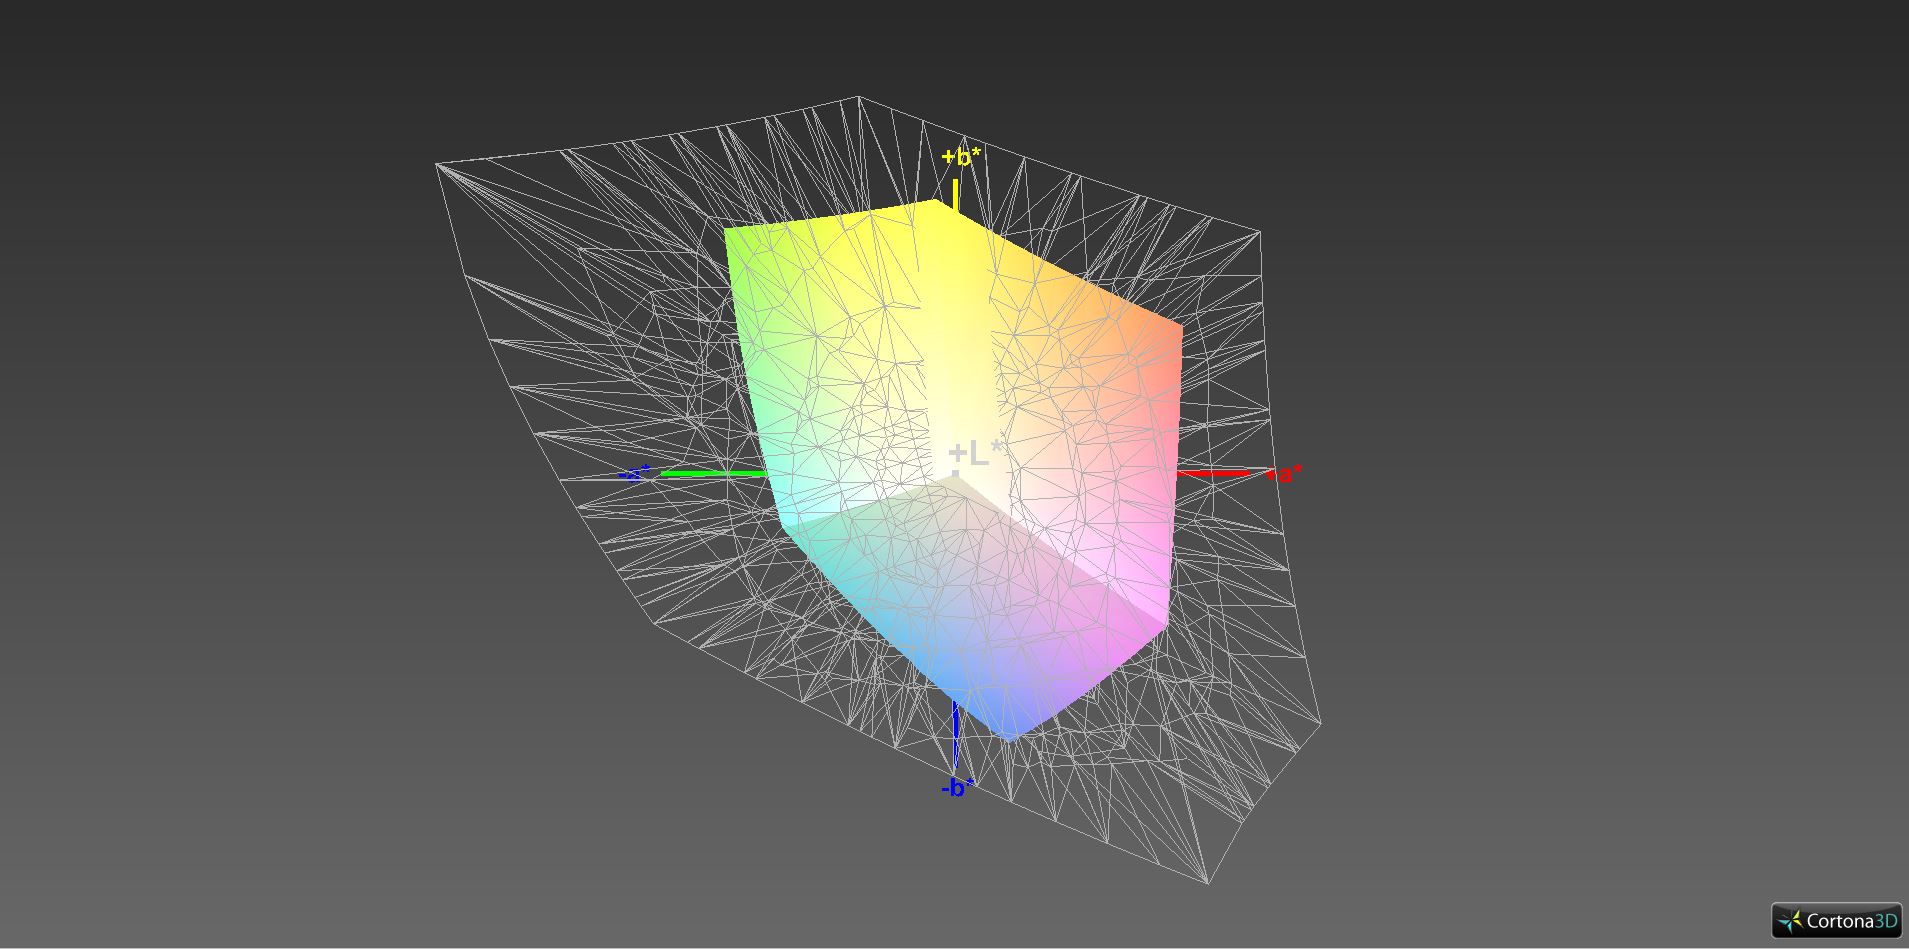
38% AdobeRGB 1998 (Argyll 1.6.3 3D)
41.24% AdobeRGB 1998 (Argyll 3D)
59.5% sRGB (Argyll 3D)
39.89% Display P3 (Argyll 3D)
Gamma: 2.26
CCT: 12204 K
| HP ProBook 450 G4 Y8B60EA Chi Mei CMN15C4, , 1920x1080, 15.6" | Lenovo ThinkPad E560-20EWS00000 Lenovo LP156WF6-SPK2, , 1920x1080, 15.6" | Lenovo ThinkPad L560-20F10026GE LG LP156WF6-SPK1, , 1920x1080, 15.6" | Dell Latitude 15-3570 LG Philips LGD04AF / 156WHU, , 1366x768, 15.6" | Dell Latitude 15 E5570 LG Philips 156WHU, , 1366x768, 15.6" | HP ProBook 450 G3 AU Optronics, , 1920x1080, 15.6" | |
|---|---|---|---|---|---|---|
| Display | -3% | -2% | 2% | 1% | -4% | |
| Display P3 Coverage (%) | 39.89 | 38.5 -3% | 39 -2% | 40.61 2% | 40.48 1% | 38.1 -4% |
| sRGB Coverage (%) | 59.5 | 57.5 -3% | 58.3 -2% | 61.1 3% | 60.9 2% | 57.3 -4% |
| AdobeRGB 1998 Coverage (%) | 41.24 | 39.8 -3% | 40.33 -2% | 41.96 2% | 41.82 1% | 39.37 -5% |
| Response Times | 25% | 15% | 2% | 9% | 13% | |
| Response Time Grey 50% / Grey 80% * (ms) | 51 ? | 38.4 ? 25% | 39.2 ? 23% | 37 ? 27% | 47 ? 8% | 41.2 ? 19% |
| Response Time Black / White * (ms) | 30 ? | 22.4 ? 25% | 28 ? 7% | 37 ? -23% | 27 ? 10% | 28 ? 7% |
| PWM Frequency (Hz) | 50 ? | |||||
| Screen | 27% | 22% | -11% | 2% | 5% | |
| Brightness middle (cd/m²) | 214 | 257 20% | 262 22% | 202 -6% | 228 7% | 211 -1% |
| Brightness (cd/m²) | 201 | 234 16% | 250 24% | 211 5% | 236 17% | 214 6% |
| Brightness Distribution (%) | 77 | 83 8% | 92 19% | 88 14% | 90 17% | 91 18% |
| Black Level * (cd/m²) | 0.43 | 0.27 37% | 0.29 33% | 0.62 -44% | 0.56 -30% | 0.43 -0% |
| Contrast (:1) | 498 | 952 91% | 903 81% | 326 -35% | 407 -18% | 491 -1% |
| Colorchecker dE 2000 * | 10.68 | 7.16 33% | 8.49 21% | 12.35 -16% | 10.02 6% | 9.25 13% |
| Colorchecker dE 2000 max. * | 18.07 | 17.99 -0% | 19.9 -10% | 15.93 12% | ||
| Greyscale dE 2000 * | 11.32 | 6.28 45% | 8.11 28% | 13.46 -19% | 10.66 6% | 9.83 13% |
| Gamma | 2.26 97% | 2.44 90% | 2.37 93% | 2.44 90% | 2.48 89% | 2.82 78% |
| CCT | 12204 53% | 6806 96% | 6300 103% | 15217 43% | 11800 55% | 10890 60% |
| Color Space (Percent of AdobeRGB 1998) (%) | 38 | 36.6 -4% | 37.07 -2% | 39 3% | 39 3% | 36.4 -4% |
| Color Space (Percent of sRGB) (%) | 59 | 57.3 -3% | 57.94 -2% | 61 3% | 61 3% | 57.3 -3% |
| Media total (Programa/Opciones) | 16% /
20% | 12% /
17% | -2% /
-6% | 4% /
3% | 5% /
4% |
* ... más pequeño es mejor
Tiempos de respuesta del display
| ↔ Tiempo de respuesta de Negro a Blanco | ||
|---|---|---|
| 30 ms ... subida ↗ y bajada ↘ combinada | ↗ 10 ms subida | 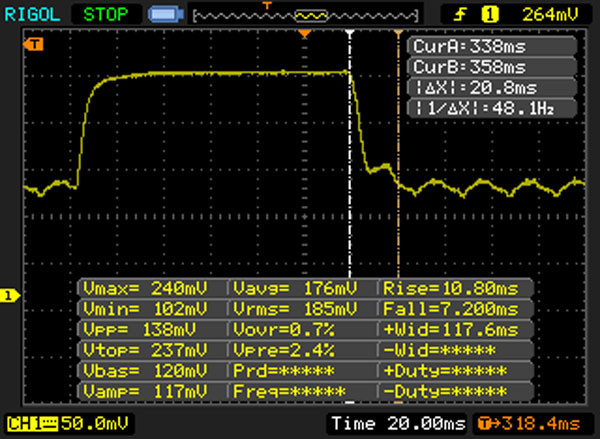 |
| ↘ 20 ms bajada | ||
| La pantalla mostró tiempos de respuesta lentos en nuestros tests y podría ser demasiado lenta para los jugones. En comparación, todos los dispositivos de prueba van de ##min### (mínimo) a 240 (máximo) ms. » 80 % de todos los dispositivos son mejores. Eso quiere decir que el tiempo de respuesta es peor que la media (19.8 ms) de todos los dispositivos testados. | ||
| ↔ Tiempo de respuesta 50% Gris a 80% Gris | ||
| 51 ms ... subida ↗ y bajada ↘ combinada | ↗ 23 ms subida | 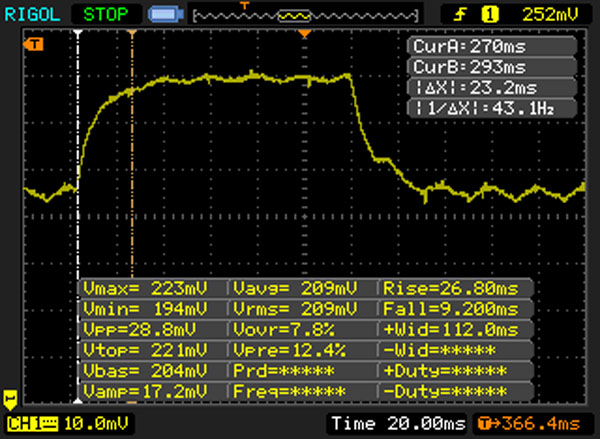 |
| ↘ 28 ms bajada | ||
| La pantalla mostró tiempos de respuesta lentos en nuestros tests y podría ser demasiado lenta para los jugones. En comparación, todos los dispositivos de prueba van de ##min### (mínimo) a 636 (máximo) ms. » 87 % de todos los dispositivos son mejores. Eso quiere decir que el tiempo de respuesta es peor que la media (31 ms) de todos los dispositivos testados. | ||
Parpadeo de Pantalla / PWM (Pulse-Width Modulation)
| Parpadeo de Pantalla / PWM detectado | 50 Hz | ≤ 40 % de brillo | 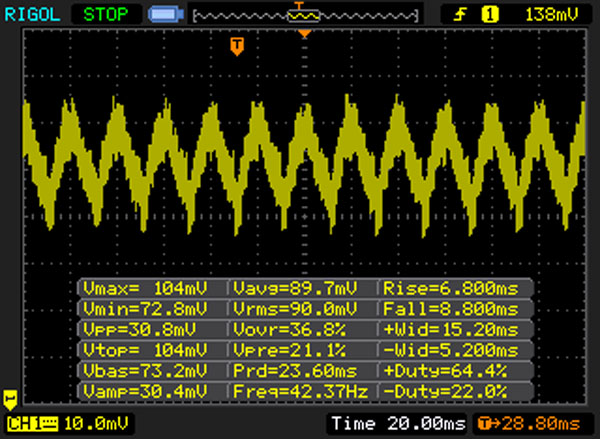 |
La retroiluminación del display parpadea a 50 Hz (seguramente usa PWM - Pulse-Width Modulation) a un brillo del 40 % e inferior. Sobre este nivel de brillo no debería darse parpadeo / PWM. La frecuencia de 50 Hz es bajísima, por lo que el parpadeo puede causar fatiga visual y cefaleas cuando se usa mucho tiempo. Comparación: 52 % de todos los dispositivos testados no usaron PWM para atenuar el display. Si se usó, medimos una media de 7769 (mínimo: 5 - máxmo: 343500) Hz. | |||
| PCMark 8 Home Score Accelerated v2 | 3163 puntos | |
| PCMark 8 Work Score Accelerated v2 | 4725 puntos | |
ayuda | ||
| HP ProBook 450 G4 Y8B60EA SanDisk SD8SNAT256G1002 | Lenovo ThinkPad E560-20EWS00000 Samsung CM871 MZ7LF192HCGS | Dell Latitude 15-3570 Samsung CM871 MZNLF128HCHP | Dell Latitude 15 E5570 Samsung SSD PM871 MZ7LN128HCHP | |
|---|---|---|---|---|
| AS SSD | -27% | -35% | 26% | |
| Access Time Write * (ms) | 0.159 | 0.112 30% | 0.188 -18% | 0.07 56% |
| Access Time Read * (ms) | 0.141 | 0.171 -21% | 0.14 1% | 0.114 19% |
| 4K-64 Write (MB/s) | 195.5 | 33.55 -83% | 19.37 -90% | 82.7 -58% |
| 4K-64 Read (MB/s) | 137.1 | 83.9 -39% | 81.8 -40% | 356.1 160% |
| 4K Write (MB/s) | 73.4 | 34.46 -53% | 21.57 -71% | 91.1 24% |
| 4K Read (MB/s) | 17.96 | 17.2 -4% | 17.25 -4% | 29.68 65% |
| Seq Write (MB/s) | 315.9 | 162 -49% | 130 -59% | 146.2 -54% |
| Seq Read (MB/s) | 493.8 | 497.1 1% | 489.1 -1% | 488.5 -1% |
* ... más pequeño es mejor

| 3DMark 11 - 1280x720 Performance GPU | |
| Lenovo ThinkPad E560-20EWS00000 | |
| HP ProBook 450 G4 Y8B60EA | |
| Dell Latitude 15 E5570 | |
| Dell Latitude 15-3570 | |
| Lenovo ThinkPad L560-20F10026GE | |
| HP ProBook 450 G3 | |
| 3DMark | |
| 1280x720 Cloud Gate Standard Graphics | |
| Lenovo ThinkPad E560-20EWS00000 | |
| HP ProBook 450 G4 Y8B60EA | |
| Dell Latitude 15 E5570 | |
| Lenovo ThinkPad L560-20F10026GE | |
| Dell Latitude 15-3570 | |
| HP ProBook 450 G3 | |
| 1920x1080 Fire Strike Graphics | |
| Lenovo ThinkPad E560-20EWS00000 | |
| HP ProBook 450 G4 Y8B60EA | |
| Dell Latitude 15 E5570 | |
| Lenovo ThinkPad L560-20F10026GE | |
| HP ProBook 450 G3 | |
| 3DMark 11 Performance | 2248 puntos | |
| 3DMark Cloud Gate Standard Score | 6908 puntos | |
| 3DMark Fire Strike Score | 1454 puntos | |
ayuda | ||
| bajo | medio | alto | ultra | |
|---|---|---|---|---|
| BioShock Infinite (2013) | 94.8 | 51.2 | 41.77 | 14.42 |
| Company of Heroes 2 (2013) | 37.29 | 29.32 | 17.58 | |
| Rise of the Tomb Raider (2016) | 35.28 | 19.58 |
Ruido
| Ocioso |
| 32.6 / 32.6 / 33 dB(A) |
| DVD |
| 37.8 / dB(A) |
| Carga |
| 38.9 / 38.9 dB(A) |
 | ||
30 dB silencioso 40 dB(A) audible 50 dB(A) ruidosamente alto |
||
min: | ||
(±) La temperatura máxima en la parte superior es de 44.3 °C / 112 F, frente a la media de 34.3 °C / 94 F, que oscila entre 21.2 y 62.5 °C para la clase Office.
(-) El fondo se calienta hasta un máximo de 46.3 °C / 115 F, frente a la media de 36.8 °C / 98 F
(+) En reposo, la temperatura media de la parte superior es de 25.6 °C / 78# F, frente a la media del dispositivo de 29.5 °C / 85 F.
(+) El reposamanos y el panel táctil están a una temperatura inferior a la de la piel, con un máximo de 24.7 °C / 76.5 F y, por tanto, son fríos al tacto.
(+) La temperatura media de la zona del reposamanos de dispositivos similares fue de 27.5 °C / 81.5 F (+2.8 °C / 5 F).
HP ProBook 450 G4 Y8B60EA análisis de audio
(±) | la sonoridad del altavoz es media pero buena (72 dB)
Graves 100 - 315 Hz
(-) | casi sin bajos - de media 15.8% inferior a la mediana
(±) | la linealidad de los graves es media (7.2% delta a frecuencia anterior)
Medios 400 - 2000 Hz
(+) | medios equilibrados - a sólo 1.7% de la mediana
(+) | los medios son lineales (5.2% delta a la frecuencia anterior)
Altos 2 - 16 kHz
(±) | máximos más altos - de media 6.8% más altos que la mediana
(±) | la linealidad de los máximos es media (9% delta a frecuencia anterior)
Total 100 - 16.000 Hz
(±) | la linealidad del sonido global es media (18.9% de diferencia con la mediana)
En comparación con la misma clase
» 35% de todos los dispositivos probados de esta clase eran mejores, 7% similares, 58% peores
» El mejor tuvo un delta de 7%, la media fue 21%, el peor fue ###max##%
En comparación con todos los dispositivos probados
» 44% de todos los dispositivos probados eran mejores, 8% similares, 48% peores
» El mejor tuvo un delta de 4%, la media fue 24%, el peor fue ###max##%
Apple MacBook 12 (Early 2016) 1.1 GHz análisis de audio
(+) | los altavoces pueden reproducir a un volumen relativamente alto (#83.6 dB)
Graves 100 - 315 Hz
(±) | lubina reducida - en promedio 11.3% inferior a la mediana
(±) | la linealidad de los graves es media (14.2% delta a frecuencia anterior)
Medios 400 - 2000 Hz
(+) | medios equilibrados - a sólo 2.4% de la mediana
(+) | los medios son lineales (5.5% delta a la frecuencia anterior)
Altos 2 - 16 kHz
(+) | máximos equilibrados - a sólo 2% de la mediana
(+) | los máximos son lineales (4.5% delta a la frecuencia anterior)
Total 100 - 16.000 Hz
(+) | el sonido global es lineal (10.2% de diferencia con la mediana)
En comparación con la misma clase
» 7% de todos los dispositivos probados de esta clase eran mejores, 2% similares, 91% peores
» El mejor tuvo un delta de 5%, la media fue 18%, el peor fue ###max##%
En comparación con todos los dispositivos probados
» 5% de todos los dispositivos probados eran mejores, 1% similares, 94% peores
» El mejor tuvo un delta de 4%, la media fue 24%, el peor fue ###max##%
| Off / Standby | |
| Ocioso | |
| Carga |
|
Clave:
min: | |
| HP ProBook 450 G4 Y8B60EA i7-7500U, GeForce 930MX, SanDisk SD8SNAT256G1002, TN LED, 1920x1080, 15.6" | Lenovo ThinkPad E560-20EWS00000 6500U, Radeon R7 M370, Samsung CM871 MZ7LF192HCGS, IPS-Panel, 1920x1080, 15.6" | Lenovo ThinkPad L560-20F10026GE 6200U, HD Graphics 520, WDC Slim WD10SPCX-21KHST0, AH-IPS, 1920x1080, 15.6" | Dell Latitude 15-3570 6200U, HD Graphics 520, Samsung CM871 MZNLF128HCHP, TN LED, 1366x768, 15.6" | Dell Latitude 15 E5570 6300U, HD Graphics 520, Samsung SSD PM871 MZ7LN128HCHP, TN LED, 1366x768, 15.6" | |
|---|---|---|---|---|---|
| Power Consumption | -15% | 5% | 13% | 10% | |
| Idle Minimum * (Watt) | 3.8 | 4.2 -11% | 5 -32% | 4.9 -29% | 4.5 -18% |
| Idle Average * (Watt) | 6.6 | 7.5 -14% | 7.9 -20% | 7.2 -9% | 7.6 -15% |
| Idle Maximum * (Watt) | 11.3 | 8.2 27% | 8.6 24% | 7.5 34% | 8.7 23% |
| Load Average * (Watt) | 38 | 49.6 -31% | 27.5 28% | 25.4 33% | 28.5 25% |
| Load Maximum * (Watt) | 45 | 65.8 -46% | 33.7 25% | 28 38% | 29.2 35% |
* ... más pequeño es mejor
| HP ProBook 450 G4 Y8B60EA i7-7500U, GeForce 930MX, 45 Wh | Lenovo ThinkPad E560-20EWS00000 6500U, Radeon R7 M370, 48 Wh | Lenovo ThinkPad L560-20F10026GE 6200U, HD Graphics 520, 48 Wh | Dell Latitude 15-3570 6200U, HD Graphics 520, 65 Wh | Dell Latitude 15 E5570 6300U, HD Graphics 520, 62 Wh | |
|---|---|---|---|---|---|
| Duración de Batería | -11% | -14% | 22% | 35% | |
| Reader / Idle (h) | 12.4 | 14.7 19% | 11.6 -6% | 17.1 38% | 20.5 65% |
| WiFi v1.3 (h) | 8.6 | 5.7 -34% | 6.8 -21% | 9 5% | 10.5 22% |
| Load (h) | 2.1 | 1.7 -19% | 1.8 -14% | 2.6 24% | 2.5 19% |
| H.264 (h) | 6.9 | 4.6 | 9.5 |
Pro
Contra
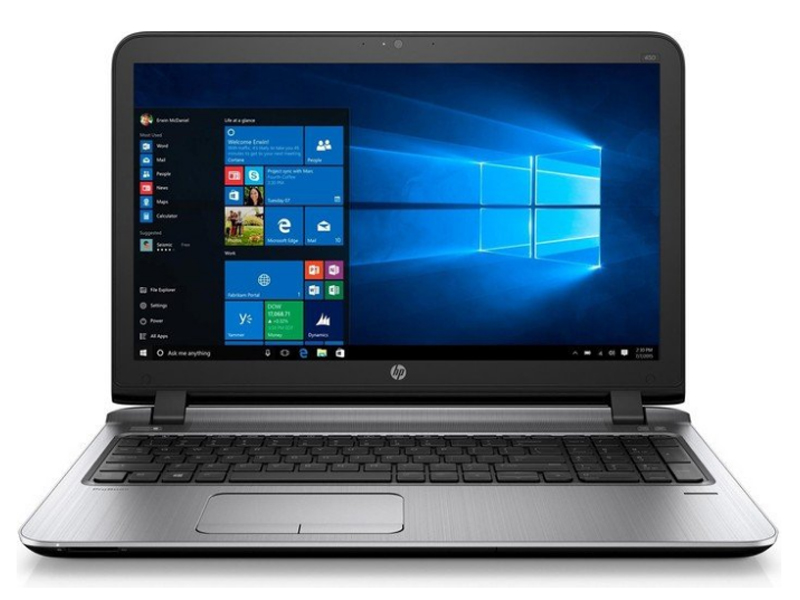
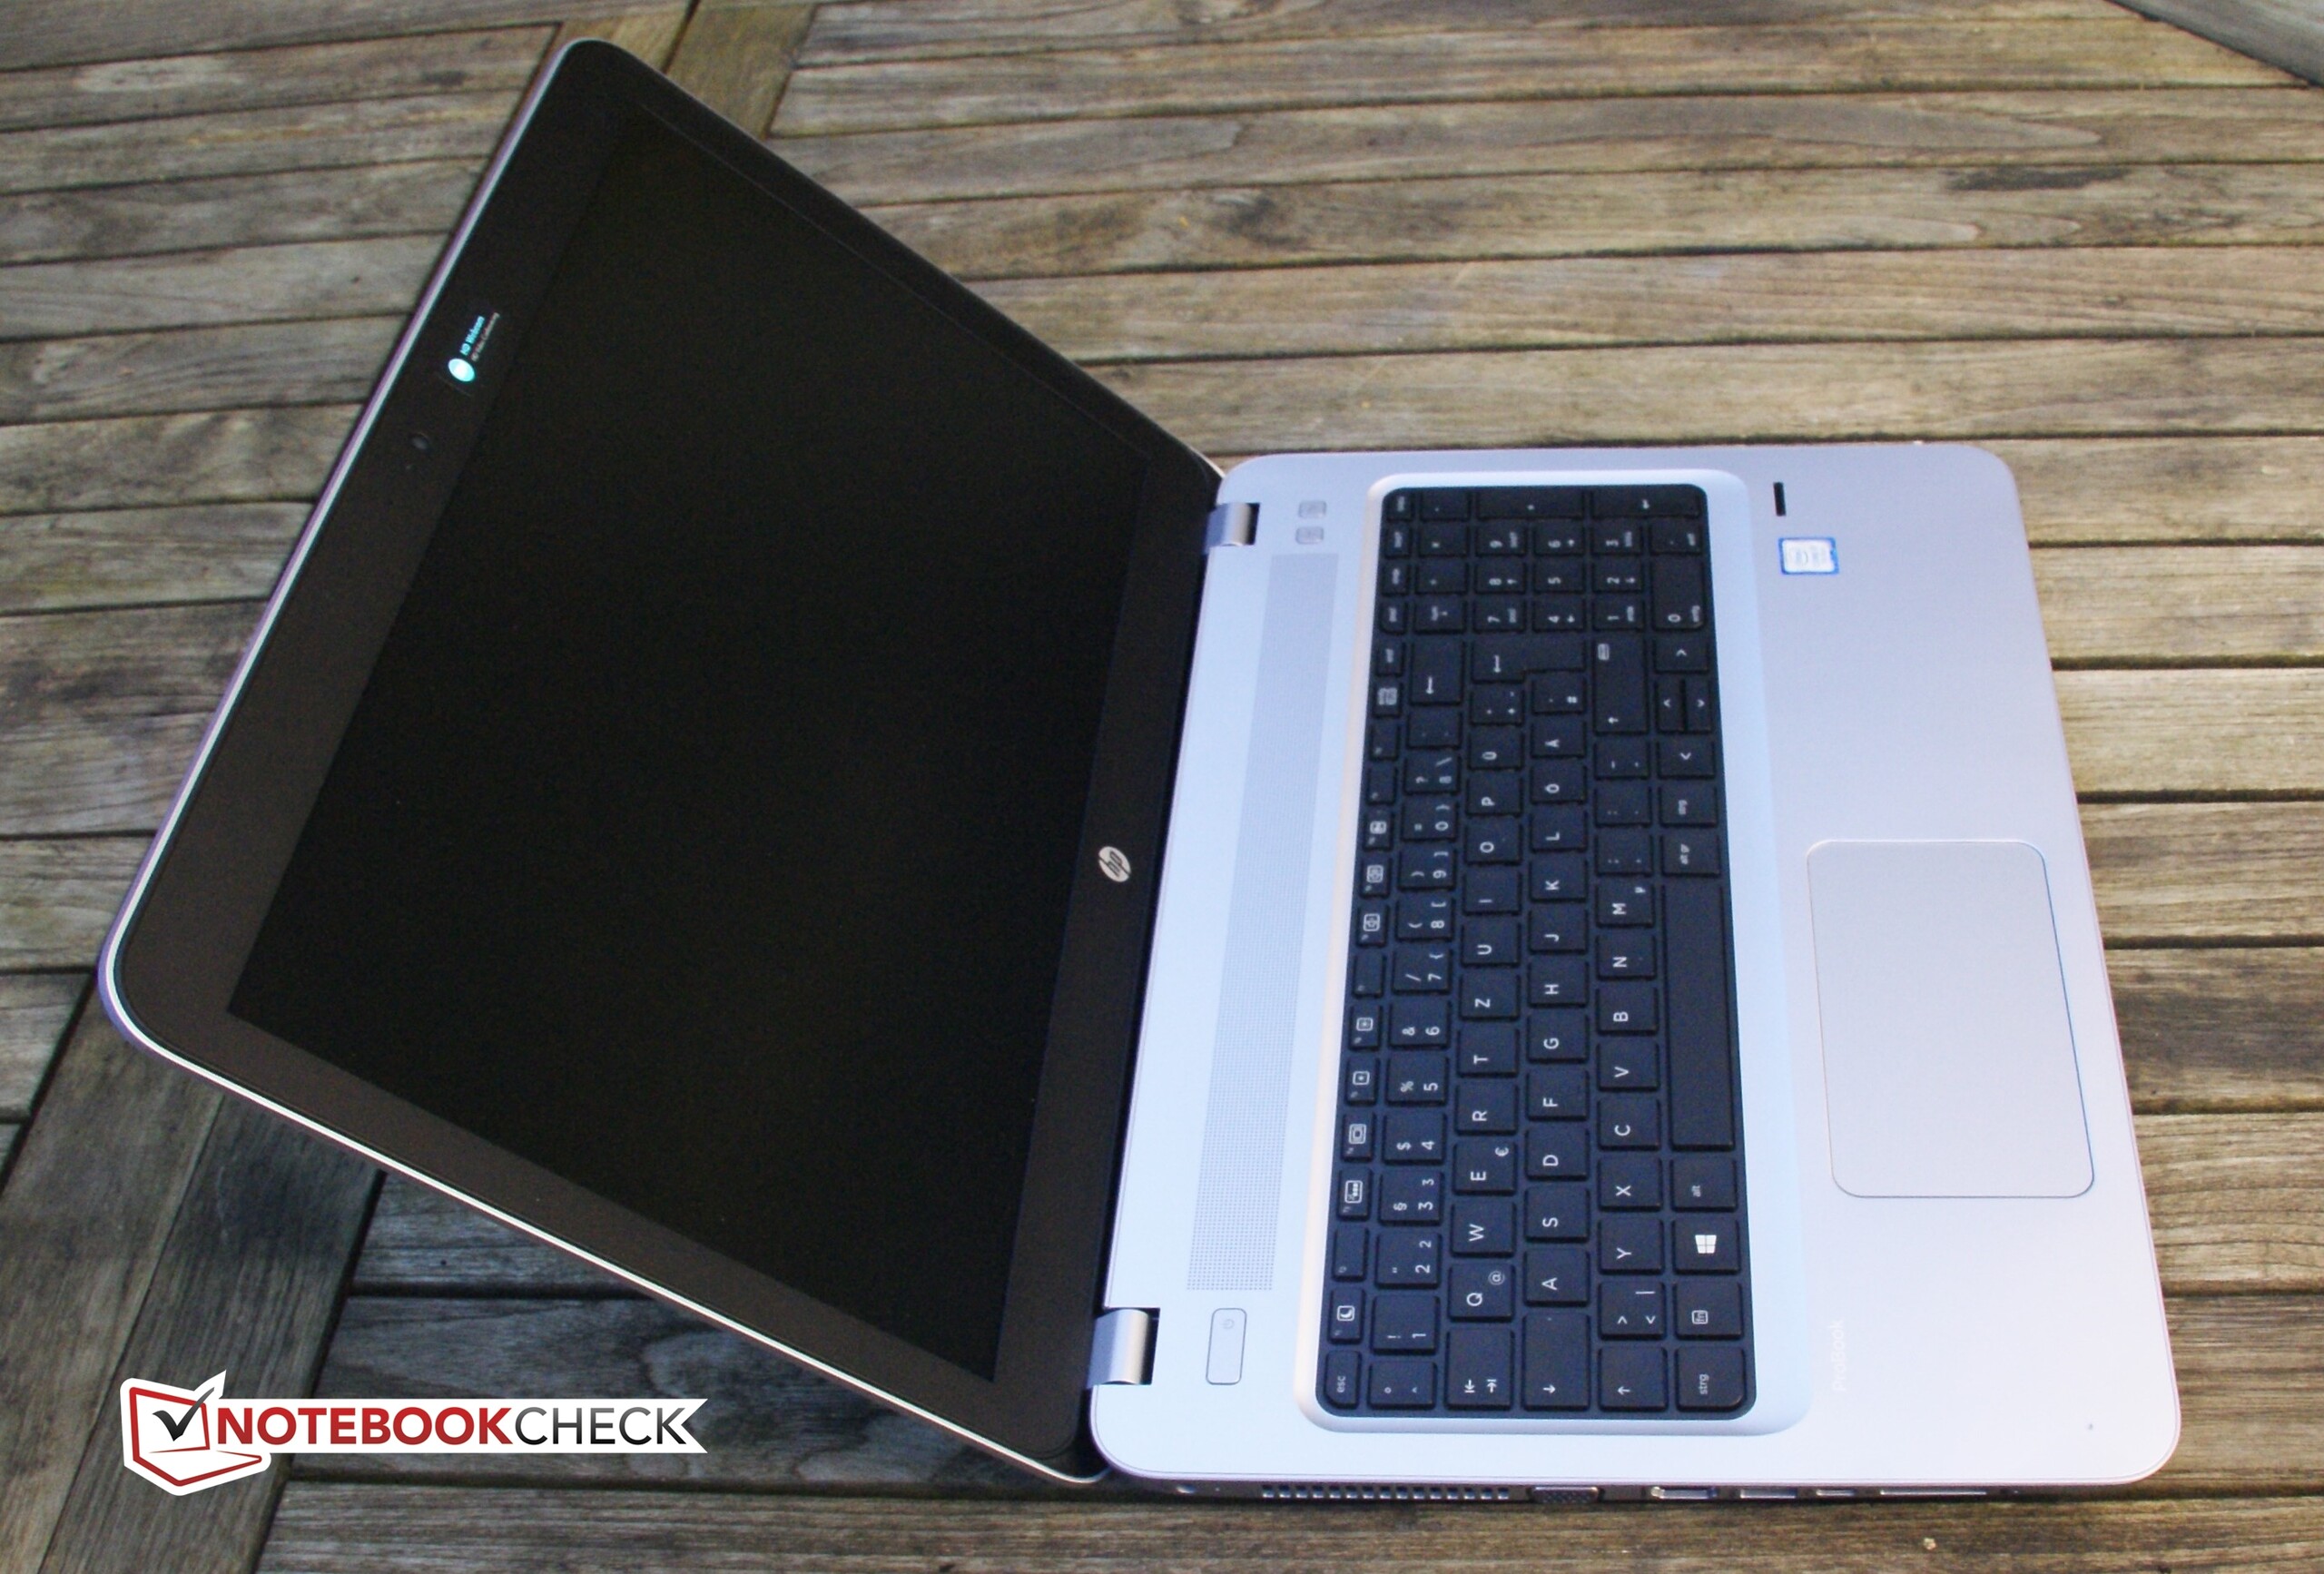
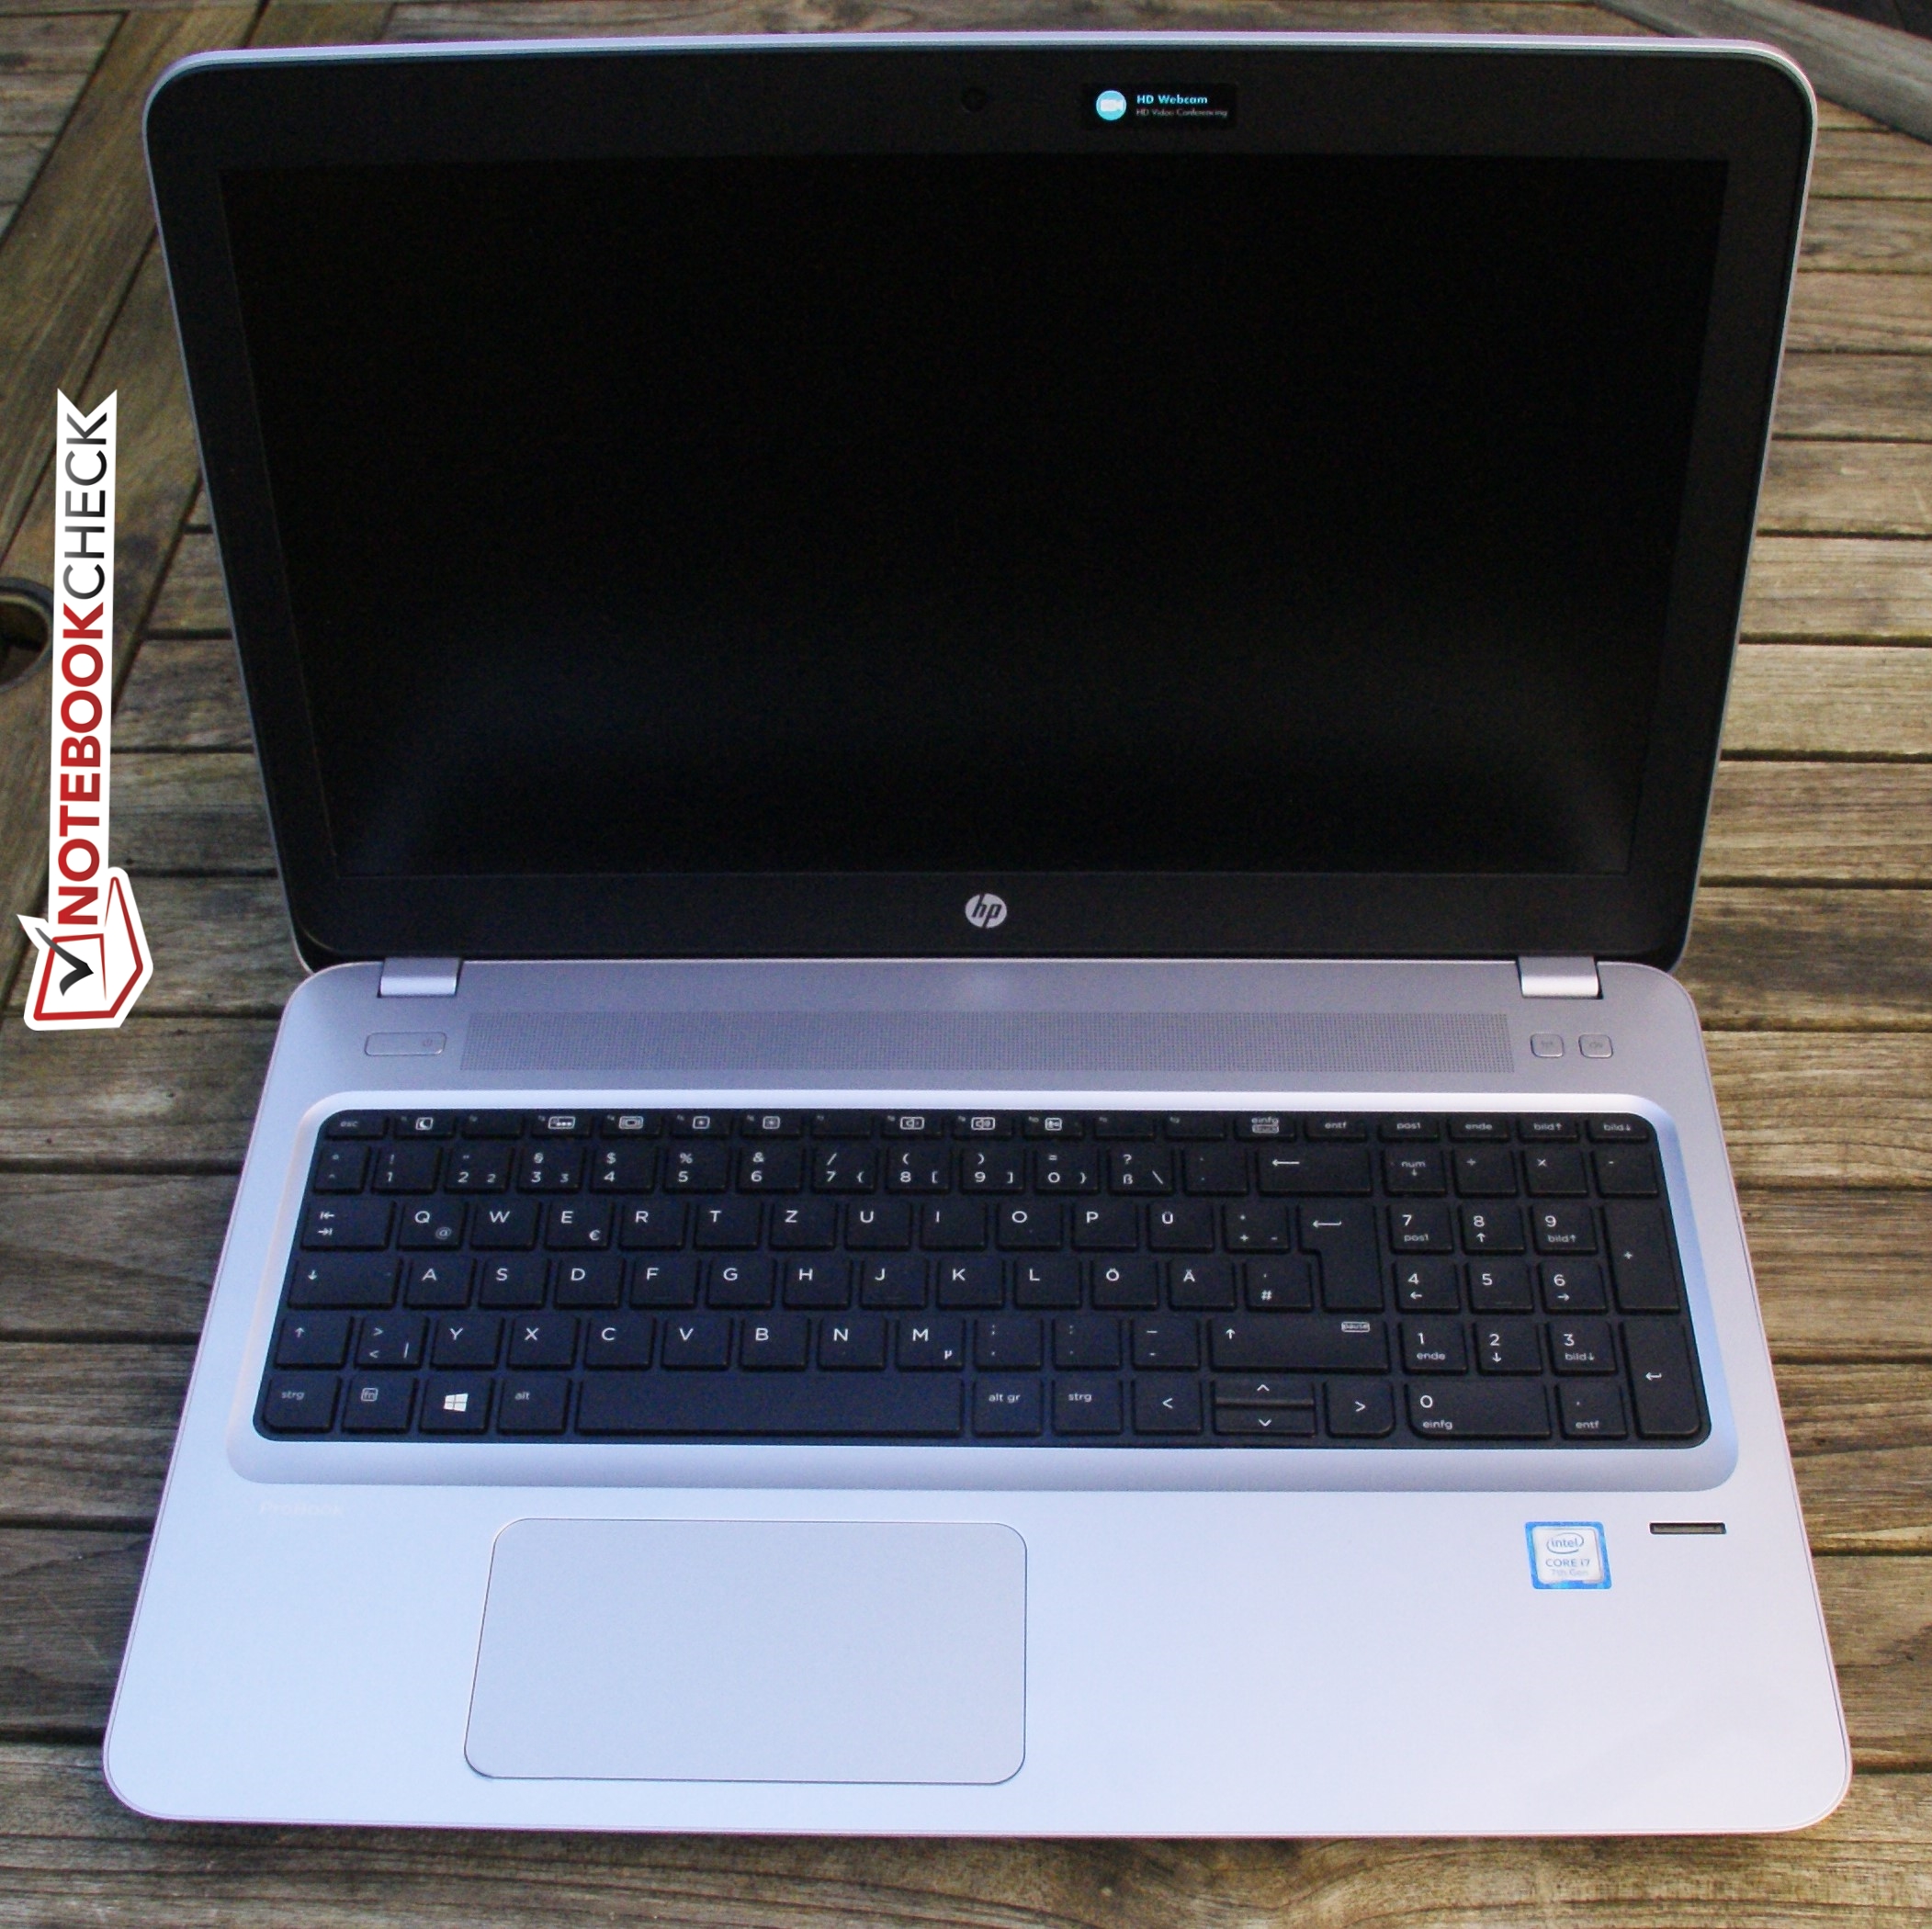
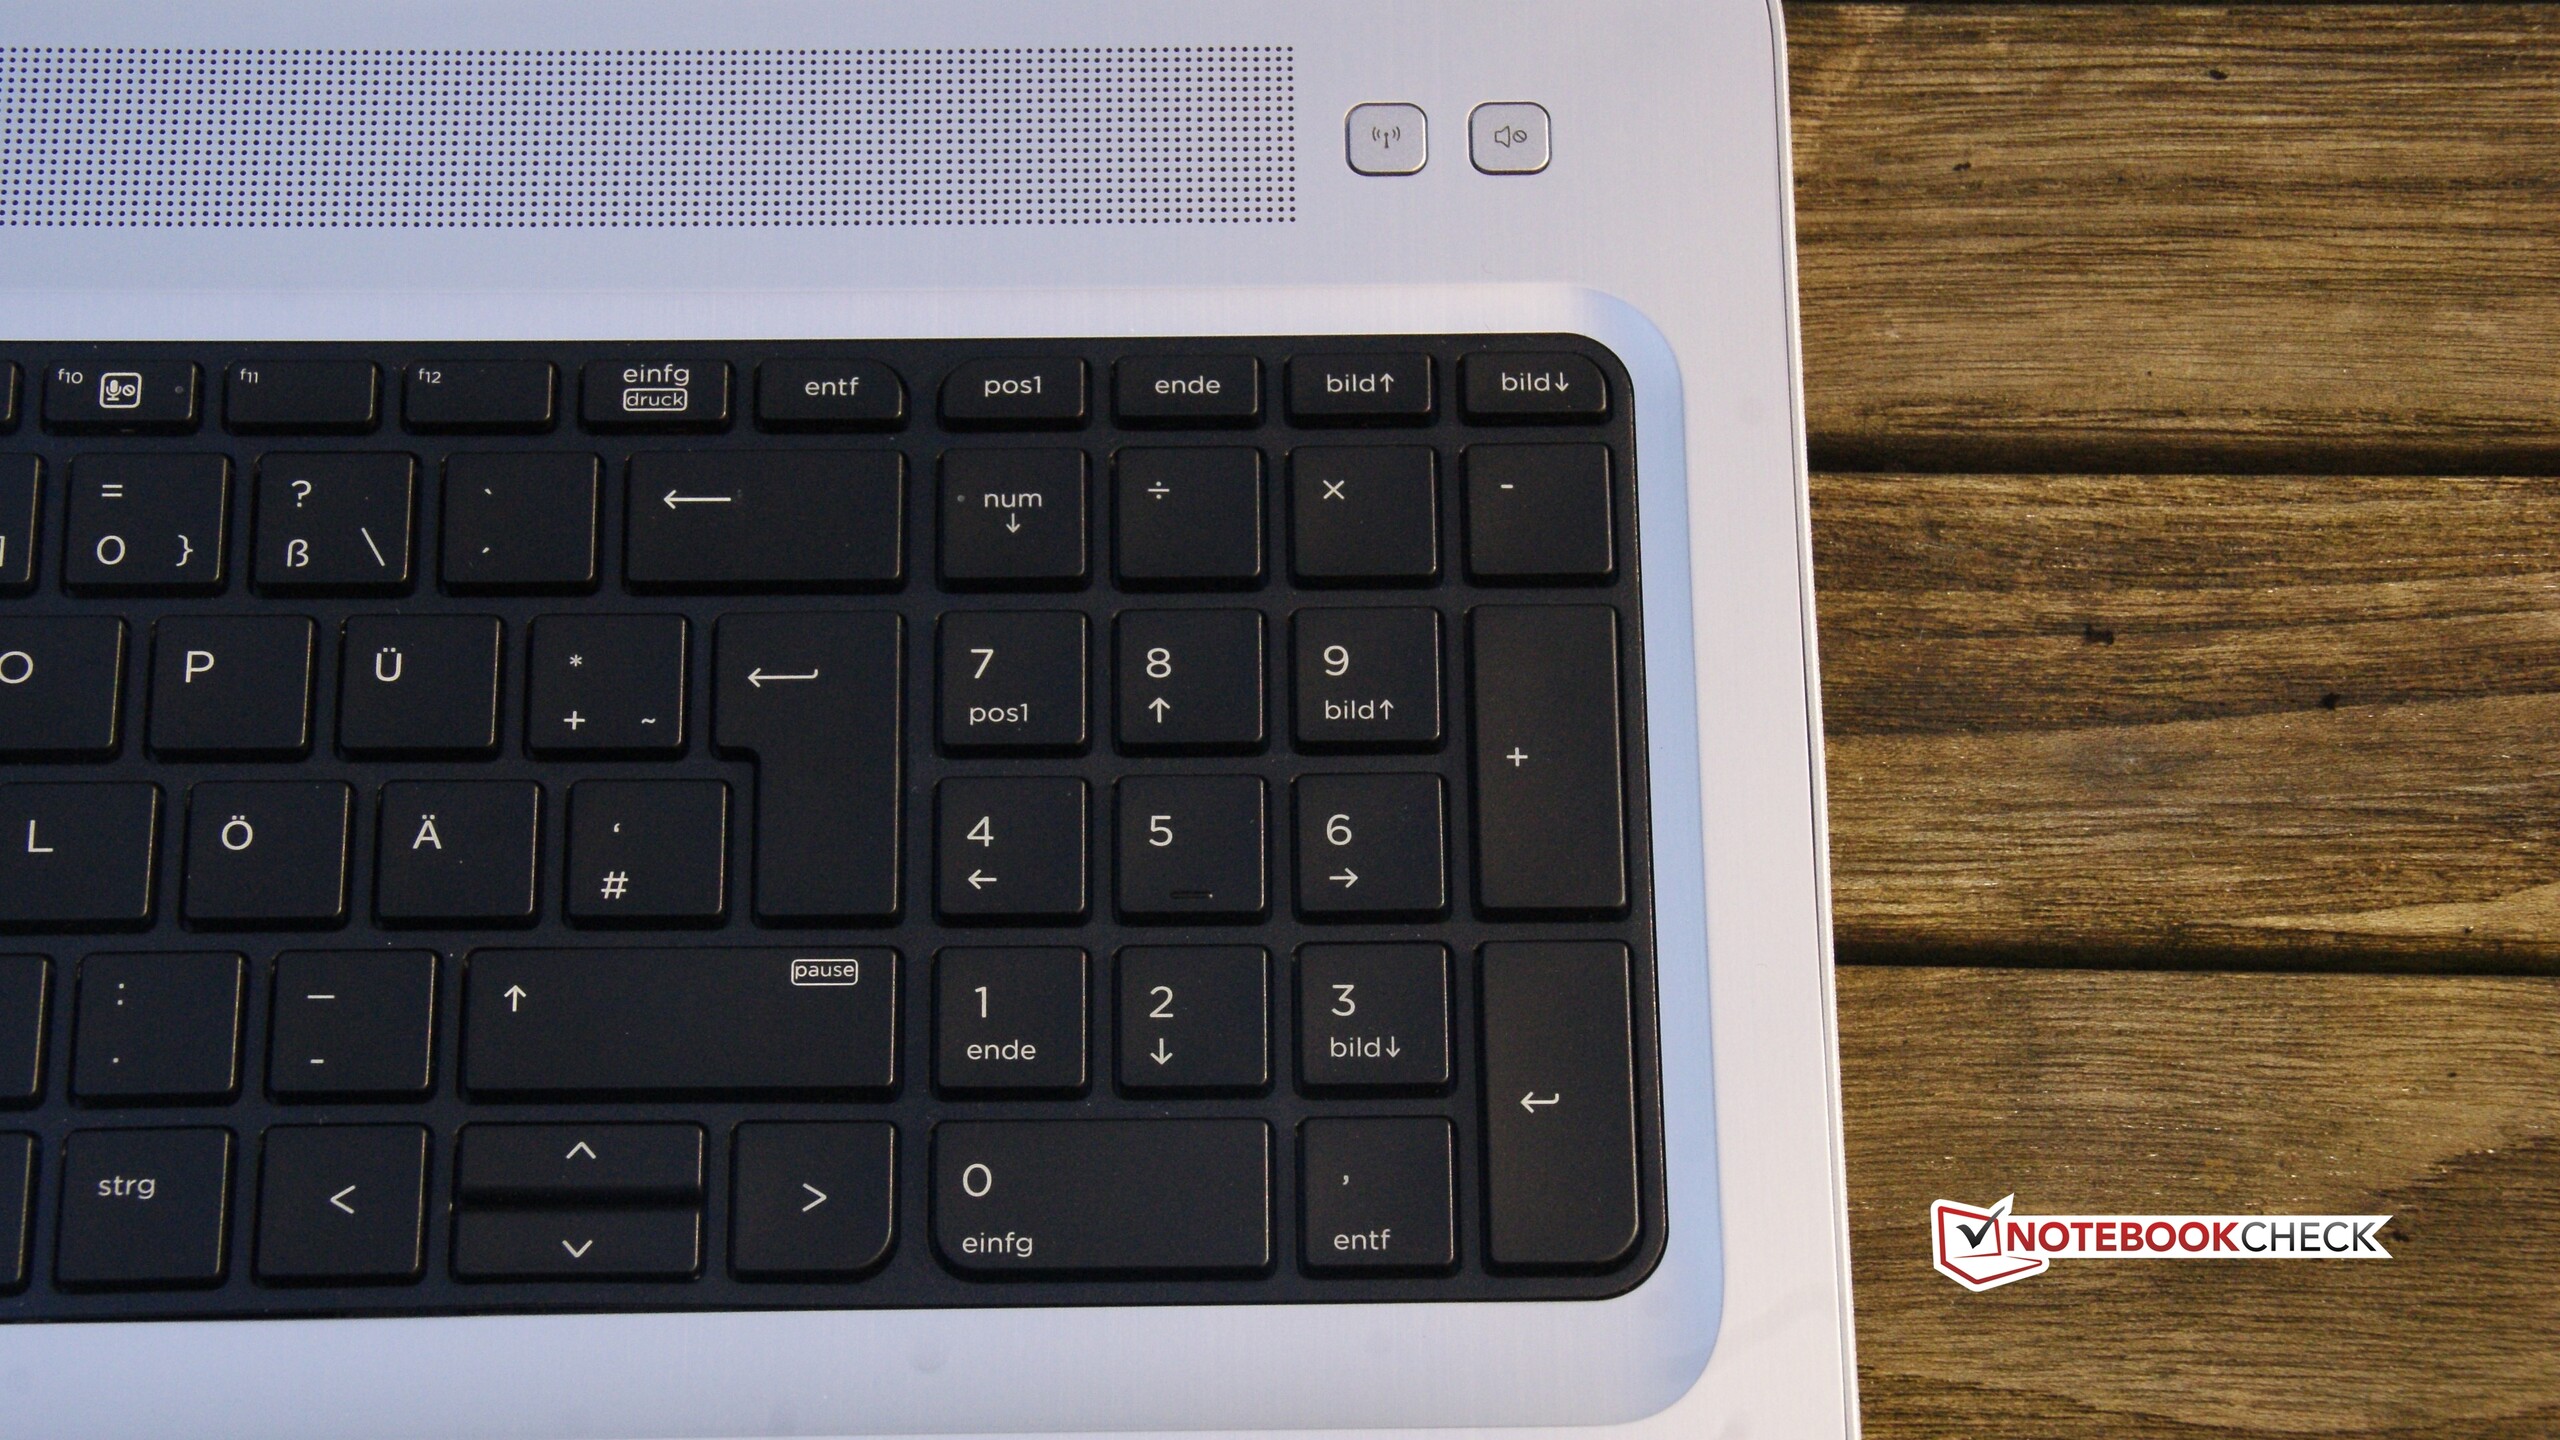
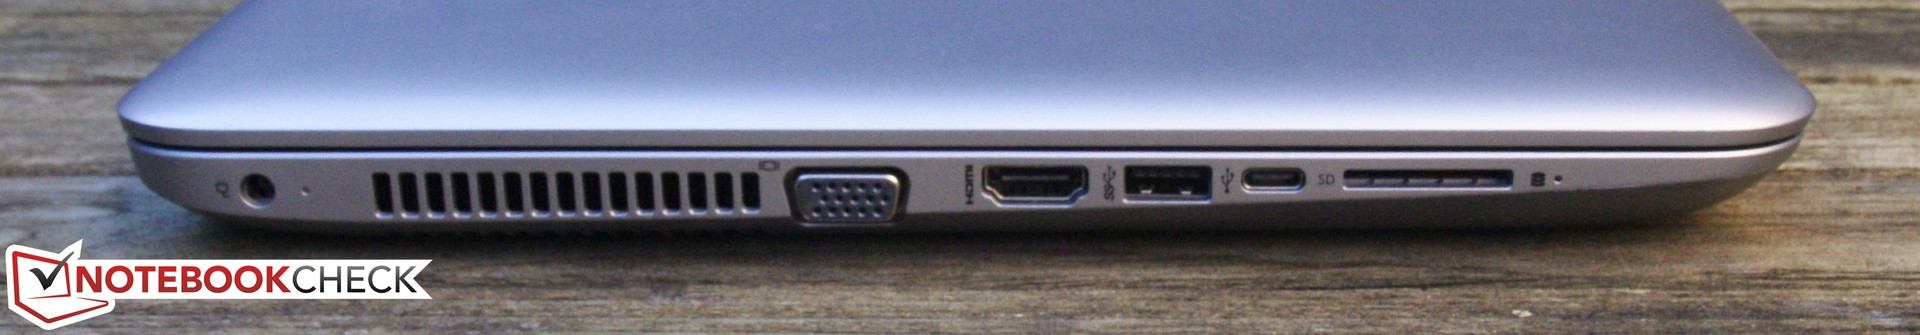
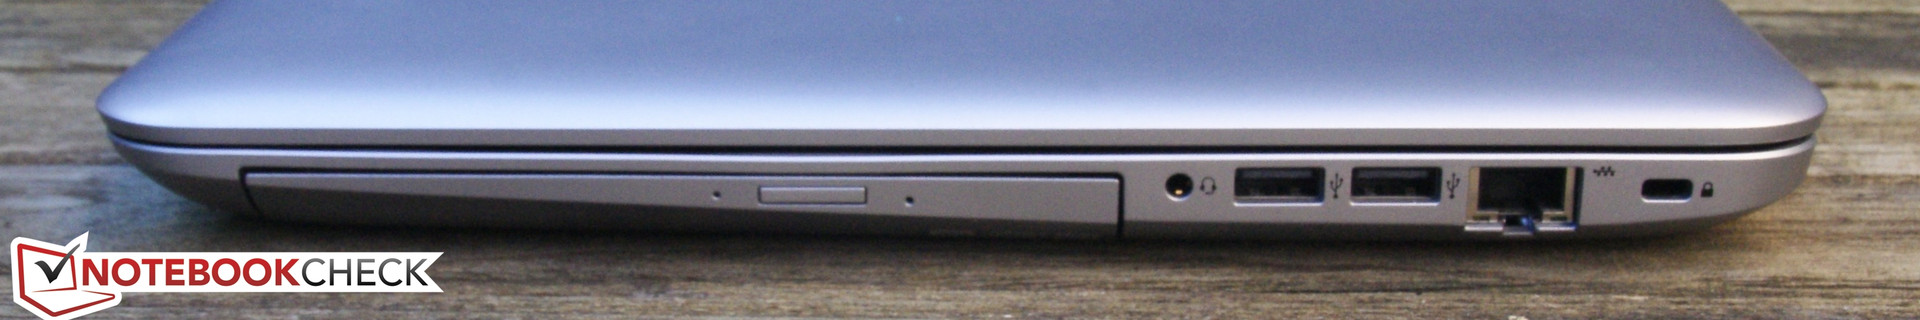
El ProBook 450 G4 es un dispositivo sólido en realidad: La carcasa es decente y apenas tiene debilidades, el reposamanos metálico tiene un buen tacto, y el dispositivo ofrece una sóida selección de interfaces que incluye USB Type-C. Aunque este puerto no hace nada más que USB, ofrece seguridad futura fundamental. El procesador ofrece un rendimiento decente, el teclado es adecuado para el mecanografiado, y el touchpad se corresponde con el estándar Precision. Por último está el buen aguante de batería que ciertamente invita a trabajar fuera.
Por desgracia, esto no compensa el importante defecto del dispositivo: La terrible pantalla. Esto quizá podría justificarse a un precio de 600 Euros, pero es sencillamente inaceptable a casi 1000 Euros. También hay otros defectos: El lector de huellas apenas es fiable, y el procesador se calienta muchísimo bajo carga. HP también debería permitir que el ventilador gire más rápido aquí.
Una pena: El fabricante arruina lo que en realidad es un paquete perfecto con una pantalla que sencillamente es inadecuada para el precio.
El ProBook sigue aún sin rival en el sector business al menos en teŕminos de procesadores. Sin embargo, esto cambiará pronto: El ThinkPad E570 ha sido anunciado, y será un dispositivo de comparación interesante con su panel IPS y su GeForce 950M. Los demás competidores seguramente aparezcan pronto durante el 2017.
Ésta es una versión acortada del análisis original. Puedes leer el análisis completo en inglés aquí.
HP ProBook 450 G4 Y8B60EA
- 12/14/2016 v6 (old)
Benjamin Herzig