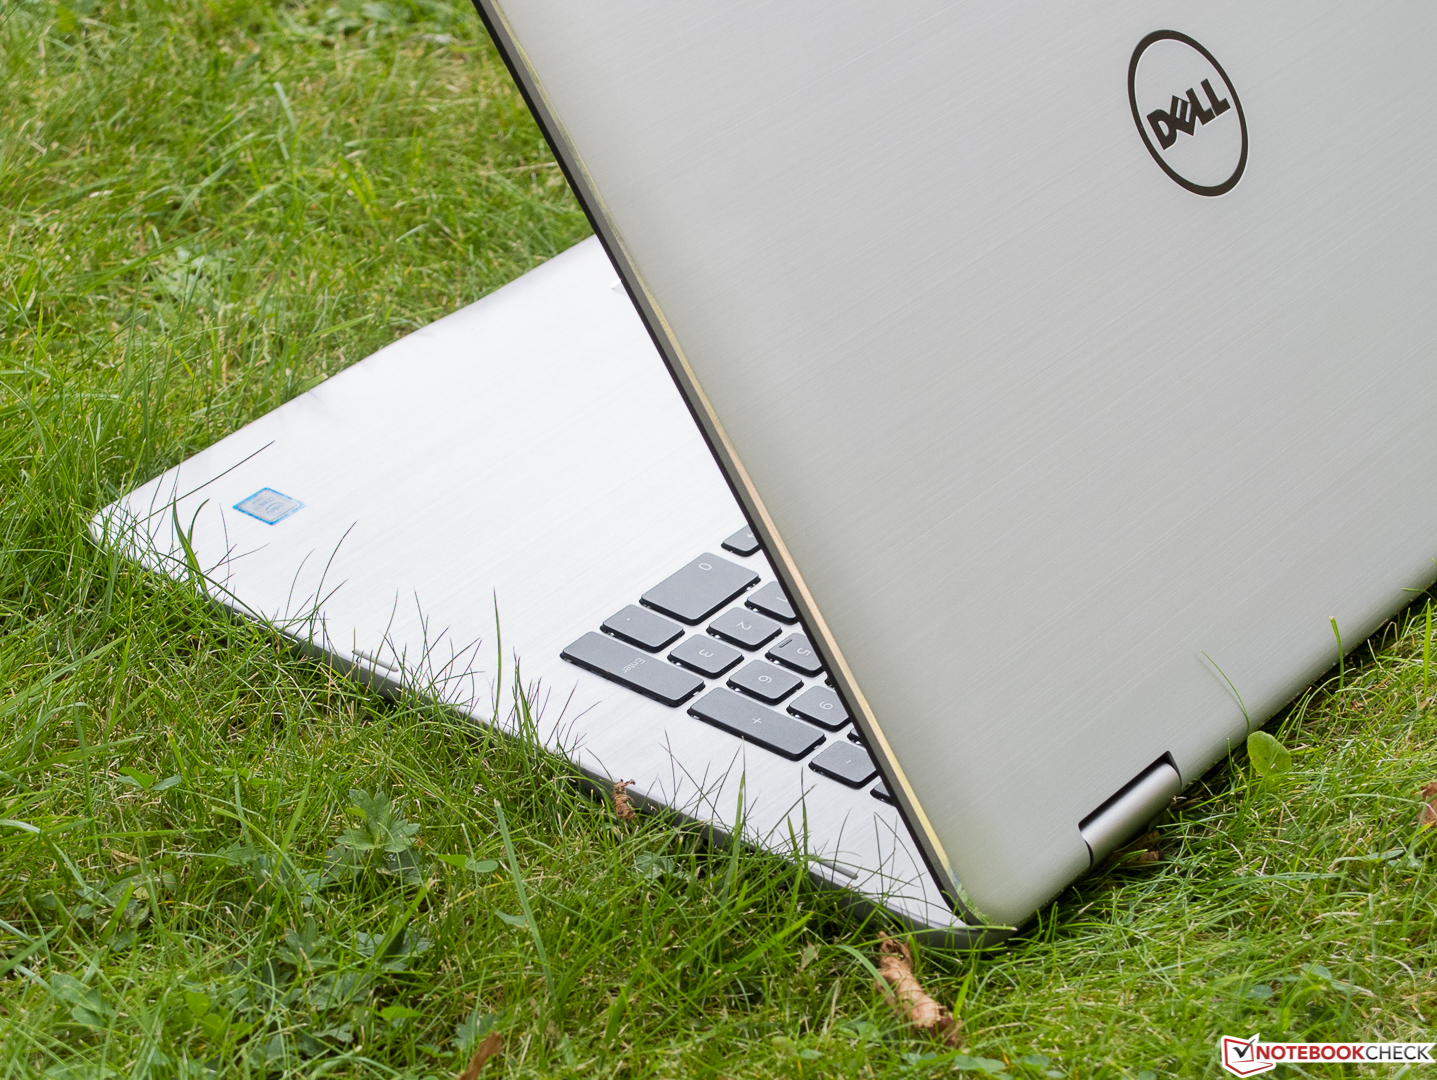
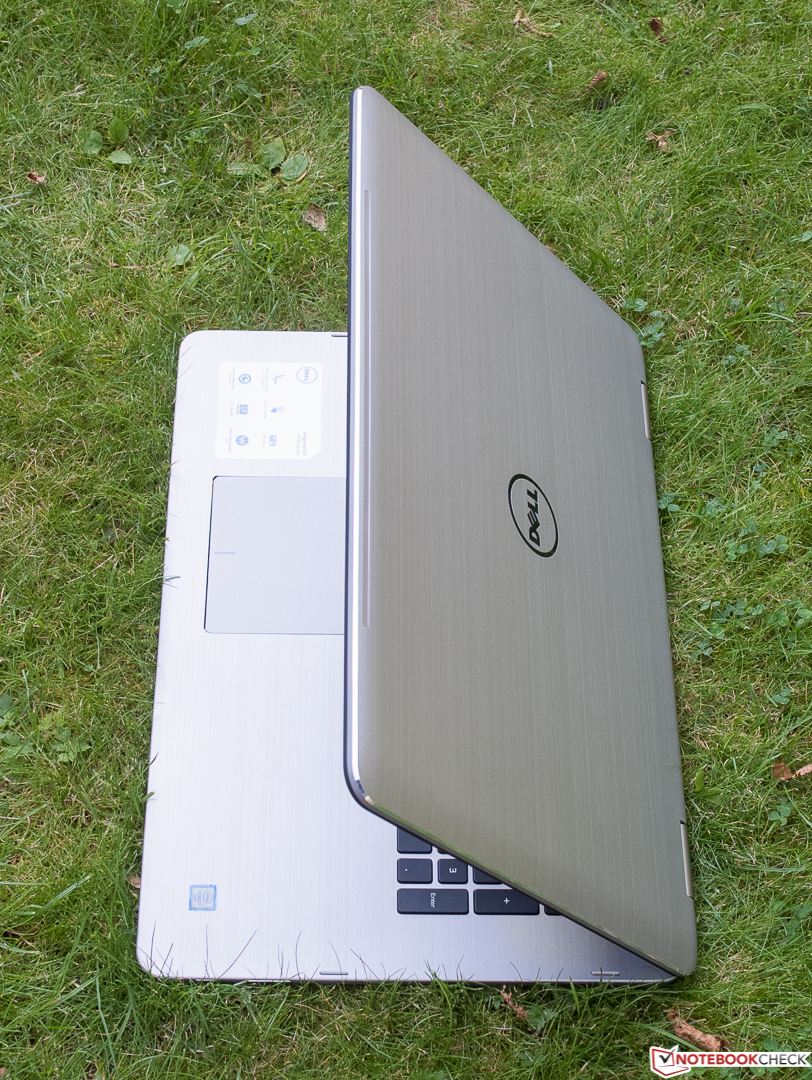
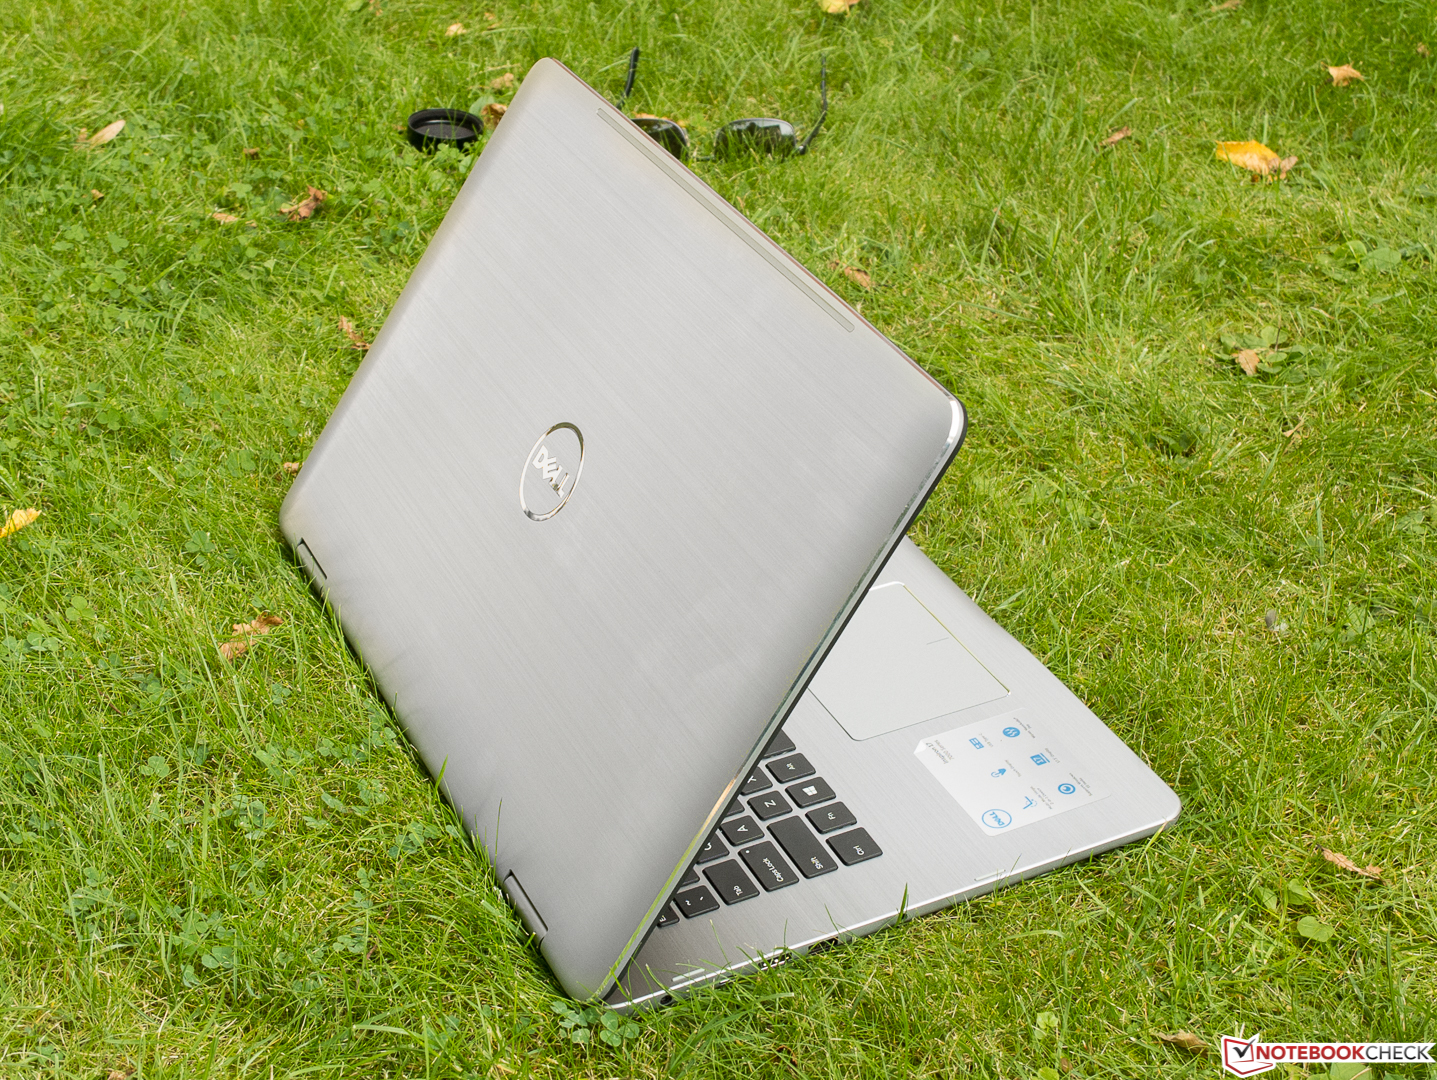
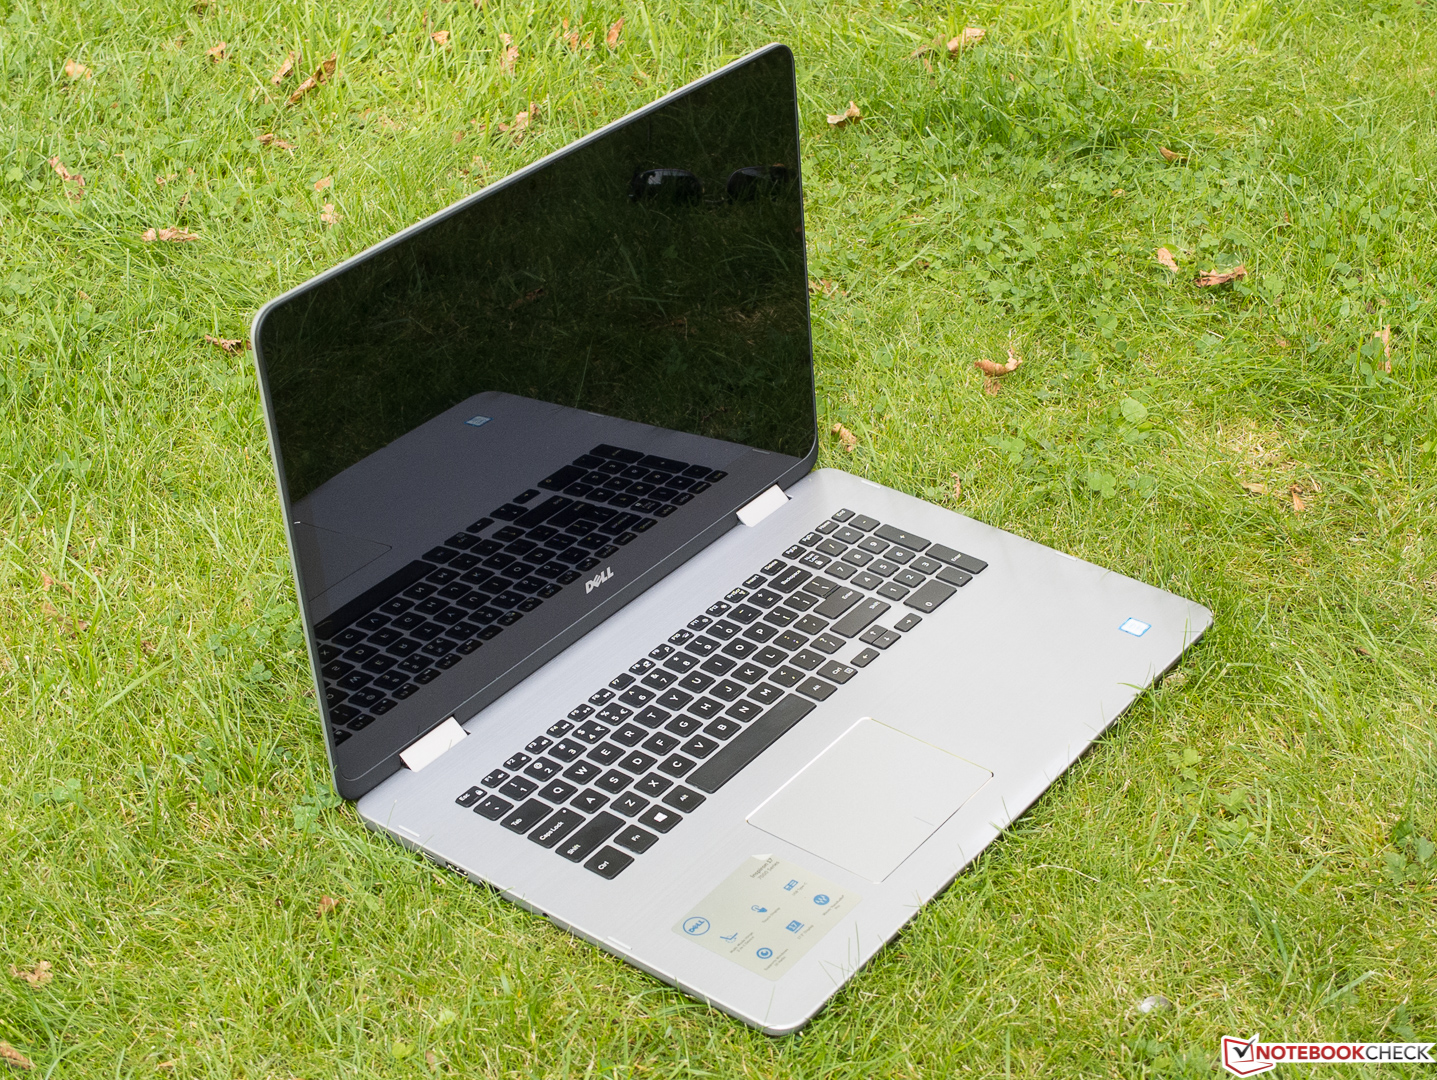
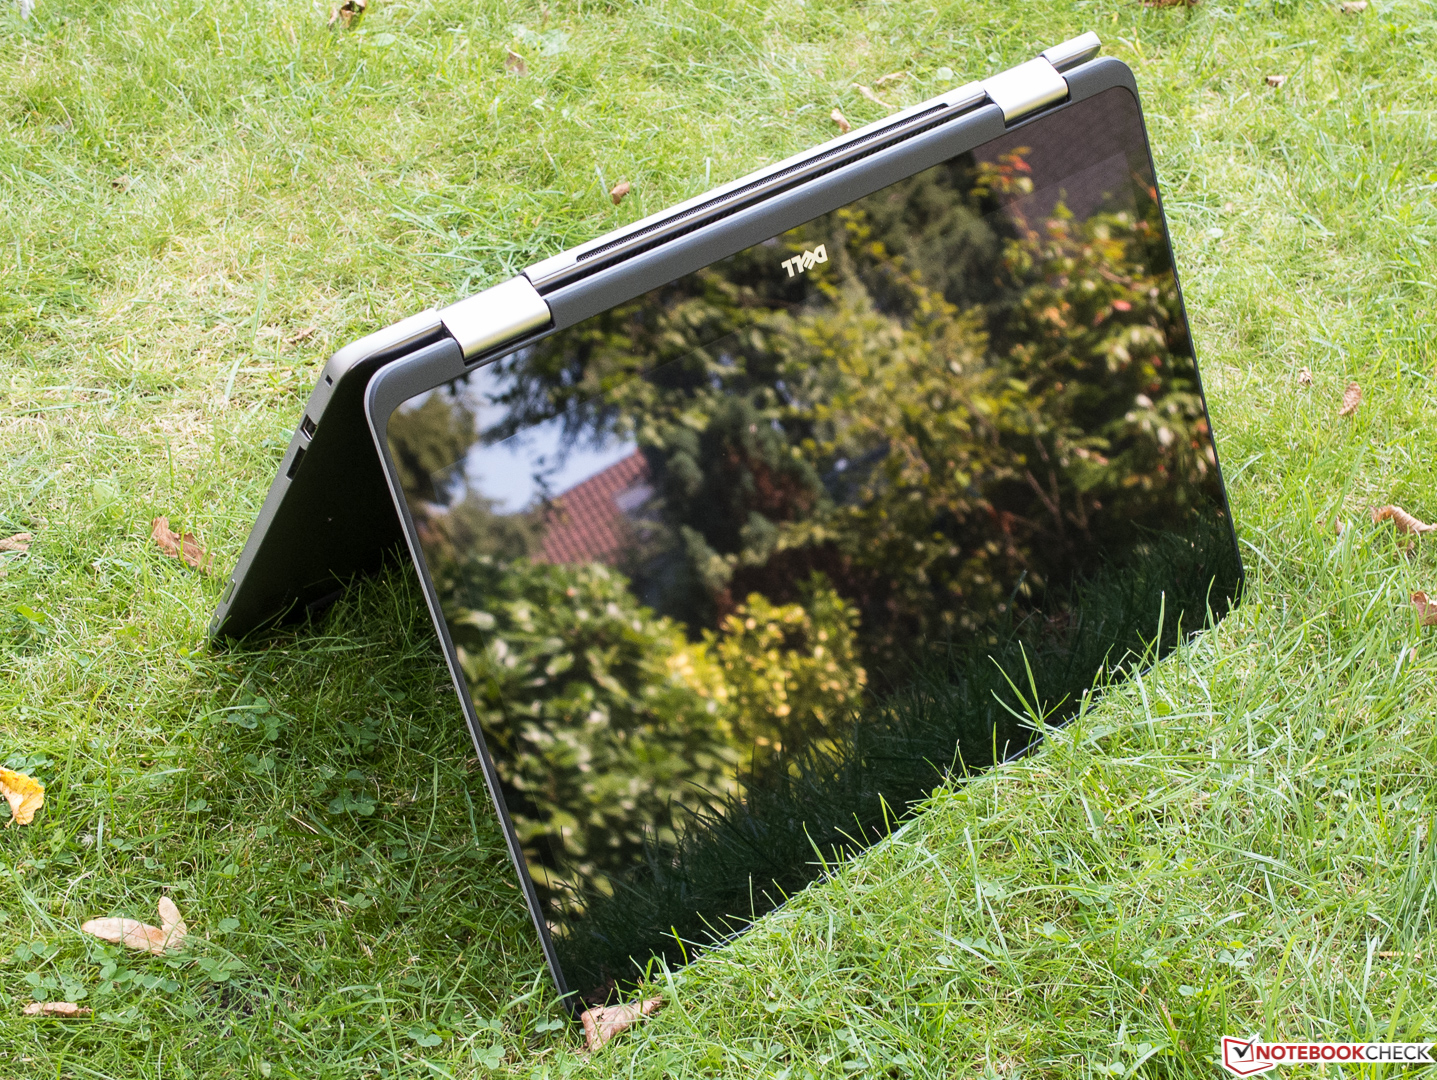
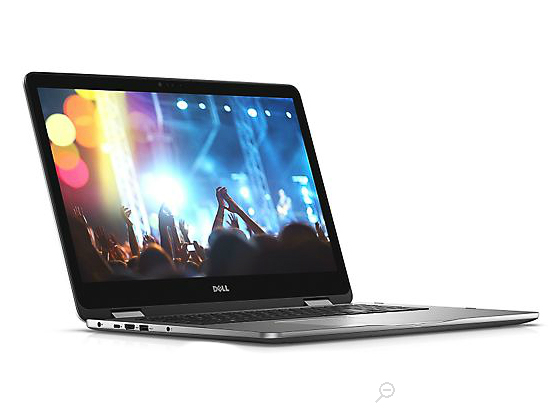
Breve análisis del Convertible Dell Inspiron 17 7778


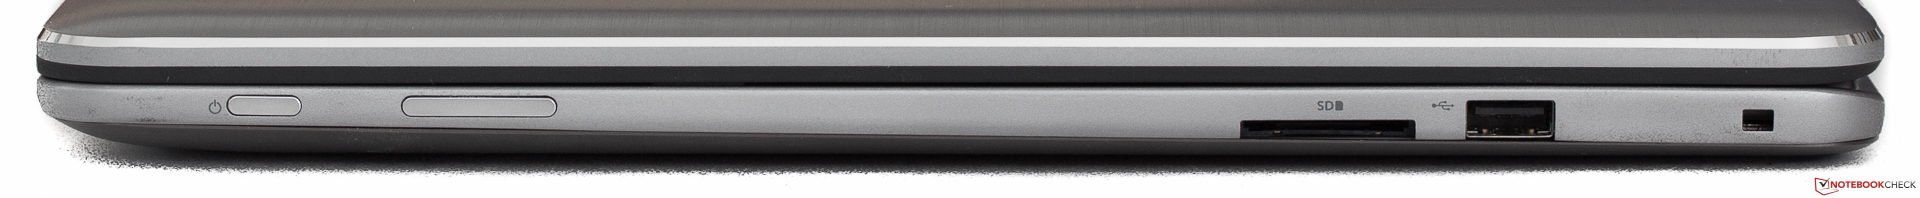
| SD Card Reader | |
| average JPG Copy Test (av. of 3 runs) | |
| HP Envy 15-w103ng x360 | |
| Dell Inspiron 17 7778 | |
| Dell Inspiron 15 5568 | |
| Acer TravelMate P278-MG-76L2 | |
| maximum AS SSD Seq Read Test (1GB) | |
| HP Envy 15-w103ng x360 | |
| Acer TravelMate P278-MG-76L2 | |
| Dell Inspiron 15 5568 | |
| Dell Inspiron 17 7778 | |
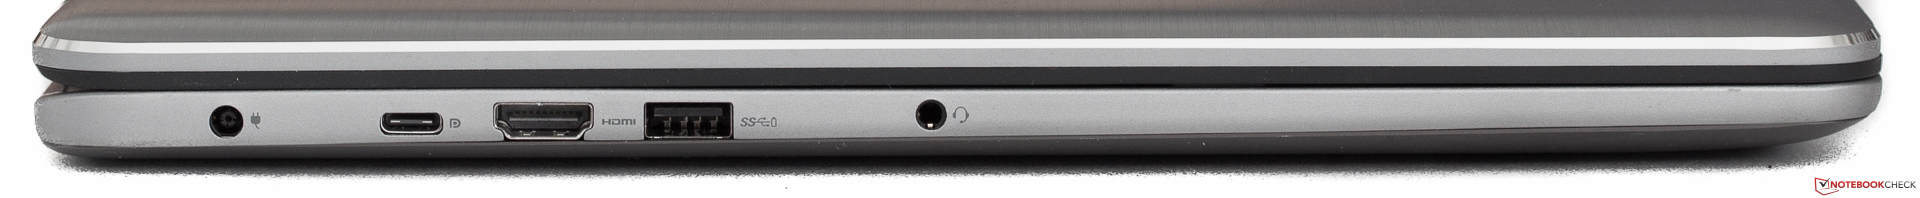
| Networking | |
| Wi-Fi Client 1m | |
| Wi-Fi Server 1m |
| |||||||||||||||||||||||||
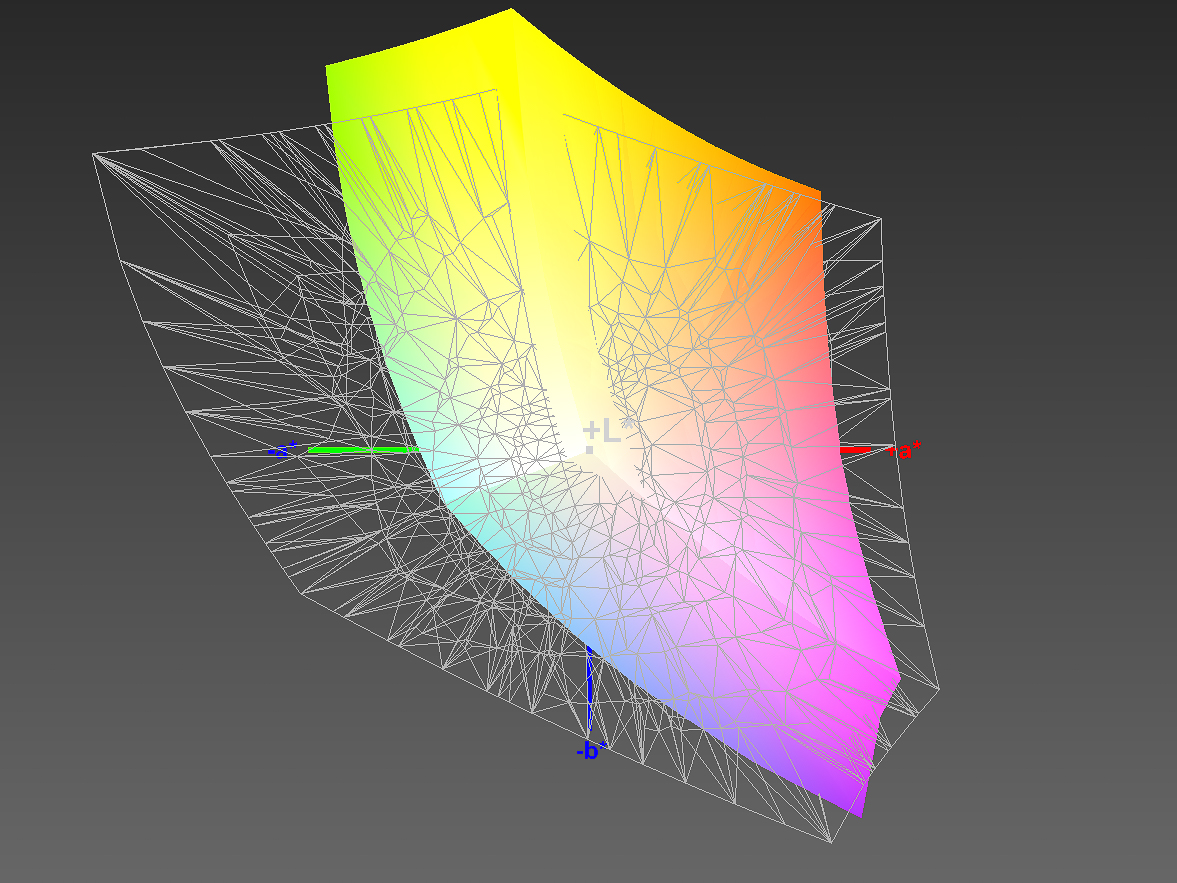
iluminación: 87 %
Brillo con batería: 334 cd/m²
Contraste: 1090:1 (Negro: 0.3 cd/m²)
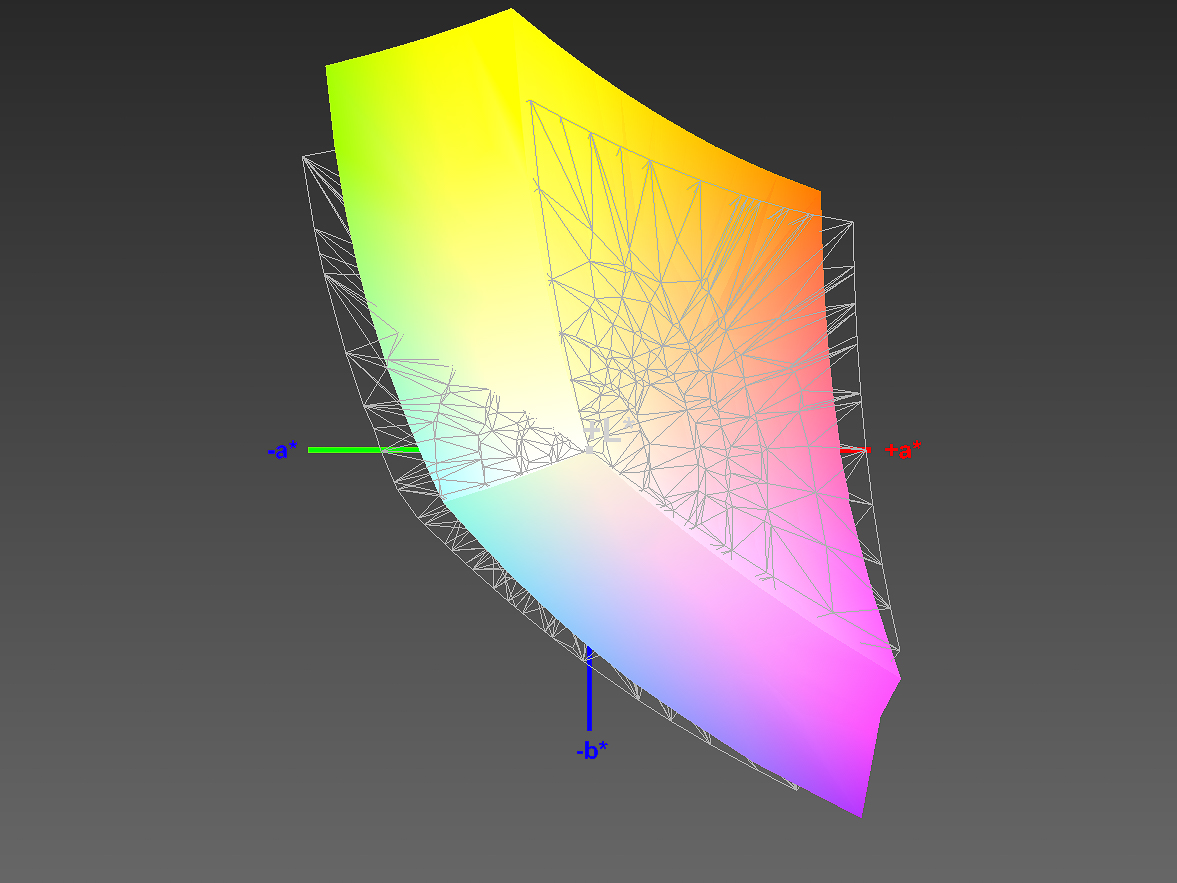
ΔE ColorChecker Calman: 6.75 | ∀{0.5-29.43 Ø4.73}
ΔE Greyscale Calman: 7.91 | ∀{0.09-98 Ø4.97}
86% sRGB (Argyll 1.6.3 3D)
57% AdobeRGB 1998 (Argyll 1.6.3 3D)
63.1% AdobeRGB 1998 (Argyll 3D)
86.3% sRGB (Argyll 3D)
67.4% Display P3 (Argyll 3D)
Gamma: 2.31
CCT: 7642 K
| Dell Inspiron 17 7778 LG Philips LGD 0513 / 173WF4, , 1920x1080, 17.3" | HP Spectre x360 15-ap012dx 3840x2160, 15.6" | Dell Inspiron 15 5568 AU Optronics B156HW01 V0, , 1920x1080, 15.6" | HP Envy 15-w103ng x360 LG Philips, , 1920x1080, 15.6" | Acer TravelMate P278-MG-76L2 AUO B173HTN01.1 (AUO119D), , 1920x1080, 17.3" | |
|---|---|---|---|---|---|
| Display | -1% | -39% | -36% | 4% | |
| Display P3 Coverage (%) | 67.4 | 62.8 -7% | 38.04 -44% | 39.97 -41% | 68.8 2% |
| sRGB Coverage (%) | 86.3 | 88.2 2% | 57.1 -34% | 59.8 -31% | 90.6 5% |
| AdobeRGB 1998 Coverage (%) | 63.1 | 63.9 1% | 39.3 -38% | 41.32 -35% | 66.3 5% |
| Response Times | -9% | -9% | -15% | -10% | |
| Response Time Grey 50% / Grey 80% * (ms) | 36 ? | 32.8 ? 9% | 42 ? -17% | 37 ? -3% | 41 ? -14% |
| Response Time Black / White * (ms) | 22 ? | 28 ? -27% | 22 ? -0% | 28 ? -27% | 23 ? -5% |
| PWM Frequency (Hz) | 1000 ? | ||||
| Screen | -1% | -1% | -17% | -21% | |
| Brightness middle (cd/m²) | 327 | 298 -9% | 266 -19% | 208 -36% | 362 11% |
| Brightness (cd/m²) | 314 | 295 -6% | 249 -21% | 205 -35% | 344 10% |
| Brightness Distribution (%) | 87 | 88 1% | 85 -2% | 80 -8% | 84 -3% |
| Black Level * (cd/m²) | 0.3 | 0.57 -90% | 0.26 13% | 0.26 13% | 0.57 -90% |
| Contrast (:1) | 1090 | 523 -52% | 1023 -6% | 800 -27% | 635 -42% |
| Colorchecker dE 2000 * | 6.75 | 4.43 34% | 4.98 26% | 6.97 -3% | 9.54 -41% |
| Colorchecker dE 2000 max. * | 11.82 | 6.62 44% | 11.82 -0% | 16.11 -36% | |
| Greyscale dE 2000 * | 7.91 | 2.45 69% | 2.68 66% | 7.37 7% | 10.39 -31% |
| Gamma | 2.31 95% | 2.45 90% | 2.27 97% | 2.34 94% | 2.55 86% |
| CCT | 7642 85% | 6326 103% | 6583 99% | 6823 95% | 11093 59% |
| Color Space (Percent of AdobeRGB 1998) (%) | 57 | 57.2 0% | 36 -37% | 38 -33% | 59 4% |
| Color Space (Percent of sRGB) (%) | 86 | 87.8 2% | 57 -34% | 59 -31% | 90 5% |
| Media total (Programa/Opciones) | -4% /
-2% | -16% /
-10% | -23% /
-21% | -9% /
-15% |
* ... más pequeño es mejor
Tiempos de respuesta del display
| ↔ Tiempo de respuesta de Negro a Blanco | ||
|---|---|---|
| 22 ms ... subida ↗ y bajada ↘ combinada | ↗ 5 ms subida | 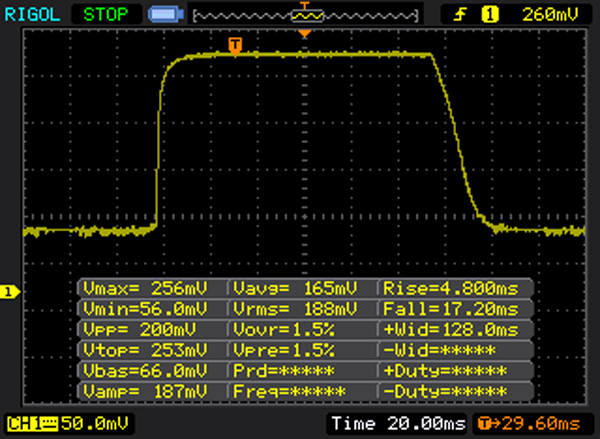 |
| ↘ 17 ms bajada | ||
| La pantalla mostró buenos tiempos de respuesta en nuestros tests pero podría ser demasiado lenta para los jugones competitivos. En comparación, todos los dispositivos de prueba van de ##min### (mínimo) a 240 (máximo) ms. » 48 % de todos los dispositivos son mejores. Eso quiere decir que el tiempo de respuesta es peor que la media (19.9 ms) de todos los dispositivos testados. | ||
| ↔ Tiempo de respuesta 50% Gris a 80% Gris | ||
| 36 ms ... subida ↗ y bajada ↘ combinada | ↗ 14 ms subida | 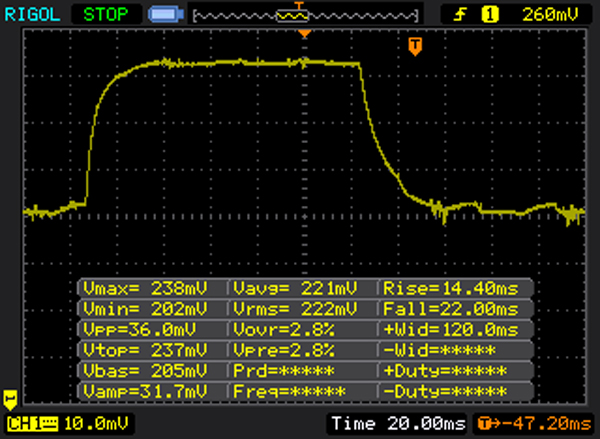 |
| ↘ 22 ms bajada | ||
| La pantalla mostró tiempos de respuesta lentos en nuestros tests y podría ser demasiado lenta para los jugones. En comparación, todos los dispositivos de prueba van de ##min### (mínimo) a 636 (máximo) ms. » 50 % de todos los dispositivos son mejores. Eso quiere decir que el tiempo de respuesta es peor que la media (31.1 ms) de todos los dispositivos testados. | ||
Parpadeo de Pantalla / PWM (Pulse-Width Modulation)
| Parpadeo de Pantalla / PWM no detectado | ||
Comparación: 52 % de todos los dispositivos testados no usaron PWM para atenuar el display. Si se usó, medimos una media de 7798 (mínimo: 5 - máxmo: 343500) Hz. | ||

| PCMark 8 | |
| Home Score Accelerated v2 | |
| Dell Inspiron 17 7778 | |
| Dell Inspiron 15 5568 | |
| Acer TravelMate P278-MG-76L2 | |
| HP Envy 15-w103ng x360 | |
| HP Spectre x360 15-ap012dx | |
| Work Score Accelerated v2 | |
| Dell Inspiron 17 7778 | |
| Acer TravelMate P278-MG-76L2 | |
| Dell Inspiron 15 5568 | |
| HP Envy 15-w103ng x360 | |
| HP Spectre x360 15-ap012dx | |
| PCMark 8 Home Score Accelerated v2 | 3696 puntos | |
| PCMark 8 Work Score Accelerated v2 | 4572 puntos | |
ayuda | ||
| Dell Inspiron 17 7778 Liteonit CV3-CE512 | HP Spectre x360 15-ap012dx Sandisk X300 SD7SN6S-256G-1006 | Dell Inspiron 15 5568 Toshiba THNSNK256GCS8 | HP Envy 15-w103ng x360 Samsung SSD PM851 256 GB MZNTE256HMHP | Acer TravelMate P278-MG-76L2 Lite-On CV1-8B256 | |
|---|---|---|---|---|---|
| CrystalDiskMark 3.0 | -4% | -8% | 2% | -4% | |
| Read Seq (MB/s) | 486.4 | 475.6 -2% | 458.6 -6% | 515 6% | 473 -3% |
| Write Seq (MB/s) | 438.4 | 425 -3% | 270 -38% | 240.7 -45% | 366.3 -16% |
| Read 512 (MB/s) | 232.8 | 258.4 11% | 397.4 71% | 391.3 68% | 329.4 41% |
| Write 512 (MB/s) | 386.7 | 318.9 -18% | 242 -37% | 240 -38% | 357.3 -8% |
| Read 4k (MB/s) | 32.3 | 35.48 10% | 19.88 -38% | 27.64 -14% | 30.83 -5% |
| Write 4k (MB/s) | 65.8 | 93 41% | 86.7 32% | 95.2 45% | 74.8 14% |
| Read 4k QD32 (MB/s) | 334.4 | 281.2 -16% | 275.3 -18% | 367.9 10% | 245.1 -27% |
| Write 4k QD32 (MB/s) | 289.5 | 138.7 -52% | 197.6 -32% | 239 -17% | 217.3 -25% |

| 3DMark 11 - 1280x720 Performance GPU | |
| Dell Inspiron 17 7778 | |
| Acer TravelMate P278-MG-76L2 | |
| HP Envy 15-w103ng x360 | |
| Dell Inspiron 15 5568 | |
| HP Spectre x360 15-ap012dx | |
| 3DMark | |
| 1280x720 Cloud Gate Standard Graphics | |
| Dell Inspiron 17 7778 | |
| Acer TravelMate P278-MG-76L2 | |
| Dell Inspiron 15 5568 | |
| HP Envy 15-w103ng x360 | |
| HP Spectre x360 15-ap012dx | |
| 1920x1080 Fire Strike Graphics | |
| Dell Inspiron 17 7778 | |
| Acer TravelMate P278-MG-76L2 | |
| HP Envy 15-w103ng x360 | |
| HP Spectre x360 15-ap012dx | |
| 3DMark 11 Performance | 2867 puntos | |
| 3DMark Cloud Gate Standard Score | 7674 puntos | |
| 3DMark Fire Strike Score | 1748 puntos | |
ayuda | ||
| Mirror's Edge Catalyst | |
| 1920x1080 High Preset AF:16x | |
| MSI CX72 6QD | |
| Dell Inspiron 17 7778 | |
| 1366x768 Medium Preset AF:4x | |
| MSI CX72 6QD | |
| Asus VivoBook X556UQ-XO076T | |
| Dell Inspiron 17 7778 | |
| Far Cry Primal | |
| 1920x1080 High Preset AA:SM | |
| Dell Inspiron 17 7778 | |
| MSI CX72 6QD | |
| Lenovo ThinkPad T560-20FH002RGE | |
| 1920x1080 Medium Preset AA:SM | |
| MSI CX72 6QD | |
| Dell Inspiron 17 7778 | |
| Lenovo ThinkPad T560-20FH002RGE | |
| Rise of the Tomb Raider | |
| 1920x1080 High Preset AA:FX AF:4x | |
| Dell Inspiron 17 7778 | |
| MSI CX72 6QD | |
| Lenovo ThinkPad T560-20FH002RGE | |
| Acer TravelMate P278-MG-76L2 | |
| 1366x768 Medium Preset AF:2x | |
| Dell Inspiron 17 7778 | |
| MSI CX72 6QD | |
| Lenovo ThinkPad T560-20FH002RGE | |
| Acer TravelMate P278-MG-76L2 | |
| Just Cause 3 | |
| 1920x1080 High / On AA:FX AF:8x | |
| MSI CX72 6QD | |
| Lenovo ThinkPad T560-20FH002RGE | |
| Dell Inspiron 17 7778 | |
| 1366x768 Medium / Off AF:4x | |
| MSI CX72 6QD | |
| Lenovo ThinkPad T560-20FH002RGE | |
| Dell Inspiron 17 7778 | |
| Rainbow Six Siege | |
| 1920x1080 High Preset AA:T AF:4x | |
| MSI CX72 6QD | |
| Dell Inspiron 17 7778 | |
| Lenovo ThinkPad T560-20FH002RGE | |
| 1366x768 Medium Preset AA:T AF:2x | |
| MSI CX72 6QD | |
| Lenovo ThinkPad T560-20FH002RGE | |
| Dell Inspiron 17 7778 | |
| Assassin's Creed Syndicate | |
| 1920x1080 High Preset AA:FX | |
| Dell Inspiron 17 7778 | |
| HP Envy 15-w103ng x360 | |
| 1366x768 Medium Preset AA:FX | |
| Dell Inspiron 17 7778 | |
| MSI CX72 6QD | |
| HP Envy 15-w103ng x360 | |
| Star Wars Battlefront | |
| 1920x1080 High Preset AA:FX | |
| Dell Inspiron 17 7778 | |
| MSI CX72 6QD | |
| Lenovo ThinkPad T560-20FH002RGE | |
| HP Envy 15-w103ng x360 | |
| 1366x768 Medium Preset AA:FX | |
| MSI CX72 6QD | |
| Lenovo ThinkPad T560-20FH002RGE | |
| Asus VivoBook X556UQ-XO076T | |
| Dell Inspiron 17 7778 | |
| HP Envy 15-w103ng x360 | |
| Fallout 4 | |
| 1920x1080 High Preset AA:T AF:16x | |
| Dell Inspiron 17 7778 | |
| MSI CX72 6QD | |
| Lenovo ThinkPad T560-20FH002RGE | |
| HP Envy 15-w103ng x360 | |
| 1366x768 Medium Preset AA:T AF:16x | |
| Dell Inspiron 17 7778 | |
| MSI CX72 6QD | |
| Lenovo ThinkPad T560-20FH002RGE | |
| HP Envy 15-w103ng x360 | |
| Anno 2205 | |
| 1920x1080 High Preset AA:4x | |
| Dell Inspiron 17 7778 | |
| Lenovo ThinkPad T560-20FH002RGE | |
| MSI CX72 6QD | |
| HP Envy 15-w103ng x360 | |
| 1366x768 Medium Preset AA:2x | |
| MSI CX72 6QD | |
| Dell Inspiron 17 7778 | |
| Lenovo ThinkPad T560-20FH002RGE | |
| HP Envy 15-w103ng x360 | |
| FIFA 16 | |
| 1920x1080 High Preset AA:4x MS | |
| Dell Inspiron 17 7778 | |
| MSI CX72 6QD | |
| HP Envy 15-w103ng x360 | |
| 1366x768 High Preset AA:2x MS | |
| MSI CX72 6QD | |
| HP Envy 15-w103ng x360 | |
| Dirt Rally | |
| 1920x1080 High Preset | |
| Dell Inspiron 17 7778 | |
| Lenovo ThinkPad T560-20FH002RGE | |
| 1366x768 Medium Preset | |
| Dell Inspiron 17 7778 | |
| Lenovo ThinkPad T560-20FH002RGE | |
| The Witcher 3 | |
| 1920x1080 High Graphics & Postprocessing (Nvidia HairWorks Off) | |
| Dell Inspiron 17 7778 | |
| MSI CX72 6QD | |
| Lenovo ThinkPad T560-20FH002RGE | |
| HP Envy 15-w103ng x360 | |
| 1366x768 Medium Graphics & Postprocessing | |
| Dell Inspiron 17 7778 | |
| MSI CX72 6QD | |
| Lenovo ThinkPad T560-20FH002RGE | |
| HP Envy 15-w103ng x360 | |
| Battlefield 4 | |
| 1366x768 High Preset | |
| Dell Inspiron 17 7778 | |
| Lenovo ThinkPad T560-20FH002RGE | |
| Asus VivoBook X556UQ-XO076T | |
| Acer TravelMate P278-MG-76L2 | |
| 1366x768 Medium Preset | |
| Lenovo ThinkPad T560-20FH002RGE | |
| Asus VivoBook X556UQ-XO076T | |
| Dell Inspiron 17 7778 | |
| Acer TravelMate P278-MG-76L2 | |
| Metro: Last Light | |
| 1366x768 High (DX11) AF:16x | |
| Dell Inspiron 17 7778 | |
| Lenovo ThinkPad T560-20FH002RGE | |
| 1366x768 Medium (DX10) AF:4x | |
| Dell Inspiron 17 7778 | |
| Lenovo ThinkPad T560-20FH002RGE | |
| BioShock Infinite | |
| 1366x768 High Preset | |
| Dell Inspiron 17 7778 | |
| Lenovo ThinkPad T560-20FH002RGE | |
| Acer TravelMate P278-MG-76L2 | |
| Asus VivoBook X556UQ-XO076T | |
| 1366x768 Medium Preset | |
| Dell Inspiron 17 7778 | |
| Lenovo ThinkPad T560-20FH002RGE | |
| Acer TravelMate P278-MG-76L2 | |
| Asus VivoBook X556UQ-XO076T | |
| Crysis 3 | |
| 1366x768 High Preset AA:FX AF:16x | |
| Dell Inspiron 17 7778 | |
| Lenovo ThinkPad T560-20FH002RGE | |
| 1366x768 Medium Preset AF:16x | |
| Dell Inspiron 17 7778 | |
| Lenovo ThinkPad T560-20FH002RGE | |
| bajo | medio | alto | ultra | |
|---|---|---|---|---|
| Crysis 3 (2013) | 51.5 | 28.1 | 21.7 | |
| BioShock Infinite (2013) | 107.8 | 60.1 | 53.1 | 19.3 |
| Metro: Last Light (2013) | 55.2 | 42.6 | 25.2 | |
| Battlefield 4 (2013) | 40.6 | 32.4 | 14.3 | |
| Dirt Rally (2015) | 52.4 | 30.7 | ||
| The Witcher 3 (2015) | 36.9 | 21.7 | 11.2 | |
| FIFA 16 (2015) | 45.8 | |||
| Anno 2205 (2015) | 39.4 | 27 | 13.2 | |
| Fallout 4 (2015) | 37.1 | 25.2 | 13.9 | |
| Star Wars Battlefront (2015) | 40.1 | 29.6 | 16.5 | |
| Assassin's Creed Syndicate (2015) | 20.7 | 20.1 | 11.1 | |
| Rainbow Six Siege (2015) | 79.1 | 40.4 | 22.5 | |
| Just Cause 3 (2015) | 31.9 | 25.7 | 13.4 | |
| Rise of the Tomb Raider (2016) | 37.7 | 22.3 | 13.1 | |
| Far Cry Primal (2016) | 32 | 14 | 14 | |
| The Division (2016) | 40.2 | 20.7 | 8.8 | |
| Hitman 2016 (2016) | 21.7 | 23.4 | ||
| Mirror's Edge Catalyst (2016) | 44 | 19.3 | 8.3 |
Ruido
| Ocioso |
| 32.1 / 32.1 / 34 dB(A) |
| Carga |
| 40.3 / 42.6 dB(A) |
 | ||
30 dB silencioso 40 dB(A) audible 50 dB(A) ruidosamente alto |
||
min: | ||
(±) La temperatura máxima en la parte superior es de 44.7 °C / 112 F, frente a la media de 36.8 °C / 98 F, que oscila entre 21 y 71 °C para la clase Multimedia.
(-) El fondo se calienta hasta un máximo de 45.5 °C / 114 F, frente a la media de 39.1 °C / 102 F
(+) En reposo, la temperatura media de la parte superior es de 29.9 °C / 86# F, frente a la media del dispositivo de 31.3 °C / 88 F.
(+) Los reposamanos y el panel táctil alcanzan como máximo la temperatura de la piel (33.5 °C / 92.3 F) y, por tanto, no están calientes.
(-) La temperatura media de la zona del reposamanos de dispositivos similares fue de 28.7 °C / 83.7 F (-4.8 °C / -8.6 F).
Dell Inspiron 17 7778 análisis de audio
(±) | la sonoridad del altavoz es media pero buena (74 dB)
Graves 100 - 315 Hz
(±) | lubina reducida - en promedio 7.5% inferior a la mediana
(+) | el bajo es lineal (6.4% delta a la frecuencia anterior)
Medios 400 - 2000 Hz
(+) | medios equilibrados - a sólo 4.9% de la mediana
(+) | los medios son lineales (6.6% delta a la frecuencia anterior)
Altos 2 - 16 kHz
(+) | máximos equilibrados - a sólo 1.7% de la mediana
(+) | los máximos son lineales (4.5% delta a la frecuencia anterior)
Total 100 - 16.000 Hz
(+) | el sonido global es lineal (12.5% de diferencia con la mediana)
En comparación con la misma clase
» 24% de todos los dispositivos probados de esta clase eran mejores, 3% similares, 73% peores
» El mejor tuvo un delta de 5%, la media fue 17%, el peor fue ###max##%
En comparación con todos los dispositivos probados
» 11% de todos los dispositivos probados eran mejores, 2% similares, 87% peores
» El mejor tuvo un delta de 4%, la media fue 24%, el peor fue ###max##%
| Off / Standby | |
| Ocioso | |
| Carga |
|
Clave:
min: | |
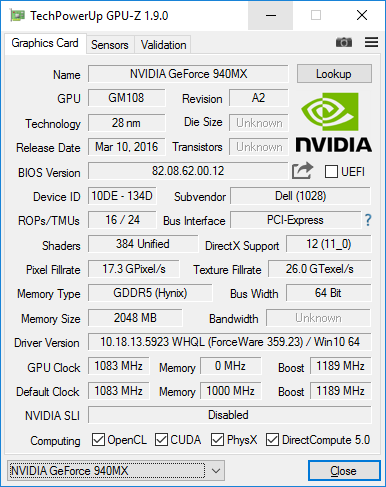
| Dell Inspiron 17 7778 6500U, GeForce 940MX, Liteonit CV3-CE512, IPS, 1920x1080, 17.3" | HP Spectre x360 15-ap012dx 6200U, HD Graphics 520, Sandisk X300 SD7SN6S-256G-1006, IPS, 3840x2160, 15.6" | Dell Inspiron 15 5568 6500U, HD Graphics 520, Toshiba THNSNK256GCS8, IPS, 1920x1080, 15.6" | HP Envy 15-w103ng x360 6200U, GeForce 930M, Samsung SSD PM851 256 GB MZNTE256HMHP, IPS, 1920x1080, 15.6" | Acer TravelMate P278-MG-76L2 6500U, GeForce 940M, Lite-On CV1-8B256, TN LED, 1920x1080, 17.3" | |
|---|---|---|---|---|---|
| Power Consumption | -0% | 31% | 24% | -13% | |
| Idle Minimum * (Watt) | 5.6 | 6.5 -16% | 4.34 22% | 4.15 26% | 5.8 -4% |
| Idle Average * (Watt) | 11.2 | 13.3 -19% | 7.5 33% | 8.2 27% | 11.6 -4% |
| Idle Maximum * (Watt) | 11.9 | 15.1 -27% | 8.4 29% | 8.2 31% | 13.6 -14% |
| Load Average * (Watt) | 46 | 30.8 33% | 30.4 34% | 34.6 25% | 51 -11% |
| Load Maximum * (Watt) | 53 | 38.5 27% | 32.5 39% | 48 9% | 69 -30% |
* ... más pequeño es mejor
| Dell Inspiron 17 7778 6500U, GeForce 940MX, 56 Wh | HP Spectre x360 15-ap012dx 6200U, HD Graphics 520, 65 Wh | Dell Inspiron 15 5568 6500U, HD Graphics 520, 42 Wh | HP Envy 15-w103ng x360 6200U, GeForce 930M, 48 Wh | Acer TravelMate P278-MG-76L2 6500U, GeForce 940M, 37 Wh | |
|---|---|---|---|---|---|
| Duración de Batería | -7% | -32% | -20% | -24% | |
| Reader / Idle (h) | 13.5 | 11.8 -13% | 7.5 -44% | 10 -26% | |
| WiFi v1.3 (h) | 8.3 | 7.2 -13% | 5 -40% | 6.6 -20% | 5 -40% |
| Load (h) | 1.8 | 1.9 6% | 1.6 -11% | 1.7 -6% | |
| H.264 (h) | 5 | 4.8 |
Pro
Contra
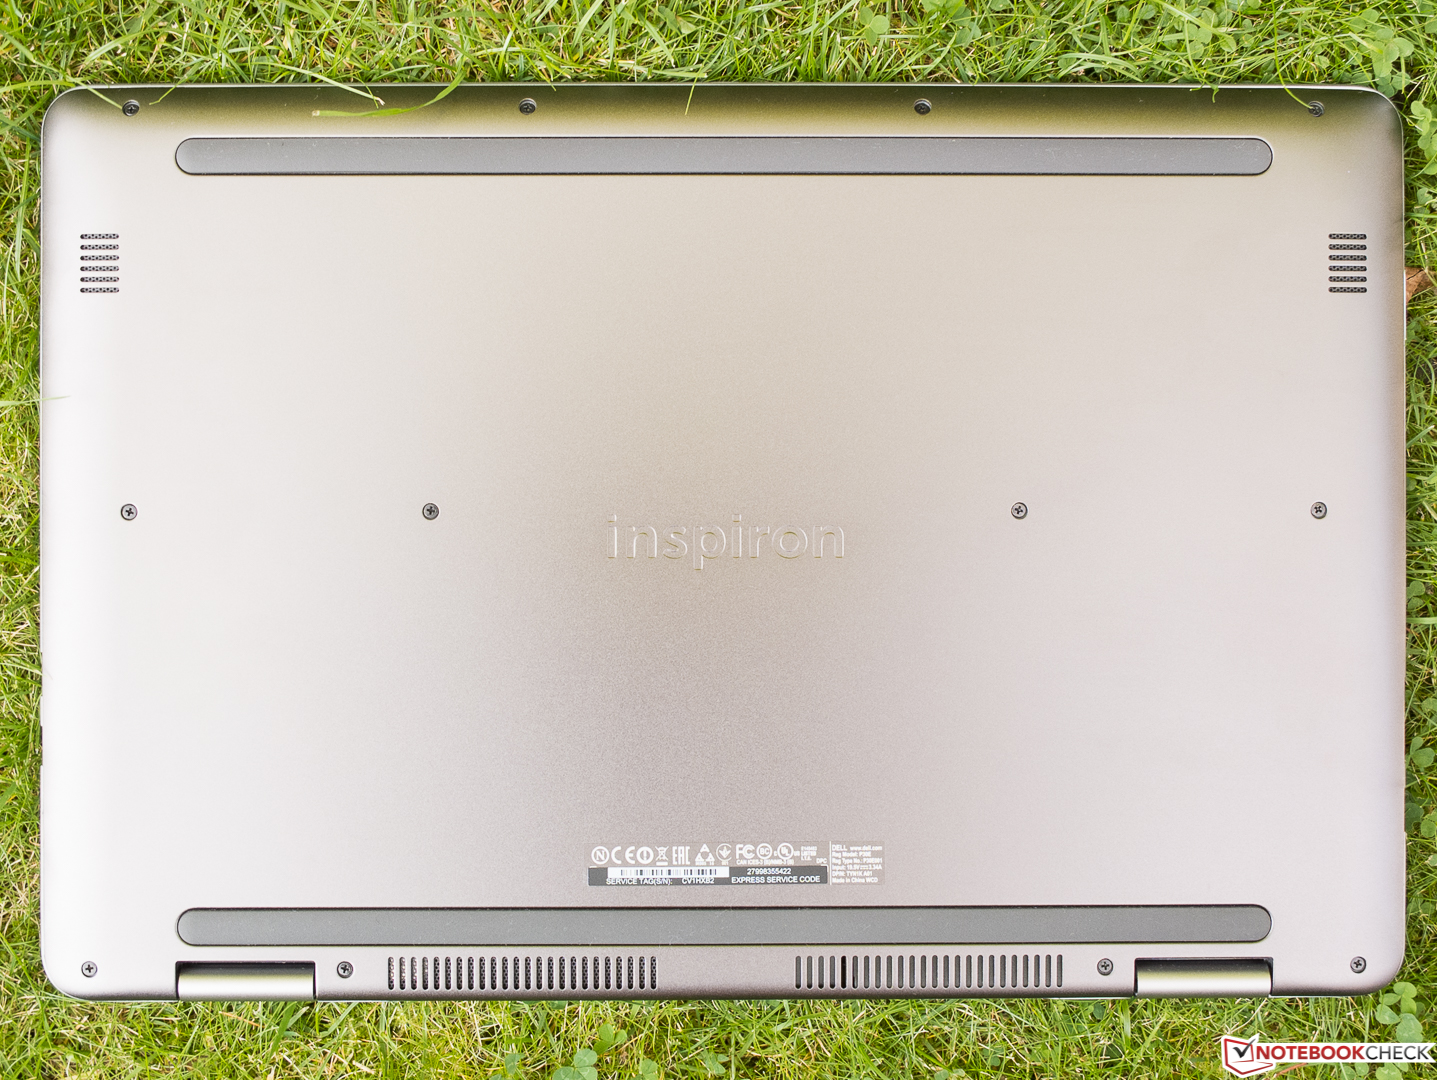
El nuevo Dell Inspiron 17 7778 2-en-1 es sin duda un convertible algo arcano cuyos aspectos de movilidad no son tan importantes como los de los convertibles más pequeños sencillamente por motivos de tamaño y peso. Pero esto no es un defecto ya que los modos típicos adicionales para un convertible básicamente son un bonus en un dispositivo que se puede usar perfectamente como portatil multimedia tradicional e incluso jugar a algún que otro juego gracias a la GeForce 940MX. La carcasa convence completamente, y la pantalla también. El sistema normalmente funcionará casi en silencio. Mucho aguante sin un enchufe cerca también agradará a los usuarios cuando deban trasladarse con el 7778.
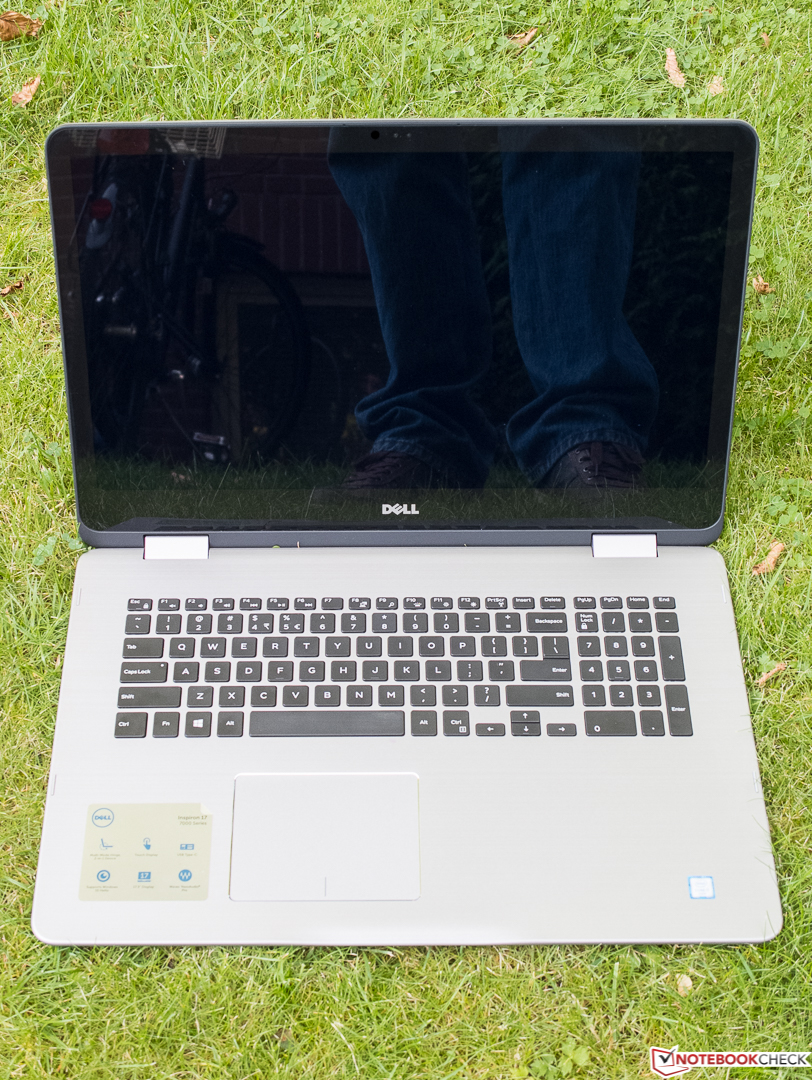
Aparte de las bisagras que son irrelevantes en ciertos modos, tenemos que criticar particularmente el teclado menos que ideal que difícilmente satisfará a los escritores prolíficos. La gráfica a veces tiende a ralentizarse, pero no es tan importante. El tester también tiene que añadir la pantalla táctil que no puede usarse de forma ideal con dedos húmedos cuando eso es evitable (¿con un acabado?).
En total, el Dell Inspiron 17 7778 es un convertible gigantesco flexible, estiloso, y sobre todo bien pensado que sólo pide unos pocos sacrificios a los fans del uso híbrido.
Ésta es una versión acortada del análisis original. Puedes leer el análisis completo en inglés aquí.
Dell Inspiron 17 7778
- 09/09/2016 v5.1 (old)
Sven Kloevekorn