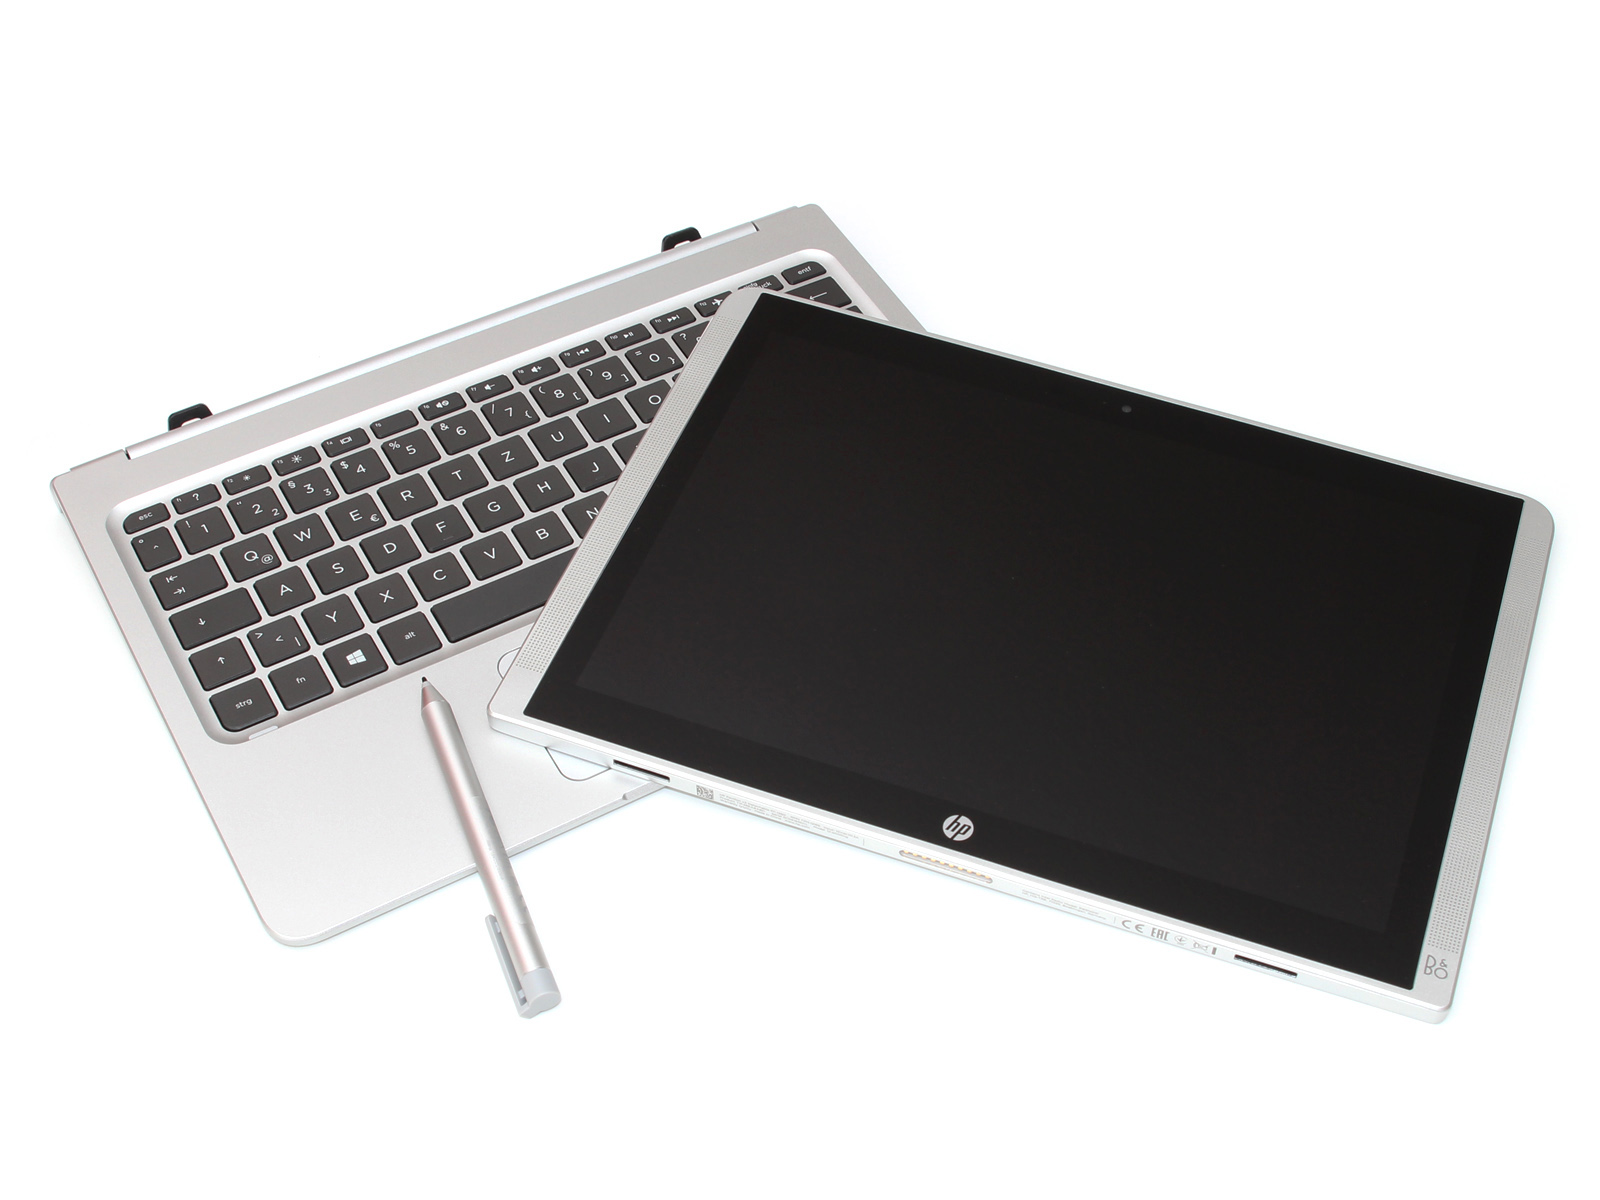
Breve análisis del Convertible HP Pavilion x2 12
| Networking | |
| iperf Server (receive) TCP 1 m | |
| Apple MacBook 12 (Early 2016) 1.1 GHz | |
| Lenovo IdeaPad MIIX 310-10ICR | |
| iperf Client (transmit) TCP 1 m | |
| Apple MacBook 12 (Early 2016) 1.1 GHz | |
| Lenovo IdeaPad MIIX 310-10ICR | |
| |||||||||||||||||||||||||
iluminación: 93 %
Brillo con batería: 314 cd/m²
Contraste: 654:1 (Negro: 0.48 cd/m²)
ΔE ColorChecker Calman: 6.12 | ∀{0.5-29.43 Ø4.72}
ΔE Greyscale Calman: 6.1 | ∀{0.09-98 Ø4.97}
71.74% sRGB (Argyll 1.6.3 3D)
46.81% AdobeRGB 1998 (Argyll 1.6.3 3D)
52.9% AdobeRGB 1998 (Argyll 3D)
72.4% sRGB (Argyll 3D)
53.2% Display P3 (Argyll 3D)
Gamma: 2.35
CCT: 7391 K
| HP Pavilion x2 12-b000ng LG Philips LGD04A5, IPS, 1920x1280, 12" | Microsoft Surface Pro 4, Core m3 Samsung SDC3853, IPS, 2736x1824, 12.3" | Acer Aspire Switch Alpha 12 SA5-271-56HM Panasonic VVX12T041N00, IPS, 2160x1440, 12" | Lenovo IdeaPad Miix 700 Samsung L_QLLTN120QL01L01, IPS, 2160x1440, 12" | Samsung Galaxy Tab Pro S W700N Digital Flat Panel (NoName), sAMOLED, 2160x1440, 12.1" | |
|---|---|---|---|---|---|
| Display | 30% | 27% | 32% | ||
| Display P3 Coverage (%) | 53.2 | 67.5 27% | 65.5 23% | 68.1 28% | |
| sRGB Coverage (%) | 72.4 | 96.6 33% | 96.1 33% | 97.4 35% | |
| AdobeRGB 1998 Coverage (%) | 52.9 | 69 30% | 66.9 26% | 70.2 33% | |
| Response Times | -18% | 11% | 31% | ||
| Response Time Grey 50% / Grey 80% * (ms) | 38 ? | 46 ? -21% | 20 ? 47% | 30 ? 21% | |
| Response Time Black / White * (ms) | 27 ? | 31 ? -15% | 34 ? -26% | 16 ? 41% | |
| PWM Frequency (Hz) | 50 ? | 1000 ? | 200 ? | ||
| Screen | 40% | 10% | 13% | 224% | |
| Brightness middle (cd/m²) | 314 | 389.2 24% | 345 10% | 341 9% | 363 16% |
| Brightness (cd/m²) | 308 | 392 27% | 328 6% | 318 3% | 378 23% |
| Brightness Distribution (%) | 93 | 92 -1% | 91 -2% | 87 -6% | 90 -3% |
| Black Level * (cd/m²) | 0.48 | 0.27 44% | 0.38 21% | 0.36 25% | 0.03 94% |
| Contrast (:1) | 654 | 1441 120% | 908 39% | 947 45% | 12100 1750% |
| Colorchecker dE 2000 * | 6.12 | 3.61 41% | 8.4 -37% | 6 2% | 4.8 22% |
| Colorchecker dE 2000 max. * | 10.92 | 11.9 -9% | 6.91 37% | ||
| Greyscale dE 2000 * | 6.1 | 3.8 38% | 4.3 30% | 8.12 -33% | 5.04 17% |
| Gamma | 2.35 94% | 2.16 102% | 2.63 84% | 2.23 99% | 2.57 86% |
| CCT | 7391 88% | 5969 109% | 7368 88% | 7011 93% | 7255 90% |
| Color Space (Percent of AdobeRGB 1998) (%) | 46.81 | 63 35% | 62 32% | 63.4 35% | 73 56% |
| Color Space (Percent of sRGB) (%) | 71.74 | 97 35% | 97.4 36% | ||
| Media total (Programa/Opciones) | 17% /
30% | 16% /
14% | 25% /
20% | 224% /
224% |
* ... más pequeño es mejor
Tiempos de respuesta del display
| ↔ Tiempo de respuesta de Negro a Blanco | ||
|---|---|---|
| 27 ms ... subida ↗ y bajada ↘ combinada | ↗ 14 ms subida | 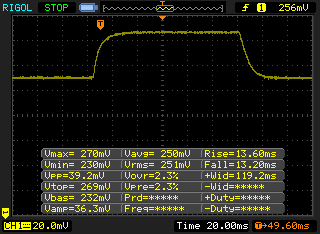 |
| ↘ 13 ms bajada | ||
| La pantalla mostró tiempos de respuesta relativamente lentos en nuestros tests pero podría ser demasiado lenta para los jugones. En comparación, todos los dispositivos de prueba van de ##min### (mínimo) a 240 (máximo) ms. » 67 % de todos los dispositivos son mejores. Eso quiere decir que el tiempo de respuesta es peor que la media (19.8 ms) de todos los dispositivos testados. | ||
| ↔ Tiempo de respuesta 50% Gris a 80% Gris | ||
| 38 ms ... subida ↗ y bajada ↘ combinada | ↗ 17 ms subida | 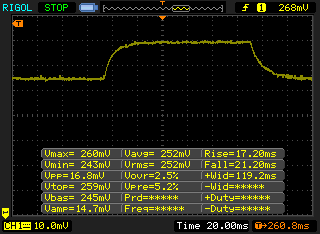 |
| ↘ 21 ms bajada | ||
| La pantalla mostró tiempos de respuesta lentos en nuestros tests y podría ser demasiado lenta para los jugones. En comparación, todos los dispositivos de prueba van de ##min### (mínimo) a 636 (máximo) ms. » 55 % de todos los dispositivos son mejores. Eso quiere decir que el tiempo de respuesta es peor que la media (31 ms) de todos los dispositivos testados. | ||
Parpadeo de Pantalla / PWM (Pulse-Width Modulation)
| Parpadeo de Pantalla / PWM no detectado | ||
Comparación: 52 % de todos los dispositivos testados no usaron PWM para atenuar el display. Si se usó, medimos una media de 7763 (mínimo: 5 - máxmo: 343500) Hz. | ||
| HP Pavilion x2 12-b000ng SanDisk Z400s SD8SNAT-128G | Microsoft Surface Pro 4, Core m3 Samsung MZFLV128 NVMe | Acer Aspire Switch Alpha 12 SA5-271-56HM Kingston RBU-SNS8152S3256GG2 | Lenovo IdeaPad Miix 700 Samsung MZNLN128HCGR-000L2 | Apple MacBook 12 (Early 2016) 1.1 GHz Apple SSD AP0256 | |
|---|---|---|---|---|---|
| CrystalDiskMark 3.0 | 22% | 35% | 45% | 123% | |
| Read Seq (MB/s) | 477.3 | 663 39% | 518 9% | 497.9 4% | 754 58% |
| Write Seq (MB/s) | 184.3 | 158.2 -14% | 199.9 8% | 153.5 -17% | 638 246% |
| Read 512 (MB/s) | 226.2 | 313.1 38% | 374.9 66% | 401.2 77% | 616 172% |
| Write 512 (MB/s) | 176.2 | 158.2 -10% | 201 14% | 154.5 -12% | 678 285% |
| Read 4k (MB/s) | 21.12 | 30.14 43% | 29.3 39% | 36.2 71% | 14.6 -31% |
| Write 4k (MB/s) | 57.9 | 68 17% | 76.8 33% | 95.5 65% | 20.5 -65% |
| Read 4k QD32 (MB/s) | 136.4 | 243.7 79% | 272 99% | 389.5 186% | 464 240% |
| Write 4k QD32 (MB/s) | 173.2 | 149.2 -14% | 197.1 14% | 154 -11% | 315 82% |

| PCMark 7 Score | 4275 puntos | |
| PCMark 8 Home Score Accelerated v2 | 2831 puntos | |
| PCMark 8 Creative Score Accelerated v2 | 3198 puntos | |
| PCMark 8 Work Score Accelerated v2 | 3773 puntos | |
ayuda | ||
| 3DMark 11 - 1280x720 Performance GPU | |
| Acer Aspire Switch Alpha 12 SA5-271-56HM | |
| Microsoft Surface Pro 4, Core m3 | |
| HP Pavilion x2 12-b000ng | |
| Lenovo IdeaPad Miix 700 | |
| Samsung Galaxy Tab Pro S W700N | |
| 3DMark | |
| 1280x720 Cloud Gate Standard Graphics | |
| Acer Aspire Switch Alpha 12 SA5-271-56HM | |
| Microsoft Surface Pro 4, Core m3 | |
| HP Pavilion x2 12-b000ng | |
| Lenovo IdeaPad Miix 700 | |
| Samsung Galaxy Tab Pro S W700N | |
| 1920x1080 Fire Strike Graphics | |
| Microsoft Surface Pro 4, Core m3 | |
| HP Pavilion x2 12-b000ng | |
| Lenovo IdeaPad Miix 700 | |
| Samsung Galaxy Tab Pro S W700N | |
| 3DMark 06 Standard Score | 7530 puntos | |
| 3DMark 11 Performance | 1260 puntos | |
| 3DMark Ice Storm Standard Score | 41366 puntos | |
| 3DMark Cloud Gate Standard Score | 4330 puntos | |
| 3DMark Fire Strike Score | 671 puntos | |
ayuda | ||
| bajo | medio | alto | ultra | |
|---|---|---|---|---|
| BioShock Infinite (2013) | 48 | 23.8 | 21.9 | |
| Battlefield 4 (2013) | 34.3 | 23.2 | 15.2 | |
| Dirt Rally (2015) | 57.8 | 16 | 12.5 |
(-) La temperatura máxima en la parte superior es de 49.6 °C / 121 F, frente a la media de 35.4 °C / 96 F, que oscila entre 19.6 y 60 °C para la clase Convertible.
(-) El fondo se calienta hasta un máximo de 46.5 °C / 116 F, frente a la media de 36.9 °C / 98 F
(+) En reposo, la temperatura media de la parte superior es de 31.6 °C / 89# F, frente a la media del dispositivo de 30.3 °C / 87 F.
(-) El reposamanos y el touchpad pueden calentarse mucho al tacto con un máximo de 44.1 °C / 111.4 F.
(-) La temperatura media de la zona del reposamanos de dispositivos similares fue de 28 °C / 82.4 F (-16.1 °C / -29 F).
HP Pavilion x2 12-b000ng análisis de audio
(±) | la sonoridad del altavoz es media pero buena (74 dB)
Graves 100 - 315 Hz
(-) | casi sin bajos - de media 20.3% inferior a la mediana
(±) | la linealidad de los graves es media (12.5% delta a frecuencia anterior)
Medios 400 - 2000 Hz
(±) | medias más altas - de media 5.4% más altas que la mediana
(±) | la linealidad de los medios es media (12.8% delta respecto a la frecuencia anterior)
Altos 2 - 16 kHz
(+) | máximos equilibrados - a sólo 3.4% de la mediana
(±) | la linealidad de los máximos es media (9.3% delta a frecuencia anterior)
Total 100 - 16.000 Hz
(±) | la linealidad del sonido global es media (27.6% de diferencia con la mediana)
En comparación con la misma clase
» 84% de todos los dispositivos probados de esta clase eran mejores, 3% similares, 13% peores
» El mejor tuvo un delta de 6%, la media fue 20%, el peor fue ###max##%
En comparación con todos los dispositivos probados
» 84% de todos los dispositivos probados eran mejores, 3% similares, 13% peores
» El mejor tuvo un delta de 4%, la media fue 23%, el peor fue ###max##%
Apple MacBook 12 (Early 2016) 1.1 GHz análisis de audio
(+) | los altavoces pueden reproducir a un volumen relativamente alto (#83.6 dB)
Graves 100 - 315 Hz
(±) | lubina reducida - en promedio 11.3% inferior a la mediana
(±) | la linealidad de los graves es media (14.2% delta a frecuencia anterior)
Medios 400 - 2000 Hz
(+) | medios equilibrados - a sólo 2.4% de la mediana
(+) | los medios son lineales (5.5% delta a la frecuencia anterior)
Altos 2 - 16 kHz
(+) | máximos equilibrados - a sólo 2% de la mediana
(+) | los máximos son lineales (4.5% delta a la frecuencia anterior)
Total 100 - 16.000 Hz
(+) | el sonido global es lineal (10.2% de diferencia con la mediana)
En comparación con la misma clase
» 7% de todos los dispositivos probados de esta clase eran mejores, 2% similares, 91% peores
» El mejor tuvo un delta de 5%, la media fue 18%, el peor fue ###max##%
En comparación con todos los dispositivos probados
» 5% de todos los dispositivos probados eran mejores, 1% similares, 94% peores
» El mejor tuvo un delta de 4%, la media fue 23%, el peor fue ###max##%
| Off / Standby | |
| Ocioso | |
| Carga |
|
Clave:
min: | |
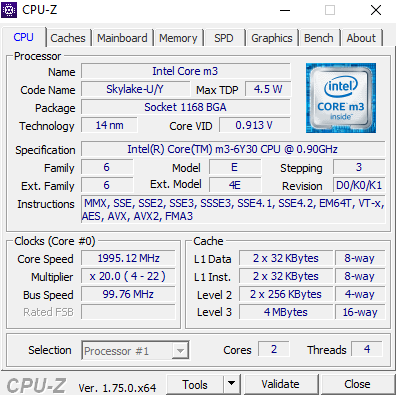
| HP Pavilion x2 12-b000ng 6Y30, HD Graphics 515, SanDisk Z400s SD8SNAT-128G, IPS, 1920x1280, 12" | Acer Aspire Switch Alpha 12 SA5-271-56HM 6200U, HD Graphics 520, Kingston RBU-SNS8152S3256GG2, IPS, 2160x1440, 12" | Lenovo IdeaPad Miix 700 6Y54, HD Graphics 515, Samsung MZNLN128HCGR-000L2, IPS, 2160x1440, 12" | Apple MacBook 12 (Early 2016) 1.1 GHz 6Y30, HD Graphics 515, Apple SSD AP0256, IPS, 2304x1440, 12" | Samsung Galaxy Tab Pro S W700N 6Y30, HD Graphics 515, Lite-On CV1-8B128, sAMOLED, 2160x1440, 12.1" | |
|---|---|---|---|---|---|
| Power Consumption | -26% | -9% | 27% | 21% | |
| Idle Minimum * (Watt) | 5.3 | 7.3 -38% | 4 25% | 2.7 49% | 3.4 36% |
| Idle Average * (Watt) | 8.2 | 10 -22% | 8.6 -5% | 2.7 67% | 8 2% |
| Idle Maximum * (Watt) | 9 | 10.15 -13% | 9.3 -3% | 7.2 20% | 9 -0% |
| Load Average * (Watt) | 20.7 | 25.2 -22% | 18.6 10% | 22 -6% | 12 42% |
| Load Maximum * (Watt) | 21.4 | 29.3 -37% | 36.3 -70% | 20.5 4% | 16.1 25% |
* ... más pequeño es mejor
| HP Pavilion x2 12-b000ng 6Y30, HD Graphics 515, 33 Wh | Microsoft Surface Pro 4, Core m3 6Y30, HD Graphics 515, 38 Wh | Acer Aspire Switch Alpha 12 SA5-271-56HM 6200U, HD Graphics 520, 37 Wh | Lenovo IdeaPad Miix 700 6Y54, HD Graphics 515, 41 Wh | Apple MacBook 12 (Early 2016) 1.1 GHz 6Y30, HD Graphics 515, 41.4 Wh | Samsung Galaxy Tab Pro S W700N 6Y30, HD Graphics 515, 39.5 Wh | |
|---|---|---|---|---|---|---|
| Duración de Batería | 55% | 26% | 56% | 85% | 94% | |
| Reader / Idle (h) | 7.9 | 13.2 67% | 10.7 35% | 14.4 82% | 18.5 134% | |
| H.264 (h) | 5.2 | 7.8 50% | 7.5 44% | 8.5 63% | 8.6 65% | |
| WiFi v1.3 (h) | 4.8 | 8.1 69% | 5.4 13% | 7.3 52% | 8.4 75% | 8.8 83% |
| Load (h) | 1.8 | 2.3 28% | 1.9 6% | 2.6 44% | 3.9 117% |
Pro
Contra
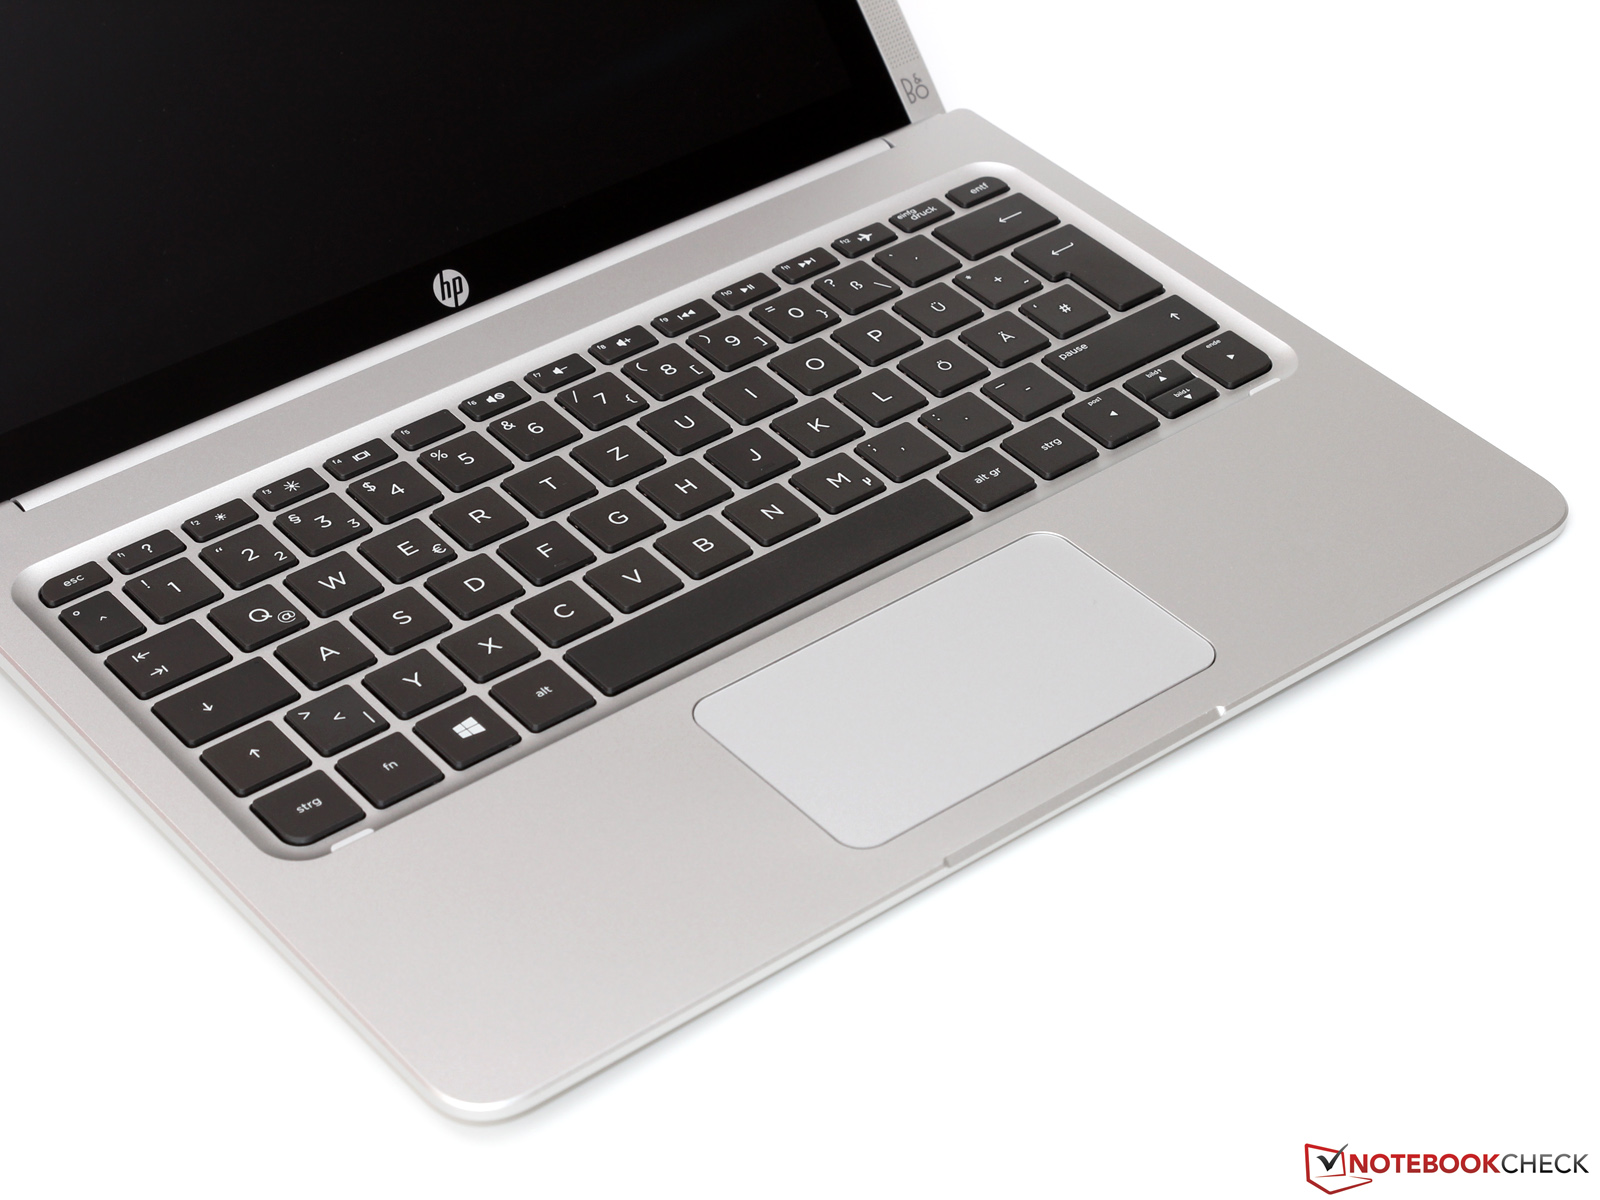
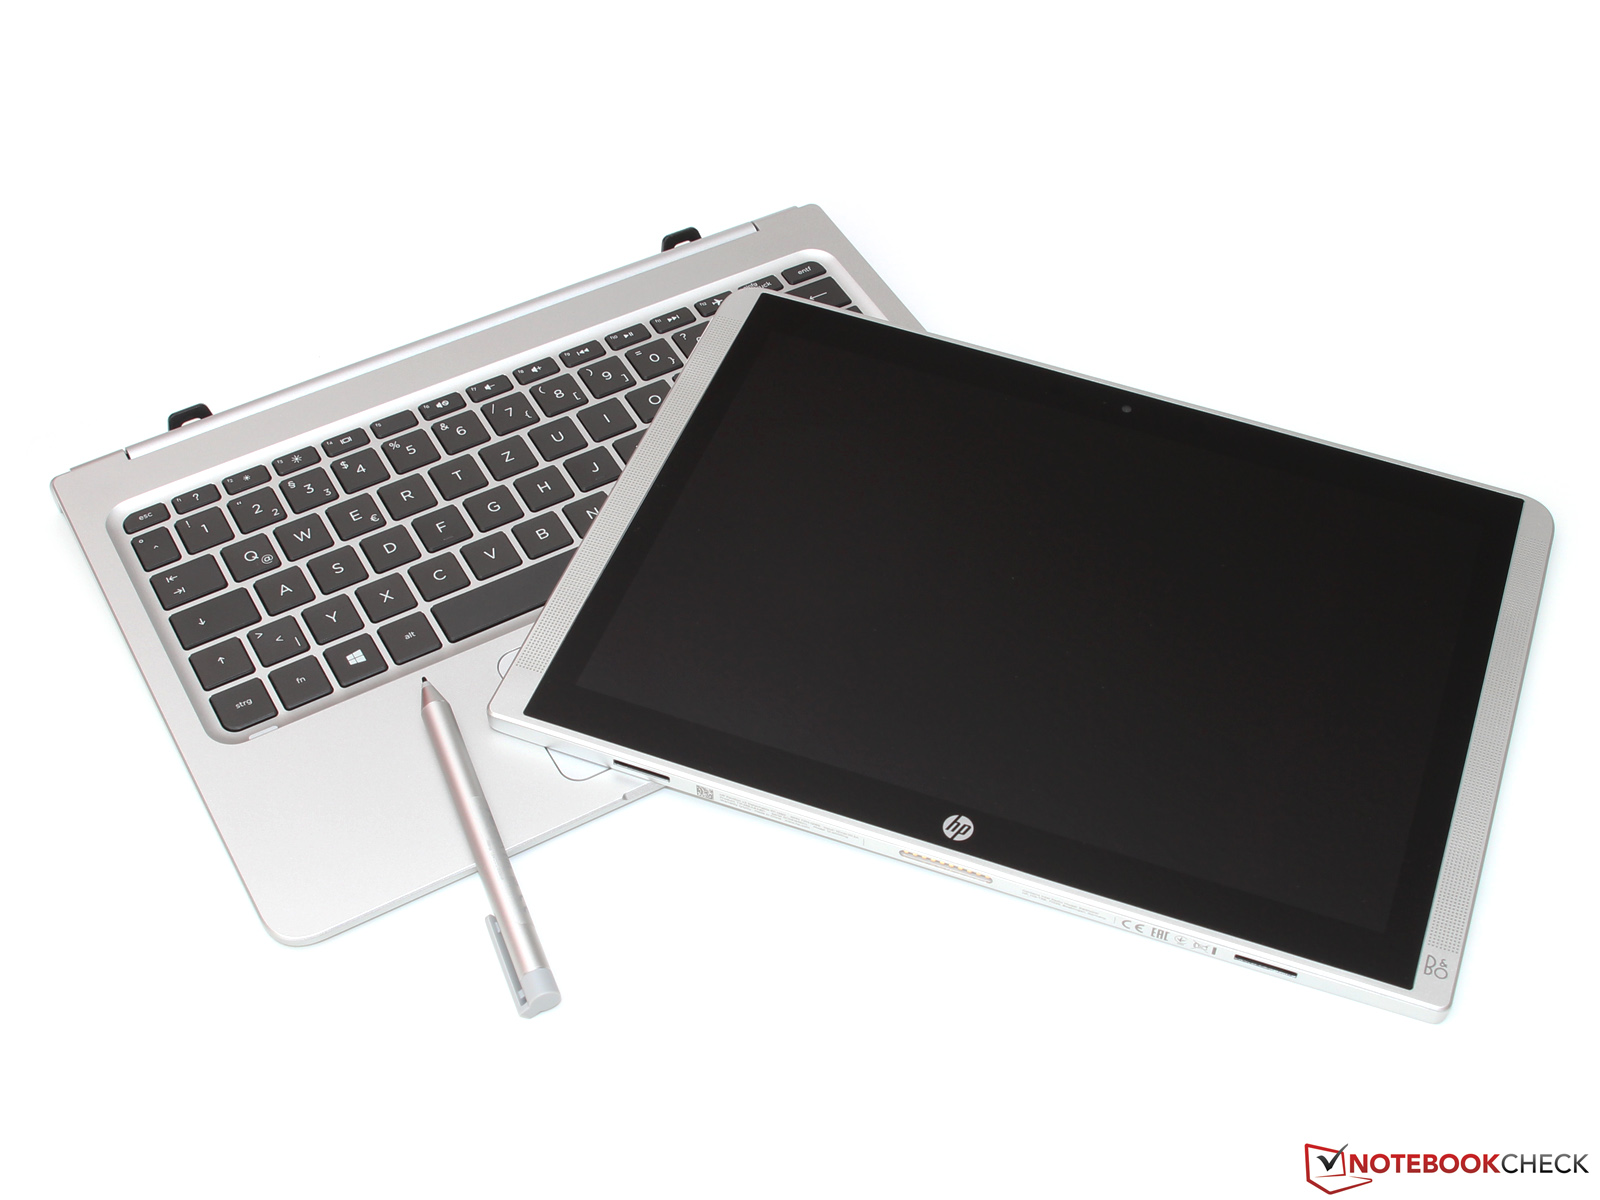
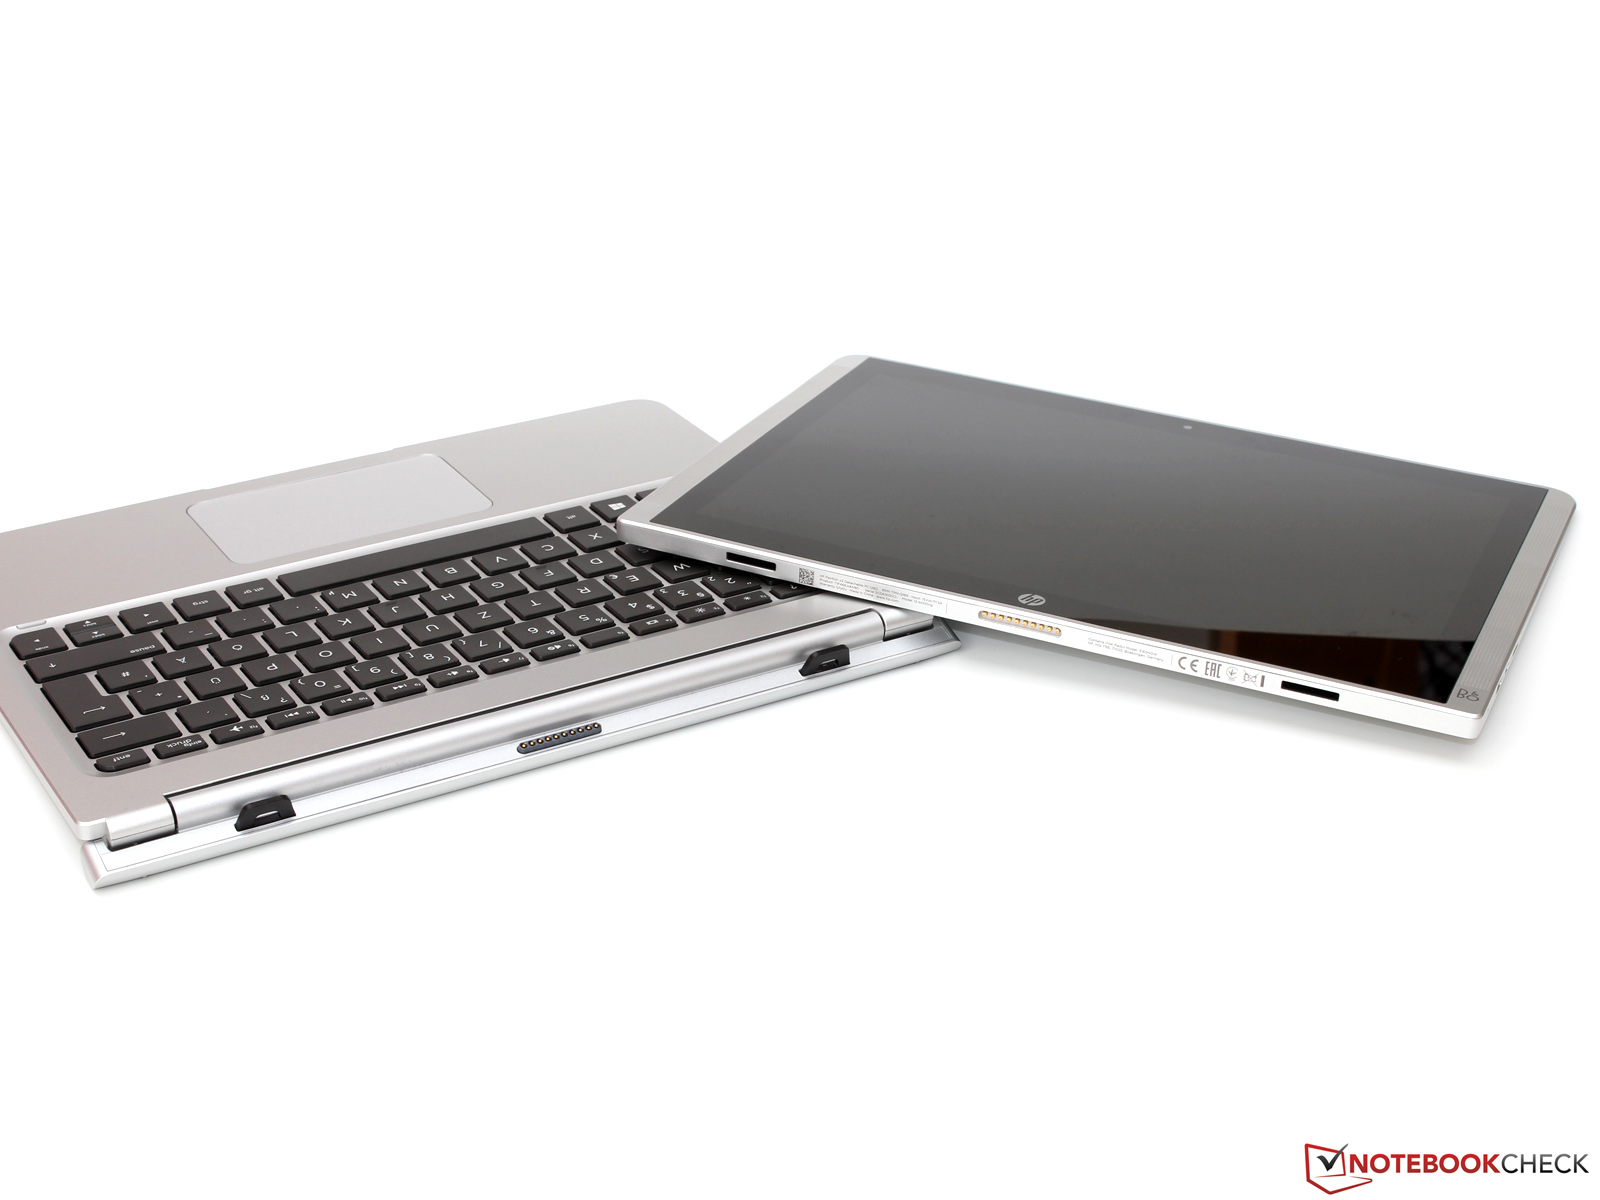
El HP Pavilion x2 12-b000ng es un portátil 2-en-1 relativamente económico, que sigue pudiendo competir con los rivales más caros en muchos aspectos. Puntos fuertes del convertible son la bisagra del display, un teclado firme y un uso perfecto del Turbo Boost del procesador Core-m. El display tampoco es malo, aunque algunos rivales tienen resoluciones más altas. También es uno de los pocos dispositivos en este segmento sin parpadeo por PWM.
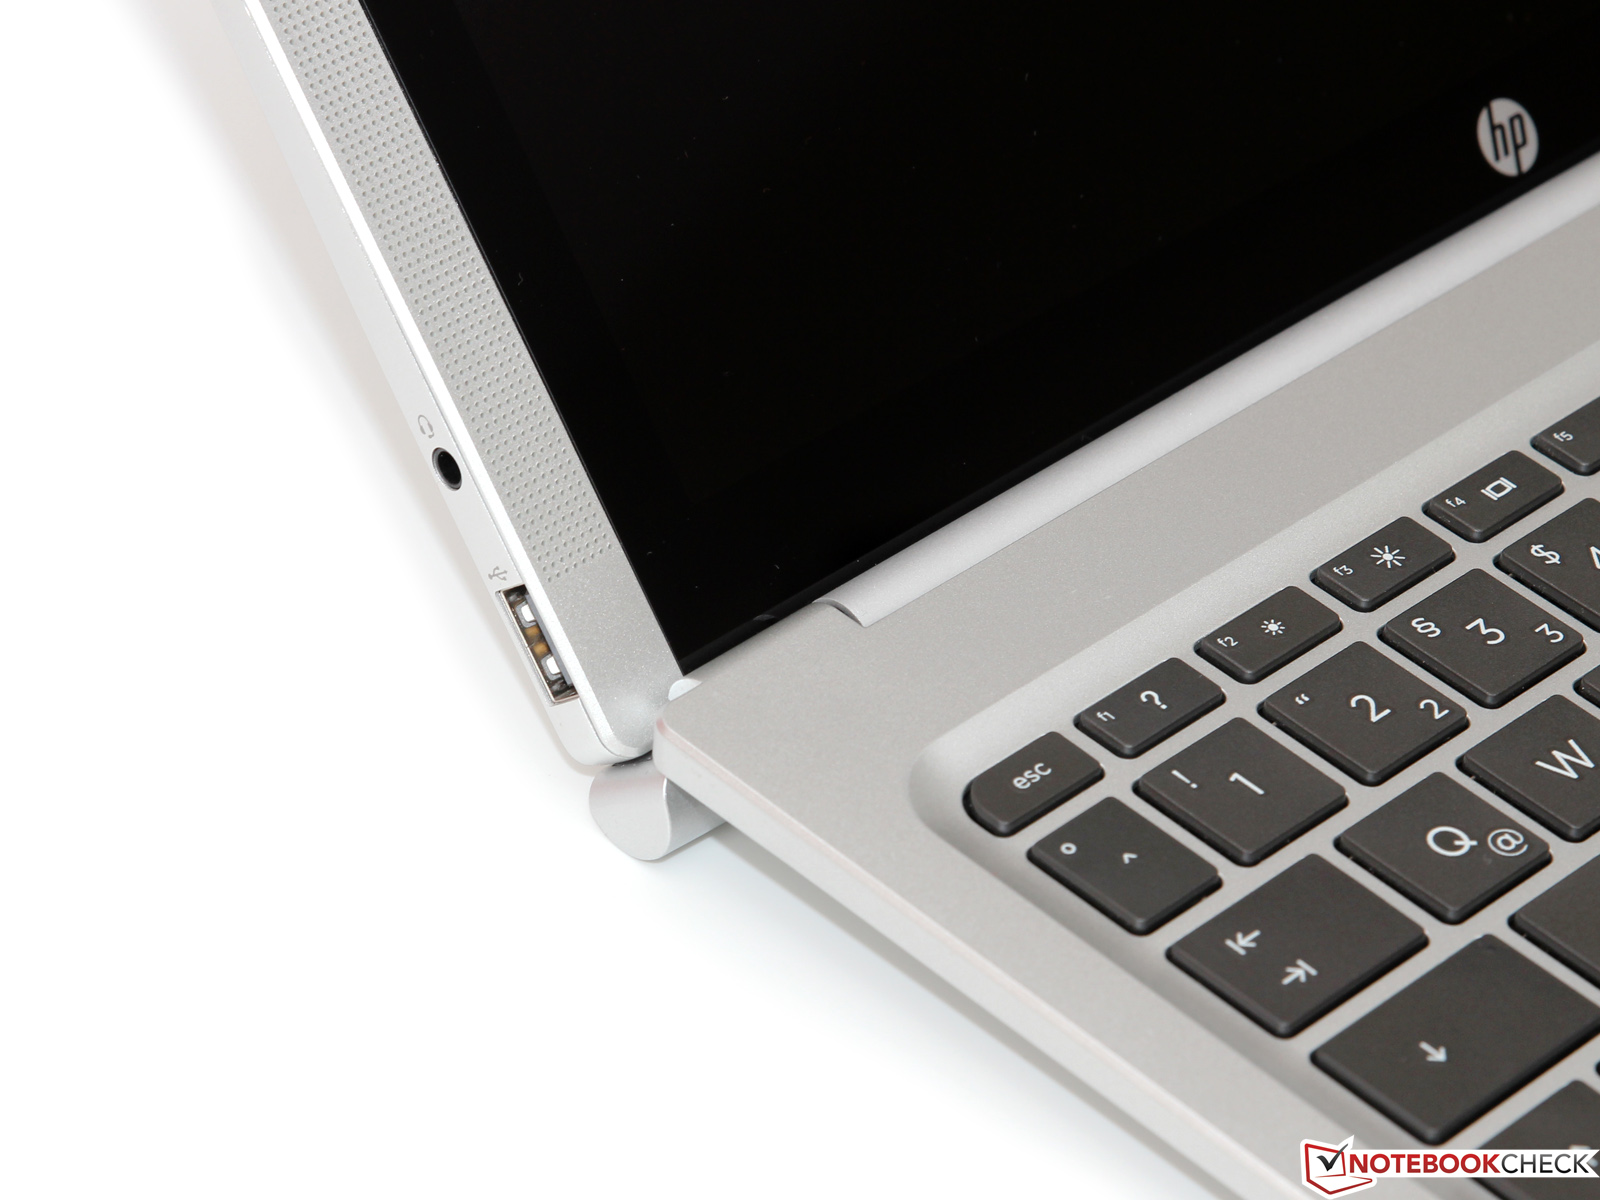
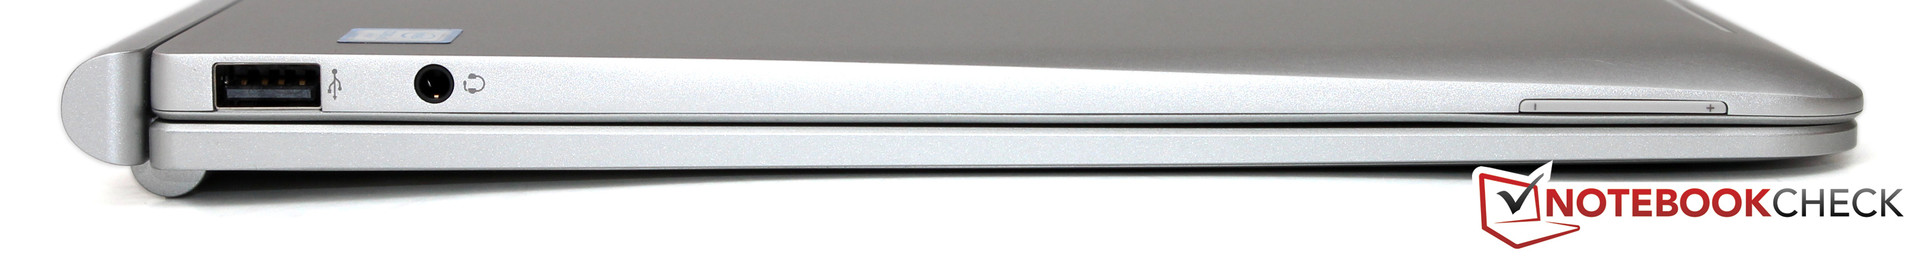
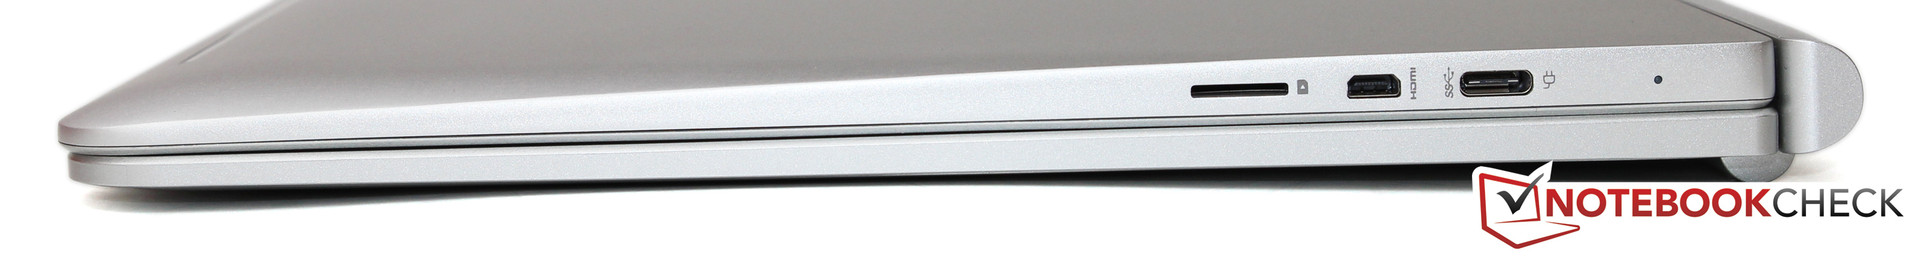
Encontramos algunos problemas durante este análisis, que afectan ligeramente a la impresión general. Si bien puedes seguir viviendo con la memoria limitada así como con la falta de un modelo LTE dado el precio, la magra selección de puertos – ni siquiera tiene un puerto USB 3.0 Type-A – es un fallo de diseño bastante molesto. Una capacidad de batería muy superior, quizá realizado con una batería secundaria dentro del teclado anclable, habría estado bien para el sistema en general.
Con todo, el Pavilion x2 12 sigue siendo una oferta justa por unos 700 Euros – pero el rendimiento no es lo bastante bueno para derrotar al caro Microsoft Surface Pro 4.
Ésta es una versión acortada del análisis original. Puedes leer el análisis completo en inglés aquí.
HP Pavilion x2 12-b000ng
- 08/20/2016 v5.1 (old)
Till Schönborn
Price comparison
