Breve análisis del Convertible HP Pavilion x360 13-u102ng
| SD Card Reader | |
| average JPG Copy Test (av. of 3 runs) | |
| HP Pavilion x360 13-u102ng | |
| Lenovo Yoga 510-14IKB | |
| Asus VivoBook Flip TP301UA-DW006T | |
| Dell Inspiron 13 5368 | |
| Acer Aspire R13 R7-372T-746N | |
| maximum AS SSD Seq Read Test (1GB) | |
| HP Pavilion x360 13-u102ng | |
| Lenovo Yoga 510-14IKB | |
| Asus VivoBook Flip TP301UA-DW006T | |
| Acer Aspire R13 R7-372T-746N | |
| Dell Inspiron 13 5368 | |
| Networking | |
| iperf Server (receive) TCP 1 m | |
| Asus VivoBook Flip TP301UA-DW006T (Seb) | |
| Dell Inspiron 13 5368 (Seb) | |
| Lenovo Yoga 510-14IKB | |
| HP Pavilion x360 13-u102ng (jseb) | |
| iperf Client (transmit) TCP 1 m | |
| Asus VivoBook Flip TP301UA-DW006T (Seb) | |
| Dell Inspiron 13 5368 (Seb) | |
| Lenovo Yoga 510-14IKB | |
| HP Pavilion x360 13-u102ng (jseb) | |
| |||||||||||||||||||||||||
iluminación: 88 %
Brillo con batería: 277 cd/m²
Contraste: 894:1 (Negro: 0.31 cd/m²)
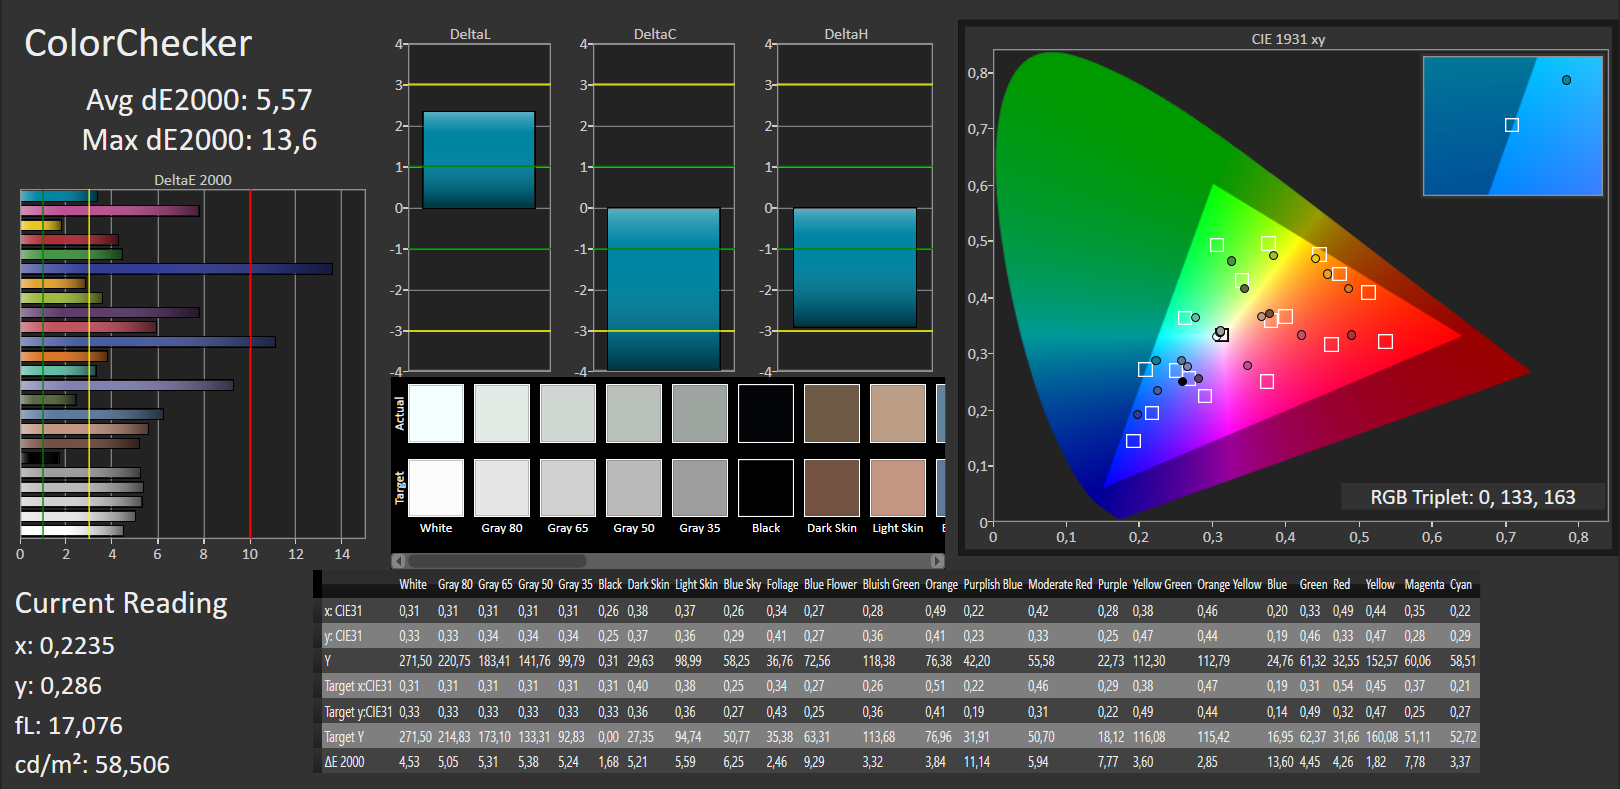
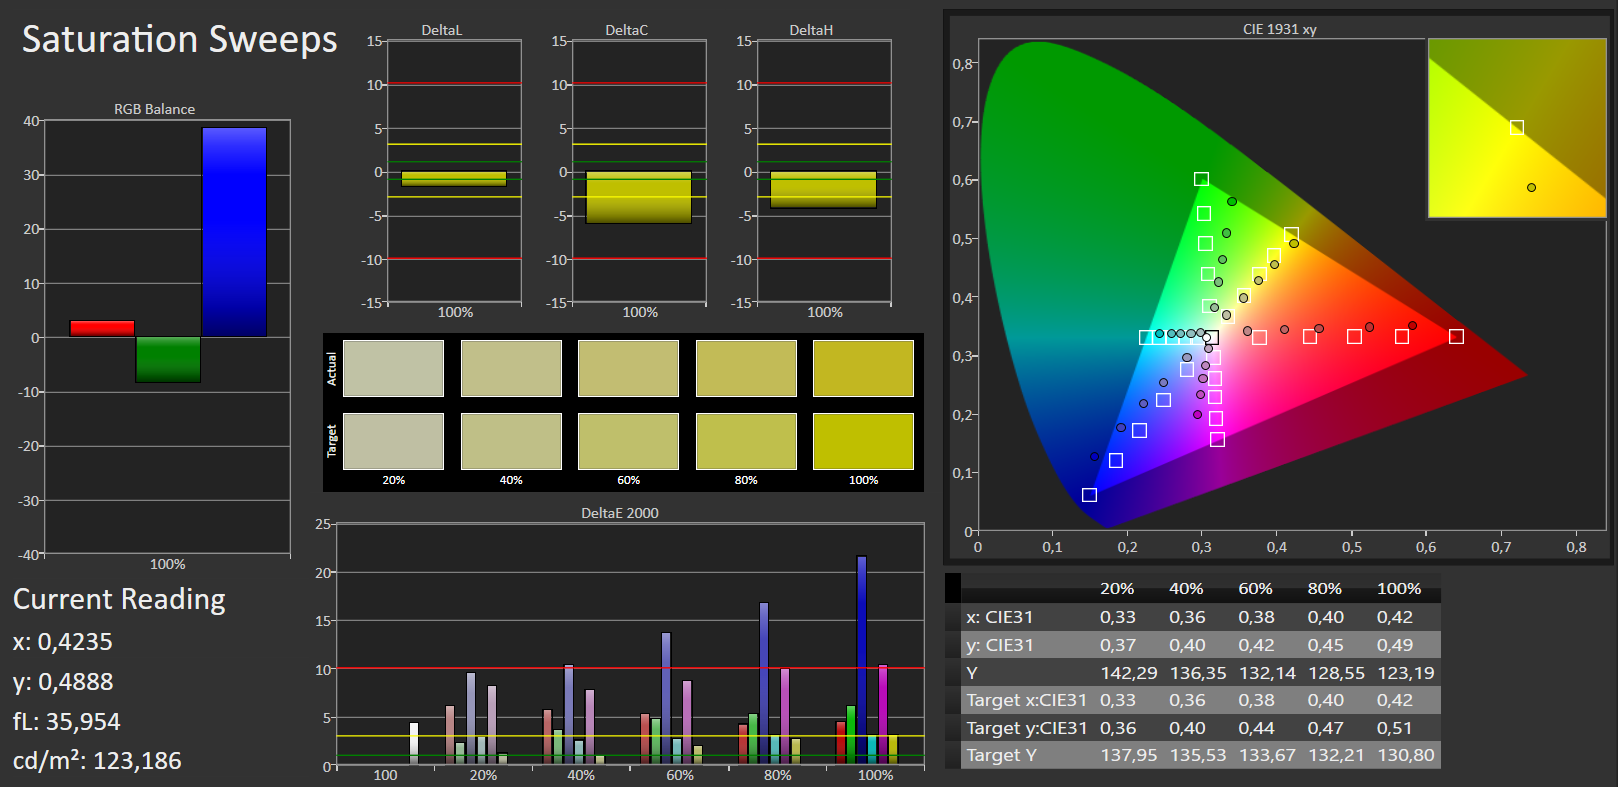
ΔE ColorChecker Calman: 5.57 | ∀{0.5-29.43 Ø4.73}
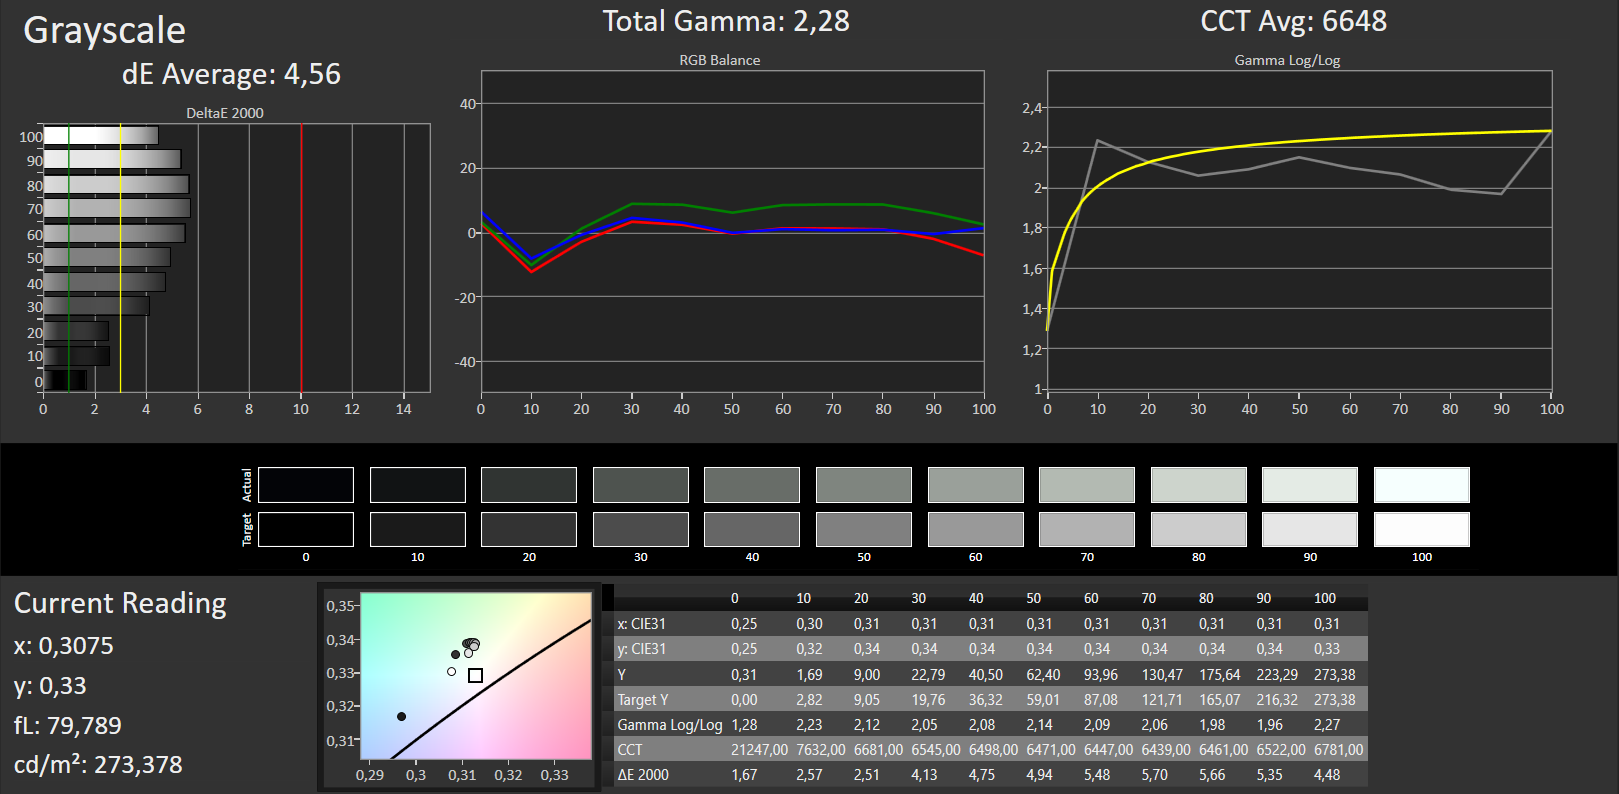
ΔE Greyscale Calman: 4.56 | ∀{0.09-98 Ø4.97}
59% sRGB (Argyll 1.6.3 3D)
38% AdobeRGB 1998 (Argyll 1.6.3 3D)
40.76% AdobeRGB 1998 (Argyll 3D)
59.1% sRGB (Argyll 3D)
39.43% Display P3 (Argyll 3D)
Gamma: 2.28
CCT: 6648 K
| HP Pavilion x360 13-u102ng IPS, 1920x1080, 13.3" | Asus VivoBook Flip TP301UA-DW006T TN, 1920x1080, 13.3" | Dell Inspiron 13 5368 IPS, 1920x1080, 13.3" | Acer Aspire R13 R7-372T-746N IPS, 2560x1440, 13.3" | Lenovo Yoga 510-14IKB IPS, 1920x1080, 14" | |
|---|---|---|---|---|---|
| Display | 6% | -1% | 72% | 6% | |
| Display P3 Coverage (%) | 39.43 | 41.63 6% | 38.88 -1% | 69.6 77% | 41.78 6% |
| sRGB Coverage (%) | 59.1 | 62.6 6% | 57.7 -2% | 98 66% | 62.9 6% |
| AdobeRGB 1998 Coverage (%) | 40.76 | 43.02 6% | 40.17 -1% | 70.7 73% | 43.17 6% |
| Response Times | 32% | -20% | -8% | -48% | |
| Response Time Grey 50% / Grey 80% * (ms) | 38 ? | 38 ? -0% | 44 ? -16% | 36 ? 5% | 53 ? -39% |
| Response Time Black / White * (ms) | 25 ? | 9 ? 64% | 31 ? -24% | 30 ? -20% | 39 ? -56% |
| PWM Frequency (Hz) | 50 ? | 1000 ? | 350 ? | ||
| Screen | -7% | 6% | 41% | 0% | |
| Brightness middle (cd/m²) | 277 | 166 -40% | 240 -13% | 320 16% | 243 -12% |
| Brightness (cd/m²) | 263 | 165 -37% | 229 -13% | 308 17% | 248 -6% |
| Brightness Distribution (%) | 88 | 90 2% | 92 5% | 91 3% | 91 3% |
| Black Level * (cd/m²) | 0.31 | 0.44 -42% | 0.24 23% | 0.17 45% | 0.32 -3% |
| Contrast (:1) | 894 | 377 -58% | 1000 12% | 1882 111% | 759 -15% |
| Colorchecker dE 2000 * | 5.57 | 4.07 27% | 4.75 15% | 3.18 43% | 5.44 2% |
| Colorchecker dE 2000 max. * | 13.6 | 6.38 53% | 9.09 33% | 9.91 27% | 9.73 28% |
| Greyscale dE 2000 * | 4.56 | 3.99 12% | 4.3 6% | 4.13 9% | 4.74 -4% |
| Gamma | 2.28 96% | 2.49 88% | 2.5 88% | 2.03 108% | 2.38 92% |
| CCT | 6648 98% | 7491 87% | 5893 110% | 6752 96% | 7799 83% |
| Color Space (Percent of AdobeRGB 1998) (%) | 38 | 40 5% | 36.79 -3% | 65 71% | 39.6 4% |
| Color Space (Percent of sRGB) (%) | 59 | 63 7% | 57.39 -3% | 98 66% | 62.5 6% |
| Media total (Programa/Opciones) | 10% /
1% | -5% /
1% | 35% /
41% | -14% /
-5% |
* ... más pequeño es mejor
Parpadeo de Pantalla / PWM (Pulse-Width Modulation)
| Parpadeo de Pantalla / PWM no detectado | ||
Comparación: 52 % de todos los dispositivos testados no usaron PWM para atenuar el display. Si se usó, medimos una media de 7794 (mínimo: 5 - máxmo: 343500) Hz. | ||
Tiempos de respuesta del display
| ↔ Tiempo de respuesta de Negro a Blanco | ||
|---|---|---|
| 25 ms ... subida ↗ y bajada ↘ combinada | ↗ 6 ms subida | 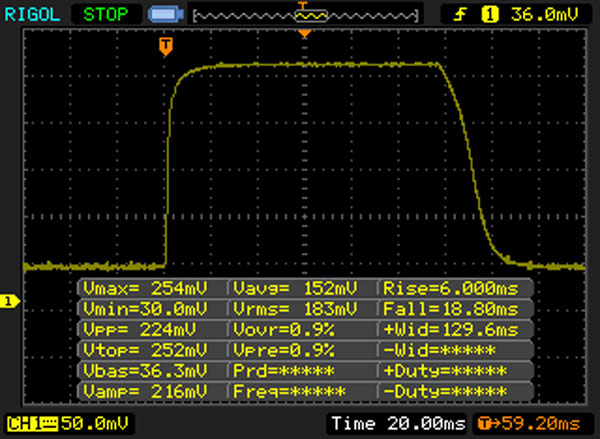 |
| ↘ 19 ms bajada | ||
| La pantalla mostró tiempos de respuesta relativamente lentos en nuestros tests pero podría ser demasiado lenta para los jugones. En comparación, todos los dispositivos de prueba van de ##min### (mínimo) a 240 (máximo) ms. » 59 % de todos los dispositivos son mejores. Eso quiere decir que el tiempo de respuesta es peor que la media (19.9 ms) de todos los dispositivos testados. | ||
| ↔ Tiempo de respuesta 50% Gris a 80% Gris | ||
| 38 ms ... subida ↗ y bajada ↘ combinada | ↗ 14 ms subida | 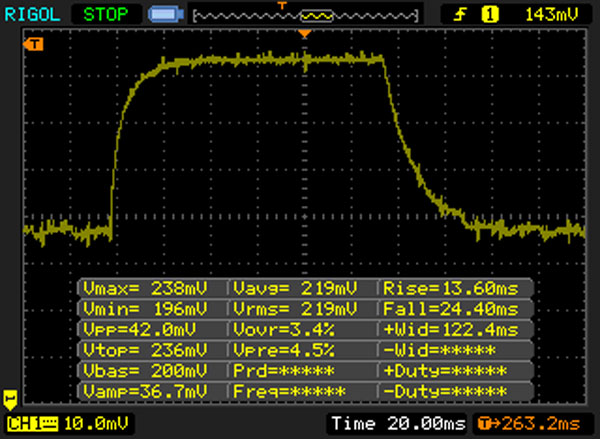 |
| ↘ 24 ms bajada | ||
| La pantalla mostró tiempos de respuesta lentos en nuestros tests y podría ser demasiado lenta para los jugones. En comparación, todos los dispositivos de prueba van de ##min### (mínimo) a 636 (máximo) ms. » 55 % de todos los dispositivos son mejores. Eso quiere decir que el tiempo de respuesta es peor que la media (31.1 ms) de todos los dispositivos testados. | ||
| Cinebench R10 | |
| Rendering Multiple CPUs 32Bit | |
| HP Pavilion x360 13-u102ng | |
| Acer Aspire R13 R7-372T-746N | |
| Rendering Single 32Bit | |
| HP Pavilion x360 13-u102ng | |
| Acer Aspire R13 R7-372T-746N | |
| Geekbench 3 | |
| 32 Bit Single-Core Score | |
| Acer Aspire R13 R7-372T-746N | |
| HP Pavilion x360 13-u102ng | |
| 32 Bit Multi-Core Score | |
| Acer Aspire R13 R7-372T-746N | |
| HP Pavilion x360 13-u102ng | |
| Geekbench 4.0 | |
| 64 Bit Single-Core Score | |
| HP Pavilion x360 13-u102ng | |
| 64 Bit Multi-Core Score | |
| HP Pavilion x360 13-u102ng | |
| JetStream 1.1 - 1.1 Total | |
| Acer Aspire R13 R7-372T-746N | |
| HP Pavilion x360 13-u102ng | |
| Dell Inspiron 13 5368 | |
| Asus VivoBook Flip TP301UA-DW006T | |
| PCMark 7 Score | 3227 puntos | |
| PCMark 8 Home Score Accelerated v2 | 3274 puntos | |
| PCMark 8 Creative Score Accelerated v2 | 3806 puntos | |
| PCMark 8 Work Score Accelerated v2 | 4050 puntos | |
ayuda | ||
| PCMark 8 | |
| Home Score Accelerated v2 | |
| Dell Inspiron 13 5368 | |
| Lenovo Yoga 510-14IKB | |
| HP Pavilion x360 13-u102ng | |
| Acer Aspire R13 R7-372T-746N | |
| Asus VivoBook Flip TP301UA-DW006T | |
| Work Score Accelerated v2 | |
| Dell Inspiron 13 5368 | |
| Asus VivoBook Flip TP301UA-DW006T | |
| HP Pavilion x360 13-u102ng | |
| Acer Aspire R13 R7-372T-746N | |

| HP Pavilion x360 13-u102ng HGST Travelstar 5K1000 HTS541010A7E630 | Asus VivoBook Flip TP301UA-DW006T Samsung CM871 MZ7LF128HCHP | Dell Inspiron 13 5368 Toshiba THNSNK256GCS8 | Acer Aspire R13 R7-372T-746N Lite-On CV1-8B256 | Lenovo Yoga 510-14IKB Samsung MZYTY256HDHP | |
|---|---|---|---|---|---|
| CrystalDiskMark 3.0 | 1925% | 9303% | 9785% | 11295% | |
| Read Seq (MB/s) | 104.8 | 396 278% | 479 357% | 507 384% | 518 394% |
| Write Seq (MB/s) | 91 | 133.5 47% | 270.1 197% | 354.4 289% | 476.5 424% |
| Read 512 (MB/s) | 20.67 | 259.5 1155% | 428.3 1972% | 355.3 1619% | 408 1874% |
| Write 512 (MB/s) | 45.05 | 23.86 -47% | 267.9 495% | 353.9 686% | 274.5 509% |
| Read 4k (MB/s) | 0.215 | 5.783 2590% | 23.77 10956% | 32.66 15091% | 35.66 16486% |
| Write 4k (MB/s) | 1.037 | 8.507 720% | 81.4 7750% | 81.6 7769% | 106.7 10189% |
| Read 4k QD32 (MB/s) | 0.968 | 97.5 9972% | 333.6 34363% | 277.6 28578% | 368.7 37989% |
| Write 4k QD32 (MB/s) | 1.09 | 8.515 681% | 200.9 18331% | 261.2 23863% | 246.3 22496% |
| 3DMark 06 Standard Score | 8117 puntos | |
| 3DMark 11 Performance | 1509 puntos | |
| 3DMark Ice Storm Standard Score | 48460 puntos | |
| 3DMark Cloud Gate Standard Score | 5429 puntos | |
| 3DMark Fire Strike Score | 708 puntos | |
ayuda | ||
| 3DMark 11 - 1280x720 Performance GPU | |
| Lenovo Yoga 510-14IKB | |
| Dell Inspiron 13 5368 | |
| Acer Aspire R13 R7-372T-746N | |
| HP Pavilion x360 13-u102ng | |
| Asus VivoBook Flip TP301UA-DW006T | |
| 3DMark | |
| 1280x720 Cloud Gate Standard Graphics | |
| Dell Inspiron 13 5368 | |
| Acer Aspire R13 R7-372T-746N | |
| HP Pavilion x360 13-u102ng | |
| Lenovo Yoga 510-14IKB | |
| Asus VivoBook Flip TP301UA-DW006T | |
| 1920x1080 Fire Strike Graphics | |
| Lenovo Yoga 510-14IKB | |
| Acer Aspire R13 R7-372T-746N | |
| HP Pavilion x360 13-u102ng | |
| bajo | medio | alto | ultra | |
|---|---|---|---|---|
| Tomb Raider (2013) | 62.1 | 32.3 | 19.4 | 9.6 |
| BioShock Infinite (2013) | 38.6 | 24.4 | 20.1 | 7.1 |
| Battlefield 4 (2013) | 34.9 | 25 | 16.3 | 6.2 |
| Watch Dogs 2 (2016) | 13.8 | 11.7 |
Ruido
| Ocioso |
| 31.3 / 31.3 / 31.6 dB(A) |
| HDD |
| 31.7 dB(A) |
| Carga |
| 34.2 / 37.3 dB(A) |
 | ||
30 dB silencioso 40 dB(A) audible 50 dB(A) ruidosamente alto |
||
min: | ||
| HP Pavilion x360 13-u102ng i5-7200U, HD Graphics 620 | Asus VivoBook Flip TP301UA-DW006T 6100U, HD Graphics 520 | Dell Inspiron 13 5368 6500U, HD Graphics 520 | Acer Aspire R13 R7-372T-746N 6500U, HD Graphics 520 | Lenovo Yoga 510-14IKB i5-7200U, Radeon R5 M430 | |
|---|---|---|---|---|---|
| Noise | -0% | 5% | -4% | 0% | |
| apagado / medio ambiente * (dB) | 30.5 | 31 -2% | 29 5% | 31.3 -3% | 29 5% |
| Idle Minimum * (dB) | 31.3 | 31.3 -0% | 29 7% | 31.3 -0% | 29 7% |
| Idle Average * (dB) | 31.3 | 31.3 -0% | 29 7% | 31.3 -0% | 29 7% |
| Idle Maximum * (dB) | 31.6 | 32.9 -4% | 29 8% | 31.8 -1% | 29 8% |
| Load Average * (dB) | 34.2 | 35 -2% | 31 9% | 39.2 -15% | 37.3 -9% |
| Load Maximum * (dB) | 37.3 | 34.9 6% | 40.3 -8% | 39.1 -5% | 43.1 -16% |
* ... más pequeño es mejor
(+) La temperatura máxima en la parte superior es de 34.6 °C / 94 F, frente a la media de 35.4 °C / 96 F, que oscila entre 19.6 y 60 °C para la clase Convertible.
(+) El fondo se calienta hasta un máximo de 36.4 °C / 98 F, frente a la media de 36.9 °C / 98 F
(+) En reposo, la temperatura media de la parte superior es de 25 °C / 77# F, frente a la media del dispositivo de 30.3 °C / 87 F.
(+) El reposamanos y el panel táctil están a una temperatura inferior a la de la piel, con un máximo de 29 °C / 84.2 F y, por tanto, son fríos al tacto.
(±) La temperatura media de la zona del reposamanos de dispositivos similares fue de 28 °C / 82.4 F (-1 °C / -1.8 F).
| HP Pavilion x360 13-u102ng i5-7200U, HD Graphics 620 | Asus VivoBook Flip TP301UA-DW006T 6100U, HD Graphics 520 | Dell Inspiron 13 5368 6500U, HD Graphics 520 | Acer Aspire R13 R7-372T-746N 6500U, HD Graphics 520 | Lenovo Yoga 510-14IKB i5-7200U, Radeon R5 M430 | |
|---|---|---|---|---|---|
| Heat | 7% | -23% | -2% | -16% | |
| Maximum Upper Side * (°C) | 34.6 | 30.6 12% | 41.6 -20% | 40 -16% | 40.1 -16% |
| Maximum Bottom * (°C) | 36.4 | 33.3 9% | 45.9 -26% | 37.6 -3% | 46.1 -27% |
| Idle Upper Side * (°C) | 26.6 | 25.7 3% | 32.7 -23% | 25.1 6% | 28.5 -7% |
| Idle Bottom * (°C) | 27.7 | 26.6 4% | 34.1 -23% | 26 6% | 31.6 -14% |
* ... más pequeño es mejor
HP Pavilion x360 13-u102ng análisis de audio
(±) | la sonoridad del altavoz es media pero buena (74 dB)
Graves 100 - 315 Hz
(-) | casi sin bajos - de media 32.3% inferior a la mediana
(±) | la linealidad de los graves es media (8.9% delta a frecuencia anterior)
Medios 400 - 2000 Hz
(+) | medios equilibrados - a sólo 3.6% de la mediana
(±) | la linealidad de los medios es media (7.1% delta respecto a la frecuencia anterior)
Altos 2 - 16 kHz
(+) | máximos equilibrados - a sólo 2.5% de la mediana
(+) | los máximos son lineales (2.7% delta a la frecuencia anterior)
Total 100 - 16.000 Hz
(±) | la linealidad del sonido global es media (21.7% de diferencia con la mediana)
En comparación con la misma clase
» 59% de todos los dispositivos probados de esta clase eran mejores, 10% similares, 31% peores
» El mejor tuvo un delta de 6%, la media fue 20%, el peor fue ###max##%
En comparación con todos los dispositivos probados
» 61% de todos los dispositivos probados eran mejores, 7% similares, 31% peores
» El mejor tuvo un delta de 4%, la media fue 24%, el peor fue ###max##%
Apple MacBook 12 (Early 2016) 1.1 GHz análisis de audio
(+) | los altavoces pueden reproducir a un volumen relativamente alto (#83.6 dB)
Graves 100 - 315 Hz
(±) | lubina reducida - en promedio 11.3% inferior a la mediana
(±) | la linealidad de los graves es media (14.2% delta a frecuencia anterior)
Medios 400 - 2000 Hz
(+) | medios equilibrados - a sólo 2.4% de la mediana
(+) | los medios son lineales (5.5% delta a la frecuencia anterior)
Altos 2 - 16 kHz
(+) | máximos equilibrados - a sólo 2% de la mediana
(+) | los máximos son lineales (4.5% delta a la frecuencia anterior)
Total 100 - 16.000 Hz
(+) | el sonido global es lineal (10.2% de diferencia con la mediana)
En comparación con la misma clase
» 7% de todos los dispositivos probados de esta clase eran mejores, 2% similares, 91% peores
» El mejor tuvo un delta de 5%, la media fue 18%, el peor fue ###max##%
En comparación con todos los dispositivos probados
» 5% de todos los dispositivos probados eran mejores, 1% similares, 94% peores
» El mejor tuvo un delta de 4%, la media fue 24%, el peor fue ###max##%
| Off / Standby | |
| Ocioso | |
| Carga |
|
Clave:
min: | |
| HP Pavilion x360 13-u102ng i5-7200U, HD Graphics 620 | Asus VivoBook Flip TP301UA-DW006T 6100U, HD Graphics 520 | Dell Inspiron 13 5368 6500U, HD Graphics 520 | Acer Aspire R13 R7-372T-746N 6500U, HD Graphics 520 | Lenovo Yoga 510-14IKB i5-7200U, Radeon R5 M430 | |
|---|---|---|---|---|---|
| Power Consumption | 21% | 6% | -30% | -17% | |
| Idle Minimum * (Watt) | 4.7 | 2.95 37% | 4.4 6% | 6.2 -32% | 3.9 17% |
| Idle Average * (Watt) | 7.2 | 5.6 22% | 6.1 15% | 8 -11% | 7.1 1% |
| Idle Maximum * (Watt) | 7.9 | 7.7 3% | 6.8 14% | 11.6 -47% | 7.7 3% |
| Load Average * (Watt) | 30 | 22.6 25% | 29 3% | 40 -33% | 33.4 -11% |
| Load Maximum * (Watt) | 29 | 23.5 19% | 31.9 -10% | 36.6 -26% | 55.9 -93% |
* ... más pequeño es mejor
| HP Pavilion x360 13-u102ng i5-7200U, HD Graphics 620, 41 Wh | Asus VivoBook Flip TP301UA-DW006T 6100U, HD Graphics 520, 55 Wh | Dell Inspiron 13 5368 6500U, HD Graphics 520, 42 Wh | Acer Aspire R13 R7-372T-746N 6500U, HD Graphics 520, 49 Wh | Lenovo Yoga 510-14IKB i5-7200U, Radeon R5 M430, 35 Wh | |
|---|---|---|---|---|---|
| Duración de Batería | 81% | -2% | 16% | 22% | |
| Reader / Idle (h) | 9.3 | 21 126% | 11.2 20% | 11.2 20% | 12 29% |
| H.264 (h) | 5.3 | 6.6 25% | |||
| WiFi v1.3 (h) | 5.4 | 4.8 -11% | 4 -26% | 6.4 19% | 6.2 15% |
| Load (h) | 1.4 | 3.2 129% | 1.4 0% | 1.4 0% | 1.7 21% |
Pro
Contra
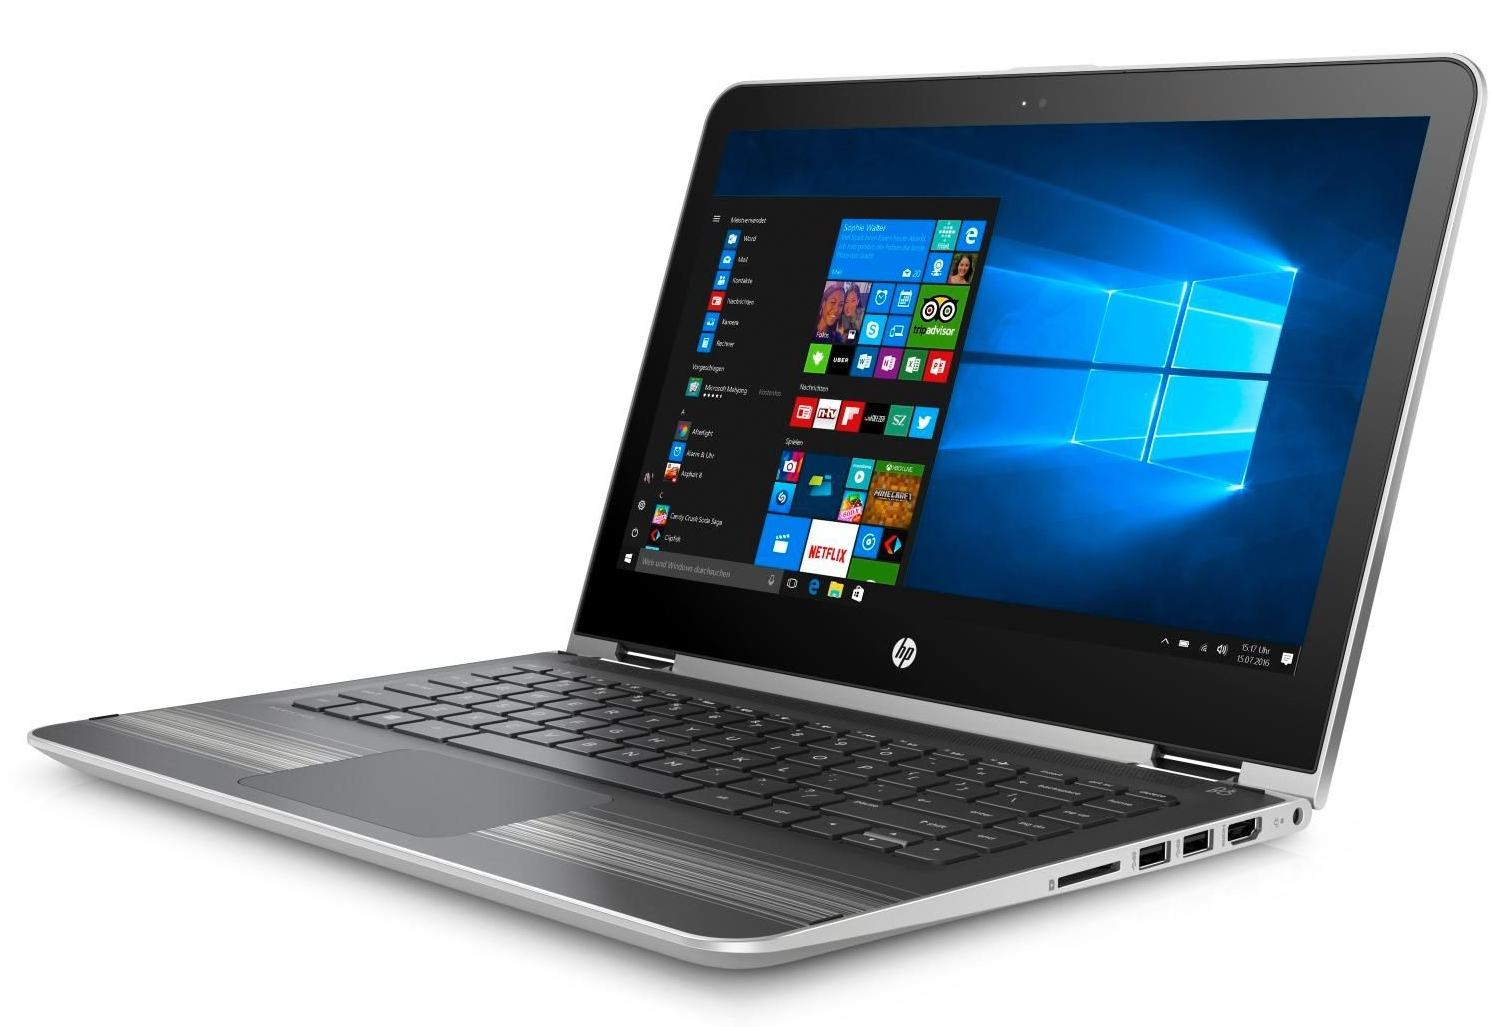
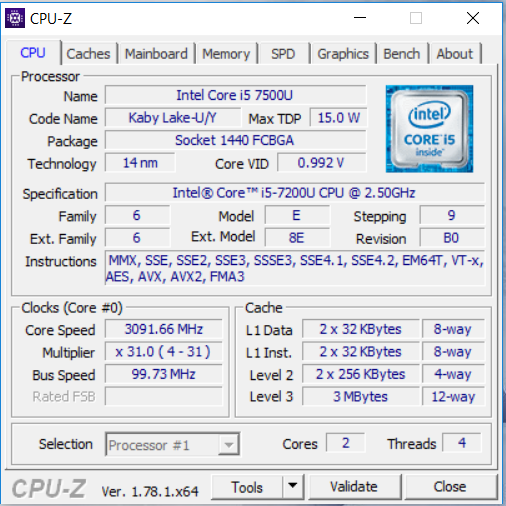
El convertible HP de 13.3" lleva un procesador Core i5 de la colección Kaby Lake. La CPU ofrece una dosis decente de potencia de cálculo que basta para su uso más allá de las aplicaciones ofimáticas y la navegación web. El portátil apenas se calienta, y, al menos inactivo, es silencioso. Con velocidades más altas, el ventilador empieza a gemir. Tardarás en quedarte sin espacio de almacenamiento gracias al HDD de 1 TB. También puedes cambiarlo por un SSD. Sin embargo, el Pavilion no es particularmente fácil de hacerle mantenimiento. Si quieres aumentar la RAM, tienes que sacar la placa base.
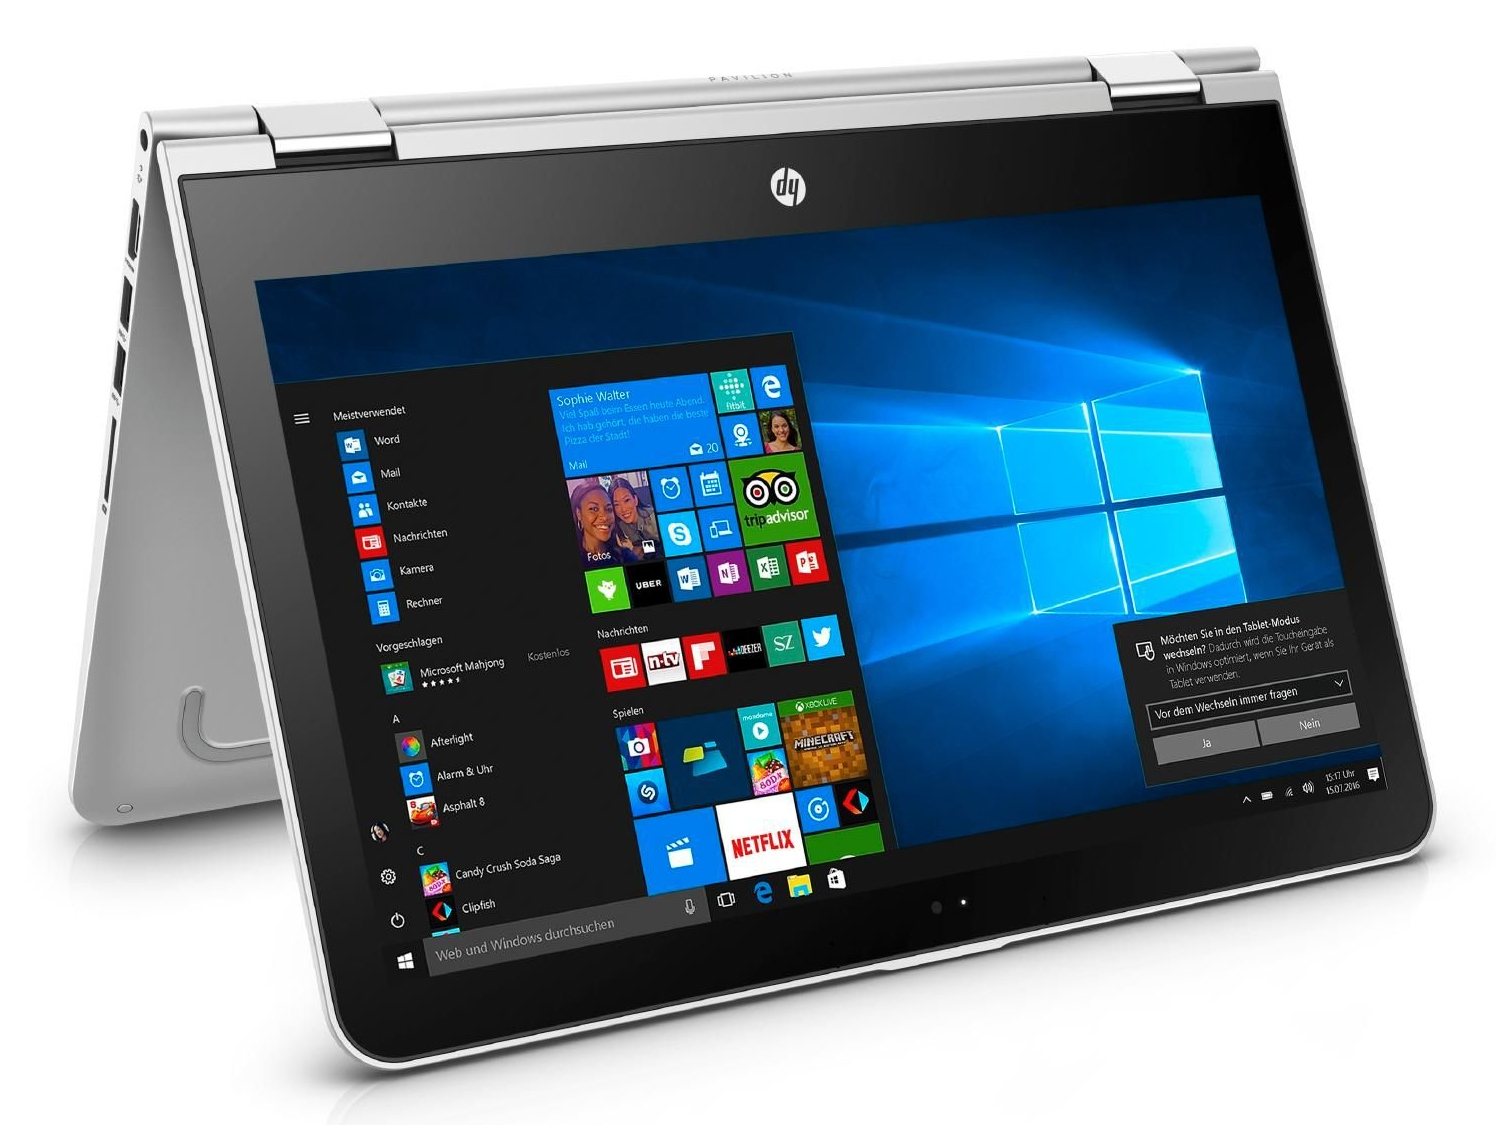
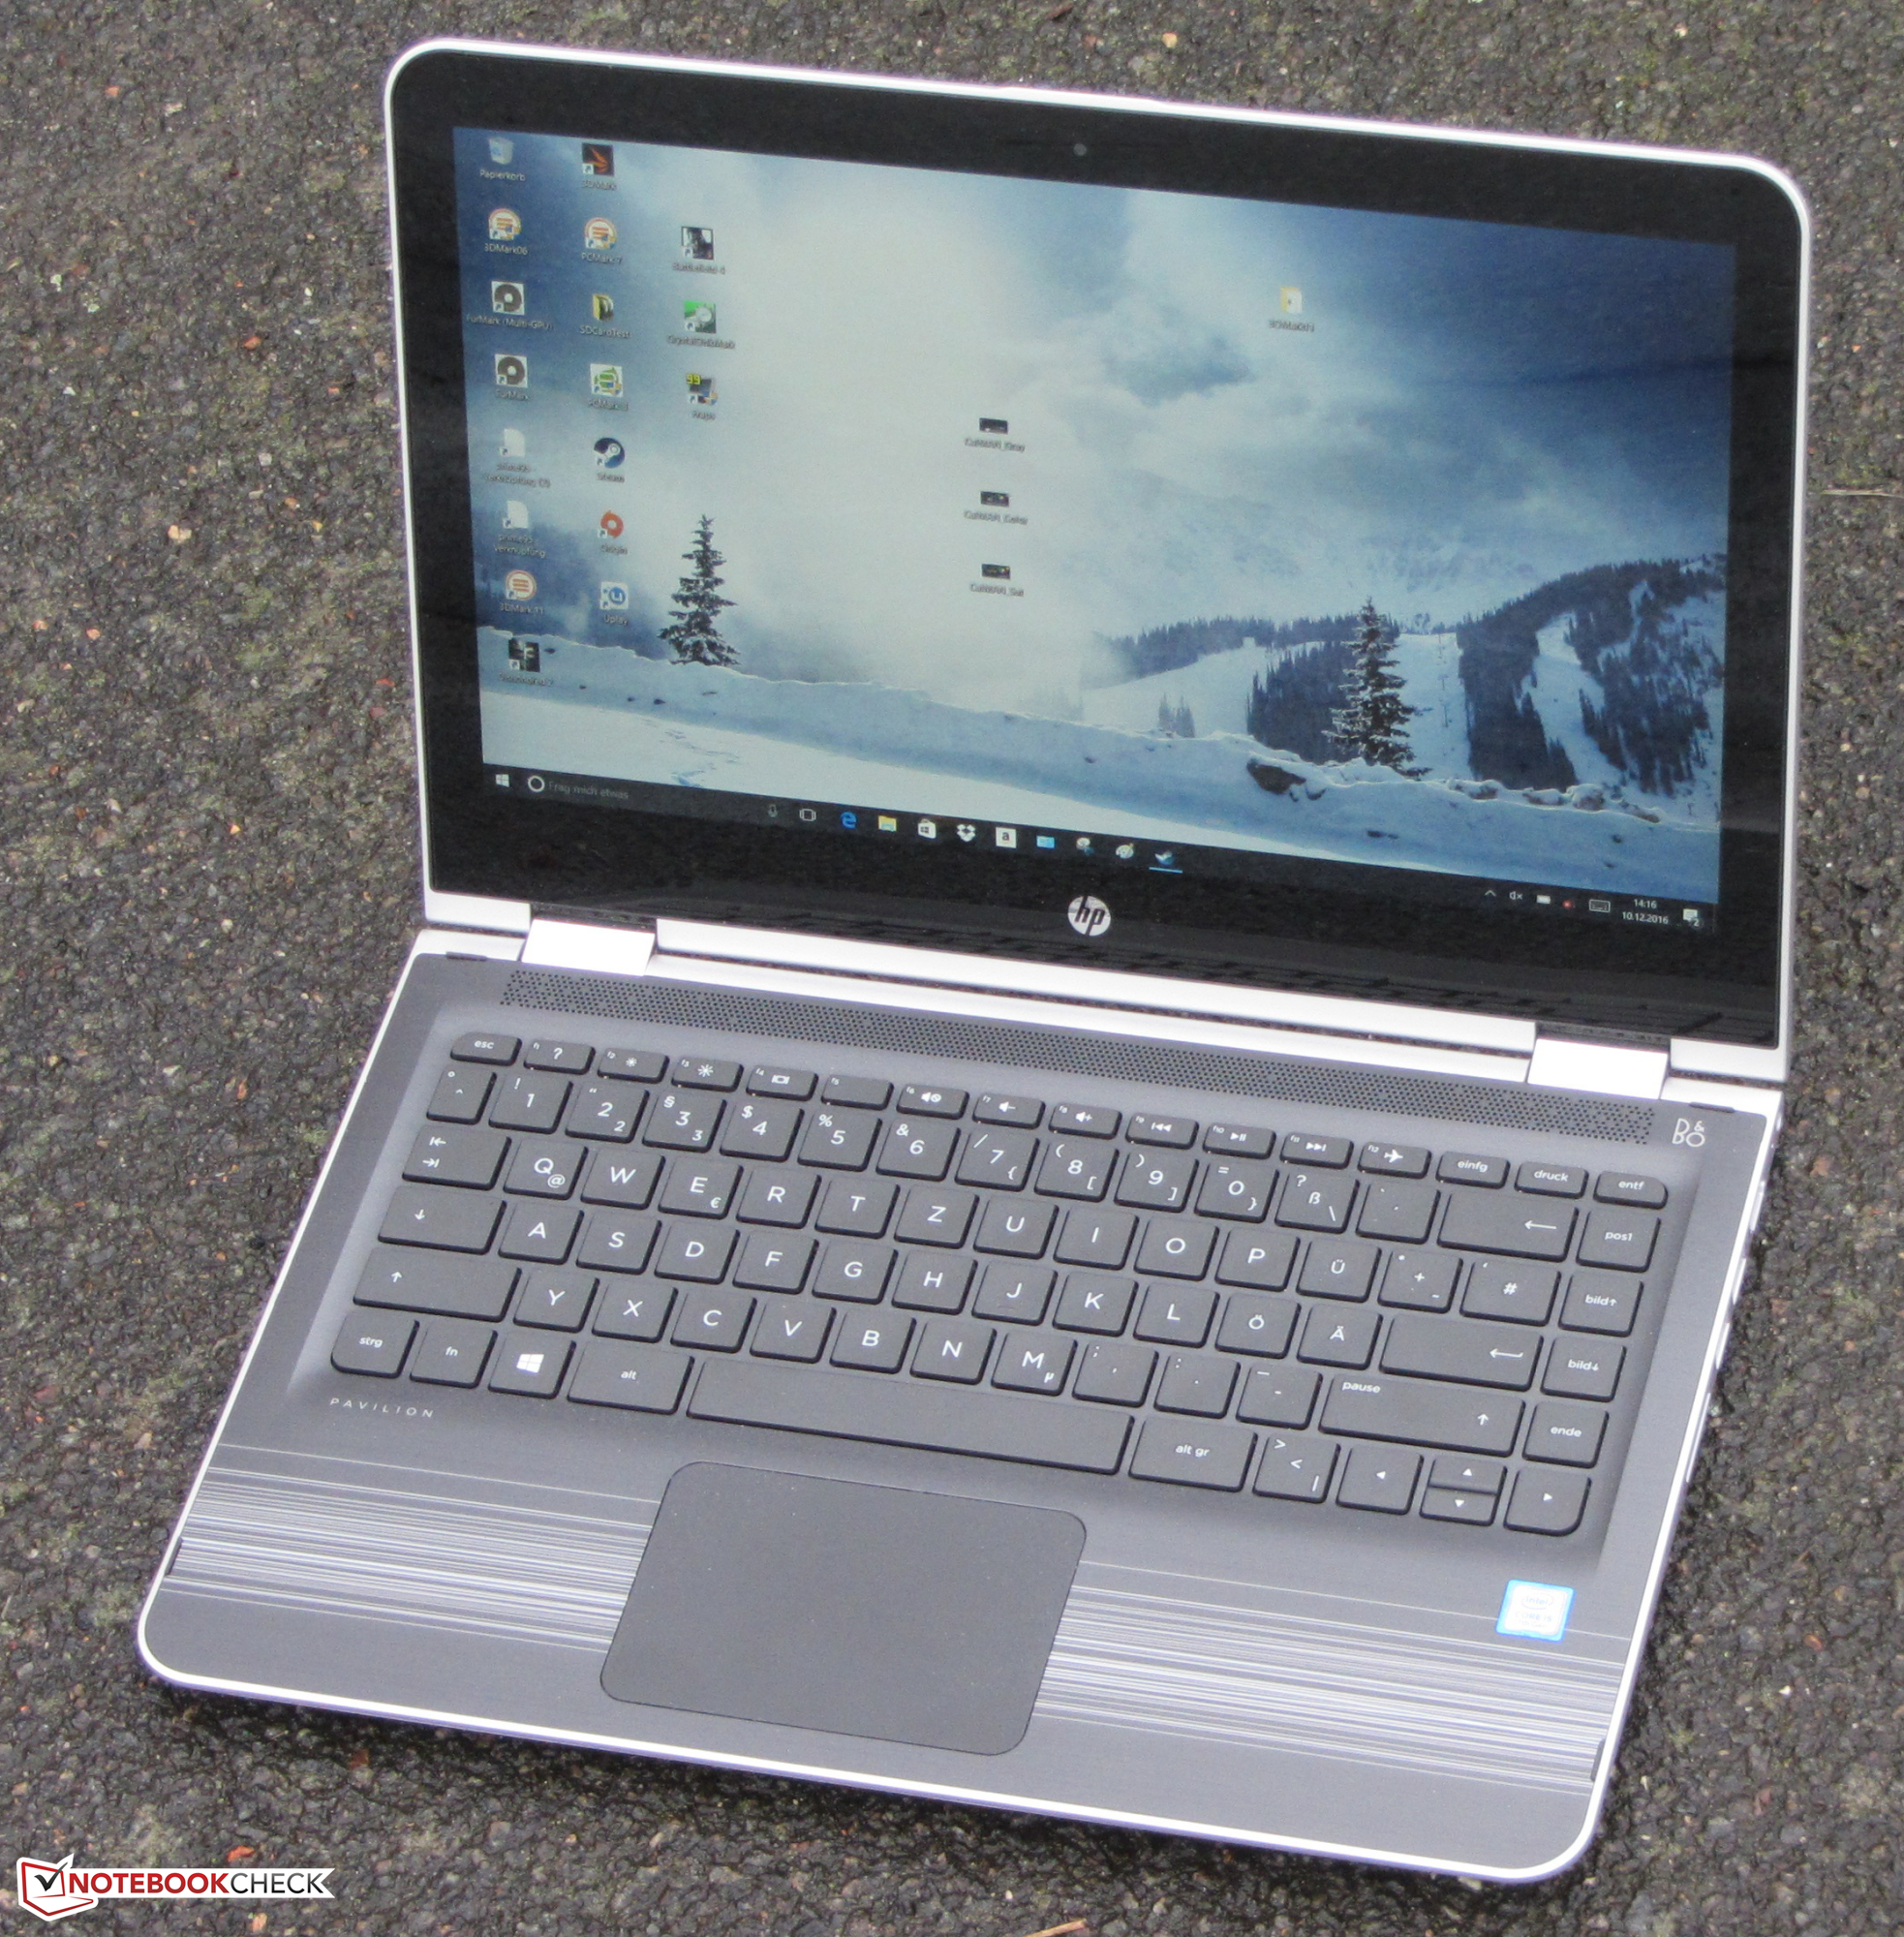
Con el Pavilion x360 13-u102ng, HP ofrece un convertible de 13.3" para uso doméstico.
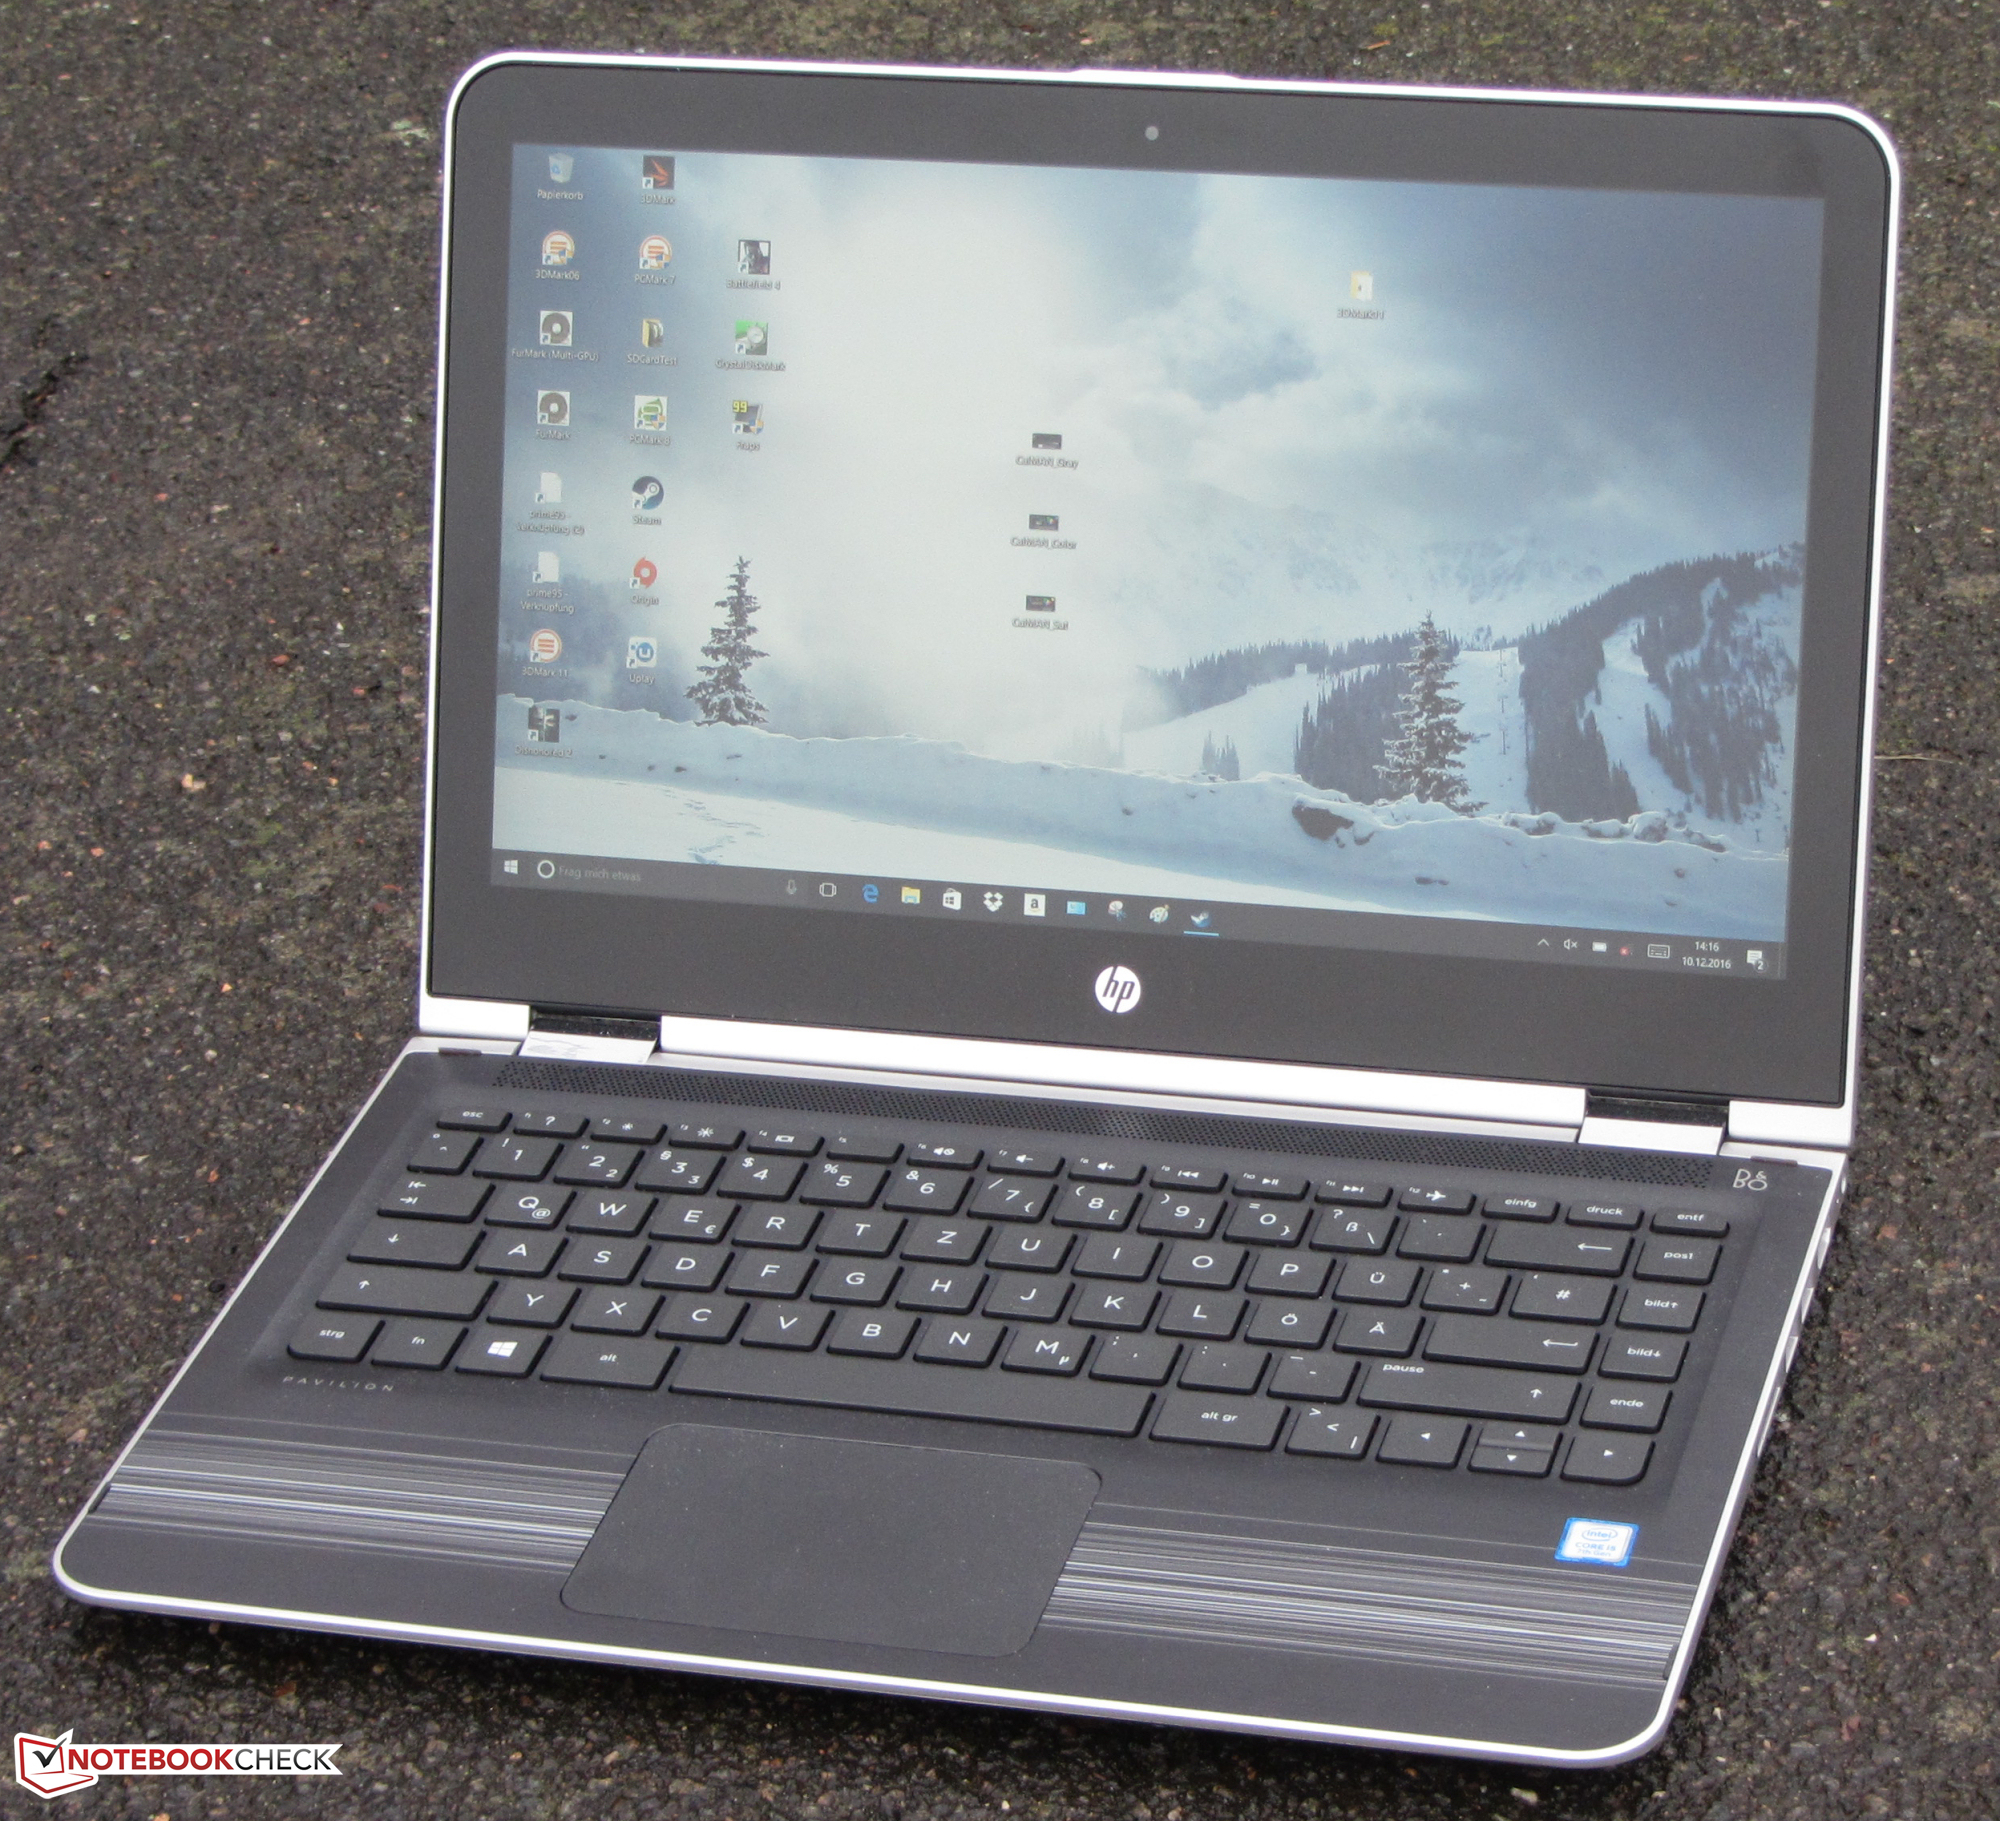
El teclado integrado causó una buena sensación de mecanografiado y también es adecuado para los usuarios que escriban frecuentemente. El display Full-HD IPS agrada con ángulos de visión estable y buen contraste. Respecto al brillo, la pantalla podría ofrecer más, pero visto el precio del portátil, los valores medidos están bien. Con el Pavilion, HP podría tener en su línea un dispositivo móvil de 13.3" asequible para escribir y navegar, algo que podría atraer a los estudiantes. Por desgracia, el aguante medio de la batería mina este plan. Además, HP sólo ofrece un año de garantía. Esperamos al menos dos años de garantía hoy día.
Ésta es una versión acortada del análisis original. Puedes leer el análisis completo en inglés aquí.
HP Pavilion x360 13-u102ng
- 12/14/2016 v6 (old)
Sascha Mölck