Breve análisis del Convertible HP Pavilion x360 15-bk102ng


| SD Card Reader | |
| average JPG Copy Test (av. of 3 runs) | |
| HP Pavilion 15-bk001ng x360 | |
| Lenovo Yoga 510-15ISK | |
| HP Pavilion x360 15-bk102ng | |
| Lenovo Yoga 510-14IKB | |
| Dell Inspiron 15 5568 | |
| maximum AS SSD Seq Read Test (1GB) | |
| HP Pavilion x360 15-bk102ng | |
| HP Pavilion 15-bk001ng x360 | |
| Lenovo Yoga 510-14IKB | |
| Lenovo Yoga 510-15ISK | |
| Dell Inspiron 15 5568 | |
| Networking | |
| iperf Server (receive) TCP 1 m | |
| Dell Inspiron 15 5568 | |
| Lenovo Yoga 510-14IKB | |
| iperf Client (transmit) TCP 1 m | |
| Dell Inspiron 15 5568 | |
| Lenovo Yoga 510-14IKB | |
| iperf3 transmit AX12 | |
| HP Pavilion x360 15-bk102ng | |
| iperf3 receive AX12 | |
| HP Pavilion x360 15-bk102ng | |
| |||||||||||||||||||||||||
iluminación: 74 %
Brillo con batería: 205 cd/m²
Contraste: 683:1 (Negro: 0.3 cd/m²)
ΔE ColorChecker Calman: 7.2 | ∀{0.5-29.43 Ø4.73}
ΔE Greyscale Calman: 6.86 | ∀{0.09-98 Ø4.97}
59% sRGB (Argyll 1.6.3 3D)
38% AdobeRGB 1998 (Argyll 1.6.3 3D)
40.76% AdobeRGB 1998 (Argyll 3D)
59.2% sRGB (Argyll 3D)
39.45% Display P3 (Argyll 3D)
Gamma: 2.27
CCT: 6983 K
| HP Pavilion x360 15-bk102ng IPS, 1920x1080, 15.6" | HP Pavilion 15-bk001ng x360 IPS, 1920x1080, 15.6" | Lenovo Yoga 510-14IKB IPS, 1920x1080, 14" | Dell Inspiron 15 5568 IPS, 1920x1080, 15.6" | Lenovo Yoga 510-15ISK IPS, 1920x1080, 15.6" | |
|---|---|---|---|---|---|
| Display | 6% | 6% | -4% | 8% | |
| Display P3 Coverage (%) | 39.45 | 41.84 6% | 41.78 6% | 38.04 -4% | 42.58 8% |
| sRGB Coverage (%) | 59.2 | 62.7 6% | 62.9 6% | 57.1 -4% | 63.9 8% |
| AdobeRGB 1998 Coverage (%) | 40.76 | 43.25 6% | 43.17 6% | 39.3 -4% | 43.99 8% |
| Response Times | 30% | -23% | 20% | 2% | |
| Response Time Grey 50% / Grey 80% * (ms) | 55 ? | 30.8 ? 44% | 53 ? 4% | 42 ? 24% | 43.2 ? 21% |
| Response Time Black / White * (ms) | 26 ? | 22 ? 15% | 39 ? -50% | 22 ? 15% | 30.8 ? -18% |
| PWM Frequency (Hz) | 50 ? | 200 ? | 350 ? | ||
| Screen | 26% | 16% | 23% | 25% | |
| Brightness middle (cd/m²) | 205 | 225 10% | 243 19% | 266 30% | 254 24% |
| Brightness (cd/m²) | 191 | 210 10% | 248 30% | 249 30% | 230 20% |
| Brightness Distribution (%) | 74 | 85 15% | 91 23% | 85 15% | 86 16% |
| Black Level * (cd/m²) | 0.3 | 0.22 27% | 0.32 -7% | 0.26 13% | 0.26 13% |
| Contrast (:1) | 683 | 1023 50% | 759 11% | 1023 50% | 977 43% |
| Colorchecker dE 2000 * | 7.2 | 4.13 43% | 5.44 24% | 4.98 31% | 4.23 41% |
| Colorchecker dE 2000 max. * | 12.7 | 9.36 26% | 9.73 23% | 11.82 7% | 9.5 25% |
| Greyscale dE 2000 * | 6.86 | 2.53 63% | 4.74 31% | 2.68 61% | 2.87 58% |
| Gamma | 2.27 97% | 2.6 85% | 2.38 92% | 2.27 97% | 2.35 94% |
| CCT | 6983 93% | 6360 102% | 7799 83% | 6583 99% | 5965 109% |
| Color Space (Percent of AdobeRGB 1998) (%) | 38 | 39.8 5% | 39.6 4% | 36 -5% | 40.35 6% |
| Color Space (Percent of sRGB) (%) | 59 | 62.5 6% | 62.5 6% | 57 -3% | 63.48 8% |
| Media total (Programa/Opciones) | 21% /
22% | -0% /
9% | 13% /
17% | 12% /
19% |
* ... más pequeño es mejor
Parpadeo de Pantalla / PWM (Pulse-Width Modulation)
| Parpadeo de Pantalla / PWM detectado | 50 Hz | ≤ 20 % de brillo | 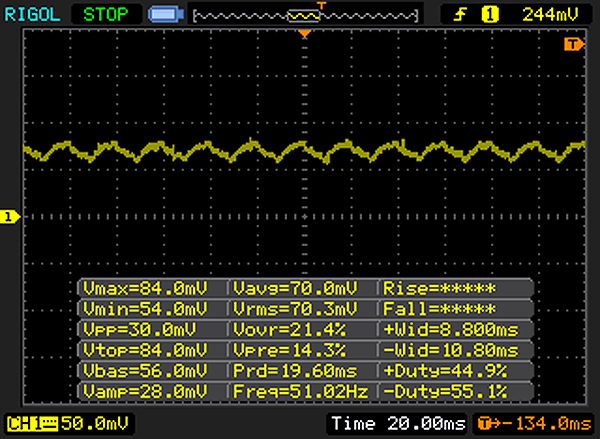 |
La retroiluminación del display parpadea a 50 Hz (seguramente usa PWM - Pulse-Width Modulation) a un brillo del 20 % e inferior. Sobre este nivel de brillo no debería darse parpadeo / PWM. La frecuencia de 50 Hz es bajísima, por lo que el parpadeo puede causar fatiga visual y cefaleas cuando se usa mucho tiempo. Comparación: 52 % de todos los dispositivos testados no usaron PWM para atenuar el display. Si se usó, medimos una media de 7798 (mínimo: 5 - máxmo: 343500) Hz. | |||
Tiempos de respuesta del display
| ↔ Tiempo de respuesta de Negro a Blanco | ||
|---|---|---|
| 26 ms ... subida ↗ y bajada ↘ combinada | ↗ 10 ms subida | 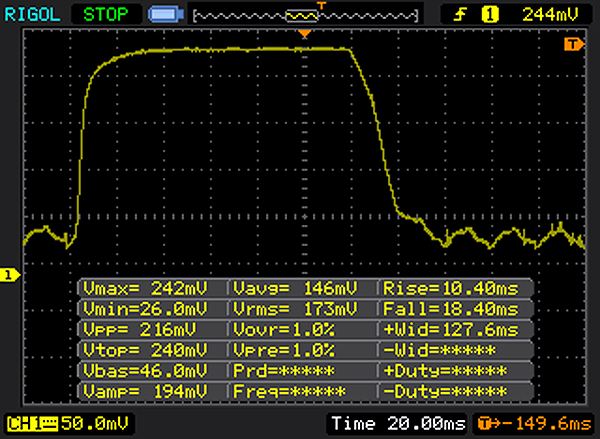 |
| ↘ 16 ms bajada | ||
| La pantalla mostró tiempos de respuesta relativamente lentos en nuestros tests pero podría ser demasiado lenta para los jugones. En comparación, todos los dispositivos de prueba van de ##min### (mínimo) a 240 (máximo) ms. » 62 % de todos los dispositivos son mejores. Eso quiere decir que el tiempo de respuesta es peor que la media (19.9 ms) de todos los dispositivos testados. | ||
| ↔ Tiempo de respuesta 50% Gris a 80% Gris | ||
| 55 ms ... subida ↗ y bajada ↘ combinada | ↗ 23 ms subida | 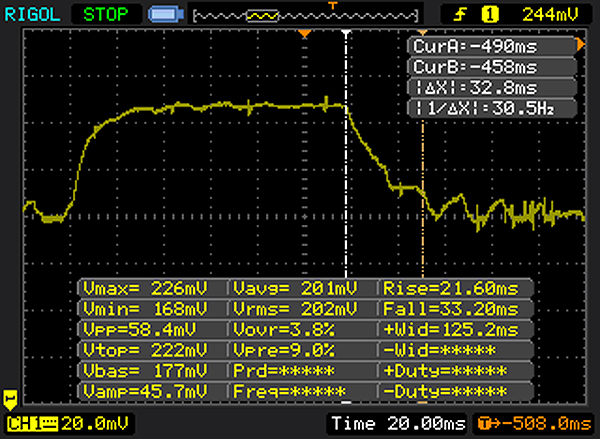 |
| ↘ 32 ms bajada | ||
| La pantalla mostró tiempos de respuesta lentos en nuestros tests y podría ser demasiado lenta para los jugones. En comparación, todos los dispositivos de prueba van de ##min### (mínimo) a 636 (máximo) ms. » 92 % de todos los dispositivos son mejores. Eso quiere decir que el tiempo de respuesta es peor que la media (31.1 ms) de todos los dispositivos testados. | ||
| Cinebench R10 | |
| Rendering Multiple CPUs 32Bit | |
| HP Pavilion x360 15-bk102ng | |
| Lenovo Yoga 510-15ISK | |
| HP Pavilion 15-bk001ng x360 | |
| Rendering Single 32Bit | |
| HP Pavilion x360 15-bk102ng | |
| Lenovo Yoga 510-15ISK | |
| HP Pavilion 15-bk001ng x360 | |
| Geekbench 3 | |
| 32 Bit Single-Core Score | |
| HP Pavilion x360 15-bk102ng | |
| Lenovo Yoga 510-15ISK | |
| 32 Bit Multi-Core Score | |
| HP Pavilion x360 15-bk102ng | |
| Lenovo Yoga 510-15ISK | |
| Geekbench 4.0 | |
| 64 Bit Single-Core Score | |
| HP Pavilion x360 15-bk102ng | |
| 64 Bit Multi-Core Score | |
| HP Pavilion x360 15-bk102ng | |
| JetStream 1.1 - 1.1 Total | |
| HP Pavilion x360 15-bk102ng | |
| Dell Inspiron 15 5568 | |
| Lenovo Yoga 510-15ISK | |
| PCMark 8 Home Score Accelerated v2 | 3173 puntos | |
ayuda | ||
| PCMark 8 - Home Score Accelerated v2 | |
| Lenovo Yoga 510-15ISK | |
| Dell Inspiron 15 5568 | |
| Lenovo Yoga 510-14IKB | |
| HP Pavilion x360 15-bk102ng | |
| HP Pavilion 15-bk001ng x360 | |

| HP Pavilion x360 15-bk102ng WDC Slim WD10SPCX-21KHST0 | HP Pavilion 15-bk001ng x360 WDC Slim WD10SPCX-21KHST0 | Lenovo Yoga 510-14IKB Samsung MZYTY256HDHP | Dell Inspiron 15 5568 Toshiba THNSNK256GCS8 | Lenovo Yoga 510-15ISK Liteonit CV3-DE256 | |
|---|---|---|---|---|---|
| CrystalDiskMark 3.0 | 6% | 11043% | 8268% | 8778% | |
| Read Seq (MB/s) | 102.4 | 106.9 4% | 518 406% | 458.6 348% | 487 376% |
| Write Seq (MB/s) | 102 | 106 4% | 476.5 367% | 270 165% | 450.7 342% |
| Read 512 (MB/s) | 31.37 | 33.01 5% | 408 1201% | 397.4 1167% | 384.5 1126% |
| Write 512 (MB/s) | 48.12 | 51.2 6% | 274.5 470% | 242 403% | 356.3 640% |
| Read 4k (MB/s) | 0.357 | 0.373 4% | 35.66 9889% | 19.88 5469% | 27.05 7477% |
| Write 4k (MB/s) | 1.047 | 1.097 5% | 106.7 10091% | 86.7 8181% | 63.7 5984% |
| Read 4k QD32 (MB/s) | 0.844 | 1.029 22% | 368.7 43585% | 275.3 32518% | 281.5 33253% |
| Write 4k QD32 (MB/s) | 1.098 | 1.055 -4% | 246.3 22332% | 197.6 17896% | 232 21029% |
| 3DMark 11 Performance | 1445 puntos | |
ayuda | ||
| 3DMark 11 - 1280x720 Performance GPU | |
| Lenovo Yoga 510-15ISK | |
| Lenovo Yoga 510-14IKB | |
| Dell Inspiron 15 5568 | |
| HP Pavilion x360 15-bk102ng | |
| HP Pavilion 15-bk001ng x360 | |
| bajo | medio | alto | ultra | |
|---|---|---|---|---|
| BioShock Infinite (2013) | 39 | 22.6 | 18.2 | 5.8 |
Ruido
| Ocioso |
| 31.7 / 31.7 / 31.7 dB(A) |
| Carga |
| 38.8 / 36.8 dB(A) |
 | ||
30 dB silencioso 40 dB(A) audible 50 dB(A) ruidosamente alto |
||
min: | ||
(+) La temperatura máxima en la parte superior es de 29 °C / 84 F, frente a la media de 35.4 °C / 96 F, que oscila entre 19.6 y 60 °C para la clase Convertible.
(+) El fondo se calienta hasta un máximo de 32 °C / 90 F, frente a la media de 36.9 °C / 98 F
(+) En reposo, la temperatura media de la parte superior es de 22.3 °C / 72# F, frente a la media del dispositivo de 30.3 °C / 87 F.
(+) El reposamanos y el panel táctil están a una temperatura inferior a la de la piel, con un máximo de 28 °C / 82.4 F y, por tanto, son fríos al tacto.
(±) La temperatura media de la zona del reposamanos de dispositivos similares fue de 28 °C / 82.4 F (0 °C / 0 F).
HP Pavilion x360 15-bk102ng análisis de audio
(-) | altavoces no muy altos (#65 dB)
Graves 100 - 315 Hz
(-) | casi sin bajos - de media 19.9% inferior a la mediana
(±) | la linealidad de los graves es media (12.4% delta a frecuencia anterior)
Medios 400 - 2000 Hz
(+) | medios equilibrados - a sólo 4.2% de la mediana
(±) | la linealidad de los medios es media (7% delta respecto a la frecuencia anterior)
Altos 2 - 16 kHz
(+) | máximos equilibrados - a sólo 2.3% de la mediana
(+) | los máximos son lineales (6.2% delta a la frecuencia anterior)
Total 100 - 16.000 Hz
(±) | la linealidad del sonido global es media (21.2% de diferencia con la mediana)
En comparación con la misma clase
» 56% de todos los dispositivos probados de esta clase eran mejores, 11% similares, 32% peores
» El mejor tuvo un delta de 6%, la media fue 20%, el peor fue ###max##%
En comparación con todos los dispositivos probados
» 59% de todos los dispositivos probados eran mejores, 7% similares, 34% peores
» El mejor tuvo un delta de 4%, la media fue 24%, el peor fue ###max##%
Apple MacBook 12 (Early 2016) 1.1 GHz análisis de audio
(+) | los altavoces pueden reproducir a un volumen relativamente alto (#83.6 dB)
Graves 100 - 315 Hz
(±) | lubina reducida - en promedio 11.3% inferior a la mediana
(±) | la linealidad de los graves es media (14.2% delta a frecuencia anterior)
Medios 400 - 2000 Hz
(+) | medios equilibrados - a sólo 2.4% de la mediana
(+) | los medios son lineales (5.5% delta a la frecuencia anterior)
Altos 2 - 16 kHz
(+) | máximos equilibrados - a sólo 2% de la mediana
(+) | los máximos son lineales (4.5% delta a la frecuencia anterior)
Total 100 - 16.000 Hz
(+) | el sonido global es lineal (10.2% de diferencia con la mediana)
En comparación con la misma clase
» 7% de todos los dispositivos probados de esta clase eran mejores, 2% similares, 91% peores
» El mejor tuvo un delta de 5%, la media fue 18%, el peor fue ###max##%
En comparación con todos los dispositivos probados
» 5% de todos los dispositivos probados eran mejores, 1% similares, 94% peores
» El mejor tuvo un delta de 4%, la media fue 24%, el peor fue ###max##%
| Off / Standby | |
| Ocioso | |
| Carga |
|
Clave:
min: | |
| Battery Runtime - WiFi Websurfing | |
| HP Pavilion 15-bk001ng x360 | |
| Lenovo Yoga 510-14IKB | |
| HP Pavilion x360 15-bk102ng | |
| Lenovo Yoga 510-15ISK | |
| Dell Inspiron 15 5568 | |
Pro
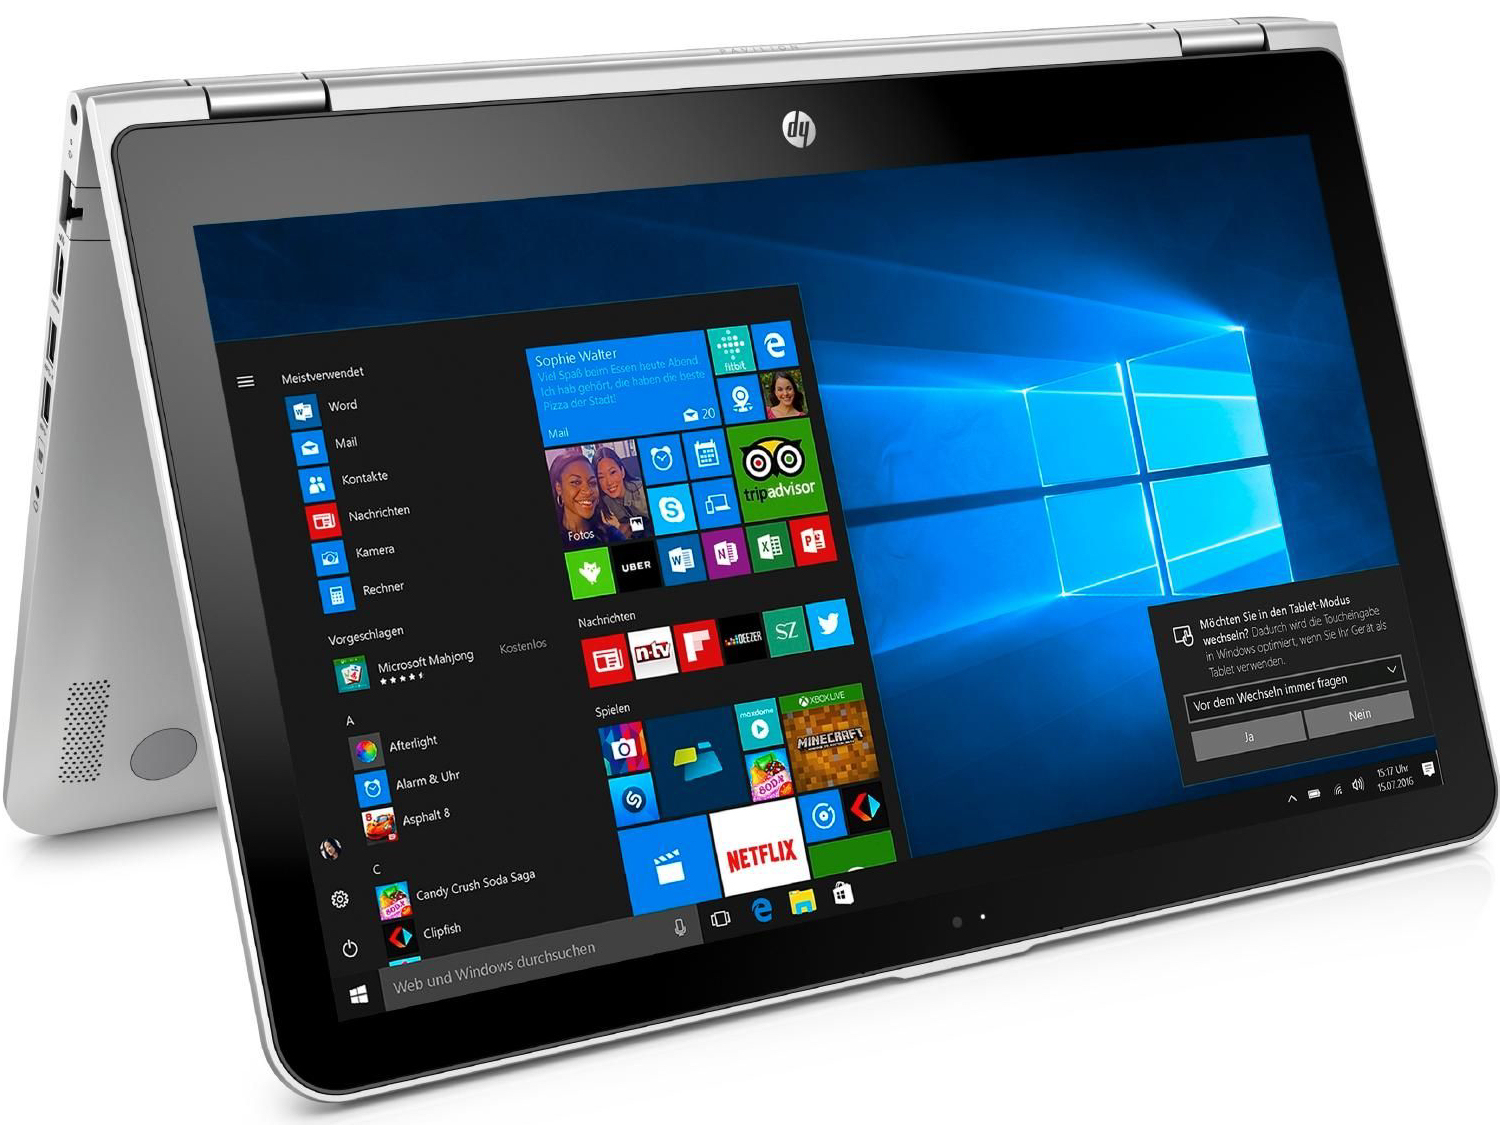
Contra
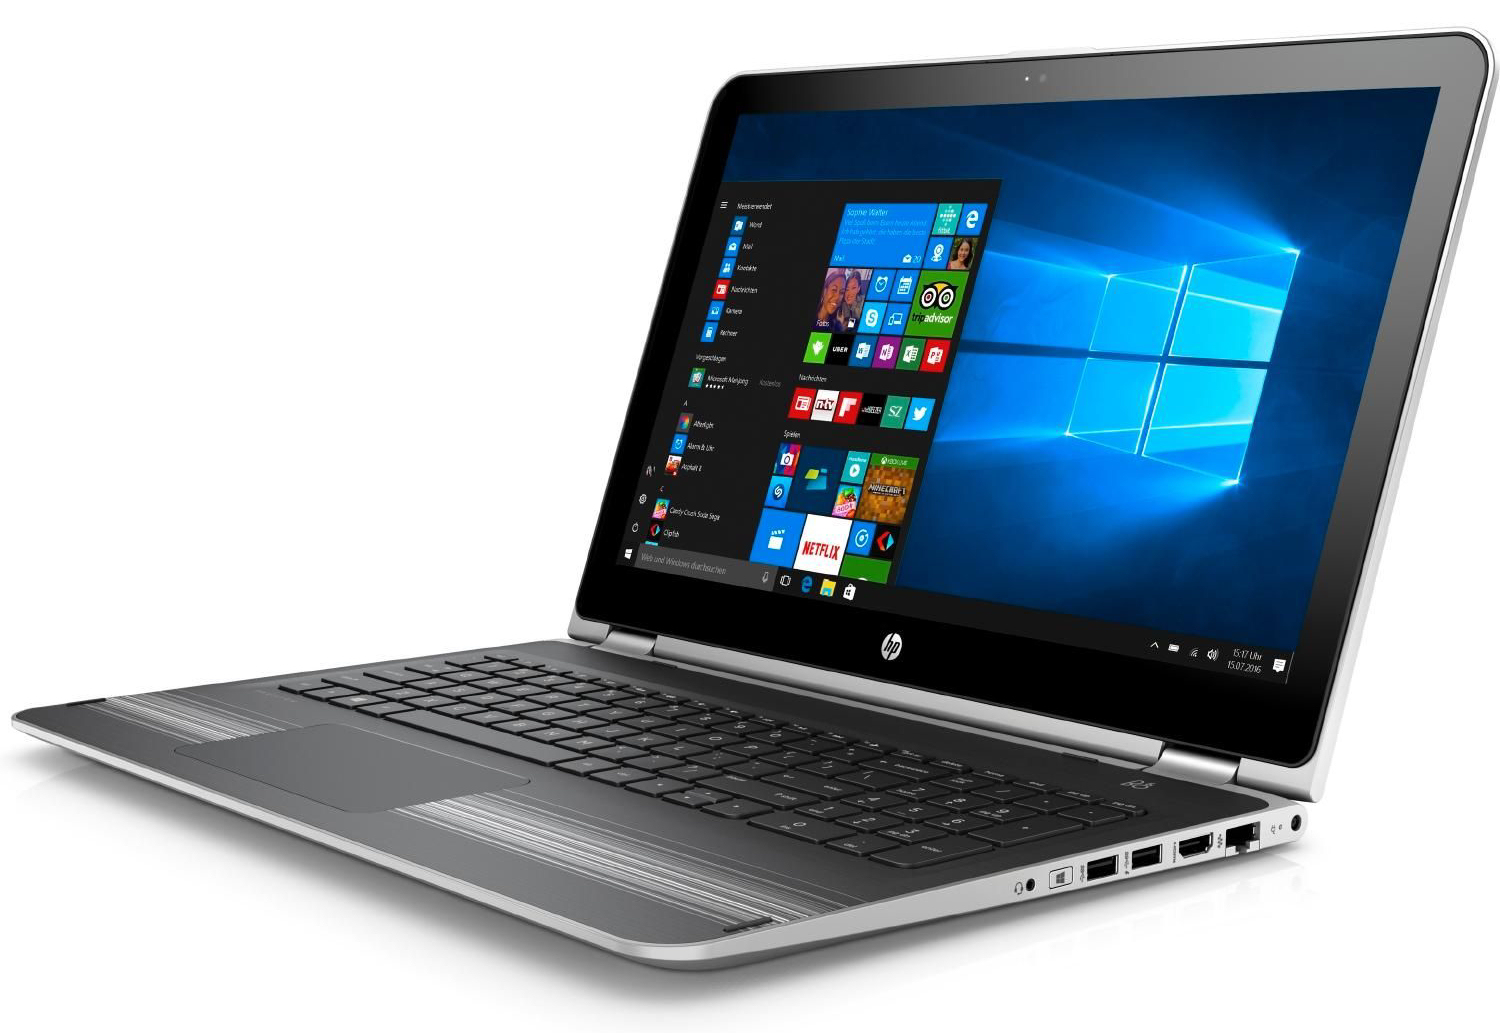
HP hace este convertible Pavilion en un formato de 15.6" que tiene suficiente potencia de cálculo para todos los escenarios comunes de aplicación. El portátil funciona en mucho silencio en inactivo y apenas se calienta en toda su carga operacional. No le falta capacidad: un HDD 1TB y 8 GB de RAM. Para mejorar a un SSD tienes que abrir la carcasa entera. HP no creyó que mereciera la pena ofrecer una escotilla de acceso. El teclado es suficiente para el uso doméstico. El aguante de batería, demostrada en nuestro test WLAN, sólo puede definirse como media. Para un portátil puramente móvil éste no es la mejor elección.
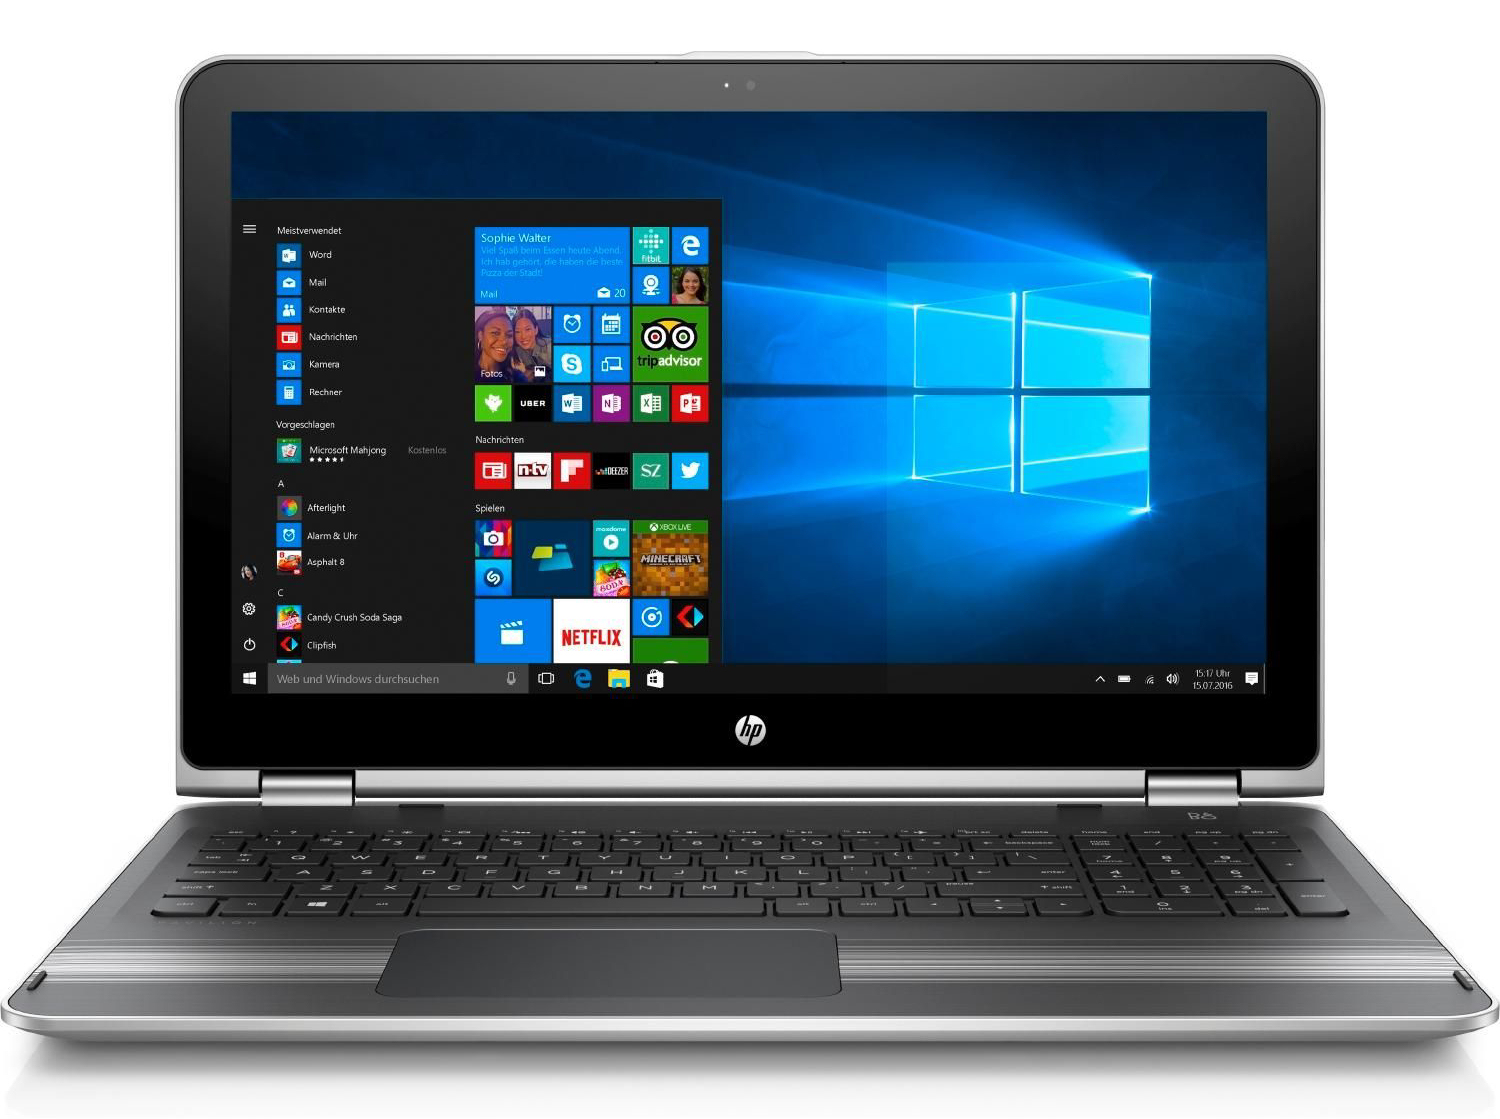
La pantalla no es particularmente impresionante resultado de su apariencia relativamente tenue.
Por casi 600 Euros, HP debería ofrecer mucho más. Tiene una pantalla IPS amplio ángulo de visión con un contraste decente. Aparte del teclado y el touchpad para la entrada, también trae pantalla táctil. El toque responde bien a la entrada del usuario, sea ya por dedo o por stylus.
Ésta es una versión acortada del análisis original. Puedes leer el análisis completo en inglés aquí.
HP Pavilion x360 15-bk102ng
- 12/22/2016 v6 (old)
Sascha Mölck