Breve análisis del portátil Lenovo IdeaPad 310-15IKB
| SD Card Reader | |
| average JPG Copy Test (av. of 3 runs) | |
| Dell XPS 13 9360 FHD i5 | |
| Lenovo Ideapad 310-15IKB | |
| Acer TravelMate X3 X349-M-7261 | |
| maximum AS SSD Seq Read Test (1GB) | |
| Dell XPS 13 9360 FHD i5 | |
| Acer TravelMate X3 X349-M-7261 | |
| Lenovo Ideapad 310-15IKB | |
| Networking | |
| iperf Server (receive) TCP 1 m | |
| Xiaomi Mi Notebook Air 13.3 2016 | |
| Acer Aspire E5-774-54HJ (jseb) | |
| Lenovo Ideapad 310-15IKB | |
| iperf Client (transmit) TCP 1 m | |
| Xiaomi Mi Notebook Air 13.3 2016 | |
| Acer Aspire E5-774-54HJ (jseb) | |
| Lenovo Ideapad 310-15IKB | |
| |||||||||||||||||||||||||
iluminación: 95 %
Brillo con batería: 185 cd/m²
Contraste: 661:1 (Negro: 0.28 cd/m²)
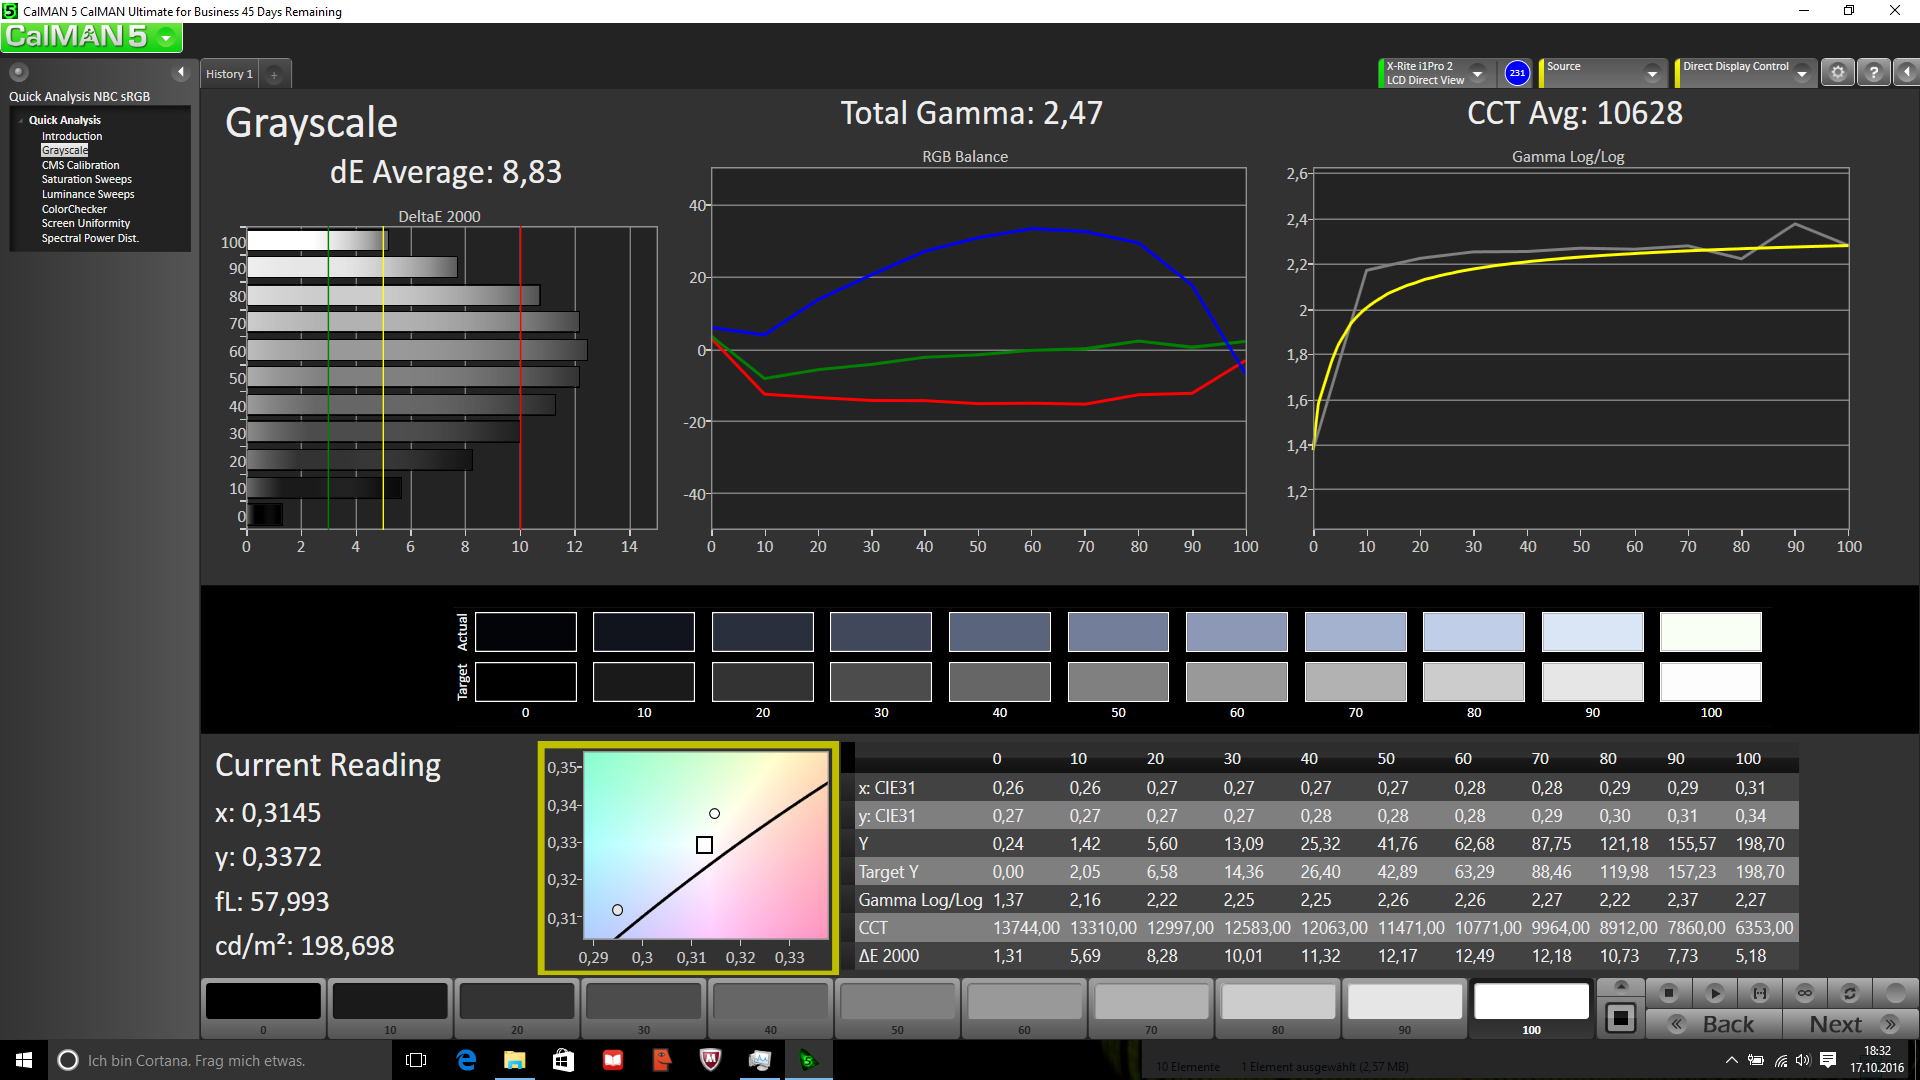
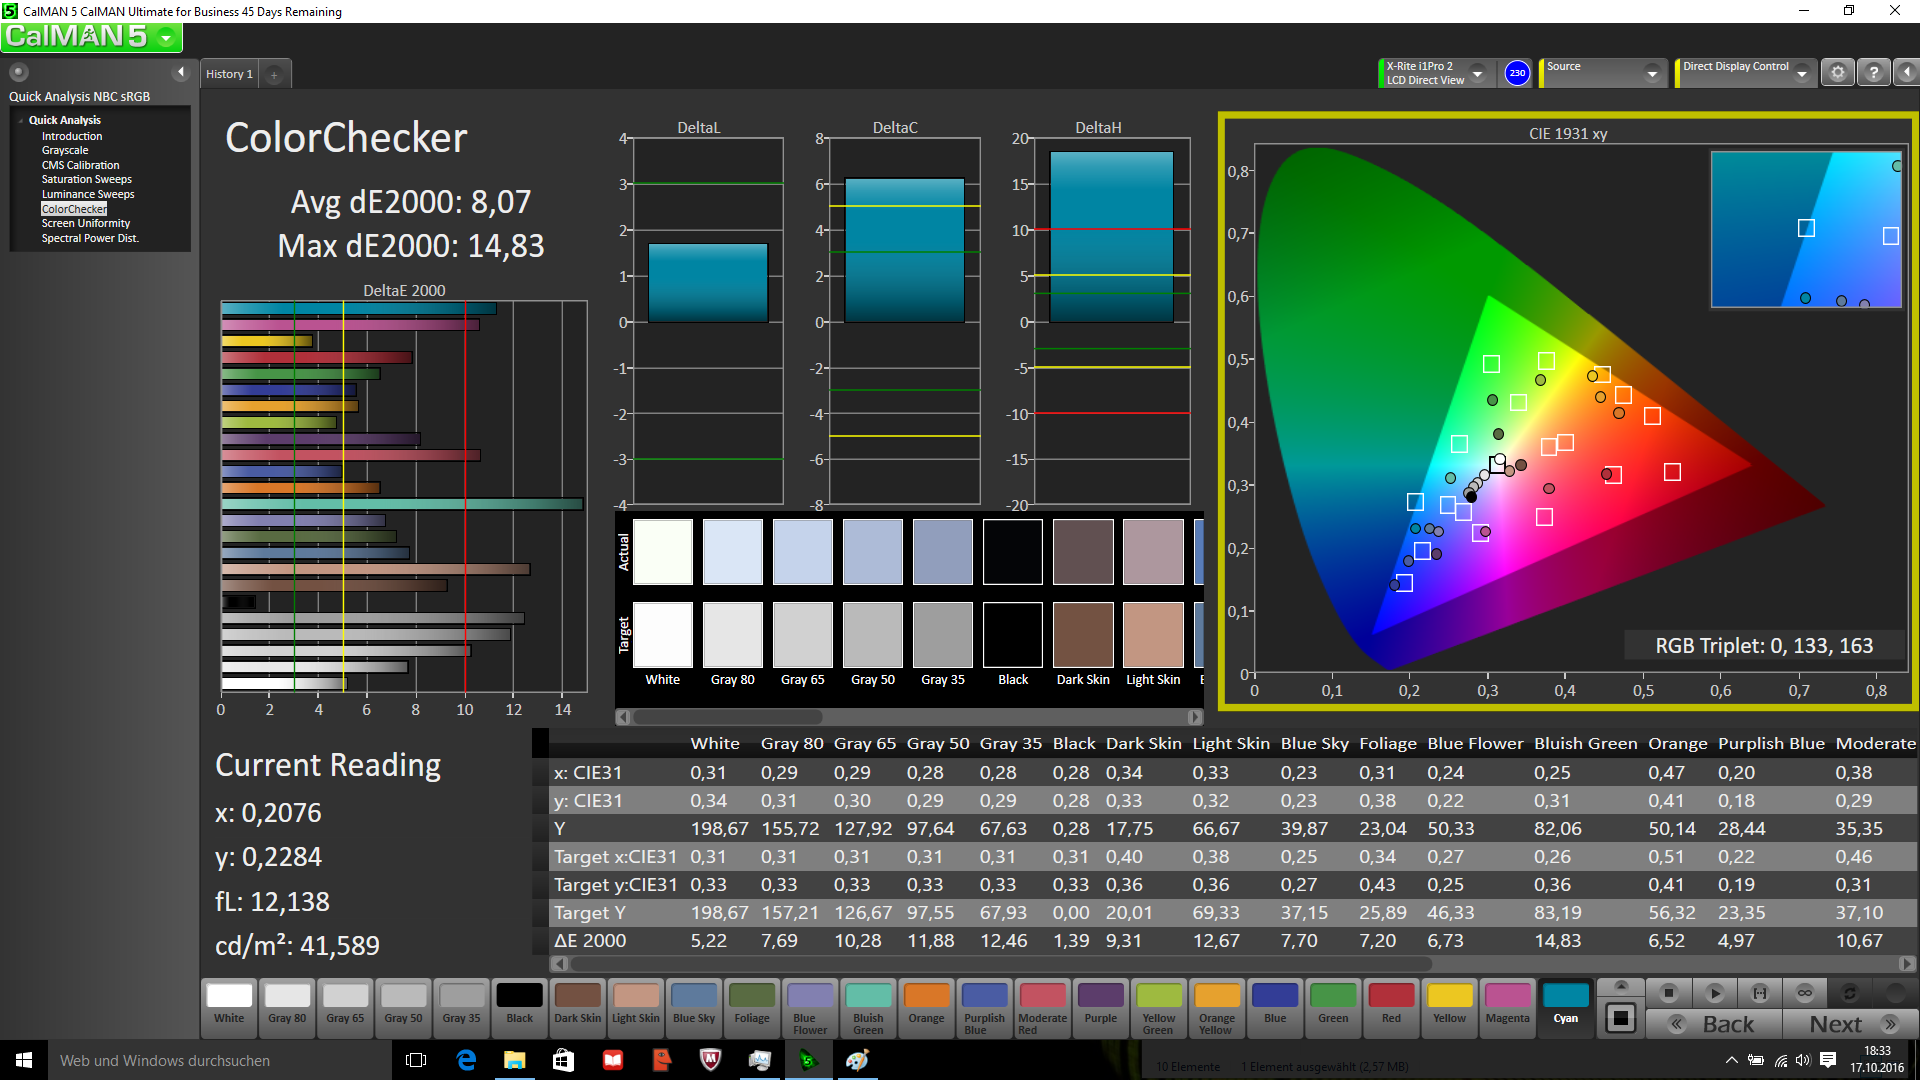
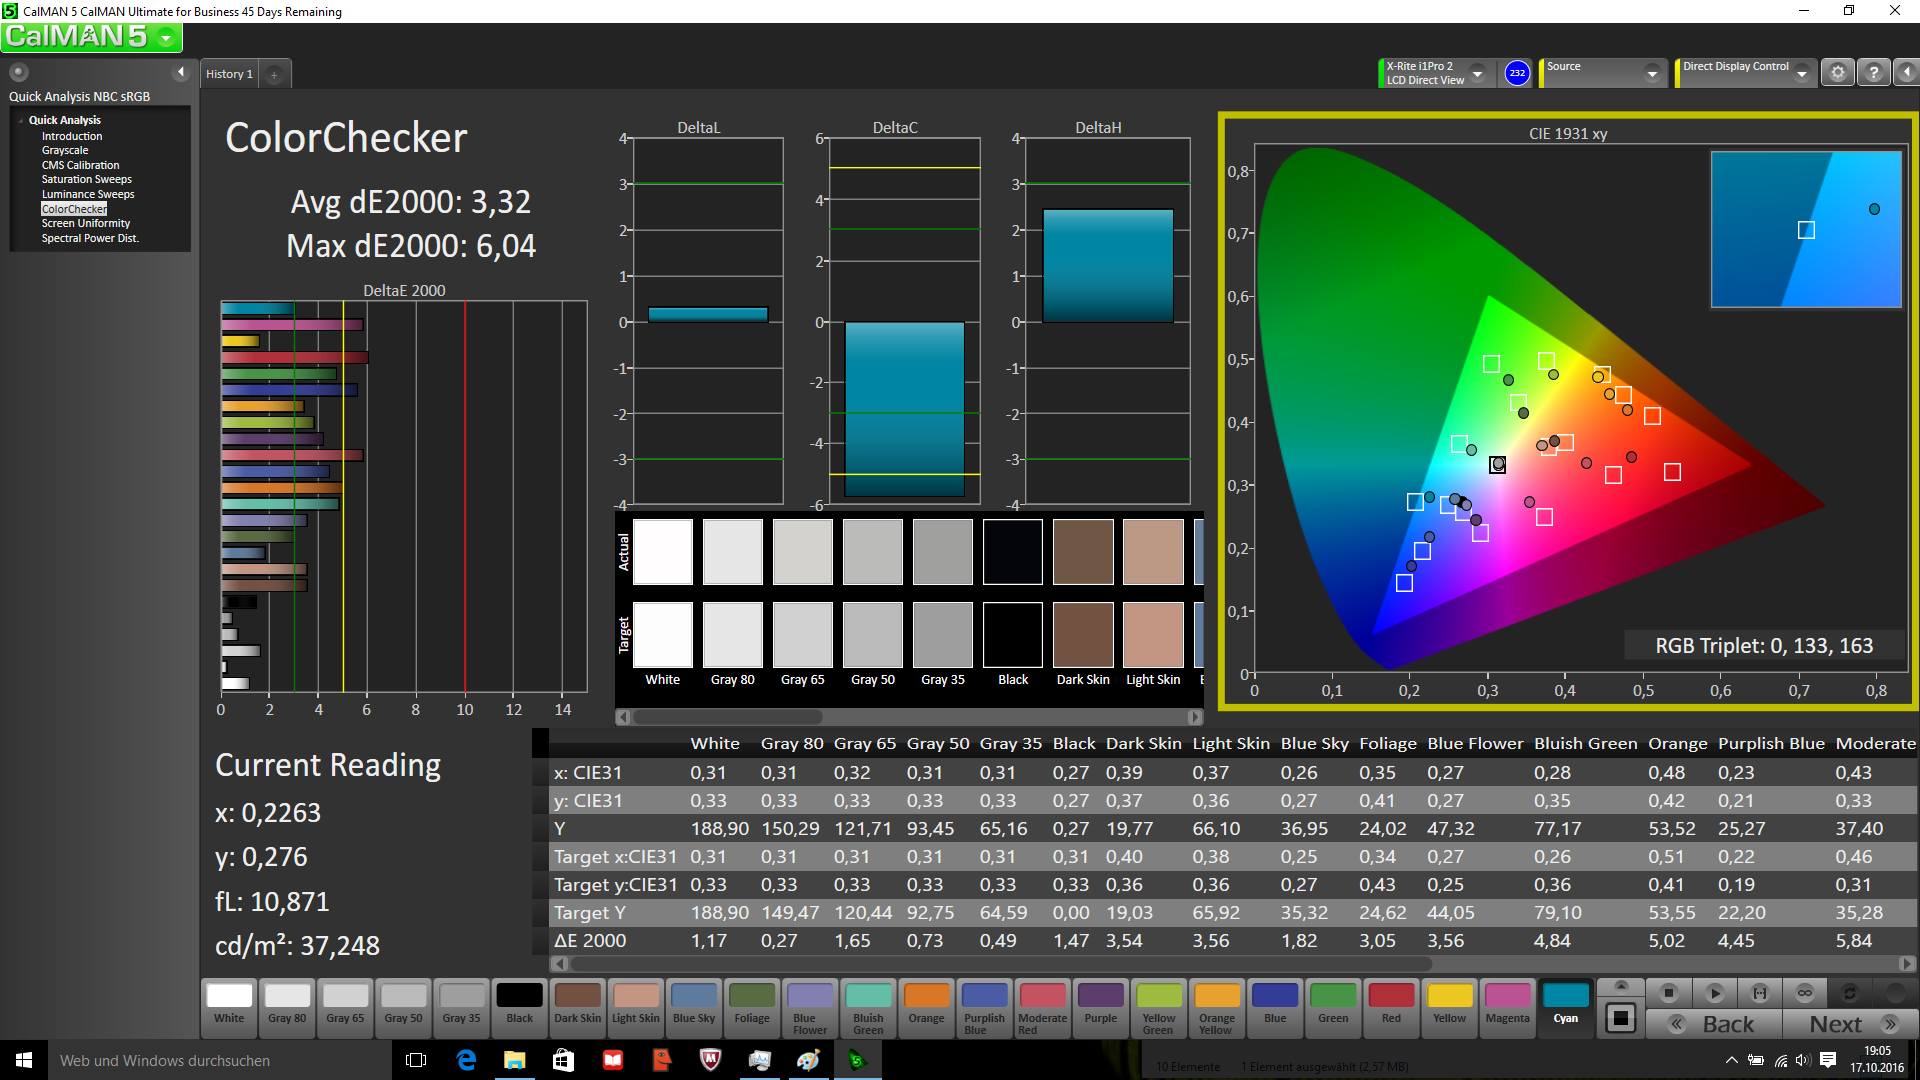
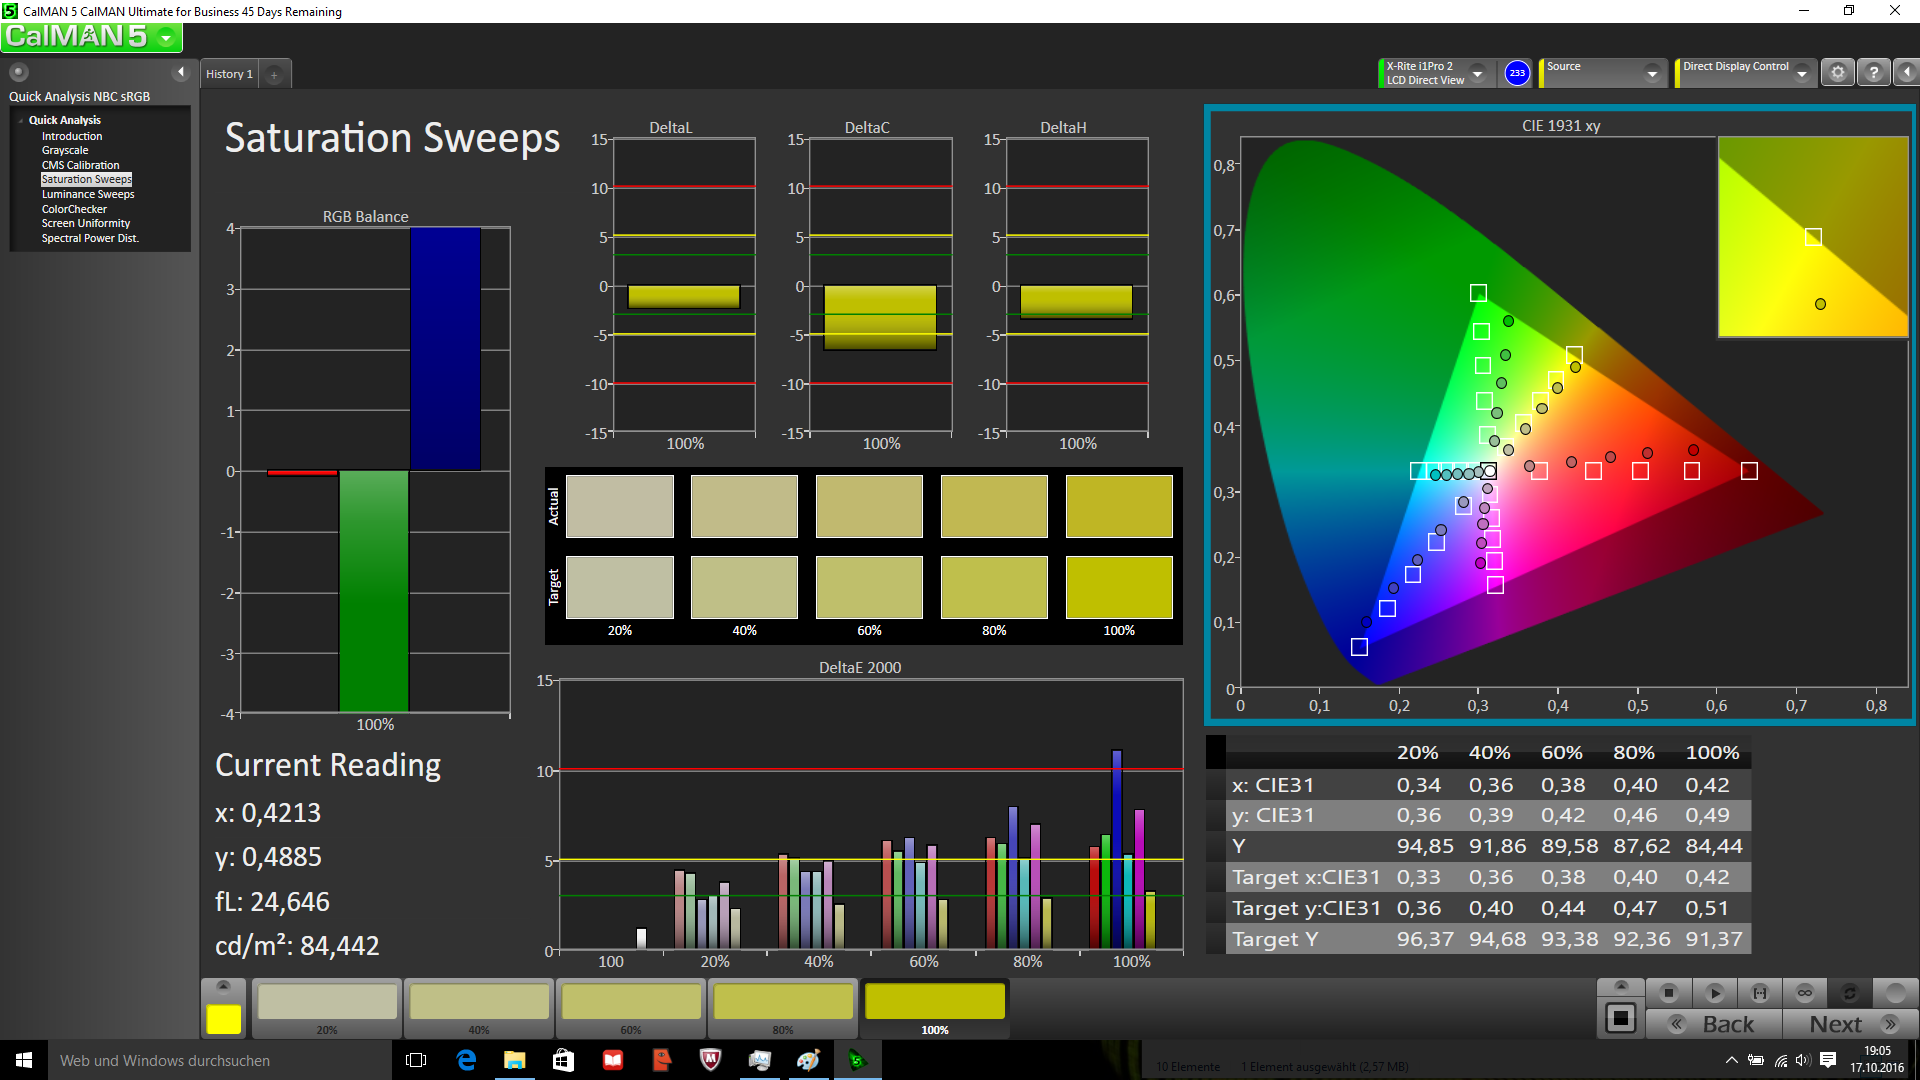
ΔE ColorChecker Calman: 8.07 | ∀{0.5-29.43 Ø4.73}
ΔE Greyscale Calman: 8.83 | ∀{0.09-98 Ø4.97}
57% sRGB (Argyll 1.6.3 3D)
36.2% AdobeRGB 1998 (Argyll 1.6.3 3D)
39.34% AdobeRGB 1998 (Argyll 3D)
57.3% sRGB (Argyll 3D)
38.07% Display P3 (Argyll 3D)
Gamma: 2.47
CCT: 10628 K
| Lenovo Ideapad 310-15IKB BOE NT156FHM-N31, , 1920x1080, 15.6" | Lenovo IdeaPad 510-15IKB 80SV0087GE BOE HF NV156FHM-N42, , 1920x1080, 15.6" | Acer Aspire E5-774-54HJ AU Optronics B173HTN01.1, , 1920x1080, 17.3" | HP 250 G5 SP X0N33EA AU Optronics AUO38ED, , 1920x1080, 15.6" | Medion Akoya P6670 LG Philips LP156WF6-SPK3, , 1920x1080, 15.6" | Lenovo Ideapad 310-15ISK LG Philips LP156WHU-TPG1, , 1366x768, 15.6" | |
|---|---|---|---|---|---|---|
| Display | 12% | 73% | -4% | 0% | -3% | |
| Display P3 Coverage (%) | 38.07 | 42.66 12% | 71.3 87% | 36.51 -4% | 38.14 0% | 37.06 -3% |
| sRGB Coverage (%) | 57.3 | 64.1 12% | 91.7 60% | 55 -4% | 57.2 0% | 55.8 -3% |
| AdobeRGB 1998 Coverage (%) | 39.34 | 44.08 12% | 67.1 71% | 37.72 -4% | 39.43 0% | 38.29 -3% |
| Response Times | -50% | -4% | 1% | -2% | 16% | |
| Response Time Grey 50% / Grey 80% * (ms) | 43 ? | 51 ? -19% | 42 ? 2% | 40 ? 7% | 42 ? 2% | 27 ? 37% |
| Response Time Black / White * (ms) | 21 ? | 38 ? -81% | 23 ? -10% | 22 ? -5% | 22 ? -5% | 22 ? -5% |
| PWM Frequency (Hz) | 50 ? | 1000 ? | 50 | 50 ? | ||
| Screen | 36% | 30% | -19% | 2% | -6% | |
| Brightness middle (cd/m²) | 185 | 291 57% | 353 91% | 219 18% | 287 55% | 200 8% |
| Brightness (cd/m²) | 184 | 265 44% | 320 74% | 222 21% | 269 46% | 198 8% |
| Brightness Distribution (%) | 95 | 86 -9% | 82 -14% | 85 -11% | 74 -22% | 83 -13% |
| Black Level * (cd/m²) | 0.28 | 0.23 18% | 0.38 -36% | 0.39 -39% | 0.65 -132% | 0.28 -0% |
| Contrast (:1) | 661 | 1265 91% | 929 41% | 562 -15% | 442 -33% | 714 8% |
| Colorchecker dE 2000 * | 8.07 | 4.78 41% | 5.07 37% | 12.67 -57% | 5.42 33% | 10.63 -32% |
| Colorchecker dE 2000 max. * | 14.83 | 9.51 36% | 10.12 32% | 20.99 -42% | 9.54 36% | 15.69 -6% |
| Greyscale dE 2000 * | 8.83 | 3.49 60% | 13.38 -52% | 13.82 -57% | 5.14 42% | 11.19 -27% |
| Gamma | 2.47 89% | 2.58 85% | 2.69 82% | 2.63 84% | 2.48 89% | 1.78 124% |
| CCT | 10628 61% | 6013 108% | 15991 41% | 15633 42% | 6952 93% | 11258 58% |
| Color Space (Percent of AdobeRGB 1998) (%) | 36.2 | 40 10% | 60.1 66% | 35 -3% | 36 -1% | 35 -3% |
| Color Space (Percent of sRGB) (%) | 57 | 64 12% | 91.6 61% | 55 -4% | 57 0% | 56 -2% |
| Media total (Programa/Opciones) | -1% /
20% | 33% /
34% | -7% /
-13% | 0% /
1% | 2% /
-2% |
* ... más pequeño es mejor
Tiempos de respuesta del display
| ↔ Tiempo de respuesta de Negro a Blanco | ||
|---|---|---|
| 21 ms ... subida ↗ y bajada ↘ combinada | ↗ 5 ms subida | 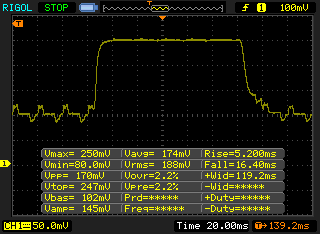 |
| ↘ 16 ms bajada | ||
| La pantalla mostró buenos tiempos de respuesta en nuestros tests pero podría ser demasiado lenta para los jugones competitivos. En comparación, todos los dispositivos de prueba van de ##min### (mínimo) a 240 (máximo) ms. » 47 % de todos los dispositivos son mejores. Eso quiere decir que el tiempo de respuesta es similar al dispositivo testado medio (19.9 ms). | ||
| ↔ Tiempo de respuesta 50% Gris a 80% Gris | ||
| 43 ms ... subida ↗ y bajada ↘ combinada | ↗ 21 ms subida | 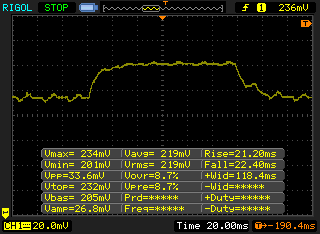 |
| ↘ 22 ms bajada | ||
| La pantalla mostró tiempos de respuesta lentos en nuestros tests y podría ser demasiado lenta para los jugones. En comparación, todos los dispositivos de prueba van de ##min### (mínimo) a 636 (máximo) ms. » 71 % de todos los dispositivos son mejores. Eso quiere decir que el tiempo de respuesta es peor que la media (31.1 ms) de todos los dispositivos testados. | ||
Parpadeo de Pantalla / PWM (Pulse-Width Modulation)
| Parpadeo de Pantalla / PWM no detectado | ||
Comparación: 52 % de todos los dispositivos testados no usaron PWM para atenuar el display. Si se usó, medimos una media de 7798 (mínimo: 5 - máxmo: 343500) Hz. | ||
| PCMark 8 - Home Score Accelerated v2 | |
| Lenovo IdeaPad 510-15IKB 80SV0087GE | |
| Lenovo Ideapad 310-15ISK | |
| Lenovo Ideapad 310-15IKB | |
| Medion Akoya P6670 | |
| HP 250 G5 SP X0N33EA | |
| Acer Aspire E5-774-54HJ | |
| PCMark 8 Home Score Accelerated v2 | 3457 puntos | |
ayuda | ||
| Lenovo Ideapad 310-15IKB Hynix HFS128G3MND | Lenovo IdeaPad 510-15IKB 80SV0087GE Liteonit CV3-DE256 | HP 250 G5 SP X0N33EA SanDisk Z400s SD8SNAT-256G | Medion Akoya P6670 Phison S11-128G | Dell XPS 13 9360 FHD i5 Toshiba NVMe THNSN5256GPUK | |
|---|---|---|---|---|---|
| AS SSD | 24% | -1% | 15% | 75% | |
| Seq Read (MB/s) | 511 | 479.8 -6% | 495.8 -3% | 492.2 -4% | 1179 131% |
| Seq Write (MB/s) | 200.6 | 377.8 88% | 316.9 58% | 385.2 92% | 372.8 86% |
| 4K Read (MB/s) | 24.49 | 32.4 32% | 19.37 -21% | 40.83 67% | 29.52 21% |
| 4K Write (MB/s) | 63.6 | 59.7 -6% | 75.3 18% | 77.2 21% | 92 45% |
| 4K-64 Read (MB/s) | 302.9 | 345.5 14% | 137.4 -55% | 371.3 23% | 723 139% |
| 4K-64 Write (MB/s) | 145.4 | 203.7 40% | 198.8 37% | 271.9 87% | 197.7 36% |
| Access Time Read * (ms) | 0.117 | 0.127 -9% | 0.111 5% | 0.174 -49% | 0.055 53% |
| Access Time Write * (ms) | 0.116 | 0.066 43% | 0.157 -35% | 0.321 -177% | 0.035 70% |
| Score Read (Points) | 378 | 426 13% | 206 -46% | 461 22% | 870 130% |
| Score Write (Points) | 229 | 301 31% | 306 34% | 388 69% | 327 43% |
* ... más pequeño es mejor

| 3DMark 11 - 1280x720 Performance GPU | |
| Medion Akoya P6670 | |
| Lenovo IdeaPad 510-15IKB 80SV0087GE | |
| Lenovo Ideapad 310-15ISK | |
| Lenovo Ideapad 310-15IKB | |
| HP 250 G5 SP X0N33EA | |
| 3DMark 11 Performance | 1621 puntos | |
| 3DMark Cloud Gate Standard Score | 5728 puntos | |
| 3DMark Fire Strike Score | 825 puntos | |
ayuda | ||
| bajo | medio | alto | ultra | |
|---|---|---|---|---|
| BioShock Infinite (2013) | 54.1 | 31.21 | 25.79 | |
| Company of Heroes 2 (2013) | 24.62 | 18.7 | ||
| Rise of the Tomb Raider (2016) | 19.8 |
Ruido
| Ocioso |
| 30.6 / 30.6 / 30.6 dB(A) |
| Carga |
| 36.8 / 38.2 dB(A) |
 | ||
30 dB silencioso 40 dB(A) audible 50 dB(A) ruidosamente alto |
||
min: | ||
(+) La temperatura máxima en la parte superior es de 34.1 °C / 93 F, frente a la media de 34.3 °C / 94 F, que oscila entre 21.2 y 62.5 °C para la clase Office.
(+) El fondo se calienta hasta un máximo de 35.6 °C / 96 F, frente a la media de 36.8 °C / 98 F
(+) En reposo, la temperatura media de la parte superior es de 25 °C / 77# F, frente a la media del dispositivo de 29.5 °C / 85 F.
(+) El reposamanos y el panel táctil están a una temperatura inferior a la de la piel, con un máximo de 30.2 °C / 86.4 F y, por tanto, son fríos al tacto.
(-) La temperatura media de la zona del reposamanos de dispositivos similares fue de 27.5 °C / 81.5 F (-2.7 °C / -4.9 F).
Lenovo Ideapad 310-15IKB análisis de audio
(±) | la sonoridad del altavoz es media pero buena (76 dB)
Graves 100 - 315 Hz
(±) | lubina reducida - en promedio 11% inferior a la mediana
(±) | la linealidad de los graves es media (13.8% delta a frecuencia anterior)
Medios 400 - 2000 Hz
(+) | medios equilibrados - a sólo 3.2% de la mediana
(±) | la linealidad de los medios es media (7.8% delta respecto a la frecuencia anterior)
Altos 2 - 16 kHz
(+) | máximos equilibrados - a sólo 2.4% de la mediana
(+) | los máximos son lineales (5.7% delta a la frecuencia anterior)
Total 100 - 16.000 Hz
(±) | la linealidad del sonido global es media (15.1% de diferencia con la mediana)
En comparación con la misma clase
» 14% de todos los dispositivos probados de esta clase eran mejores, 4% similares, 82% peores
» El mejor tuvo un delta de 7%, la media fue 21%, el peor fue ###max##%
En comparación con todos los dispositivos probados
» 21% de todos los dispositivos probados eran mejores, 4% similares, 75% peores
» El mejor tuvo un delta de 4%, la media fue 24%, el peor fue ###max##%
Apple MacBook 12 (Early 2016) 1.1 GHz análisis de audio
(+) | los altavoces pueden reproducir a un volumen relativamente alto (#83.6 dB)
Graves 100 - 315 Hz
(±) | lubina reducida - en promedio 11.3% inferior a la mediana
(±) | la linealidad de los graves es media (14.2% delta a frecuencia anterior)
Medios 400 - 2000 Hz
(+) | medios equilibrados - a sólo 2.4% de la mediana
(+) | los medios son lineales (5.5% delta a la frecuencia anterior)
Altos 2 - 16 kHz
(+) | máximos equilibrados - a sólo 2% de la mediana
(+) | los máximos son lineales (4.5% delta a la frecuencia anterior)
Total 100 - 16.000 Hz
(+) | el sonido global es lineal (10.2% de diferencia con la mediana)
En comparación con la misma clase
» 7% de todos los dispositivos probados de esta clase eran mejores, 2% similares, 91% peores
» El mejor tuvo un delta de 5%, la media fue 18%, el peor fue ###max##%
En comparación con todos los dispositivos probados
» 5% de todos los dispositivos probados eran mejores, 1% similares, 94% peores
» El mejor tuvo un delta de 4%, la media fue 24%, el peor fue ###max##%
| Off / Standby | |
| Ocioso | |
| Carga |
|
Clave:
min: | |
| Lenovo Ideapad 310-15IKB i5-7200U, HD Graphics 620, Hynix HFS128G3MND, TN LED, 1920x1080, 15.6" | Lenovo IdeaPad 510-15IKB 80SV0087GE i7-7500U, GeForce 940MX, Liteonit CV3-DE256, IPS, 1920x1080, 15.6" | HP 250 G5 SP X0N33EA 6200U, HD Graphics 520, SanDisk Z400s SD8SNAT-256G, TN, 1920x1080, 15.6" | Medion Akoya P6670 6200U, GeForce 940MX, Phison S11-128G, IPS, 1920x1080, 15.6" | Lenovo Ideapad 310-15ISK 6500U, GeForce 920MX, WDC Scorpio Blue WD10JPCX-24UE4T0, TN LED, 1366x768, 15.6" | |
|---|---|---|---|---|---|
| Power Consumption | -22% | 12% | -49% | -40% | |
| Idle Minimum * (Watt) | 3.5 | 3.9 -11% | 3.6 -3% | 6.7 -91% | 7 -100% |
| Idle Average * (Watt) | 6.1 | 7.4 -21% | 6 2% | 9.2 -51% | 8 -31% |
| Idle Maximum * (Watt) | 7 | 9.5 -36% | 6.4 9% | 9.7 -39% | 8.4 -20% |
| Load Average * (Watt) | 31.2 | 41 -31% | 26 17% | 40.6 -30% | 38.8 -24% |
| Load Maximum * (Watt) | 42.9 | 48 -12% | 28.1 34% | 58 -35% | 52.8 -23% |
* ... más pequeño es mejor
| Lenovo Ideapad 310-15IKB i5-7200U, HD Graphics 620, 30 Wh | Lenovo IdeaPad 510-15IKB 80SV0087GE i7-7500U, GeForce 940MX, 30 Wh | HP 250 G5 SP X0N33EA 6200U, HD Graphics 520, 41 Wh | Medion Akoya P6670 6200U, GeForce 940MX, 44 Wh | Lenovo Ideapad 310-15ISK 6500U, GeForce 920MX, 31 Wh | |
|---|---|---|---|---|---|
| Duración de Batería | 21% | 29% | 24% | 45% | |
| Reader / Idle (h) | 10.2 | 10.6 4% | |||
| WiFi v1.3 (h) | 3.8 | 4.6 21% | 5.8 53% | 4.7 24% | 5.5 45% |
| Load (h) | 1.4 | 1.8 29% | |||
| H.264 (h) | 5.2 |
Pro
Contra
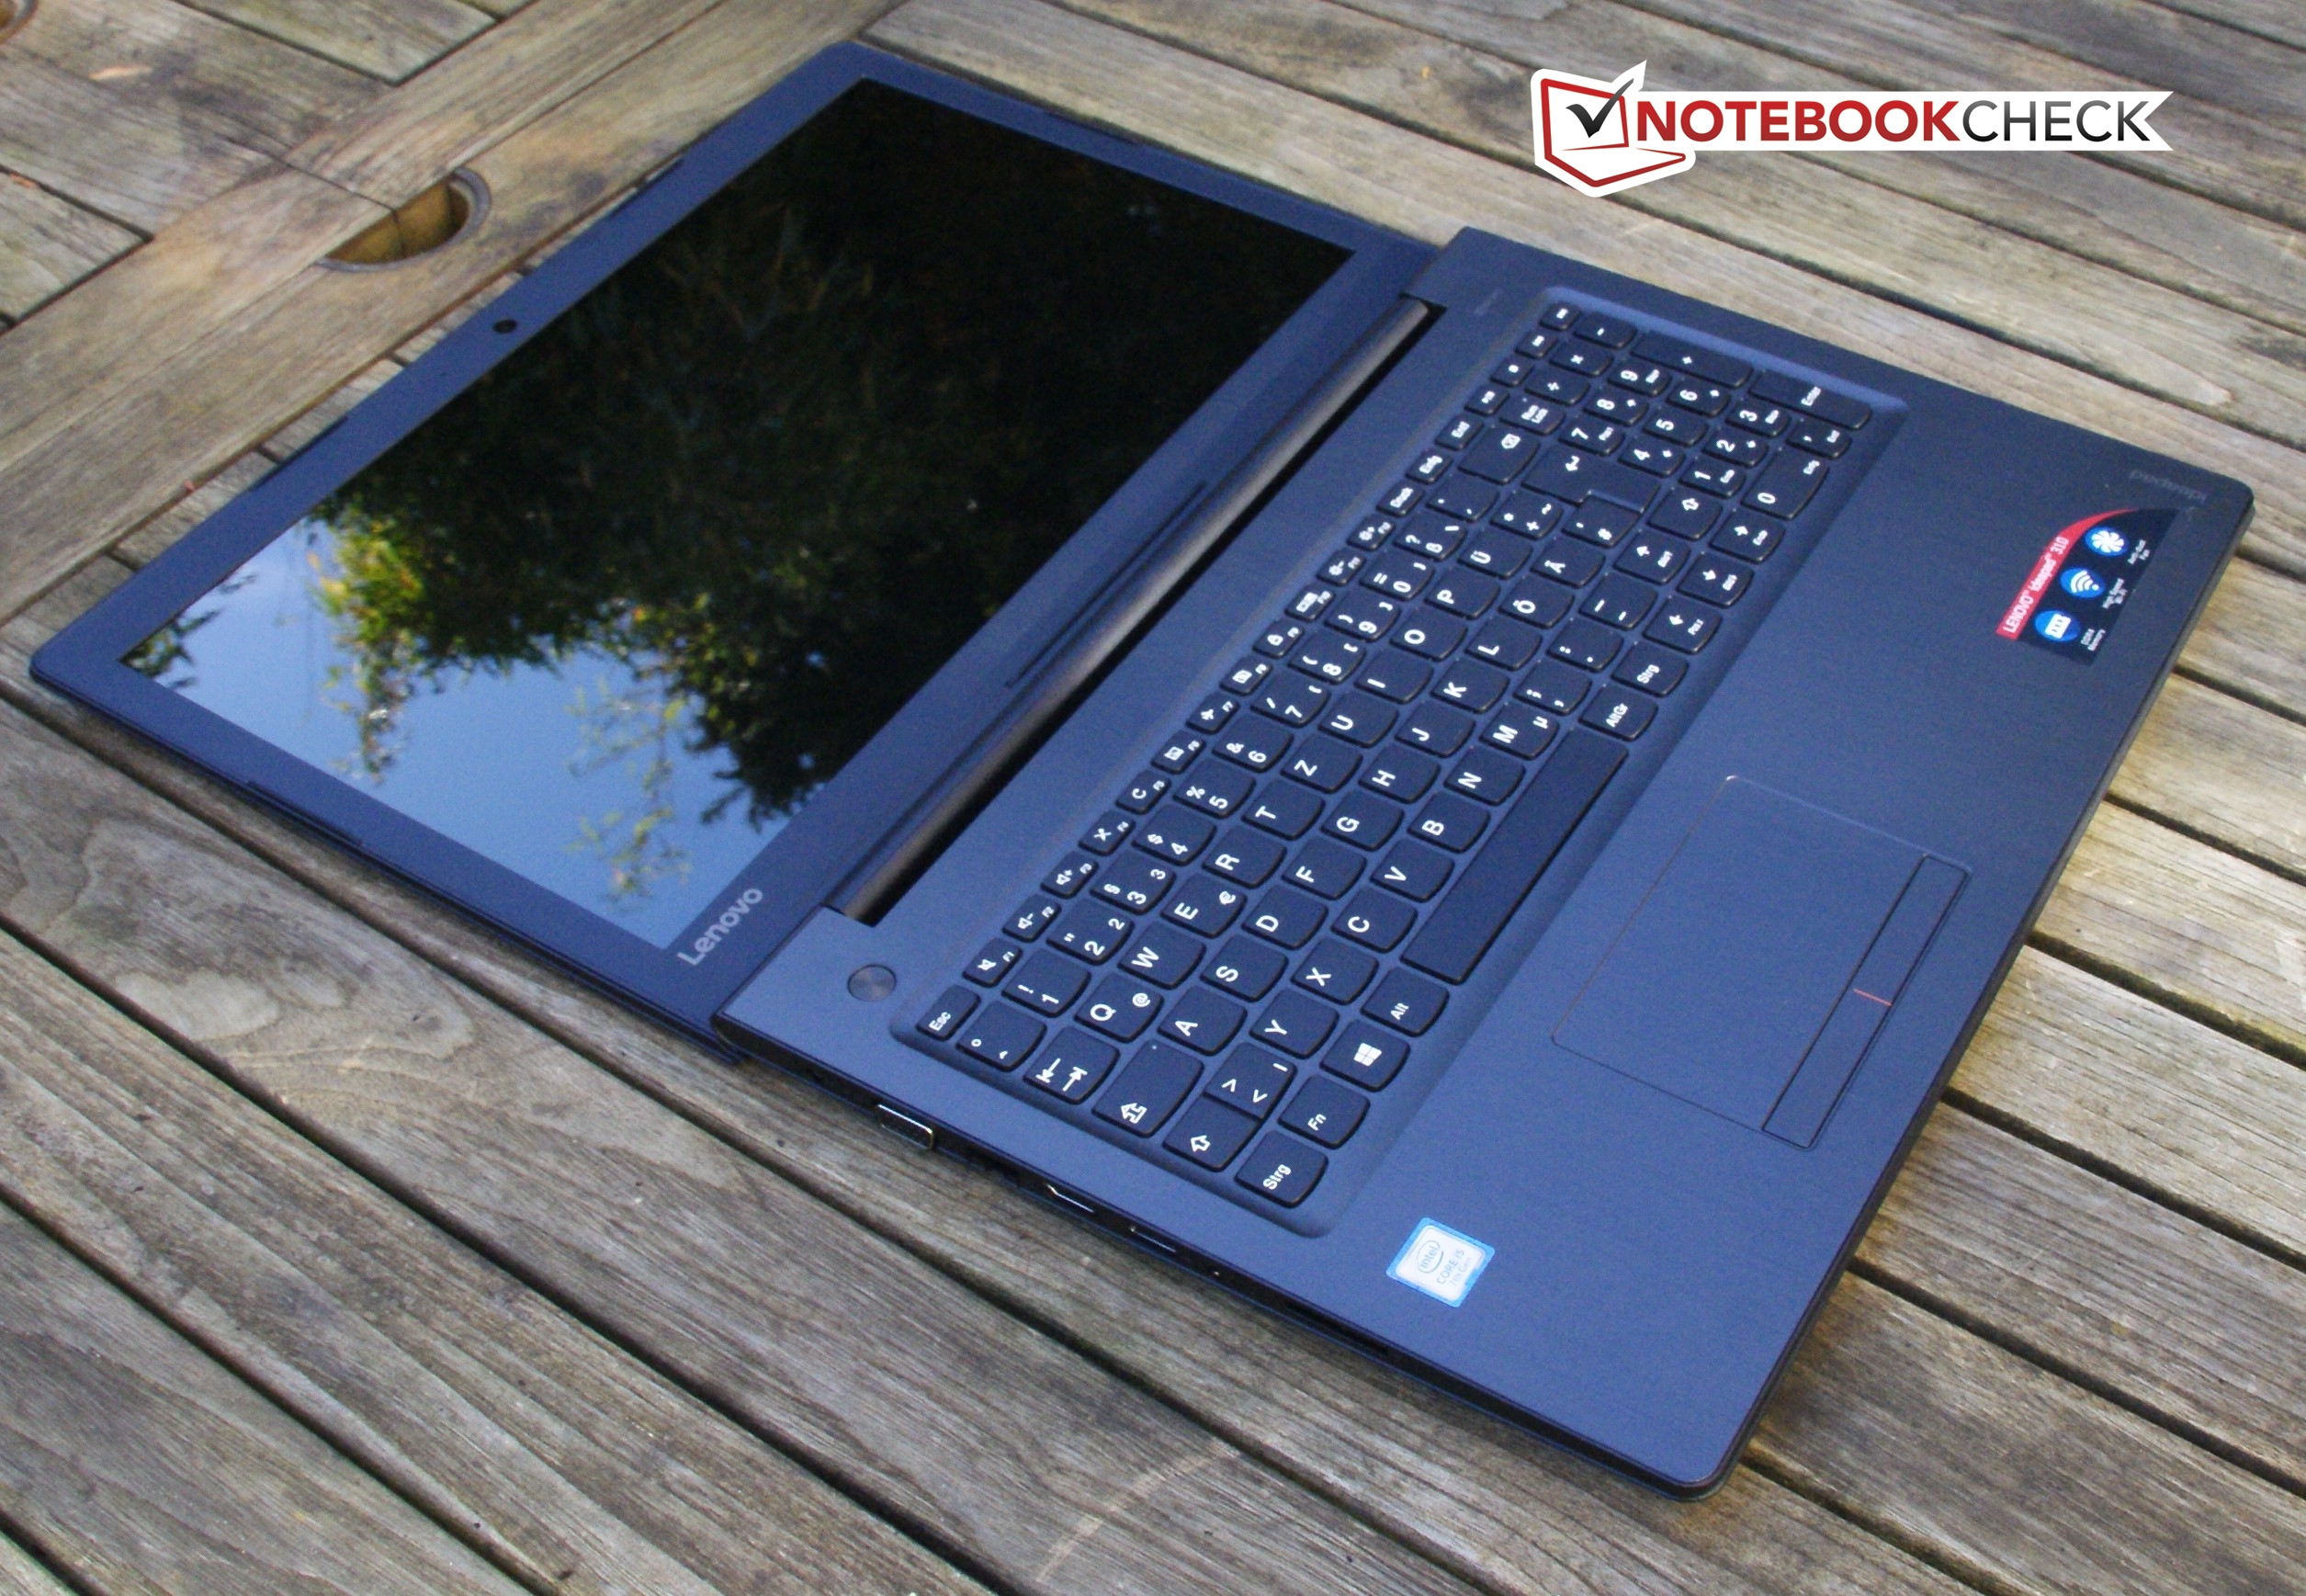
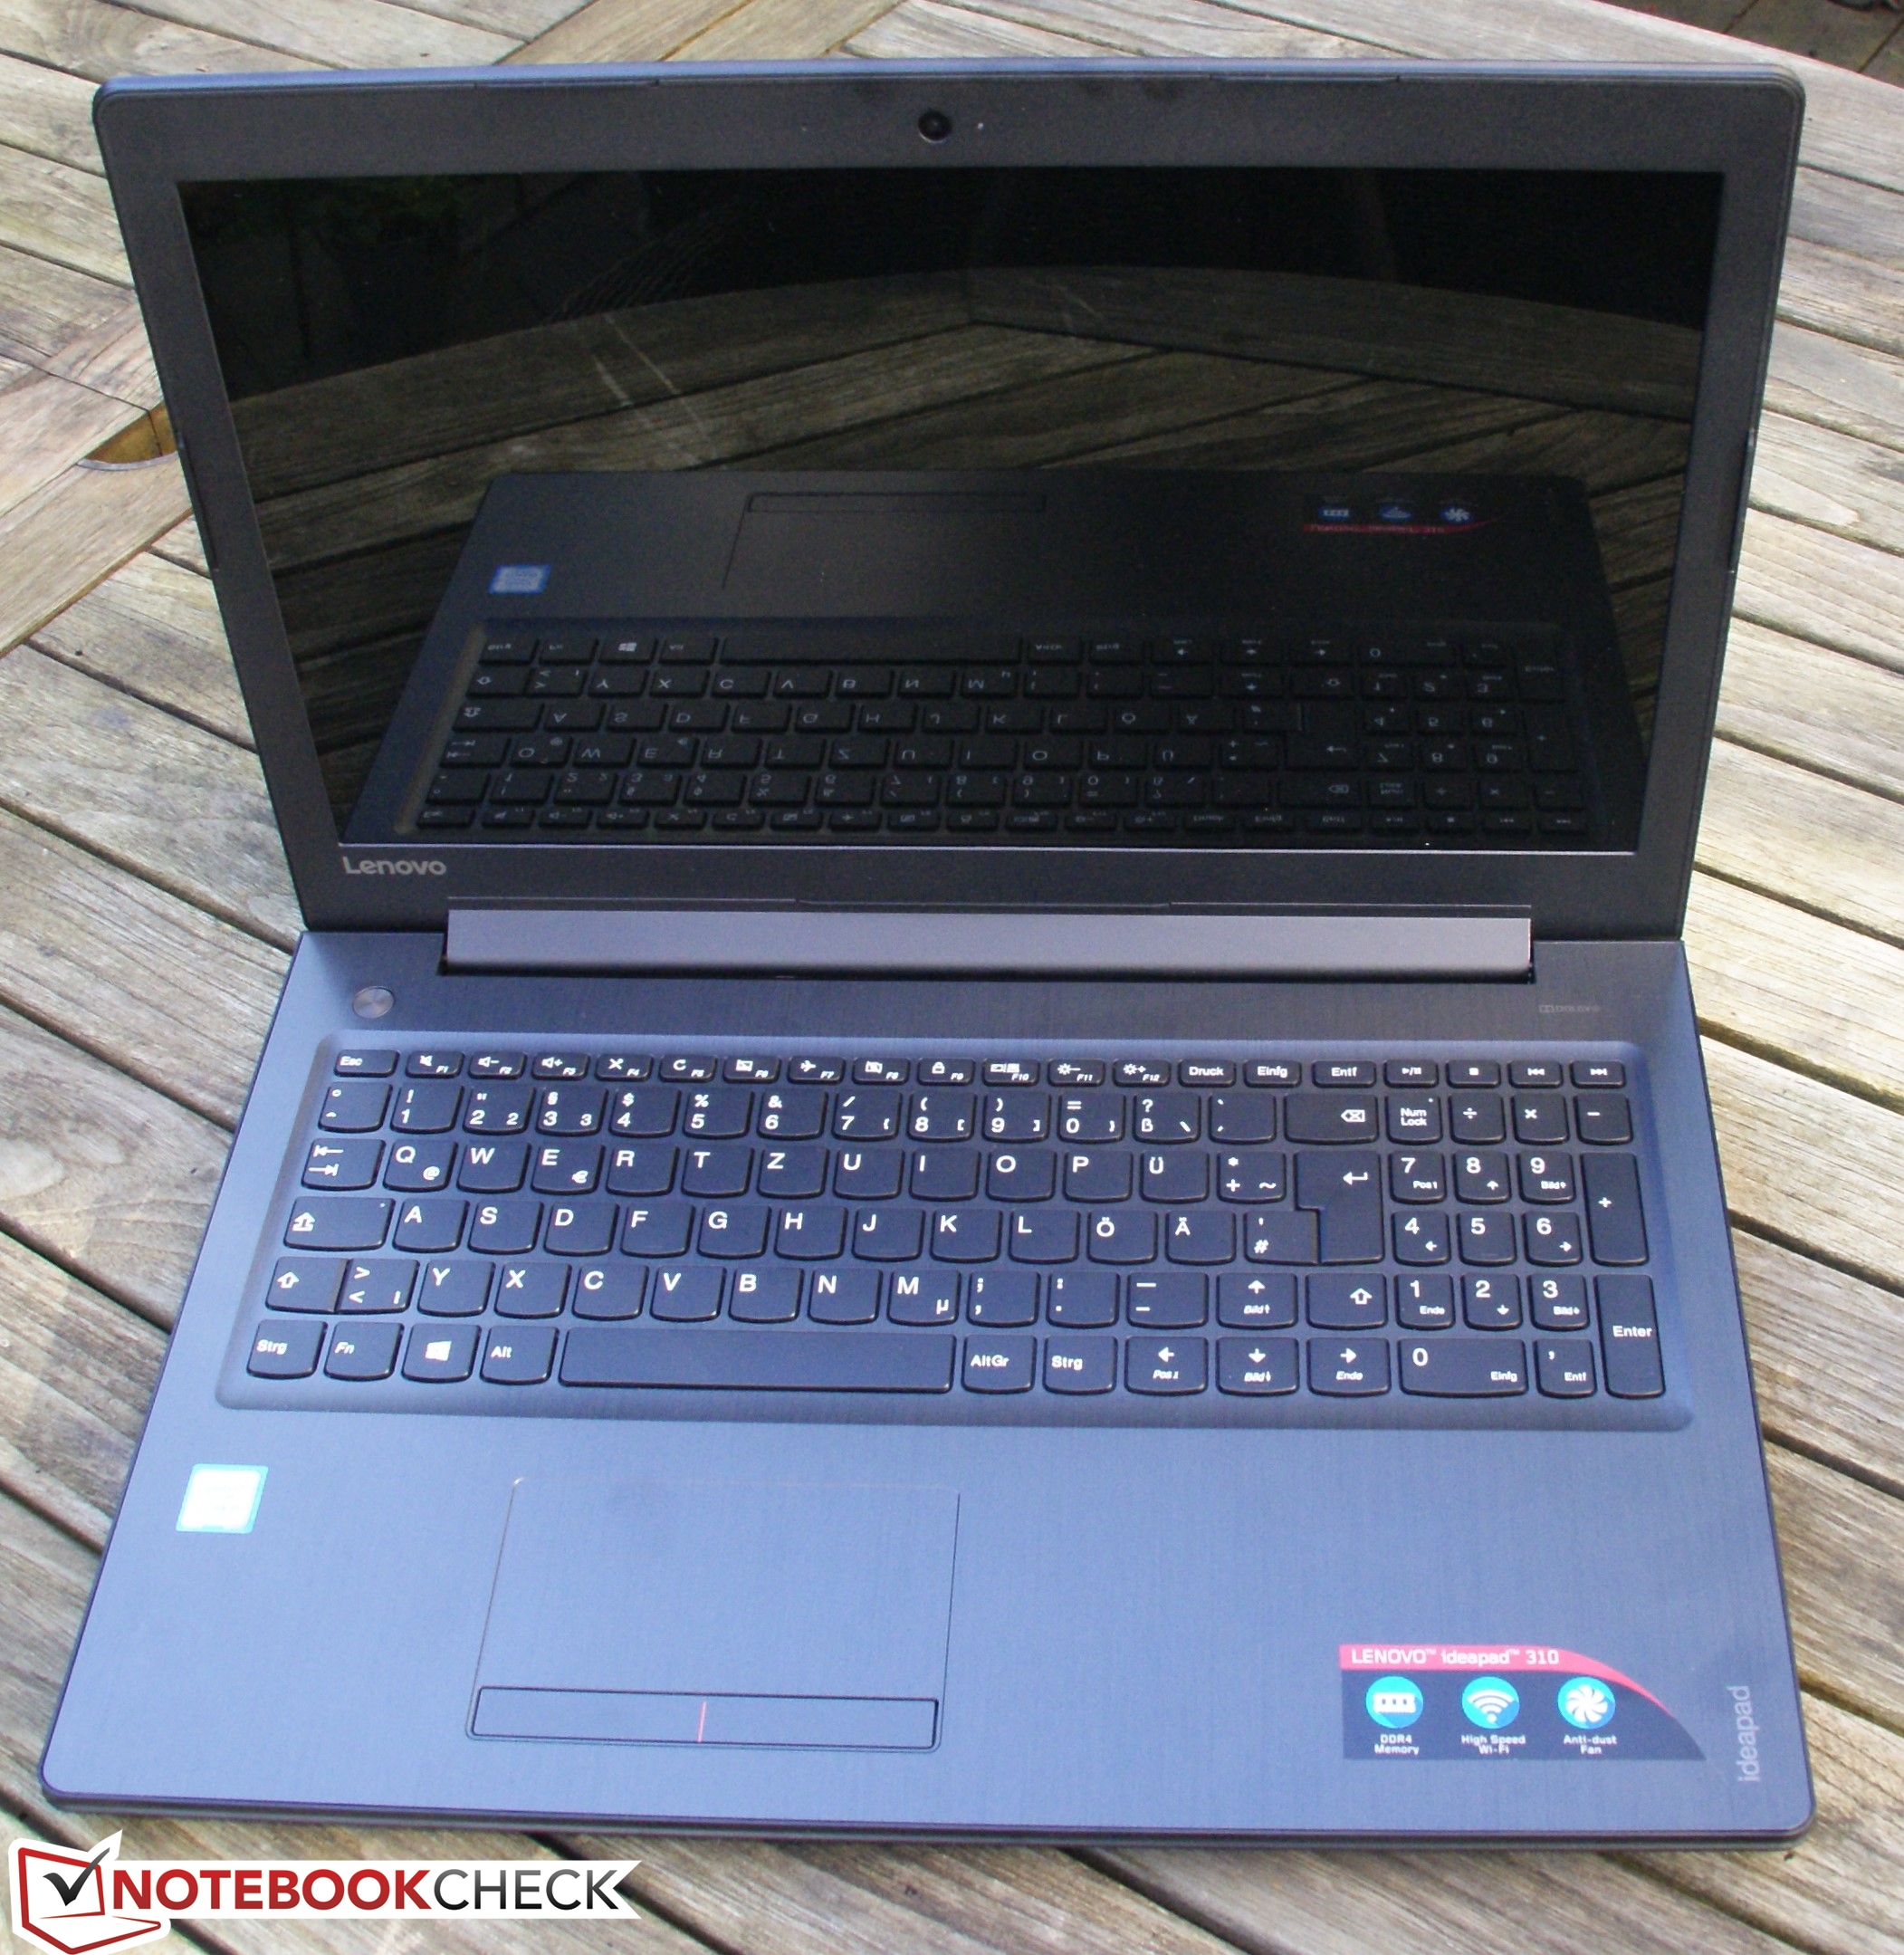
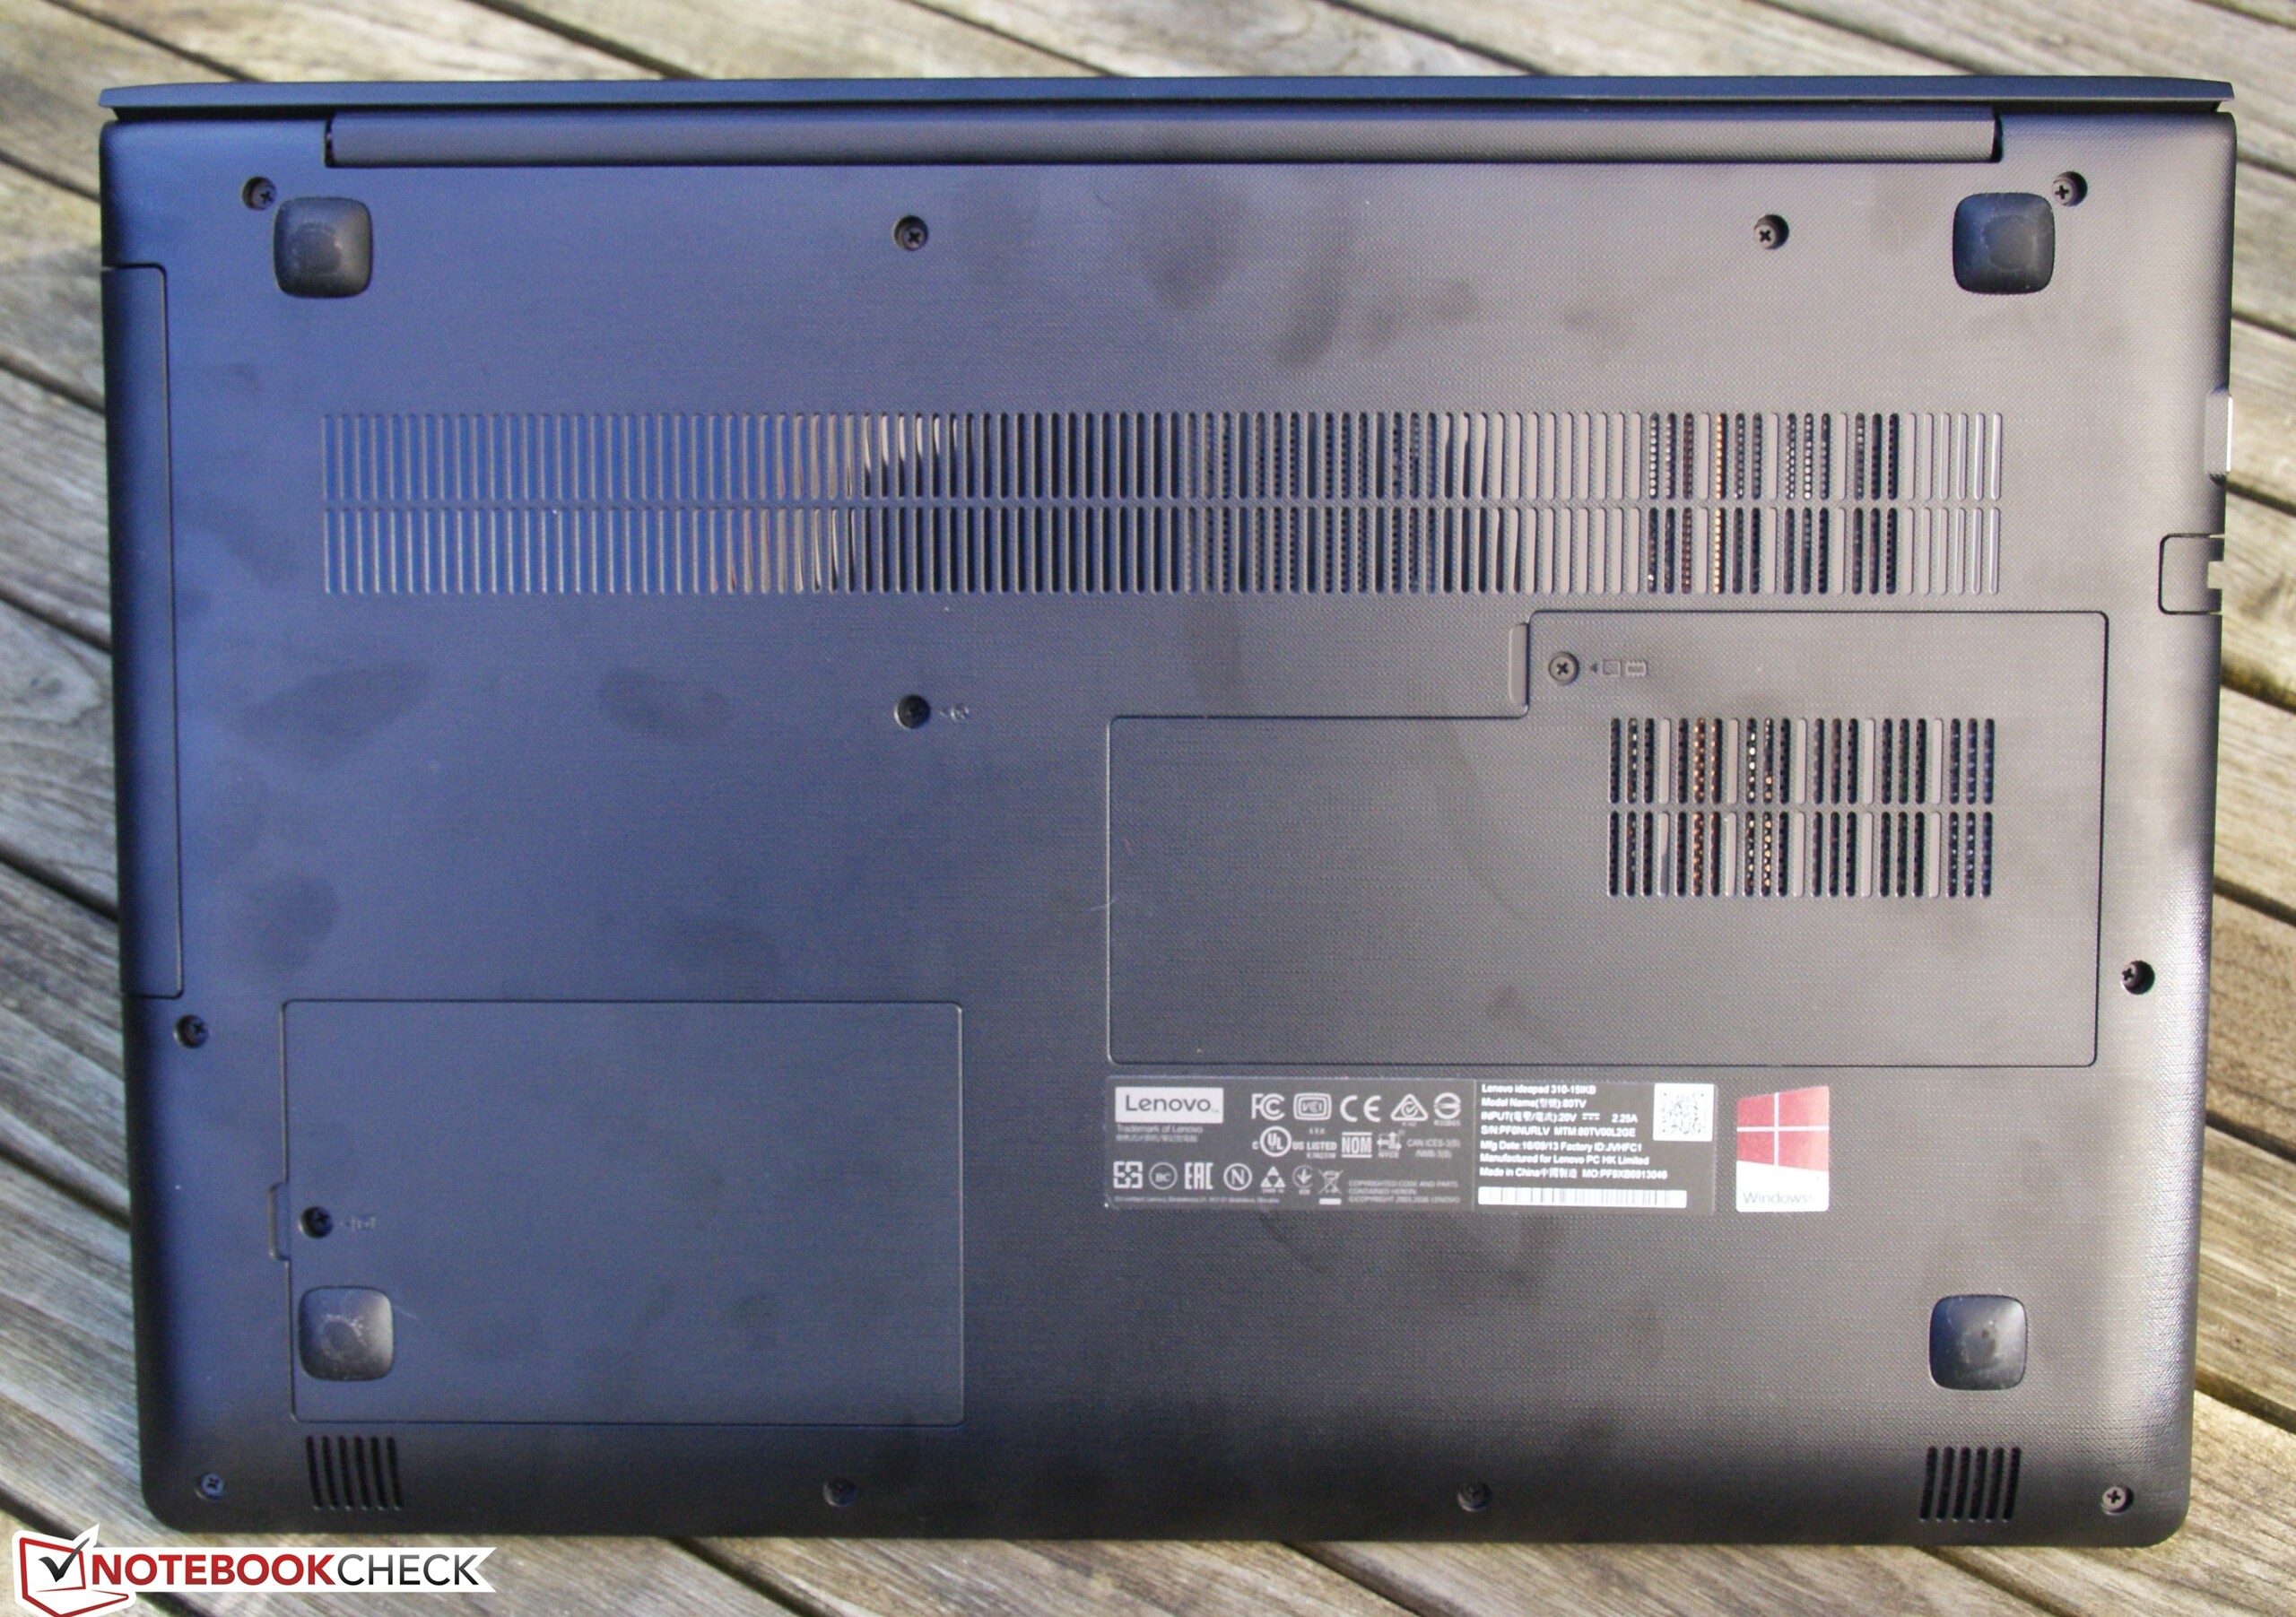
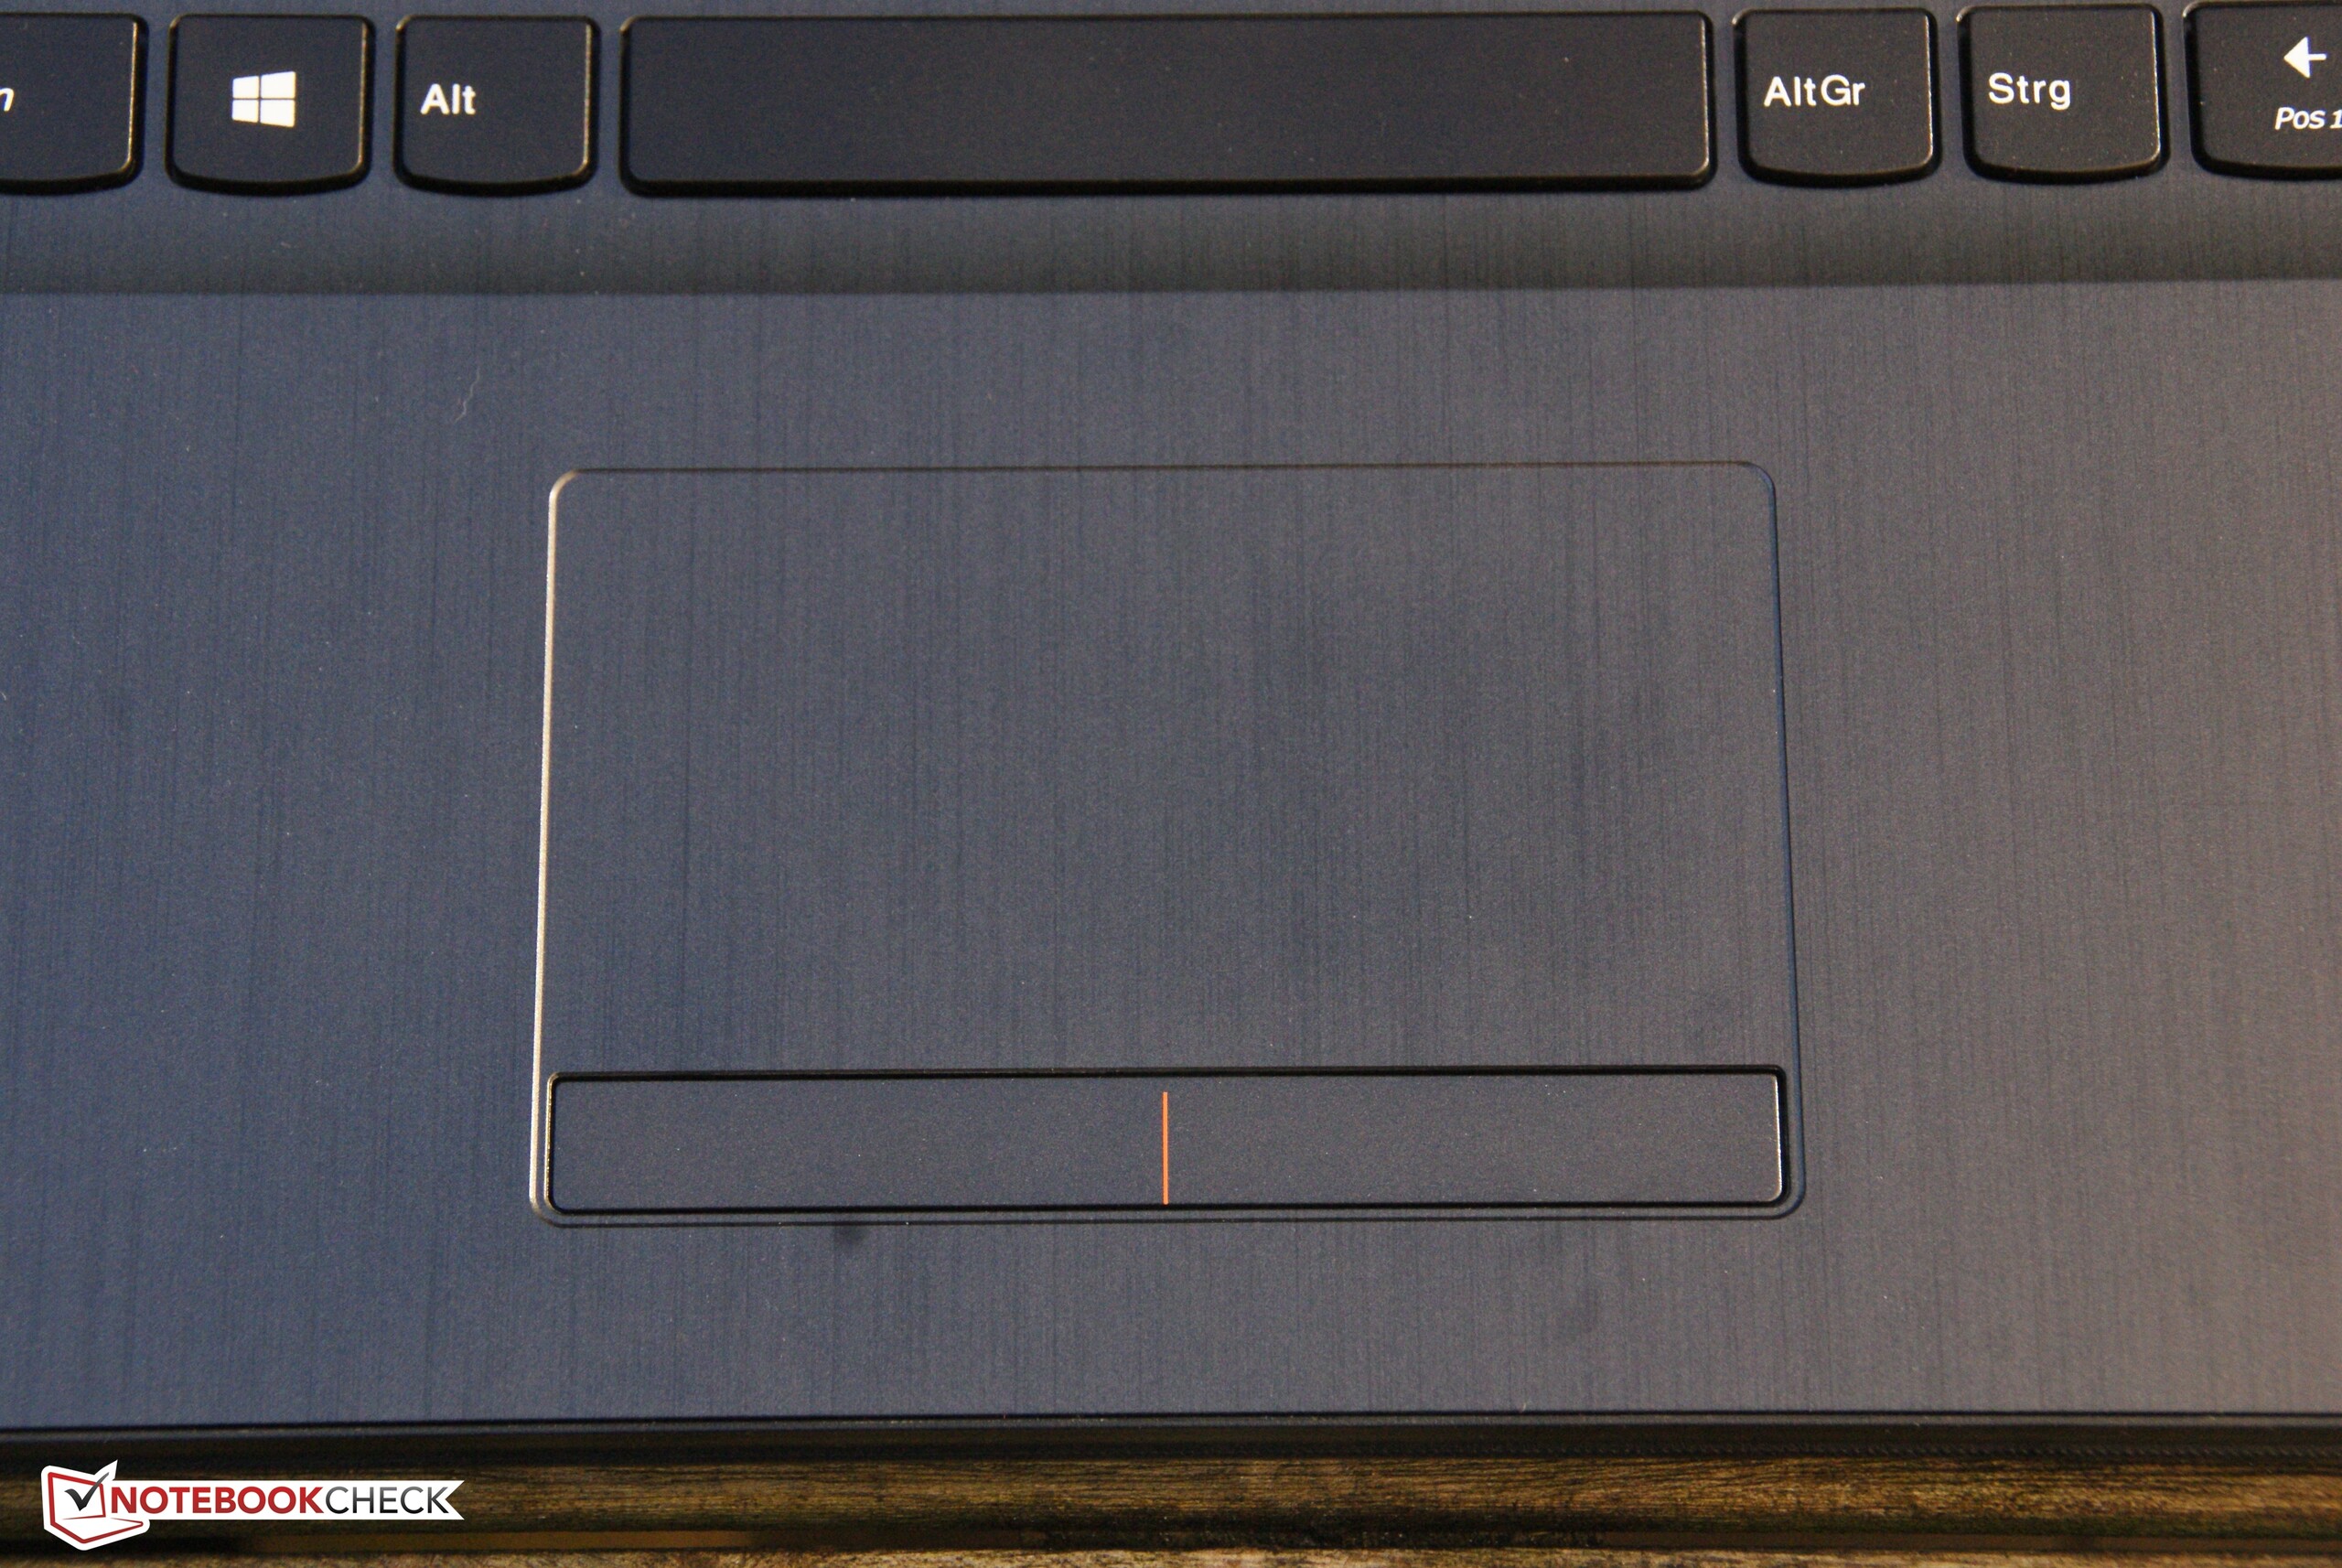
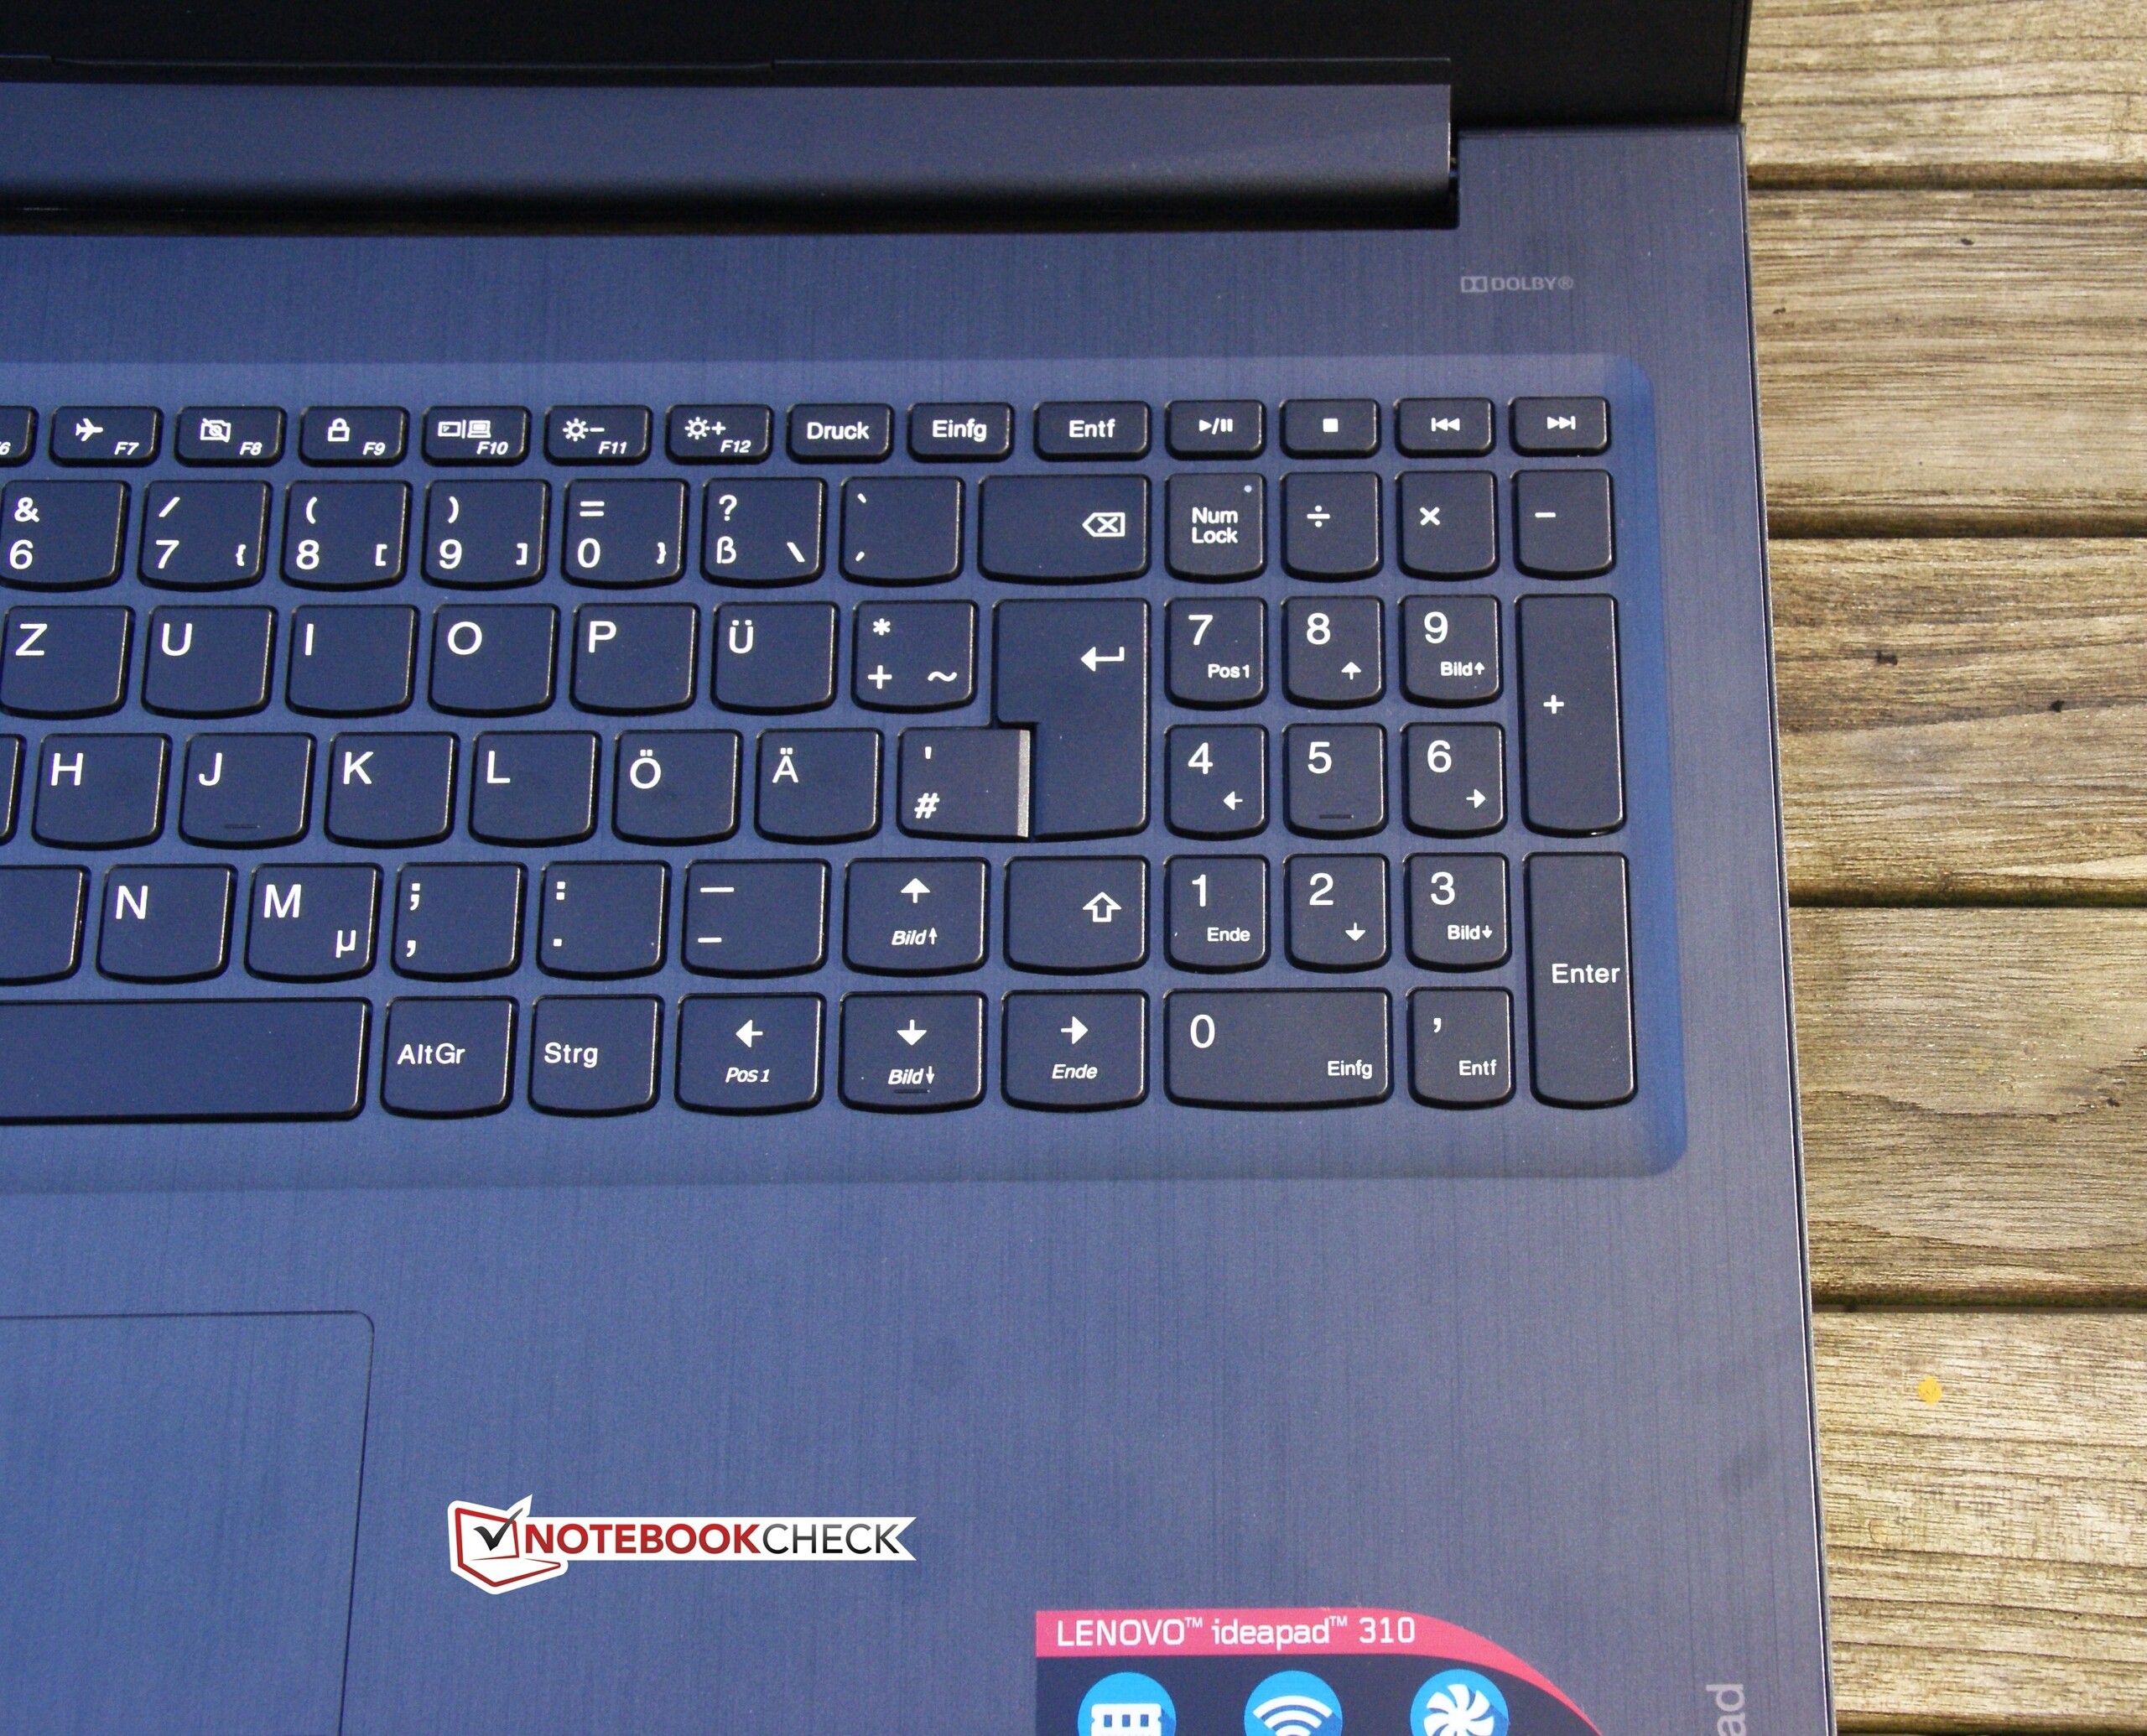
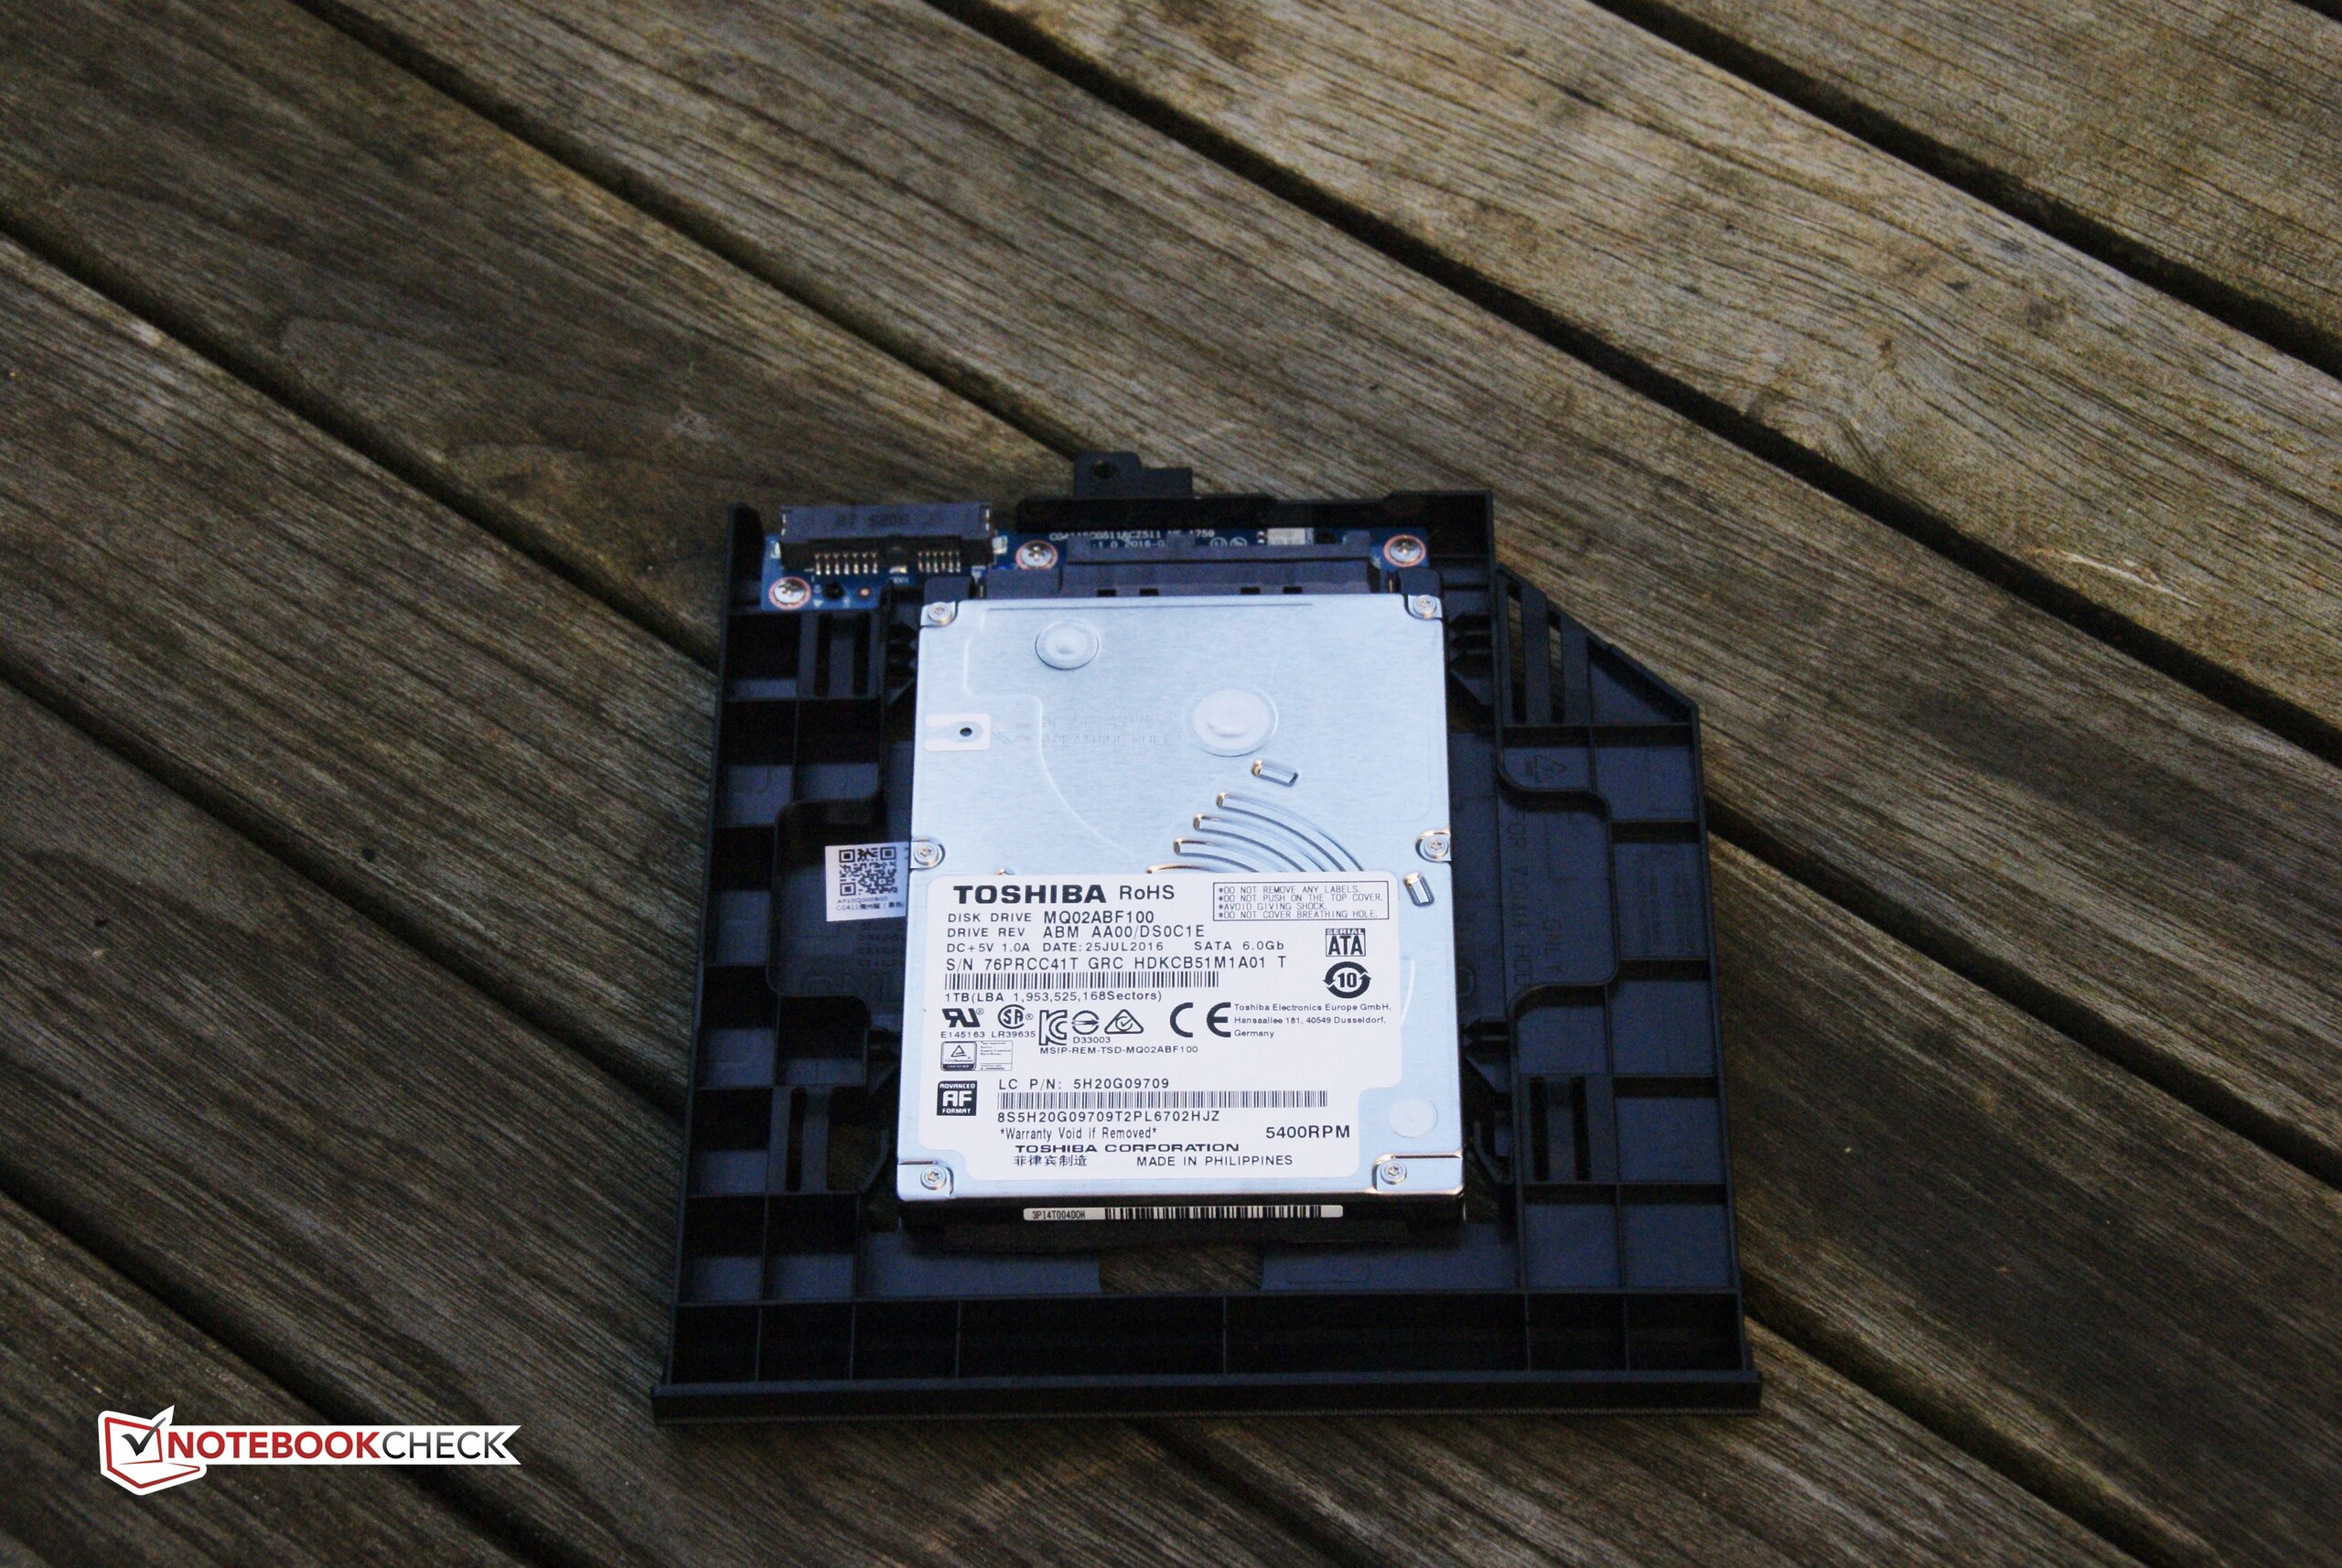
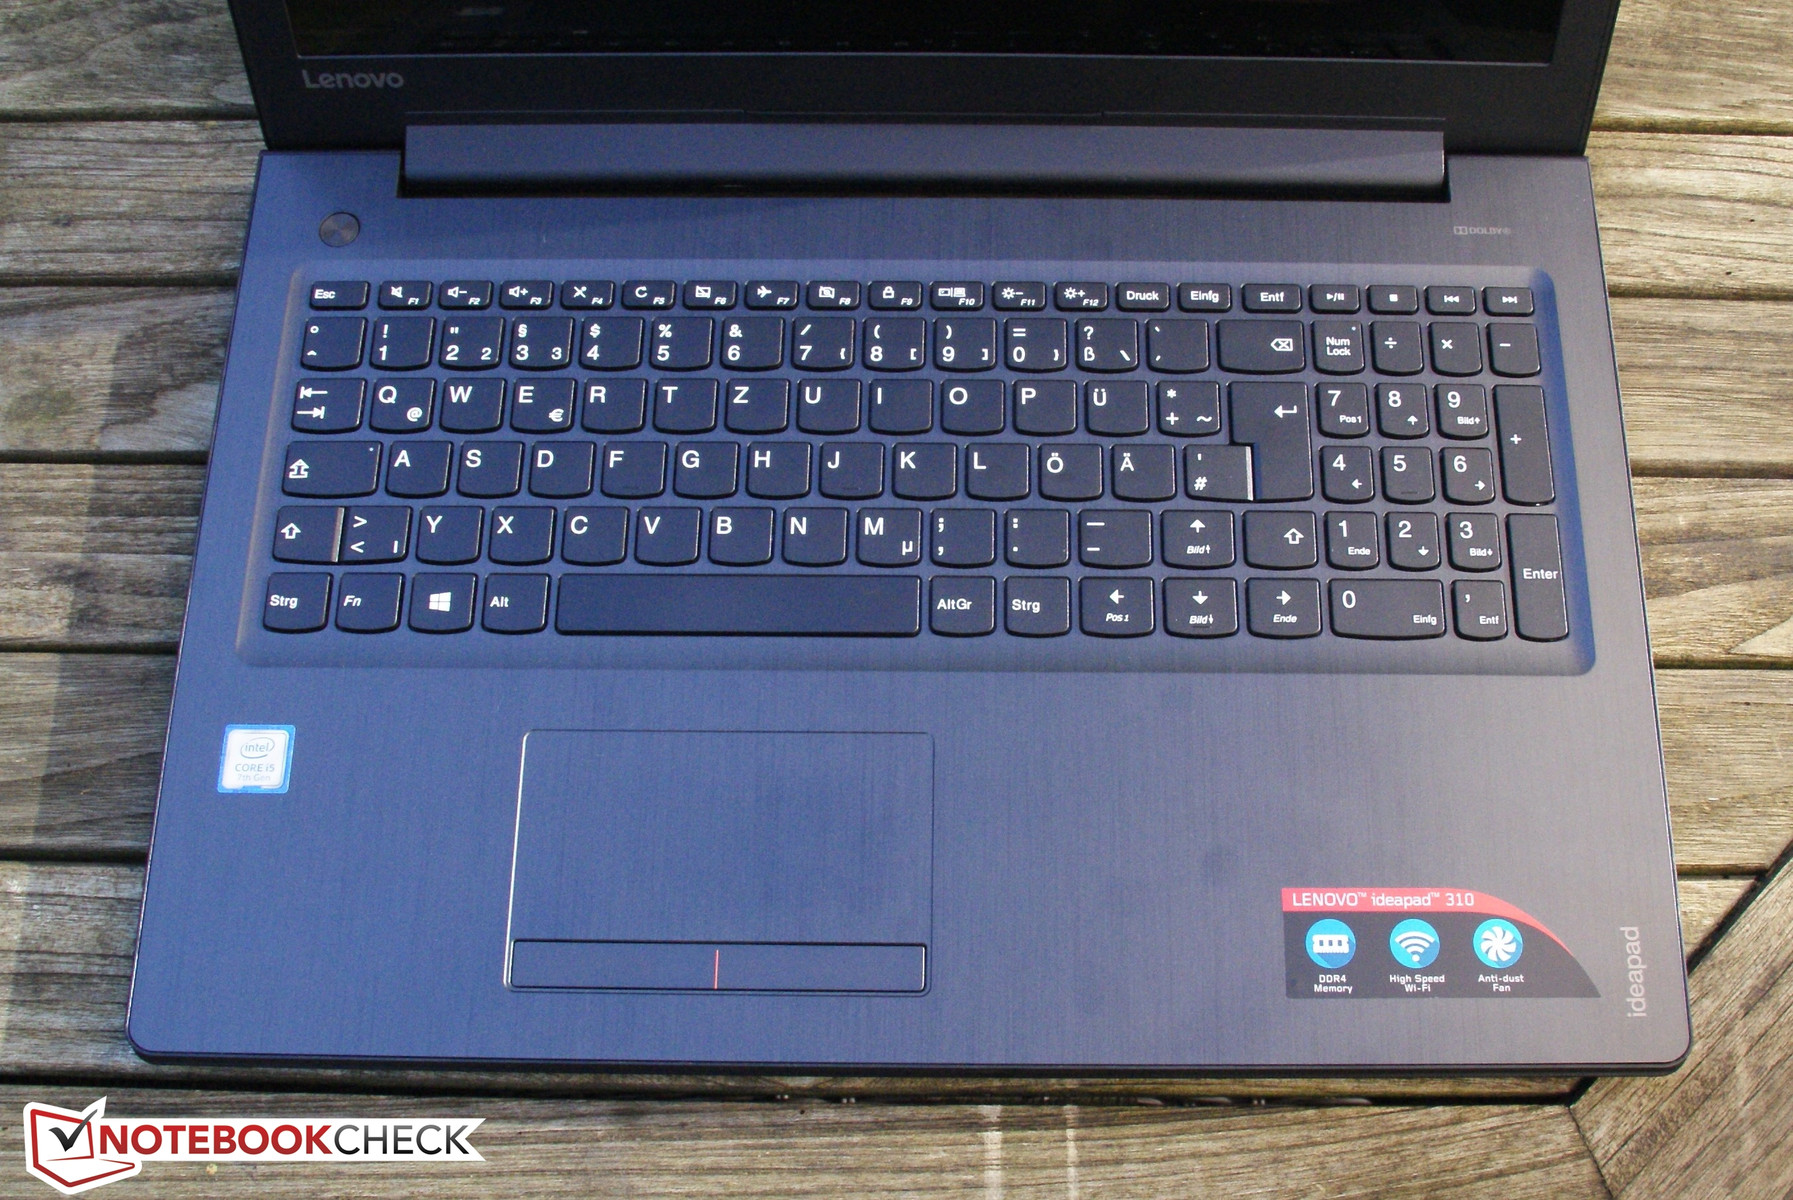
El Lenovo IdeaPad 310-15IKB pretende ser un todoterreno para el hogar y la oficina. Sin embargo, para ser un portátil multimedia de verdad, necesitaría tener una mejor pantalla y posiblemente una GPU más potente. Por otra parte, el portátil es definitivamente un buen portátil para la oficina a pesar de algunos puntos flacos. Si quieres trabajar en calma puede que este modelo no sea el adecuado, ya que el HDD hace ruido todo el rato. El problema puede solucionarse reemplazando el HDD por un SSD. Los botones del touchpad son poco cómodas de usar, pero el teclado es fiable. Trabajar en movilidad no es posible debido a la mala pantalla y a la escasa batería.
Al final del día, no encontramos razones convincentes para recomendar el IdeaPad. Está en la media y no destaca de la multitud en ningún aspecto.
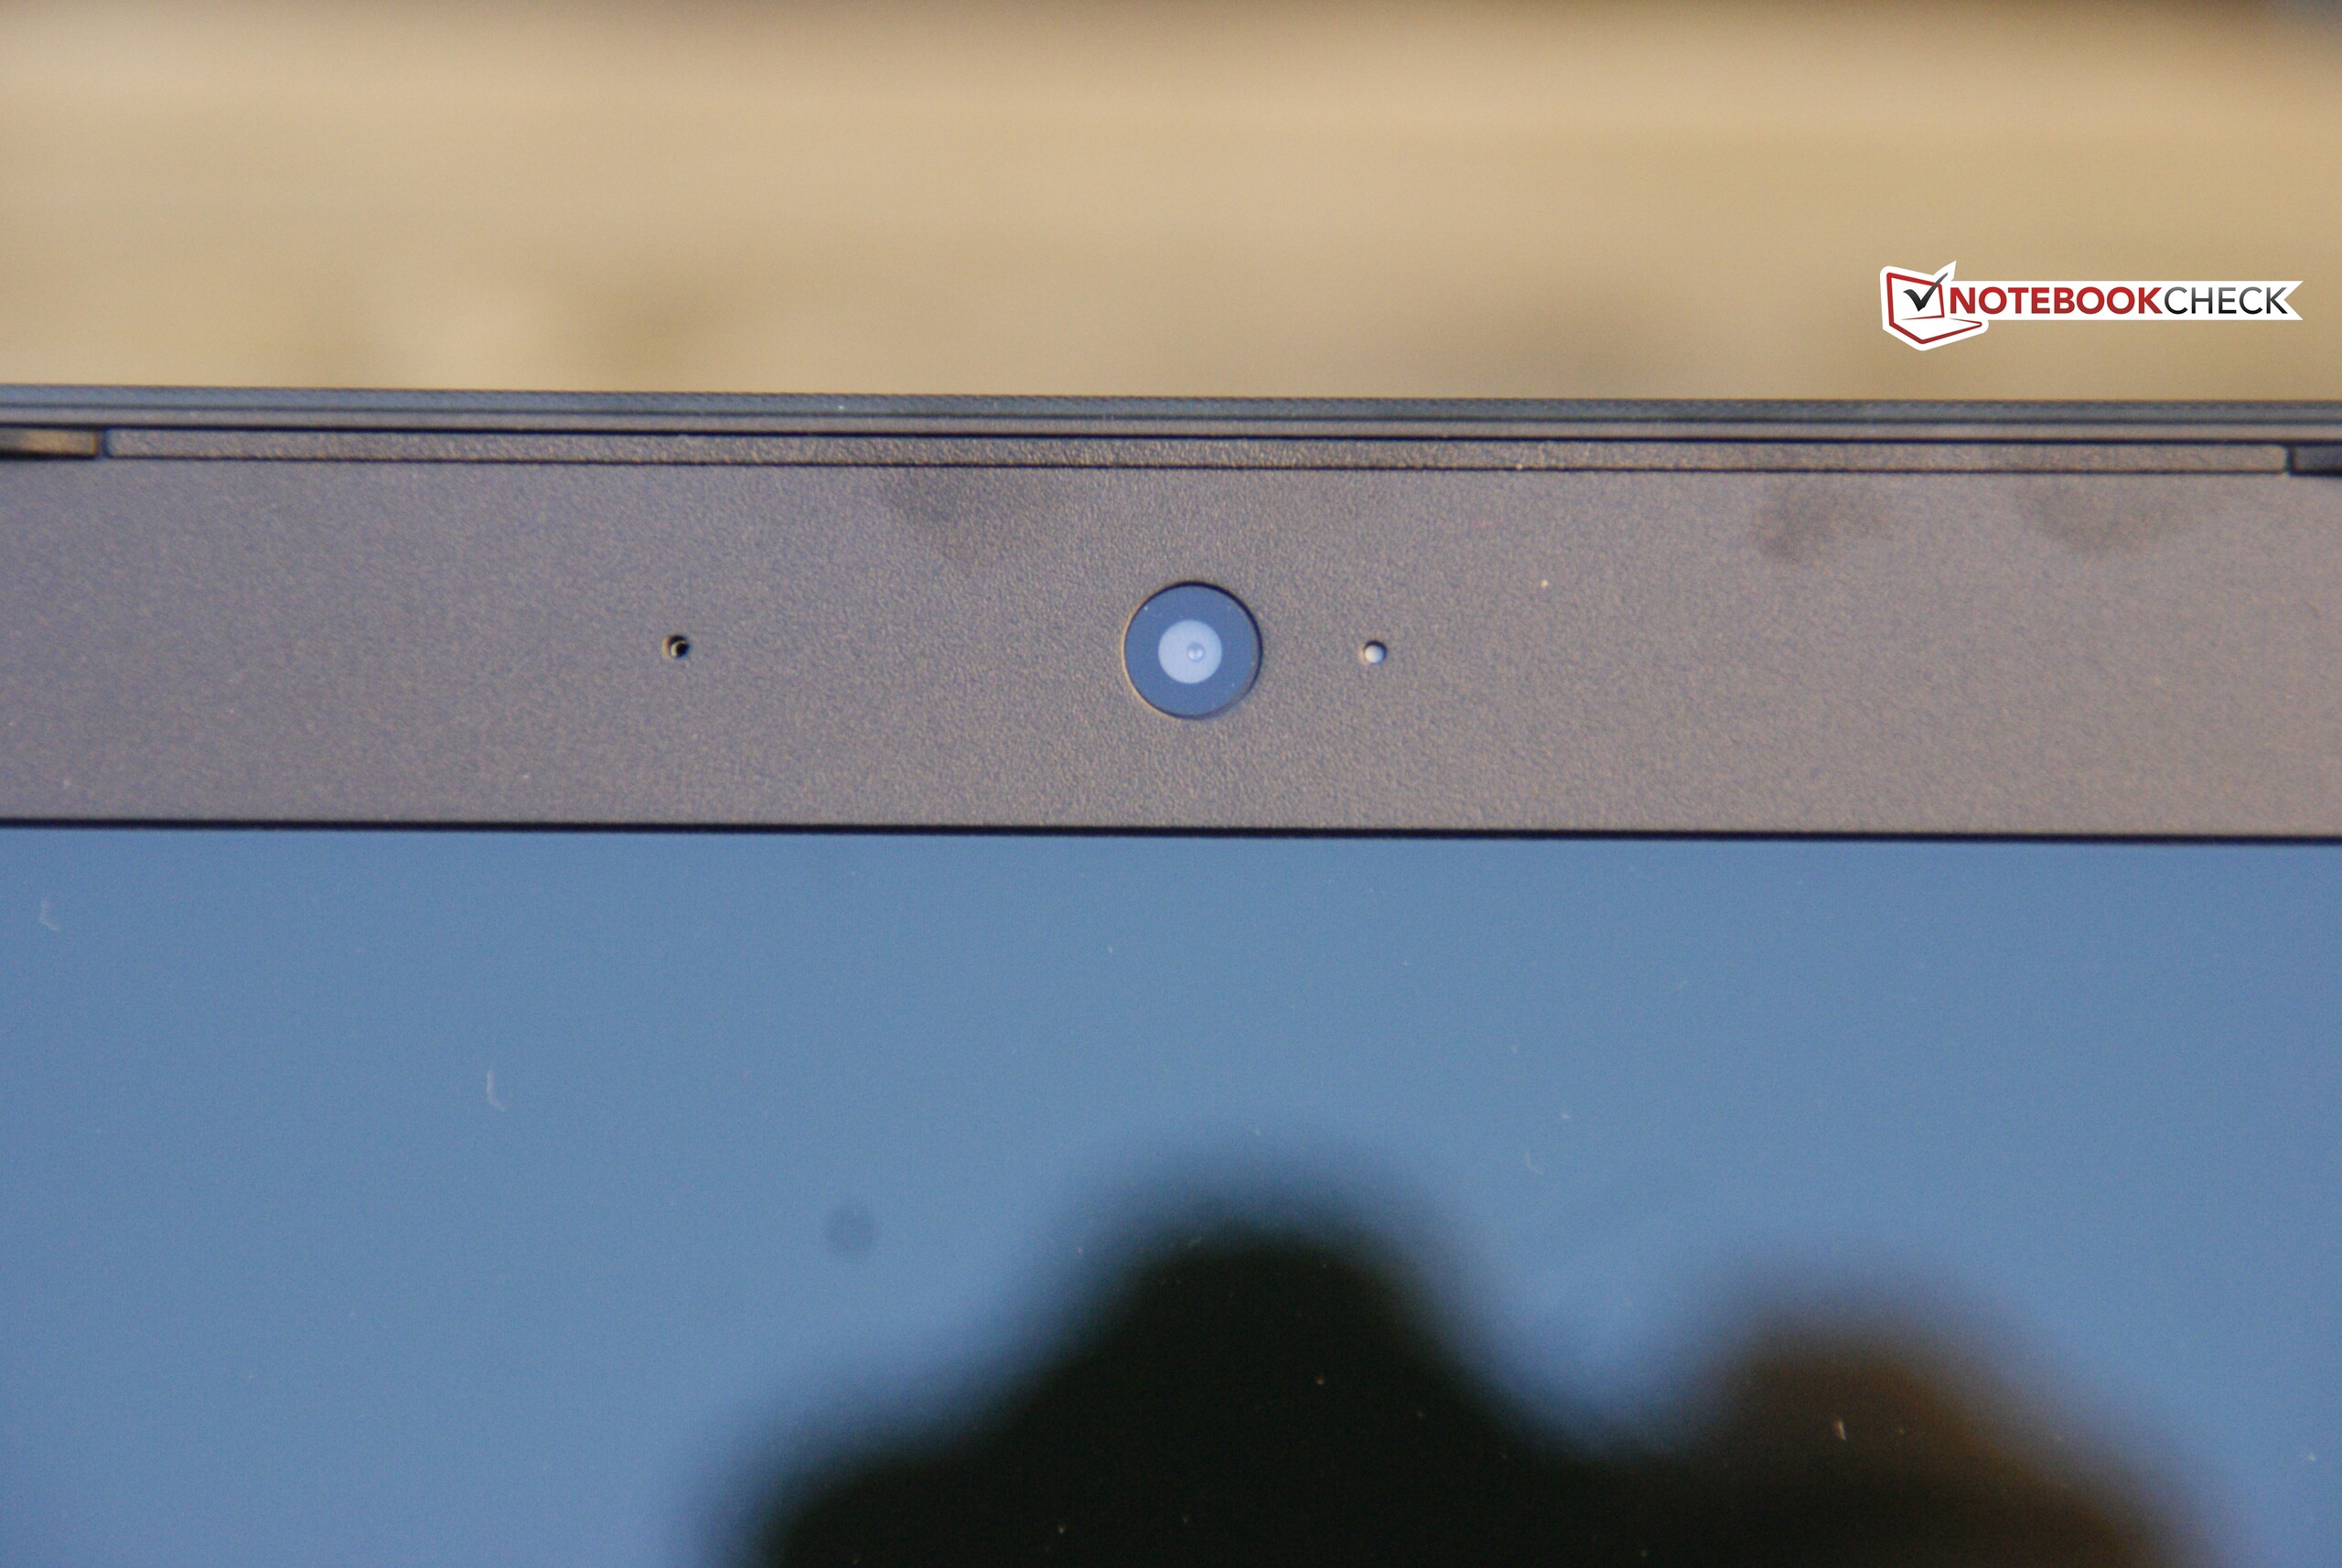
¿Por que deberías comprar el IdeaPad 310-15IKB? La razón principal es el precio. Este portátil es más barato que muchos de la competencia. Sin embargo, por otra parte, por poco más puedes obtener un mejor panel IPS. Este punto es particularmente importante, ya que la mala calidad del panel de nuestro modelo de prueba es uno de sus fallos más obvios.
Ésta es una versión acortada del análisis original. Puedes leer el análisis completo en inglés aquí.
Lenovo Ideapad 310-15IKB
- 11/29/2016 v5.1 (old)
Benjamin Herzig