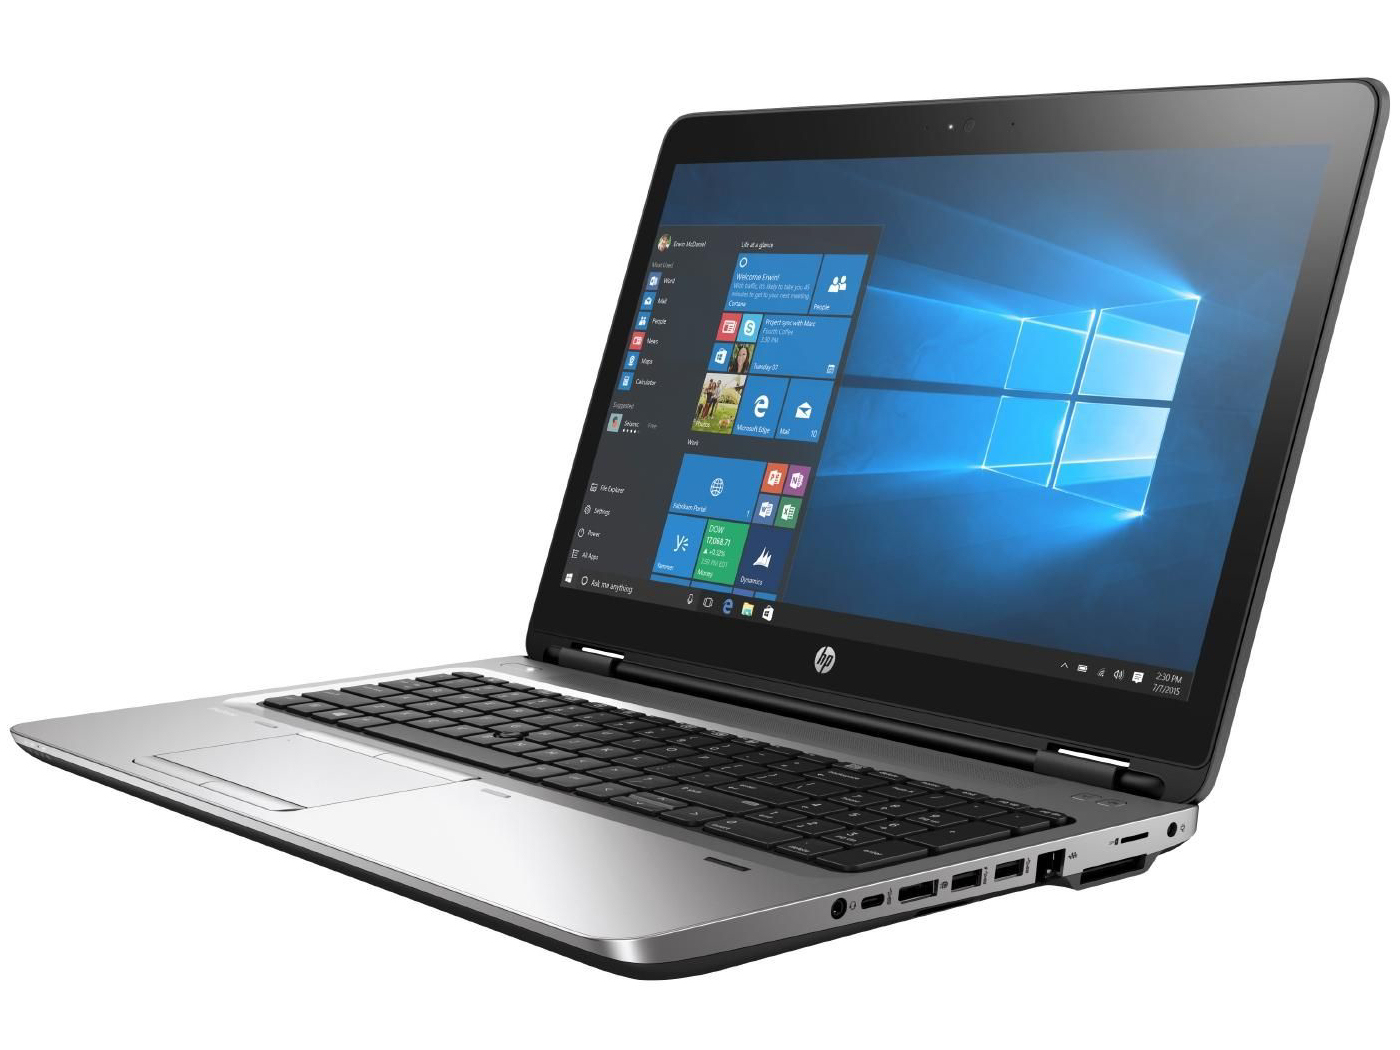
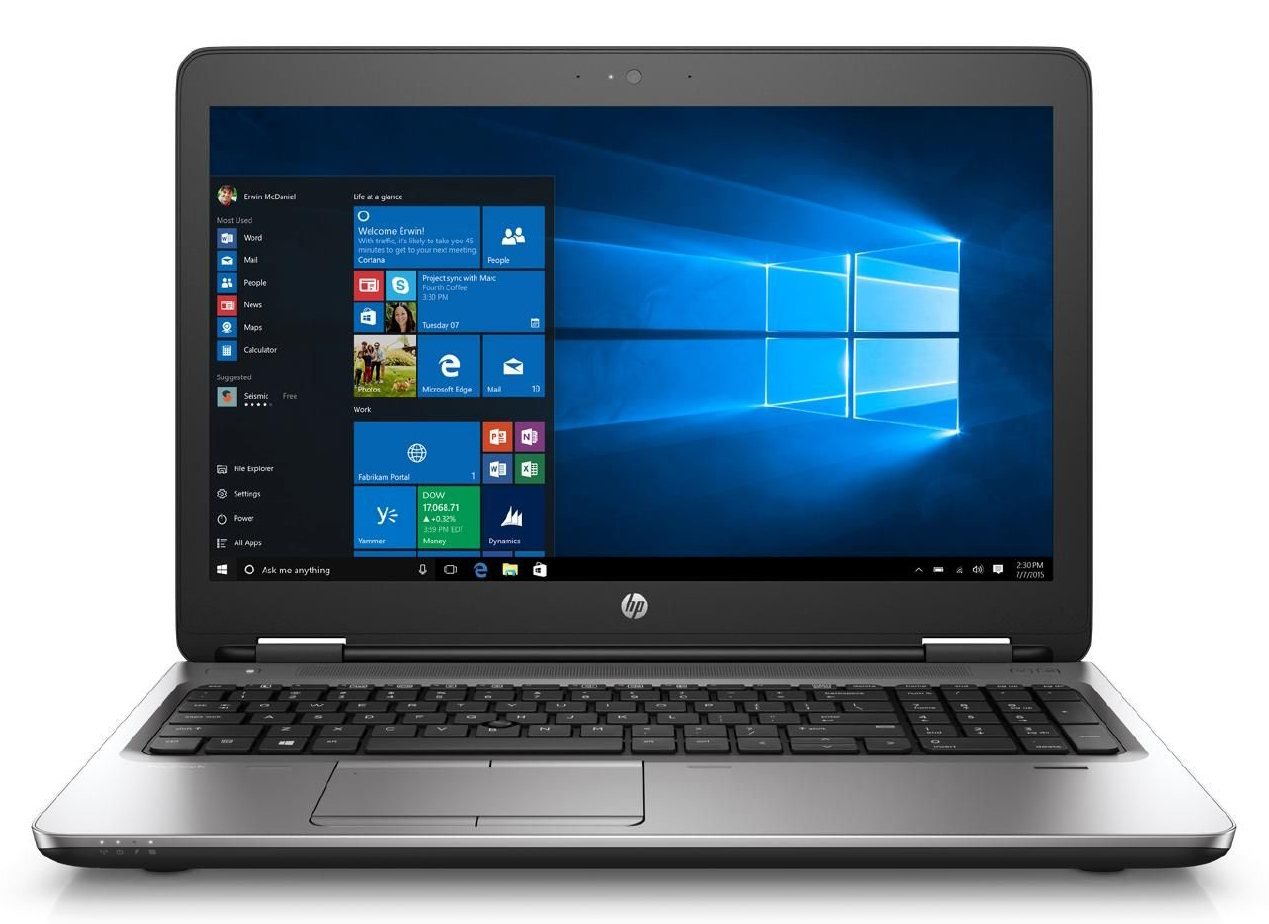
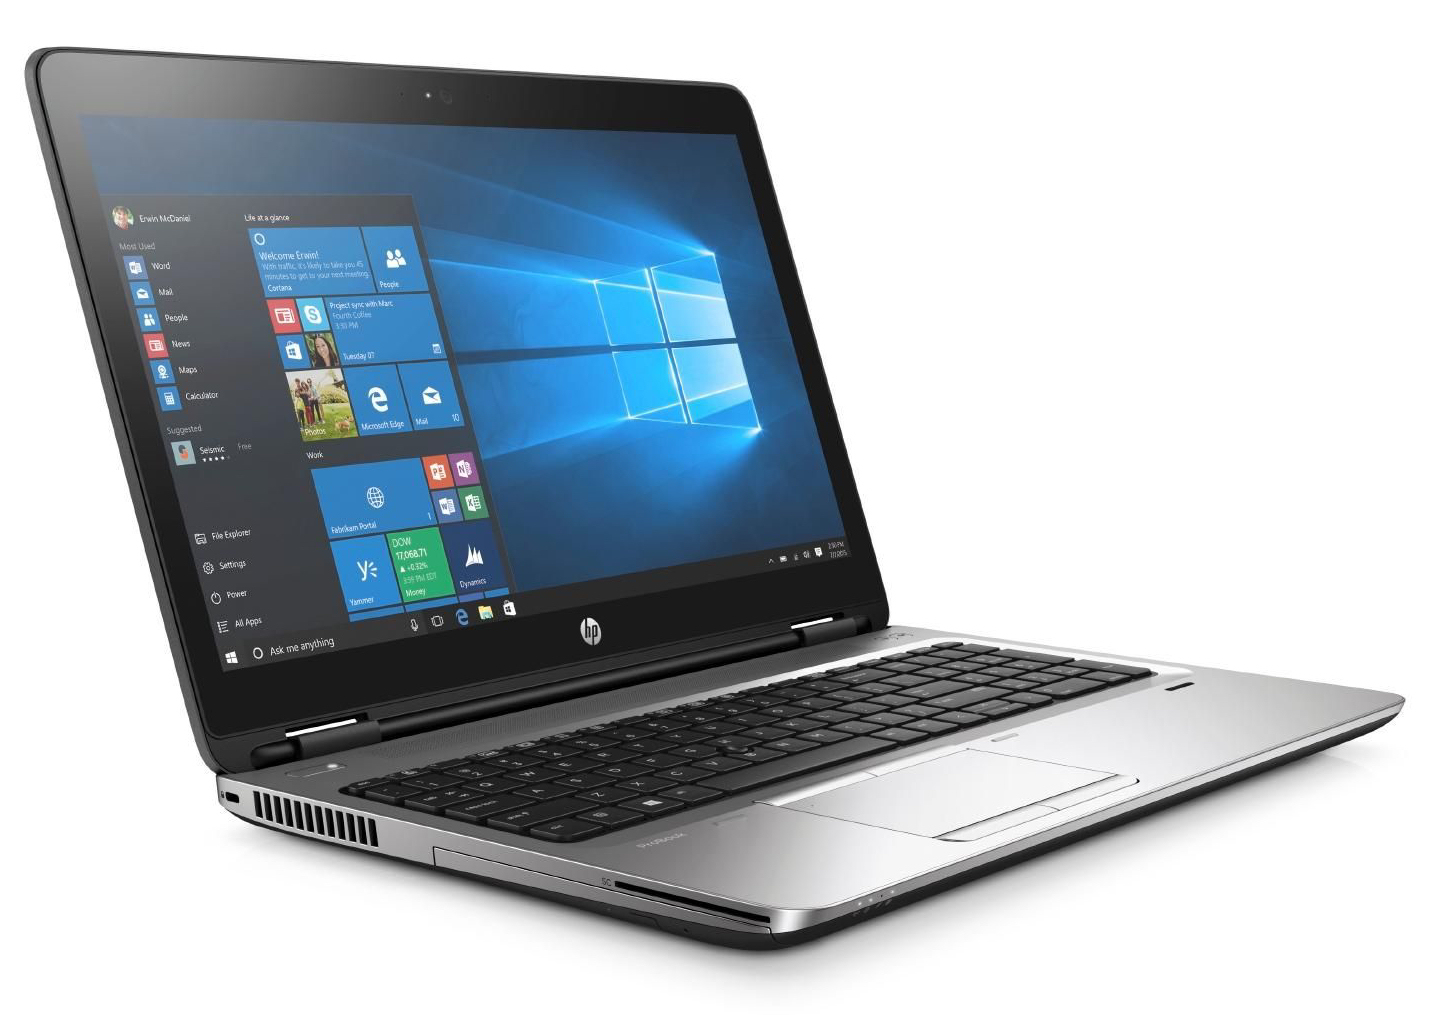
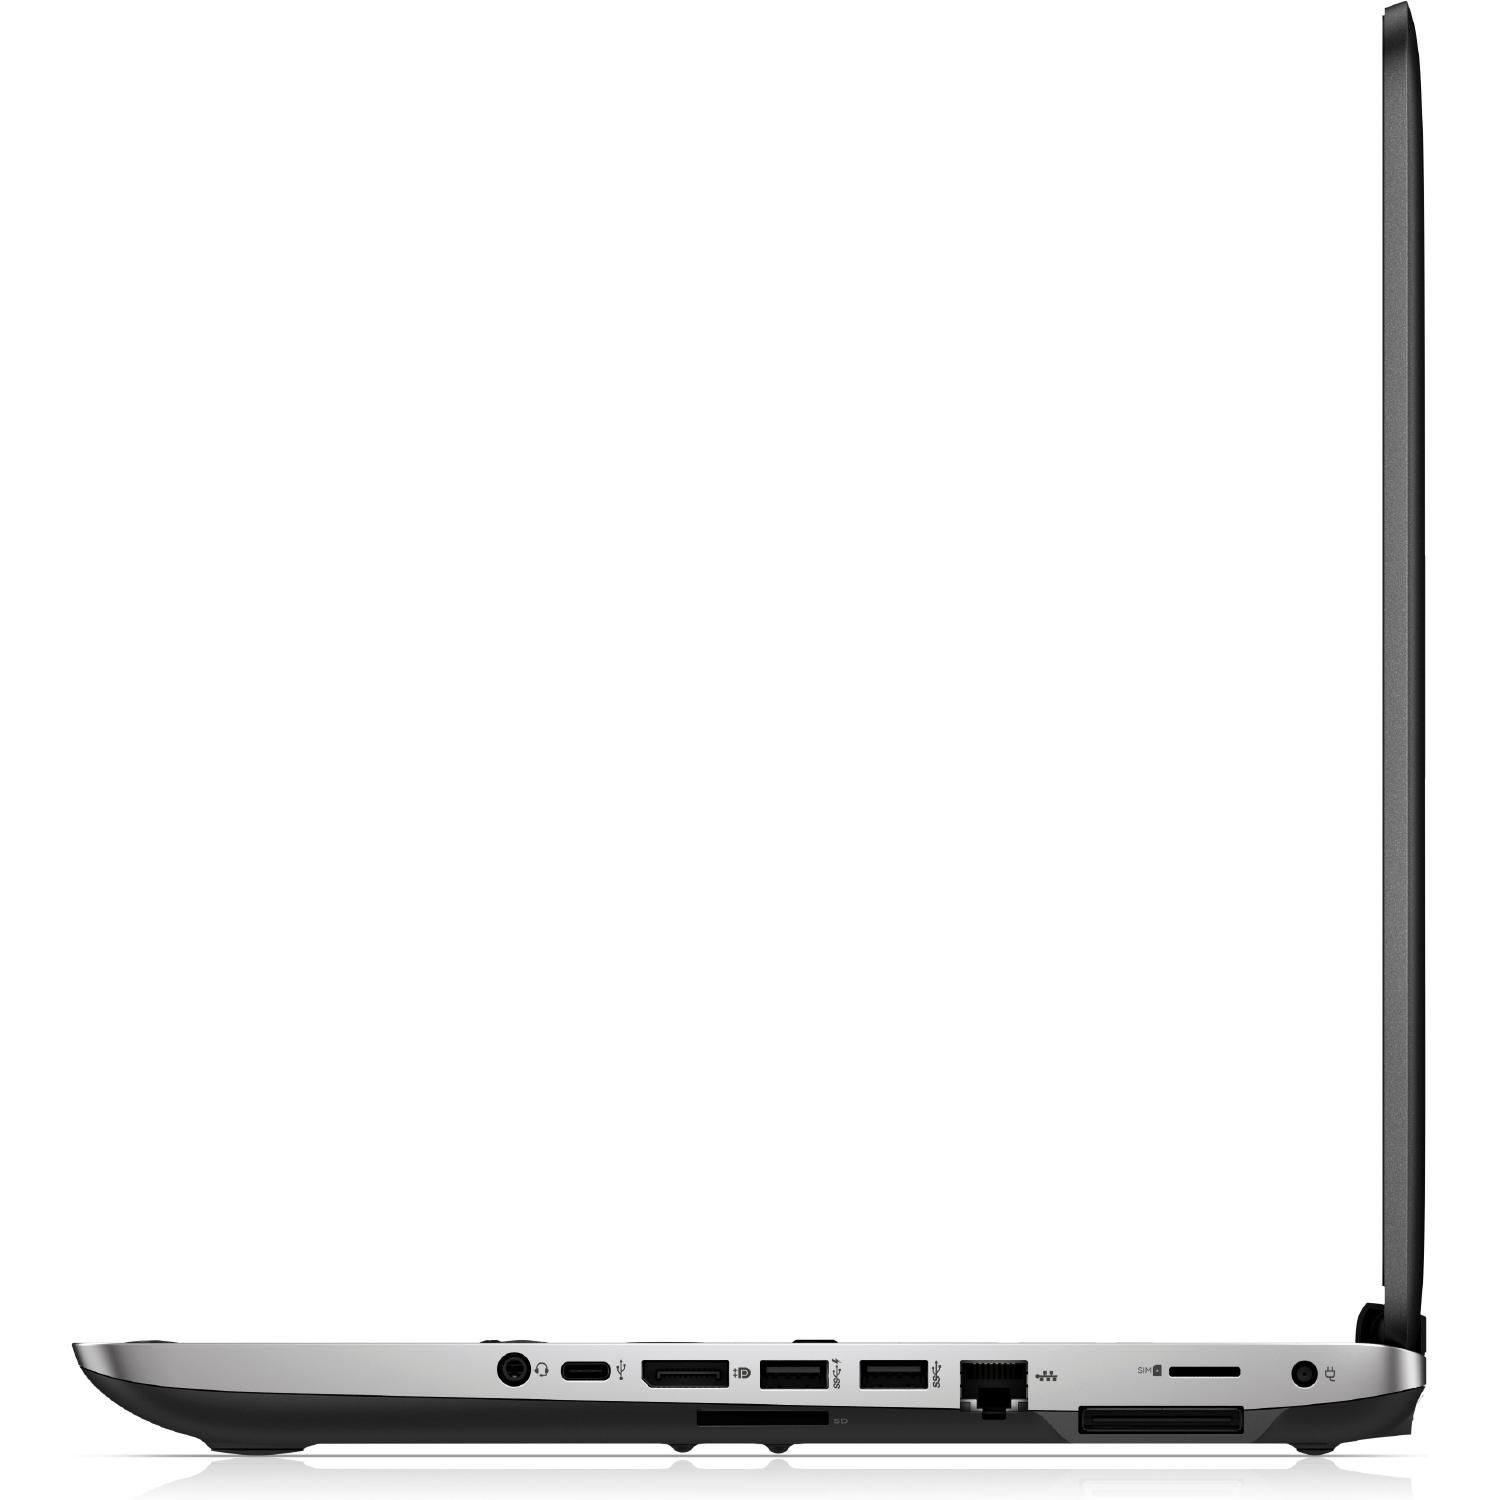
Breve análisis del HP ProBook 650 G3 Z2W44ET

| SD Card Reader | |
| average JPG Copy Test (av. of 3 runs) | |
| Dell Latitude 15 E5570 | |
| Lenovo ThinkPad L560-20F10026GE | |
| Acer TravelMate P658-M-537B | |
| HP Probook 650 G3 Z2W44ET | |
| HP ProBook 650 G2 V1A44ET | |
| HP ProBook 655 G2 T9X09ET | |
| maximum AS SSD Seq Read Test (1GB) | |
| HP Probook 650 G3 Z2W44ET | |
| Lenovo ThinkPad L560-20F10026GE | |
| Networking | |
| iperf3 transmit AX12 | |
| Apple MacBook Pro 15 2016 (2.6 GHz, 450) (Klaus I211) | |
| HP Probook 650 G3 Z2W44ET (jseb) | |
| iperf3 receive AX12 | |
| Apple MacBook Pro 15 2016 (2.6 GHz, 450) (Klaus I211) | |
| HP Probook 650 G3 Z2W44ET (jseb) | |
| iperf Client (transmit) TCP 1 m | |
| HP ProBook 650 G2 V1A44ET (jseb) | |
| Dell Latitude 15 E5570 | |
| HP ProBook 655 G2 T9X09ET (jseb) | |
| iperf Server (receive) TCP 1 m | |
| HP ProBook 650 G2 V1A44ET (jseb) | |
| HP ProBook 655 G2 T9X09ET (jseb) | |
| Dell Latitude 15 E5570 | |
| |||||||||||||||||||||||||
iluminación: 95 %
Brillo con batería: 355 cd/m²
Contraste: 540:1 (Negro: 0.65 cd/m²)
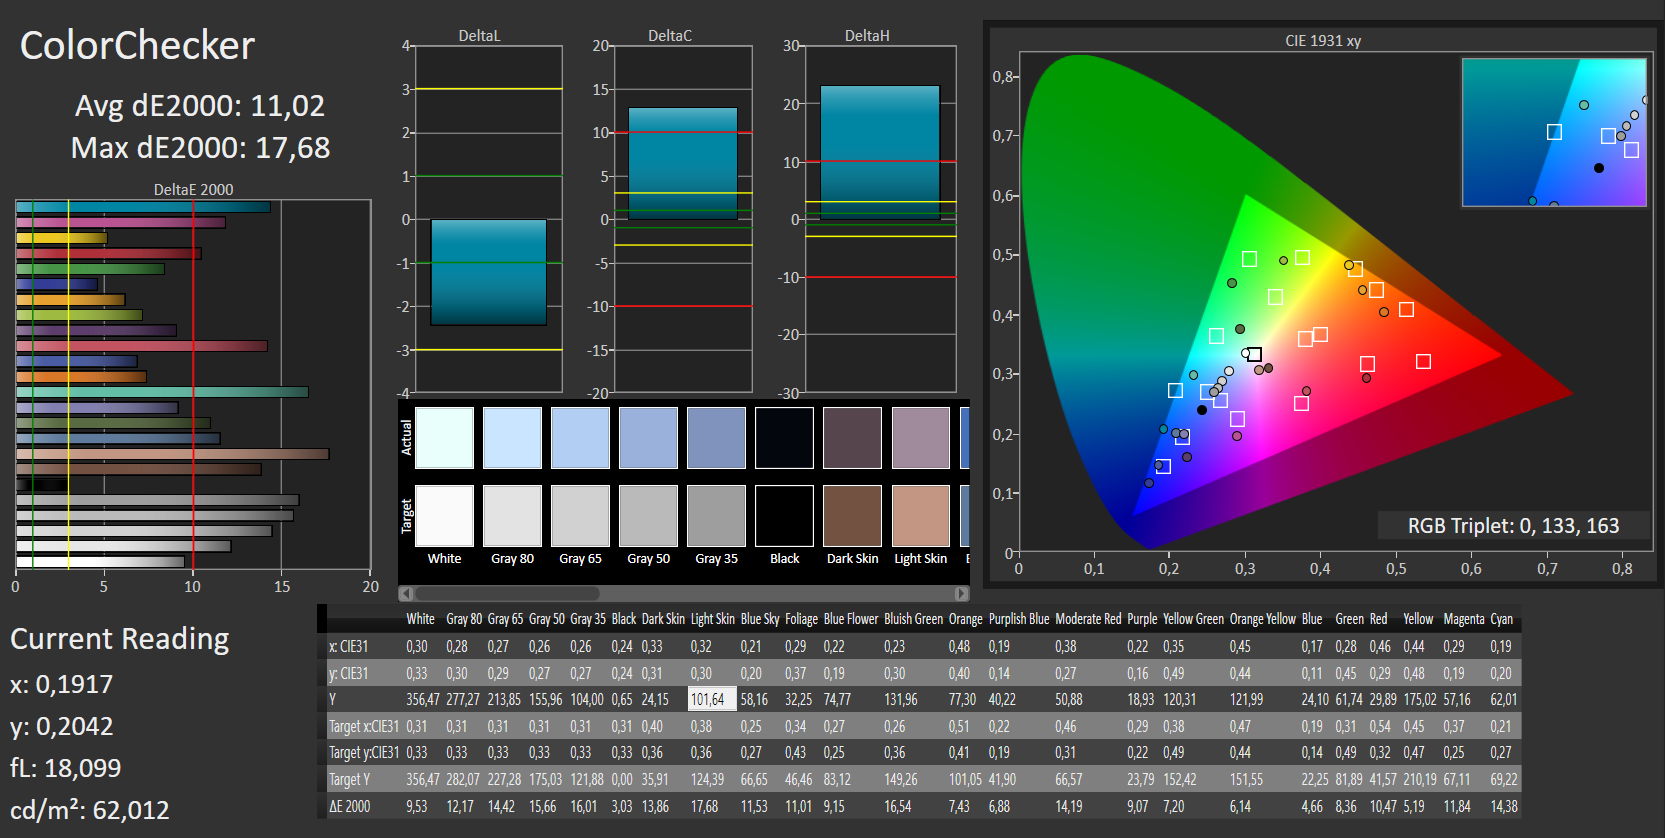
ΔE ColorChecker Calman: 11.02 | ∀{0.5-29.43 Ø4.72}
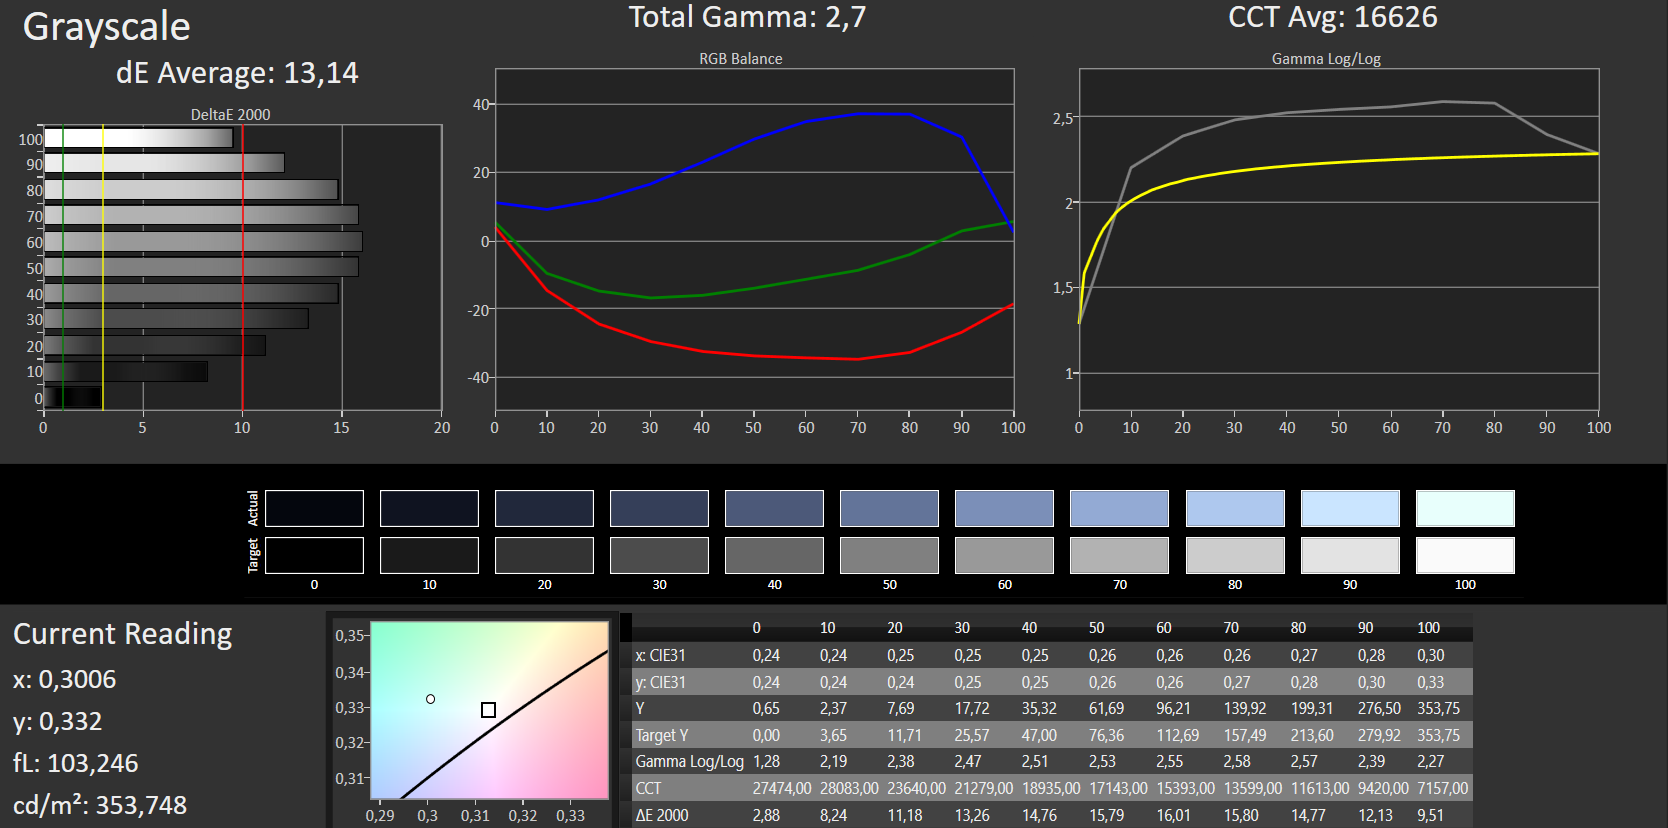
ΔE Greyscale Calman: 13.14 | ∀{0.09-98 Ø4.97}
81% sRGB (Argyll 1.6.3 3D)
52% AdobeRGB 1998 (Argyll 1.6.3 3D)
57% AdobeRGB 1998 (Argyll 3D)
81.1% sRGB (Argyll 3D)
55.2% Display P3 (Argyll 3D)
Gamma: 2.7
CCT: 16626 K
| HP Probook 650 G3 Z2W44ET TN LED, 1920x1080, 15.6" | HP ProBook 650 G2 V1A44ET TN LED, 1920x1080, 15.6" | HP ProBook 655 G2 T9X09ET TN LED, 1366x768, 15.6" | Acer TravelMate P658-M-537B IPS, 1920x1080, 15.6" | Dell Latitude 15 E5570 TN LED, 1366x768, 15.6" | Lenovo ThinkPad L560-20F10026GE AH-IPS, 1920x1080, 15.6" | Apple MacBook Pro 15 2016 (2.6 GHz, 450) IPS, 2880x1800, 15.4" | |
|---|---|---|---|---|---|---|---|
| Display | -5% | -19% | 12% | -26% | -29% | ||
| Display P3 Coverage (%) | 55.2 | 52.1 -6% | 44.49 -19% | 66.6 21% | 40.48 -27% | 39 -29% | |
| sRGB Coverage (%) | 81.1 | 78.3 -3% | 66.9 -18% | 85.7 6% | 60.9 -25% | 58.3 -28% | |
| AdobeRGB 1998 Coverage (%) | 57 | 53.7 -6% | 45.97 -19% | 62.8 10% | 41.82 -27% | 40.33 -29% | |
| Response Times | -4% | -12% | 4% | -12% | -4% | -20% | |
| Response Time Grey 50% / Grey 80% * (ms) | 38 ? | 41 ? -8% | 44 ? -16% | 38 ? -0% | 47 ? -24% | 39.2 ? -3% | 47.3 ? -24% |
| Response Time Black / White * (ms) | 27 ? | 27 ? -0% | 29 ? -7% | 25 ? 7% | 27 ? -0% | 28 ? -4% | 31.2 ? -16% |
| PWM Frequency (Hz) | 200 ? | 200 ? | 200 ? | 117000 ? | |||
| Screen | -6% | -6% | 15% | -10% | 7% | 69% | |
| Brightness middle (cd/m²) | 351 | 313 -11% | 248 -29% | 308 -12% | 228 -35% | 262 -25% | 483 38% |
| Brightness (cd/m²) | 345 | 296 -14% | 230 -33% | 319 -8% | 236 -32% | 250 -28% | 465 35% |
| Brightness Distribution (%) | 95 | 90 -5% | 88 -7% | 71 -25% | 90 -5% | 92 -3% | 92 -3% |
| Black Level * (cd/m²) | 0.65 | 0.59 9% | 0.56 14% | 0.61 6% | 0.56 14% | 0.29 55% | 0.33 49% |
| Contrast (:1) | 540 | 531 -2% | 443 -18% | 505 -6% | 407 -25% | 903 67% | 1464 171% |
| Colorchecker dE 2000 * | 11.02 | 11.89 -8% | 8.7 21% | 4.51 59% | 10.02 9% | 8.49 23% | 1.4 87% |
| Colorchecker dE 2000 max. * | 17.68 | 20.81 -18% | 14.96 15% | 10.19 42% | 15.93 10% | 17.99 -2% | 3 83% |
| Greyscale dE 2000 * | 13.14 | 12.95 1% | 11.48 13% | 2.91 78% | 10.66 19% | 8.11 38% | 1.5 89% |
| Gamma | 2.7 81% | 2.4 92% | 2.38 92% | 2.4 92% | 2.48 89% | 2.37 93% | 2.34 94% |
| CCT | 16626 39% | 15063 43% | 11179 58% | 6740 96% | 11800 55% | 6300 103% | 6650 98% |
| Color Space (Percent of AdobeRGB 1998) (%) | 52 | 50 -4% | 42 -19% | 56 8% | 39 -25% | 37.07 -29% | |
| Color Space (Percent of sRGB) (%) | 81 | 78 -4% | 67 -17% | 86 6% | 61 -25% | 57.94 -28% | |
| Media total (Programa/Opciones) | -5% /
-5% | -12% /
-9% | 10% /
13% | -16% /
-13% | -9% /
-2% | 25% /
51% |
* ... más pequeño es mejor
Parpadeo de Pantalla / PWM (Pulse-Width Modulation)
| Parpadeo de Pantalla / PWM detectado | 200 Hz | ≤ 50 % de brillo | 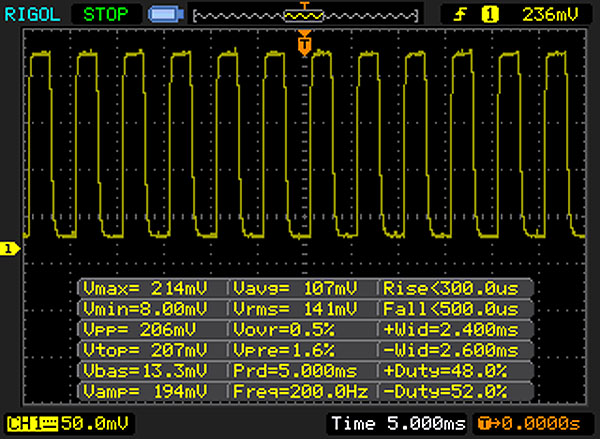 |
La retroiluminación del display parpadea a 200 Hz (seguramente usa PWM - Pulse-Width Modulation) a un brillo del 50 % e inferior. Sobre este nivel de brillo no debería darse parpadeo / PWM. La frecuencia de 200 Hz es relativamente baja, por lo que la gente sensible debería ver parpadeos y padecer fatiga visual por la pantalla (usado al brillo indicado a continuación). Comparación: 52 % de todos los dispositivos testados no usaron PWM para atenuar el display. Si se usó, medimos una media de 7747 (mínimo: 5 - máxmo: 343500) Hz. | |||
Tiempos de respuesta del display
| ↔ Tiempo de respuesta de Negro a Blanco | ||
|---|---|---|
| 27 ms ... subida ↗ y bajada ↘ combinada | ↗ 9 ms subida | 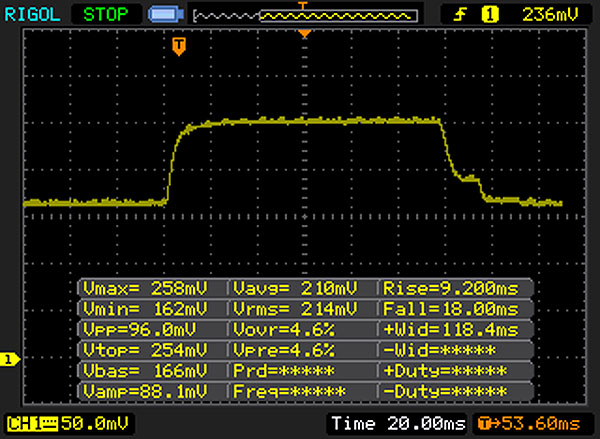 |
| ↘ 18 ms bajada | ||
| La pantalla mostró tiempos de respuesta relativamente lentos en nuestros tests pero podría ser demasiado lenta para los jugones. En comparación, todos los dispositivos de prueba van de ##min### (mínimo) a 240 (máximo) ms. » 67 % de todos los dispositivos son mejores. Eso quiere decir que el tiempo de respuesta es peor que la media (19.8 ms) de todos los dispositivos testados. | ||
| ↔ Tiempo de respuesta 50% Gris a 80% Gris | ||
| 38 ms ... subida ↗ y bajada ↘ combinada | ↗ 16 ms subida | 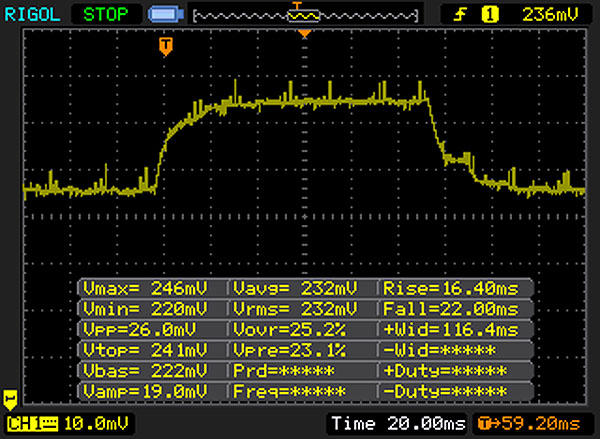 |
| ↘ 22 ms bajada | ||
| La pantalla mostró tiempos de respuesta lentos en nuestros tests y podría ser demasiado lenta para los jugones. En comparación, todos los dispositivos de prueba van de ##min### (mínimo) a 636 (máximo) ms. » 55 % de todos los dispositivos son mejores. Eso quiere decir que el tiempo de respuesta es peor que la media (31 ms) de todos los dispositivos testados. | ||
| Cinebench R15 | |
| CPU Single 64Bit | |
| Apple MacBook Pro 15 2016 (2.6 GHz, 450) | |
| Dell Latitude 15 E5570 | |
| HP Probook 650 G3 Z2W44ET | |
| Lenovo ThinkPad L560-20F10026GE | |
| HP ProBook 650 G2 V1A44ET | |
| Acer TravelMate P658-M-537B | |
| HP ProBook 655 G2 T9X09ET | |
| CPU Multi 64Bit | |
| Apple MacBook Pro 15 2016 (2.6 GHz, 450) | |
| HP Probook 650 G3 Z2W44ET | |
| Dell Latitude 15 E5570 | |
| HP ProBook 650 G2 V1A44ET | |
| Lenovo ThinkPad L560-20F10026GE | |
| Acer TravelMate P658-M-537B | |
| HP ProBook 655 G2 T9X09ET | |
| Cinebench R10 | |
| Rendering Multiple CPUs 32Bit | |
| HP Probook 650 G3 Z2W44ET | |
| Dell Latitude 15 E5570 | |
| Lenovo ThinkPad L560-20F10026GE | |
| HP ProBook 650 G2 V1A44ET | |
| HP ProBook 655 G2 T9X09ET | |
| Rendering Single 32Bit | |
| HP Probook 650 G3 Z2W44ET | |
| Dell Latitude 15 E5570 | |
| Lenovo ThinkPad L560-20F10026GE | |
| HP ProBook 650 G2 V1A44ET | |
| HP ProBook 655 G2 T9X09ET | |
| Geekbench 3 | |
| 32 Bit Single-Core Score | |
| Dell Latitude 15 E5570 | |
| HP Probook 650 G3 Z2W44ET | |
| HP ProBook 650 G2 V1A44ET | |
| HP ProBook 655 G2 T9X09ET | |
| 32 Bit Multi-Core Score | |
| HP Probook 650 G3 Z2W44ET | |
| Dell Latitude 15 E5570 | |
| HP ProBook 650 G2 V1A44ET | |
| HP ProBook 655 G2 T9X09ET | |
| Geekbench 4.0 | |
| 64 Bit Single-Core Score | |
| Apple MacBook Pro 15 2016 (2.6 GHz, 450) | |
| HP Probook 650 G3 Z2W44ET | |
| HP ProBook 655 G2 T9X09ET | |
| 64 Bit Multi-Core Score | |
| Apple MacBook Pro 15 2016 (2.6 GHz, 450) | |
| HP Probook 650 G3 Z2W44ET | |
| HP ProBook 655 G2 T9X09ET | |
| JetStream 1.1 - 1.1 Total | |
| Apple MacBook Pro 15 2016 (2.6 GHz, 450) | |
| HP Probook 650 G3 Z2W44ET | |
| Dell Latitude 15 E5570 | |
| HP ProBook 650 G2 V1A44ET | |
| Lenovo ThinkPad L560-20F10026GE | |
| HP ProBook 655 G2 T9X09ET | |
| PCMark 7 Score | 3124 puntos | |
| PCMark 8 Home Score Accelerated v2 | 3149 puntos | |
| PCMark 8 Creative Score Accelerated v2 | 3741 puntos | |
| PCMark 8 Work Score Accelerated v2 | 4118 puntos | |
ayuda | ||
| PCMark 8 | |
| Home Score Accelerated v2 | |
| Apple MacBook Pro 15 2016 (2.6 GHz, 450) | |
| Acer TravelMate P658-M-537B | |
| Dell Latitude 15 E5570 | |
| HP ProBook 650 G2 V1A44ET | |
| HP Probook 650 G3 Z2W44ET | |
| Lenovo ThinkPad L560-20F10026GE | |
| HP ProBook 655 G2 T9X09ET | |
| Work Score Accelerated v2 | |
| Acer TravelMate P658-M-537B | |
| Apple MacBook Pro 15 2016 (2.6 GHz, 450) | |
| Dell Latitude 15 E5570 | |
| HP Probook 650 G3 Z2W44ET | |
| Lenovo ThinkPad L560-20F10026GE | |
| HP ProBook 655 G2 T9X09ET | |

| HP Probook 650 G3 Z2W44ET Hitachi Travelstar Z7K500 HTS725050A7E630 | HP ProBook 655 G2 T9X09ET Seagate ST500LM021-1KJ15 | Acer TravelMate P658-M-537B Kingston RBU-SNS8152S3256GG2 | Dell Latitude 15 E5570 Samsung SSD PM871 MZ7LN128HCHP | Lenovo ThinkPad L560-20F10026GE WDC Slim WD10SPCX-21KHST0 | |
|---|---|---|---|---|---|
| CrystalDiskMark 3.0 | 12% | 8793% | 10223% | 42% | |
| Read Seq (MB/s) | 109.4 | 122.1 12% | 479.1 338% | 474.7 334% | 113.6 4% |
| Write Seq (MB/s) | 99.9 | 110.7 11% | 333.1 233% | 155 55% | 111.7 12% |
| Read 512 (MB/s) | 16.34 | 33.53 105% | 418 2458% | 393.6 2309% | 39.65 143% |
| Write 512 (MB/s) | 43.45 | 51.3 18% | 320.5 638% | 119.7 175% | 55.3 27% |
| Read 4k (MB/s) | 0.337 | 0.357 6% | 25.66 7514% | 34 9989% | 0.488 45% |
| Write 4k (MB/s) | 0.866 | 0.641 -26% | 64.7 7371% | 96.6 11055% | 1.022 18% |
| Read 4k QD32 (MB/s) | 0.826 | 0.778 -6% | 226.2 27285% | 383.3 46304% | 1.367 65% |
| Write 4k QD32 (MB/s) | 0.859 | 0.672 -22% | 211.4 24510% | 100.2 11565% | 1.036 21% |
| 3DMark 06 Standard Score | 6656 puntos | |
| 3DMark 11 Performance | 1359 puntos | |
| 3DMark Ice Storm Standard Score | 46690 puntos | |
| 3DMark Cloud Gate Standard Score | 5064 puntos | |
| 3DMark Fire Strike Score | 600 puntos | |
ayuda | ||
| 3DMark 11 - 1280x720 Performance GPU | |
| Apple MacBook Pro 15 2016 (2.6 GHz, 450) | |
| HP ProBook 655 G2 T9X09ET | |
| Acer TravelMate P658-M-537B | |
| HP Probook 650 G3 Z2W44ET | |
| Dell Latitude 15 E5570 | |
| Lenovo ThinkPad L560-20F10026GE | |
| HP ProBook 650 G2 V1A44ET | |
| 3DMark | |
| 1280x720 Cloud Gate Standard Graphics | |
| Apple MacBook Pro 15 2016 (2.6 GHz, 450) | |
| Acer TravelMate P658-M-537B | |
| Dell Latitude 15 E5570 | |
| Lenovo ThinkPad L560-20F10026GE | |
| HP Probook 650 G3 Z2W44ET | |
| 1920x1080 Fire Strike Graphics | |
| Apple MacBook Pro 15 2016 (2.6 GHz, 450) | |
| Dell Latitude 15 E5570 | |
| Lenovo ThinkPad L560-20F10026GE | |
| HP Probook 650 G3 Z2W44ET | |
| bajo | medio | alto | ultra | |
|---|---|---|---|---|
| Tomb Raider (2013) | 52.1 | 26.2 | 14.4 | 9.6 |
| BioShock Infinite (2013) | 32.9 | 20.1 | 16.1 | 6.9 |
| Battlefield 4 (2013) | 24.4 | 19.3 | 12.2 | 6.1 |
Ruido
| Ocioso |
| 31.5 / 31.5 / 31.5 dB(A) |
| HDD |
| 32 dB(A) |
| DVD |
| 36.7 / dB(A) |
| Carga |
| 34.6 / 33.3 dB(A) |
 | ||
30 dB silencioso 40 dB(A) audible 50 dB(A) ruidosamente alto |
||
min: | ||
| HP Probook 650 G3 Z2W44ET i5-7200U, HD Graphics 620 | HP ProBook 650 G2 V1A44ET 6200U, HD Graphics 520 | HP ProBook 655 G2 T9X09ET Pro A8-8600B, Radeon R6 (Carrizo) | Acer TravelMate P658-M-537B 6200U, HD Graphics 520 | Dell Latitude 15 E5570 6300U, HD Graphics 520 | Lenovo ThinkPad L560-20F10026GE 6200U, HD Graphics 520 | Apple MacBook Pro 15 2016 (2.6 GHz, 450) 6700HQ, Radeon Pro 450 | |
|---|---|---|---|---|---|---|---|
| Noise | -0% | -0% | -9% | -4% | 3% | -5% | |
| apagado / medio ambiente * (dB) | 30.7 | 30.5 1% | 31.5 -3% | 31.2 -2% | 31.2 -2% | 29.4 4% | 30.4 1% |
| Idle Minimum * (dB) | 31.5 | 30.5 3% | 31.6 -0% | 32.5 -3% | 31.2 1% | 30.1 4% | 30.6 3% |
| Idle Average * (dB) | 31.5 | 31.6 -0% | 31.6 -0% | 32.5 -3% | 33.2 -5% | 30.1 4% | 30.6 3% |
| Idle Maximum * (dB) | 31.5 | 31.9 -1% | 31.6 -0% | 35 -11% | 34.3 -9% | 30.1 4% | 30.6 3% |
| Load Average * (dB) | 34.6 | 34.7 -0% | 33.5 3% | 42 -21% | 36.6 -6% | 33.4 3% | 34.7 -0% |
| Load Maximum * (dB) | 33.3 | 34.5 -4% | 33.5 -1% | 37.5 -13% | 34.7 -4% | 34.7 -4% | 46.3 -39% |
* ... más pequeño es mejor
(+) La temperatura máxima en la parte superior es de 31.9 °C / 89 F, frente a la media de 34.3 °C / 94 F, que oscila entre 21.2 y 62.5 °C para la clase Office.
(+) El fondo se calienta hasta un máximo de 32.1 °C / 90 F, frente a la media de 36.8 °C / 98 F
(+) En reposo, la temperatura media de la parte superior es de 22.1 °C / 72# F, frente a la media del dispositivo de 29.5 °C / 85 F.
(+) El reposamanos y el panel táctil están a una temperatura inferior a la de la piel, con un máximo de 25.6 °C / 78.1 F y, por tanto, son fríos al tacto.
(±) La temperatura media de la zona del reposamanos de dispositivos similares fue de 27.5 °C / 81.5 F (+1.9 °C / 3.4 F).
| HP Probook 650 G3 Z2W44ET i5-7200U, HD Graphics 620 | HP ProBook 650 G2 V1A44ET 6200U, HD Graphics 520 | HP ProBook 655 G2 T9X09ET Pro A8-8600B, Radeon R6 (Carrizo) | Acer TravelMate P658-M-537B 6200U, HD Graphics 520 | Dell Latitude 15 E5570 6300U, HD Graphics 520 | Lenovo ThinkPad L560-20F10026GE 6200U, HD Graphics 520 | Apple MacBook Pro 15 2016 (2.6 GHz, 450) 6700HQ, Radeon Pro 450 | |
|---|---|---|---|---|---|---|---|
| Heat | -26% | -26% | -17% | -36% | -23% | -18% | |
| Maximum Upper Side * (°C) | 31.9 | 39.6 -24% | 35.8 -12% | 35.2 -10% | 37.3 -17% | 37.2 -17% | 43 -35% |
| Maximum Bottom * (°C) | 32.1 | 41.8 -30% | 37.6 -17% | 38 -18% | 41.5 -29% | 36 -12% | 40 -25% |
| Idle Upper Side * (°C) | 23.5 | 31.6 -34% | 33.4 -42% | 29.5 -26% | 34.2 -46% | 30.7 -31% | 26 -11% |
| Idle Bottom * (°C) | 25.3 | 29.7 -17% | 33.2 -31% | 29 -15% | 38.8 -53% | 32.8 -30% | 25 1% |
* ... más pequeño es mejor
HP Probook 650 G3 Z2W44ET análisis de audio
(-) | altavoces no muy altos (#68 dB)
Graves 100 - 315 Hz
(±) | lubina reducida - en promedio 14.6% inferior a la mediana
(±) | la linealidad de los graves es media (7.3% delta a frecuencia anterior)
Medios 400 - 2000 Hz
(+) | medios equilibrados - a sólo 3% de la mediana
(+) | los medios son lineales (4.5% delta a la frecuencia anterior)
Altos 2 - 16 kHz
(±) | máximos más altos - de media 8.5% más altos que la mediana
(±) | la linealidad de los máximos es media (7.6% delta a frecuencia anterior)
Total 100 - 16.000 Hz
(±) | la linealidad del sonido global es media (21% de diferencia con la mediana)
En comparación con la misma clase
» 49% de todos los dispositivos probados de esta clase eran mejores, 10% similares, 41% peores
» El mejor tuvo un delta de 7%, la media fue 21%, el peor fue ###max##%
En comparación con todos los dispositivos probados
» 58% de todos los dispositivos probados eran mejores, 7% similares, 35% peores
» El mejor tuvo un delta de 4%, la media fue 23%, el peor fue ###max##%
Apple MacBook 12 (Early 2016) 1.1 GHz análisis de audio
(+) | los altavoces pueden reproducir a un volumen relativamente alto (#83.6 dB)
Graves 100 - 315 Hz
(±) | lubina reducida - en promedio 11.3% inferior a la mediana
(±) | la linealidad de los graves es media (14.2% delta a frecuencia anterior)
Medios 400 - 2000 Hz
(+) | medios equilibrados - a sólo 2.4% de la mediana
(+) | los medios son lineales (5.5% delta a la frecuencia anterior)
Altos 2 - 16 kHz
(+) | máximos equilibrados - a sólo 2% de la mediana
(+) | los máximos son lineales (4.5% delta a la frecuencia anterior)
Total 100 - 16.000 Hz
(+) | el sonido global es lineal (10.2% de diferencia con la mediana)
En comparación con la misma clase
» 7% de todos los dispositivos probados de esta clase eran mejores, 2% similares, 90% peores
» El mejor tuvo un delta de 5%, la media fue 18%, el peor fue ###max##%
En comparación con todos los dispositivos probados
» 5% de todos los dispositivos probados eran mejores, 1% similares, 94% peores
» El mejor tuvo un delta de 4%, la media fue 23%, el peor fue ###max##%
| Off / Standby | |
| Ocioso | |
| Carga |
|
Clave:
min: | |
| HP Probook 650 G3 Z2W44ET i5-7200U, HD Graphics 620 | HP ProBook 650 G2 V1A44ET 6200U, HD Graphics 520 | HP ProBook 655 G2 T9X09ET Pro A8-8600B, Radeon R6 (Carrizo) | Acer TravelMate P658-M-537B 6200U, HD Graphics 520 | Dell Latitude 15 E5570 6300U, HD Graphics 520 | Lenovo ThinkPad L560-20F10026GE 6200U, HD Graphics 520 | Apple MacBook Pro 15 2016 (2.6 GHz, 450) 6700HQ, Radeon Pro 450 | |
|---|---|---|---|---|---|---|---|
| Power Consumption | 2% | -16% | -46% | -7% | -13% | -77% | |
| Idle Minimum * (Watt) | 4 | 3.4 15% | 5.8 -45% | 6.6 -65% | 4.5 -13% | 5 -25% | 2.9 27% |
| Idle Average * (Watt) | 6.9 | 7.5 -9% | 7.5 -9% | 10.4 -51% | 7.6 -10% | 7.9 -14% | 9.7 -41% |
| Idle Maximum * (Watt) | 7.6 | 7.6 -0% | 8.6 -13% | 12.7 -67% | 8.7 -14% | 8.6 -13% | 10.1 -33% |
| Load Average * (Watt) | 29 | 28.4 2% | 31 -7% | 36 -24% | 28.5 2% | 27.5 5% | 65 -124% |
| Load Maximum * (Watt) | 28.7 | 28.4 1% | 30.5 -6% | 35 -22% | 29.2 -2% | 33.7 -17% | 89.5 -212% |
* ... más pequeño es mejor
| HP Probook 650 G3 Z2W44ET i5-7200U, HD Graphics 620, 48 Wh | HP ProBook 650 G2-T9X61ET 6200U, HD Graphics 520, 48 Wh | HP ProBook 650 G2 V1A44ET 6200U, HD Graphics 520, 48 Wh | HP ProBook 655 G2 T9X09ET Pro A8-8600B, Radeon R6 (Carrizo), 48 Wh | Acer TravelMate P658-M-537B 6200U, HD Graphics 520, 55 Wh | Dell Latitude 15 E5570 6300U, HD Graphics 520, 62 Wh | Lenovo ThinkPad L560-20F10026GE 6200U, HD Graphics 520, 48 Wh | Apple MacBook Pro 15 2016 (2.6 GHz, 450) 6700HQ, Radeon Pro 450, 76 Wh | |
|---|---|---|---|---|---|---|---|---|
| Duración de Batería | -9% | -9% | -53% | -4% | 30% | -23% | -5% | |
| Reader / Idle (h) | 12.8 | 11.5 -10% | 14 9% | 20.5 60% | 11.6 -9% | |||
| H.264 (h) | 6.7 | 6.4 -4% | 9.5 42% | 4.6 -31% | 8.6 28% | |||
| WiFi v1.3 (h) | 7.8 | 6.8 -13% | 7.1 -9% | 3.7 -53% | 8.5 9% | 10.5 35% | 6.8 -13% | 10 28% |
| Load (h) | 3 | 2.7 -10% | 2.1 -30% | 2.5 -17% | 1.8 -40% | 0.9 -70% |
Pro
Contra
El portátil business HP de gama media logra un rendimiento ligeramente mejor gracias a los nuevos procesadores Kaby Lake. Sin embargo, esto apenas se nota en las tareas diarias. Los nuevos procesadores mejoran el aguante de batería. EL portátil puede superar los resultados ya buenos de sus predecesores. El ordenador trabaja en silencio y apenas se caldedea, sin importar la carga. Gracias a un HDD de 500 GB tardarás en quedarte sin espacio de almacenamiento. Se puede cambiar el HDD por un SSD. Esto implicaría sacar la parte inferior - algo fácil de hacer.
En general, HP ofrece un portátil business sólido con el ProBook 650 G3. Sin embargo, el modelo de pruebas es menos atractivo de lo que podría ya que el precio es demasiado alto para las características que incluye.
Hablando de SSD: HP ofrece un portátil de 1,050-Euros con HDD en vez de SSD. Es un punto en contra importante. El teclado usado parece bueno y está hecho para mecanógrafos prolíficos. Sin embargo, no está iluminado. Esto debería ser una característica estándar a la vista del precio del ordenador. Lo que es más, el display decepciona mucho. La empresa usó un modelo TN de bajo contraste y escaso ángulo de visión. Este display no debería ni plantearse en un portátil de este nivel de precios. Esperamos un modelo IPS.
Ésta es una versión acortada del análisis original. Puedes leer el análisis completo en inglés aquí.
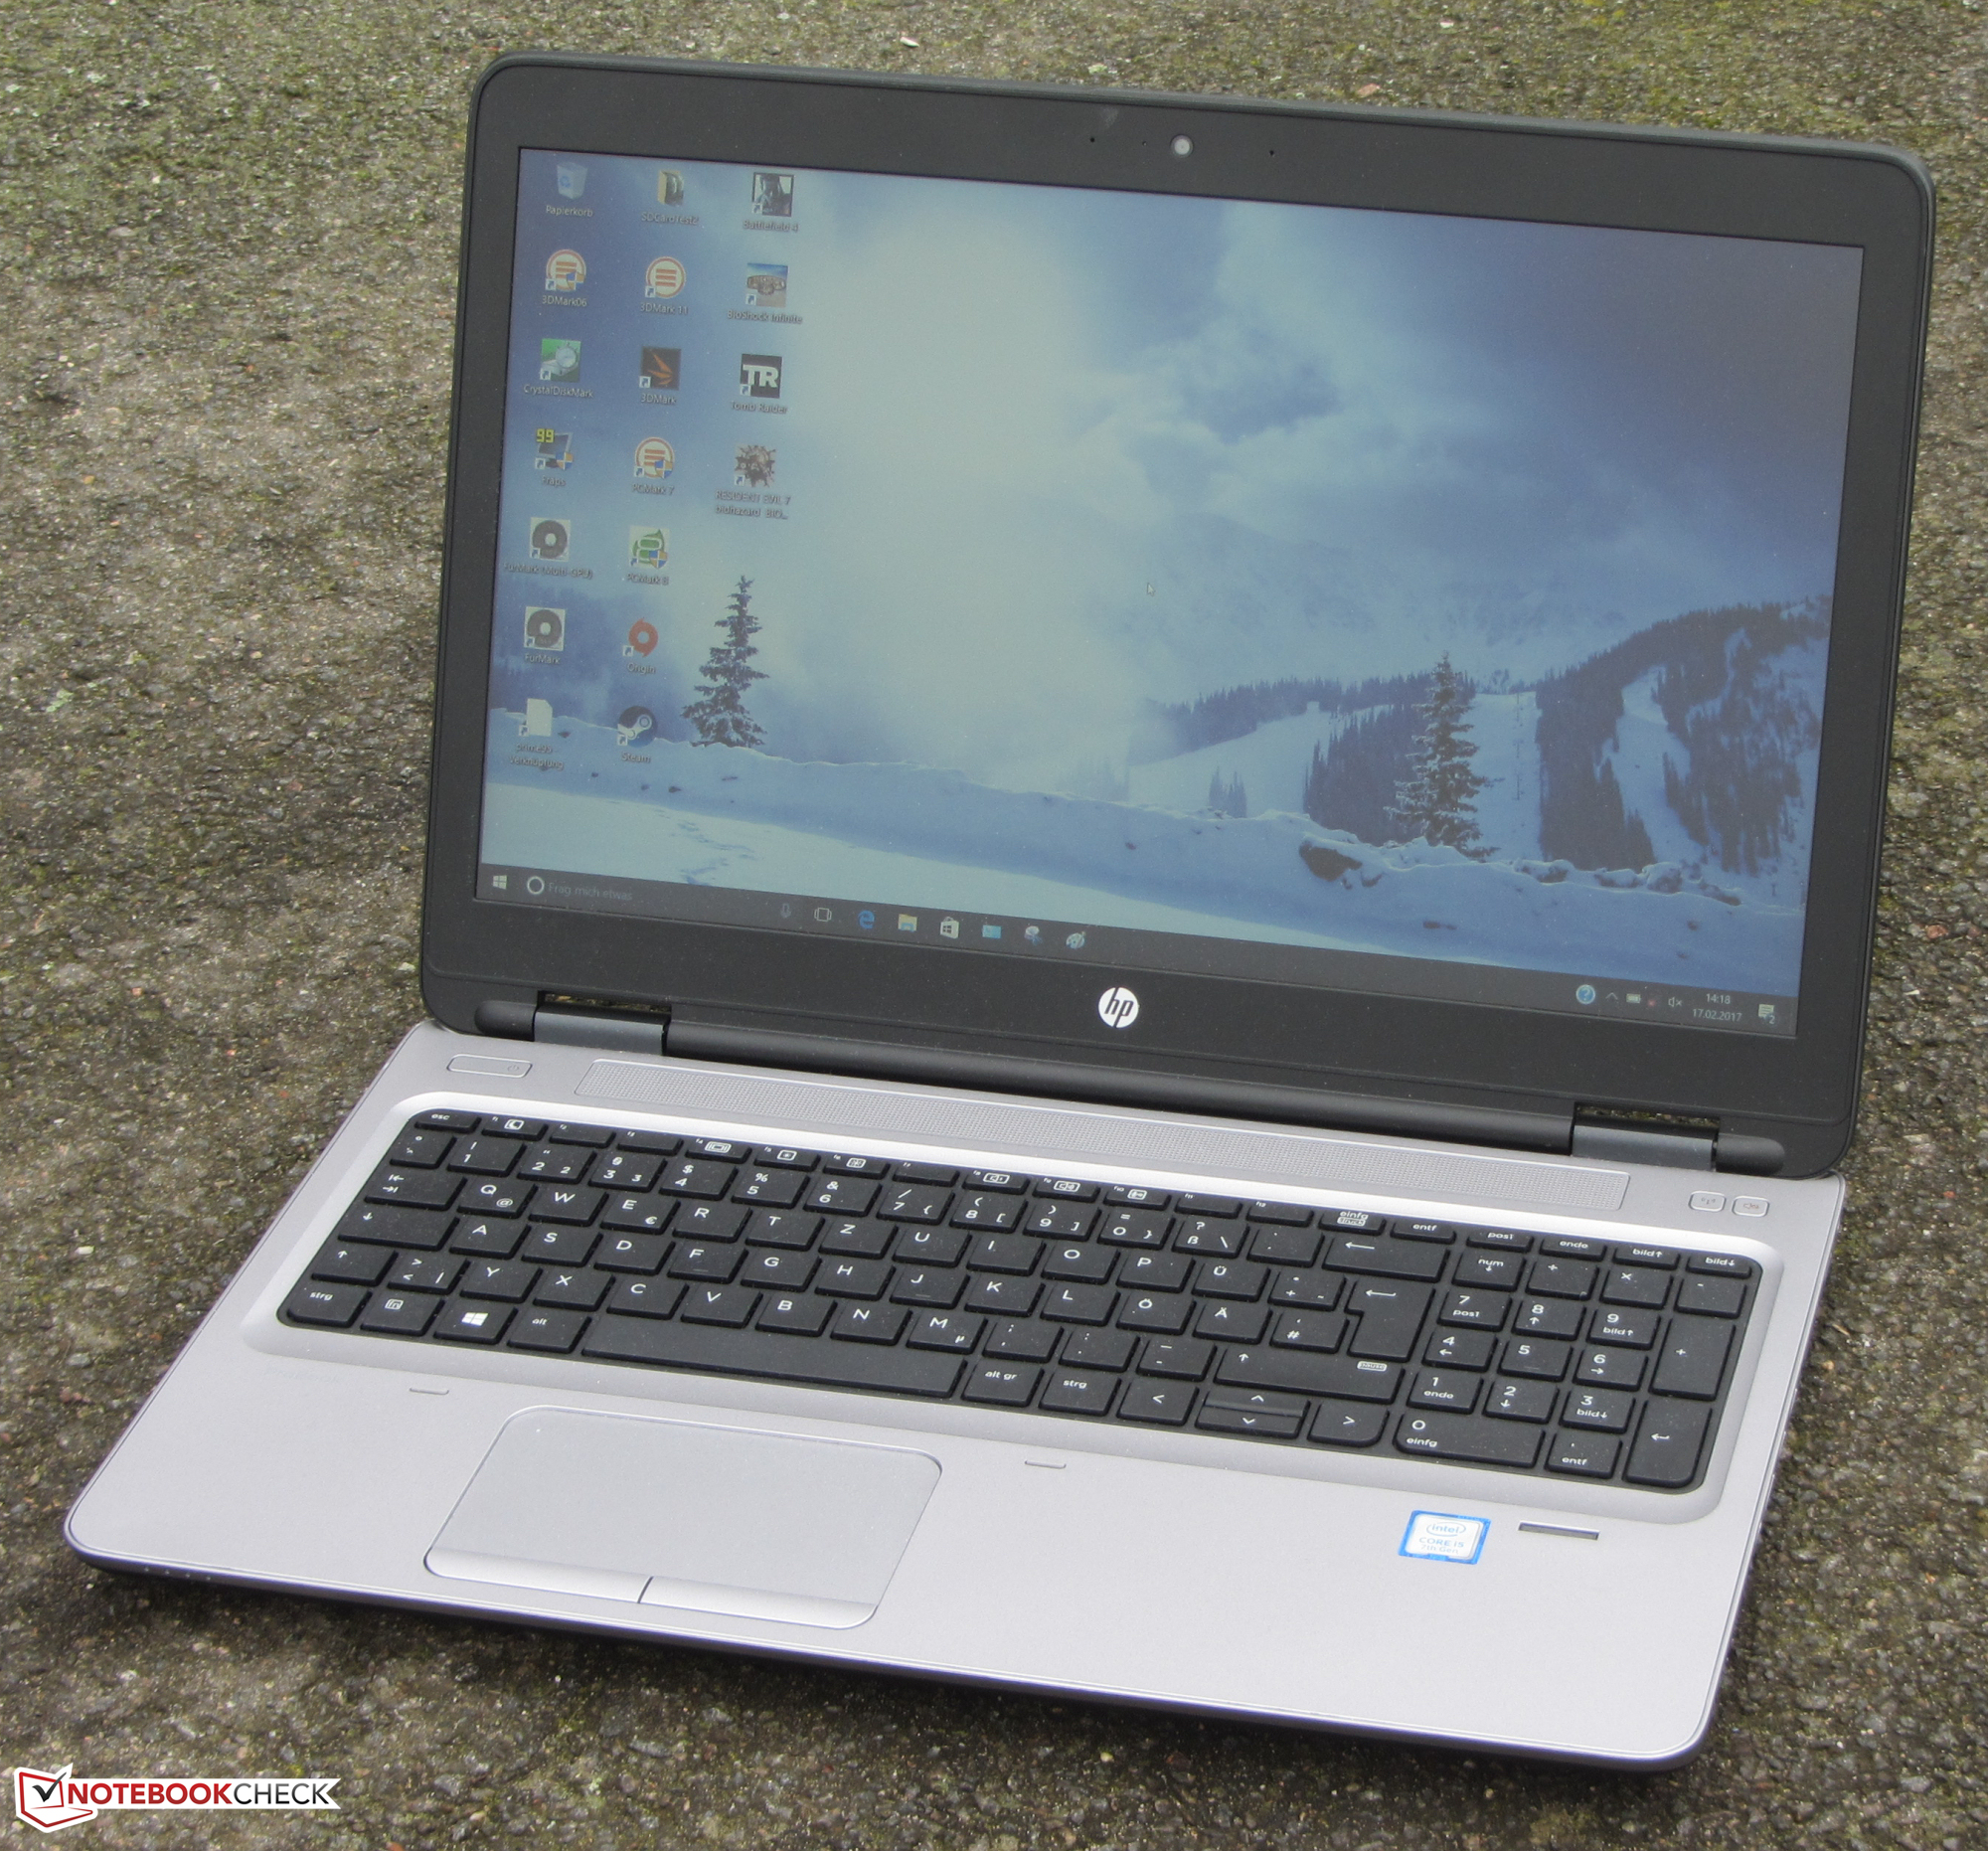
HP Probook 650 G3 Z2W44ET
- 02/21/2017 v6 (old)
Sascha Mölck