Breve análisis del Lenovo IdeaPad V110-17IKB 80V20006GE

| SD Card Reader | |
| average JPG Copy Test (av. of 3 runs) | |
| Acer Aspire E5-774-54HJ | |
| Acer Aspire E5-722-662J | |
| Lenovo IdeaPad V110-17IKB 80V20006GE | |
| Dell Inspiron 17 5759-5118 | |
| Lenovo IdeaPad 300-17ISK 80QH001EGE | |
| maximum AS SSD Seq Read Test (1GB) | |
| Acer Aspire E5-774-54HJ | |
| Acer Aspire E5-722-662J | |
| Lenovo IdeaPad V110-17IKB 80V20006GE | |
| Lenovo IdeaPad 300-17ISK 80QH001EGE | |
| Dell Inspiron 17 5759-5118 | |
| Networking | |
| iperf Server (receive) TCP 1 m | |
| Acer Aspire E5-774-54HJ (jseb) | |
| iperf Client (transmit) TCP 1 m | |
| Acer Aspire E5-774-54HJ (jseb) | |
| iperf3 transmit AX12 | |
| Lenovo IdeaPad V110-17IKB 80V20006GE | |
| iperf3 receive AX12 | |
| Lenovo IdeaPad V110-17IKB 80V20006GE | |
| |||||||||||||||||||||||||
iluminación: 86 %
Brillo con batería: 213 cd/m²
Contraste: 318:1 (Negro: 0.67 cd/m²)
ΔE ColorChecker Calman: 12.3 | ∀{0.5-29.43 Ø4.71}
ΔE Greyscale Calman: 14.13 | ∀{0.09-98 Ø4.96}
77% sRGB (Argyll 1.6.3 3D)
50% AdobeRGB 1998 (Argyll 1.6.3 3D)
56.5% AdobeRGB 1998 (Argyll 3D)
77.2% sRGB (Argyll 3D)
56.6% Display P3 (Argyll 3D)
Gamma: 2.11
CCT: 17705 K
| Lenovo IdeaPad V110-17IKB 80V20006GE TN LED, 1600x900, 17.3" | Acer Aspire E5-774-54HJ TN LED, 1920x1080, 17.3" | Dell Inspiron 17 5759-5118 TN LED, 1920x1080, 17.3" | Acer Aspire E5-722-662J TN LED, 1600x900, 17.3" | Lenovo IdeaPad 300-17ISK 80QH001EGE TN LED, 1600x900, 17.3" | |
|---|---|---|---|---|---|
| Display | 21% | 19% | 0% | -4% | |
| Display P3 Coverage (%) | 56.6 | 71.3 26% | 69.3 22% | 54.5 -4% | 52.4 -7% |
| sRGB Coverage (%) | 77.2 | 91.7 19% | 90.6 17% | 81.8 6% | 76.1 -1% |
| AdobeRGB 1998 Coverage (%) | 56.5 | 67.1 19% | 66.3 17% | 56.1 -1% | 54.2 -4% |
| Response Times | 7% | -46% | -3% | 5% | |
| Response Time Grey 50% / Grey 80% * (ms) | 44 ? | 42 ? 5% | 86 ? -95% | 48 ? -9% | 42 ? 5% |
| Response Time Black / White * (ms) | 25 ? | 23 ? 8% | 24 ? 4% | 24 ? 4% | 24 ? 4% |
| PWM Frequency (Hz) | 50 ? | 1000 ? | 200 ? | 1042 ? | |
| Screen | 51% | 39% | 38% | 12% | |
| Brightness middle (cd/m²) | 213 | 353 66% | 304 43% | 216 1% | 205 -4% |
| Brightness (cd/m²) | 203 | 320 58% | 292 44% | 199 -2% | 182 -10% |
| Brightness Distribution (%) | 86 | 82 -5% | 84 -2% | 80 -7% | 77 -10% |
| Black Level * (cd/m²) | 0.67 | 0.38 43% | 0.37 45% | 0.17 75% | 0.43 36% |
| Contrast (:1) | 318 | 929 192% | 822 158% | 1271 300% | 477 50% |
| Colorchecker dE 2000 * | 12.3 | 5.07 59% | 10.62 14% | 12.2 1% | 9.75 21% |
| Colorchecker dE 2000 max. * | 21.48 | 10.12 53% | 20.4 5% | 16.02 25% | |
| Greyscale dE 2000 * | 14.13 | 13.38 5% | 11.78 17% | 13.3 6% | 12.09 14% |
| Gamma | 2.11 104% | 2.69 82% | 2.39 92% | 2.15 102% | 2.62 84% |
| CCT | 17705 37% | 15991 41% | 12997 50% | 15963 41% | 12875 50% |
| Color Space (Percent of AdobeRGB 1998) (%) | 50 | 60.1 20% | 59 18% | 52 4% | 49 -2% |
| Color Space (Percent of sRGB) (%) | 77 | 91.6 19% | 90 17% | 76 -1% | 76 -1% |
| Media total (Programa/Opciones) | 26% /
39% | 4% /
23% | 12% /
25% | 4% /
8% |
* ... más pequeño es mejor
Parpadeo de Pantalla / PWM (Pulse-Width Modulation)
| Parpadeo de Pantalla / PWM detectado | 50 Hz | ≤ 50 % de brillo | 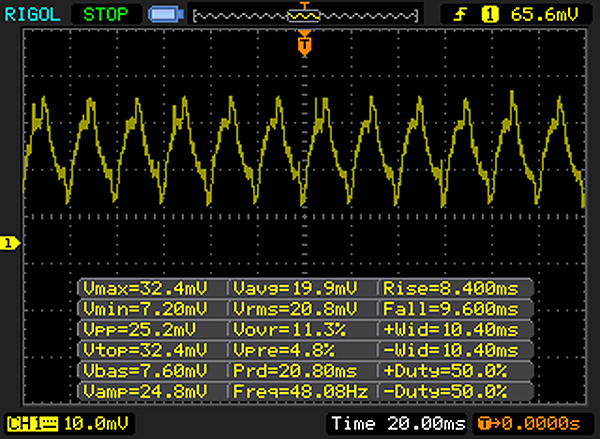 |
La retroiluminación del display parpadea a 50 Hz (seguramente usa PWM - Pulse-Width Modulation) a un brillo del 50 % e inferior. Sobre este nivel de brillo no debería darse parpadeo / PWM. La frecuencia de 50 Hz es bajísima, por lo que el parpadeo puede causar fatiga visual y cefaleas cuando se usa mucho tiempo. Comparación: 52 % de todos los dispositivos testados no usaron PWM para atenuar el display. Si se usó, medimos una media de 7741 (mínimo: 5 - máxmo: 343500) Hz. | |||
Tiempos de respuesta del display
| ↔ Tiempo de respuesta de Negro a Blanco | ||
|---|---|---|
| 25 ms ... subida ↗ y bajada ↘ combinada | ↗ 7 ms subida | 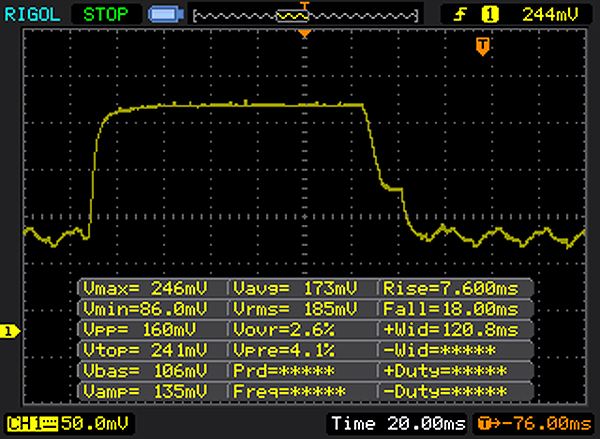 |
| ↘ 18 ms bajada | ||
| La pantalla mostró tiempos de respuesta relativamente lentos en nuestros tests pero podría ser demasiado lenta para los jugones. En comparación, todos los dispositivos de prueba van de ##min### (mínimo) a 240 (máximo) ms. » 59 % de todos los dispositivos son mejores. Eso quiere decir que el tiempo de respuesta es peor que la media (19.8 ms) de todos los dispositivos testados. | ||
| ↔ Tiempo de respuesta 50% Gris a 80% Gris | ||
| 44 ms ... subida ↗ y bajada ↘ combinada | ↗ 22 ms subida | 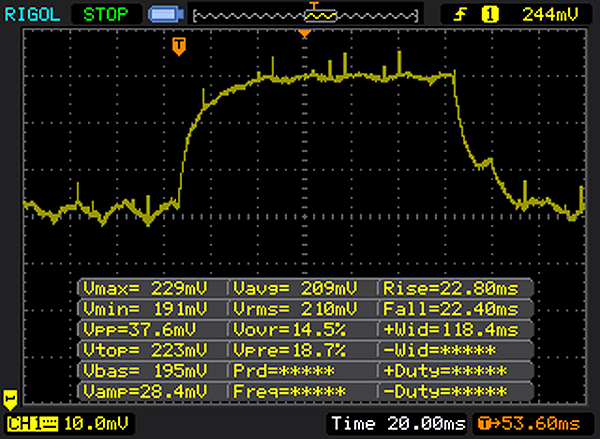 |
| ↘ 22 ms bajada | ||
| La pantalla mostró tiempos de respuesta lentos en nuestros tests y podría ser demasiado lenta para los jugones. En comparación, todos los dispositivos de prueba van de ##min### (mínimo) a 636 (máximo) ms. » 73 % de todos los dispositivos son mejores. Eso quiere decir que el tiempo de respuesta es peor que la media (30.9 ms) de todos los dispositivos testados. | ||
| Geekbench 3 | |
| 32 Bit Single-Core Score | |
| Lenovo IdeaPad V110-17IKB 80V20006GE | |
| Acer Aspire E5-774-54HJ | |
| Dell Inspiron 17 5759-5118 | |
| Lenovo IdeaPad 300-17ISK 80QH001EGE | |
| 32 Bit Multi-Core Score | |
| Lenovo IdeaPad V110-17IKB 80V20006GE | |
| Acer Aspire E5-774-54HJ | |
| Dell Inspiron 17 5759-5118 | |
| Lenovo IdeaPad 300-17ISK 80QH001EGE | |
| Geekbench 4.0 | |
| 64 Bit Single-Core Score | |
| Lenovo IdeaPad V110-17IKB 80V20006GE | |
| Acer Aspire E5-774-54HJ | |
| 64 Bit Multi-Core Score | |
| Lenovo IdeaPad V110-17IKB 80V20006GE | |
| Acer Aspire E5-774-54HJ | |
| JetStream 1.1 - 1.1 Total | |
| Lenovo IdeaPad V110-17IKB 80V20006GE | |
| Acer Aspire E5-774-54HJ | |
| Lenovo IdeaPad 300-17ISK 80QH001EGE | |
| Dell Inspiron 17 5759-5118 | |
| PCMark 8 Home Score Accelerated v2 | 3611 puntos | |
ayuda | ||

| Lenovo IdeaPad V110-17IKB 80V20006GE WDC Scorpio Blue WD10JPCX-24UE4T0 | Acer Aspire E5-774-54HJ Western Digital Scorpio Blue WD5000LPCX-24C6HT0 | Dell Inspiron 17 5759-5118 Seagate Momentus SpinPoint M8 ST1000LM024 HN-M101MBB | Lenovo IdeaPad 300-17ISK 80QH001EGE Toshiba MQ01ABD100 | Acer Aspire ES1-731G-P5UR Toshiba MQ01ABD100 | |
|---|---|---|---|---|---|
| CrystalDiskMark 3.0 | -20% | -39% | -30% | -28% | |
| Read Seq (MB/s) | 115.2 | 88.9 -23% | 91.8 -20% | 100.6 -13% | 105 -9% |
| Write Seq (MB/s) | 112.8 | 70.9 -37% | 84.7 -25% | 96.3 -15% | 96 -15% |
| Read 512 (MB/s) | 39.67 | 33.01 -17% | 26.59 -33% | 28.15 -29% | 32.89 -17% |
| Write 512 (MB/s) | 55.9 | 51.6 -8% | 32.7 -42% | 43.34 -22% | 25.77 -54% |
| Read 4k (MB/s) | 0.487 | 0.381 -22% | 0.288 -41% | 0.312 -36% | 0.324 -33% |
| Write 4k (MB/s) | 1.287 | 1.117 -13% | 0.638 -50% | 0.792 -38% | 0.755 -41% |
| Read 4k QD32 (MB/s) | 1.175 | 0.891 -24% | 0.59 -50% | 0.708 -40% | 0.892 -24% |
| Write 4k QD32 (MB/s) | 1.37 | 1.13 -18% | 0.642 -53% | 0.764 -44% | 1 -27% |
| 3DMark 11 Performance | 1691 puntos | |
ayuda | ||
| bajo | medio | alto | ultra | |
|---|---|---|---|---|
| BioShock Infinite (2013) | 53.4 | 30.2 | 25.2 |
Ruido
| Ocioso |
| 31.2 / 31.2 / 31.2 dB(A) |
| HDD |
| 31.8 dB(A) |
| DVD |
| 35.5 / dB(A) |
| Carga |
| 32.6 / 32.6 dB(A) |
 | ||
30 dB silencioso 40 dB(A) audible 50 dB(A) ruidosamente alto |
||
min: | ||
(+) La temperatura máxima en la parte superior es de 34.1 °C / 93 F, frente a la media de 34.3 °C / 94 F, que oscila entre 21.2 y 62.5 °C para la clase Office.
(+) El fondo se calienta hasta un máximo de 38.1 °C / 101 F, frente a la media de 36.8 °C / 98 F
(+) En reposo, la temperatura media de la parte superior es de 22.1 °C / 72# F, frente a la media del dispositivo de 29.5 °C / 85 F.
(+) Los reposamanos y el panel táctil alcanzan como máximo la temperatura de la piel (33.5 °C / 92.3 F) y, por tanto, no están calientes.
(-) La temperatura media de la zona del reposamanos de dispositivos similares fue de 27.6 °C / 81.7 F (-5.9 °C / -10.6 F).
Lenovo IdeaPad V110-17IKB 80V20006GE análisis de audio
(-) | altavoces no muy altos (#65 dB)
Graves 100 - 315 Hz
(-) | casi sin bajos - de media 23% inferior a la mediana
(±) | la linealidad de los graves es media (13.9% delta a frecuencia anterior)
Medios 400 - 2000 Hz
(±) | medias más altas - de media 6.2% más altas que la mediana
(±) | la linealidad de los medios es media (11.3% delta respecto a la frecuencia anterior)
Altos 2 - 16 kHz
(+) | máximos equilibrados - a sólo 3.6% de la mediana
(+) | los máximos son lineales (6.8% delta a la frecuencia anterior)
Total 100 - 16.000 Hz
(-) | el sonido global no es lineal (31% de diferencia con la mediana)
En comparación con la misma clase
» 93% de todos los dispositivos probados de esta clase eran mejores, 2% similares, 5% peores
» El mejor tuvo un delta de 7%, la media fue 21%, el peor fue ###max##%
En comparación con todos los dispositivos probados
» 90% de todos los dispositivos probados eran mejores, 2% similares, 8% peores
» El mejor tuvo un delta de 4%, la media fue 23%, el peor fue ###max##%
Apple MacBook 12 (Early 2016) 1.1 GHz análisis de audio
(+) | los altavoces pueden reproducir a un volumen relativamente alto (#83.6 dB)
Graves 100 - 315 Hz
(±) | lubina reducida - en promedio 11.3% inferior a la mediana
(±) | la linealidad de los graves es media (14.2% delta a frecuencia anterior)
Medios 400 - 2000 Hz
(+) | medios equilibrados - a sólo 2.4% de la mediana
(+) | los medios son lineales (5.5% delta a la frecuencia anterior)
Altos 2 - 16 kHz
(+) | máximos equilibrados - a sólo 2% de la mediana
(+) | los máximos son lineales (4.5% delta a la frecuencia anterior)
Total 100 - 16.000 Hz
(+) | el sonido global es lineal (10.2% de diferencia con la mediana)
En comparación con la misma clase
» 7% de todos los dispositivos probados de esta clase eran mejores, 2% similares, 90% peores
» El mejor tuvo un delta de 5%, la media fue 18%, el peor fue ###max##%
En comparación con todos los dispositivos probados
» 5% de todos los dispositivos probados eran mejores, 1% similares, 94% peores
» El mejor tuvo un delta de 4%, la media fue 23%, el peor fue ###max##%
| Off / Standby | |
| Ocioso | |
| Carga |
|
Clave:
min: | |
Pro
Contra
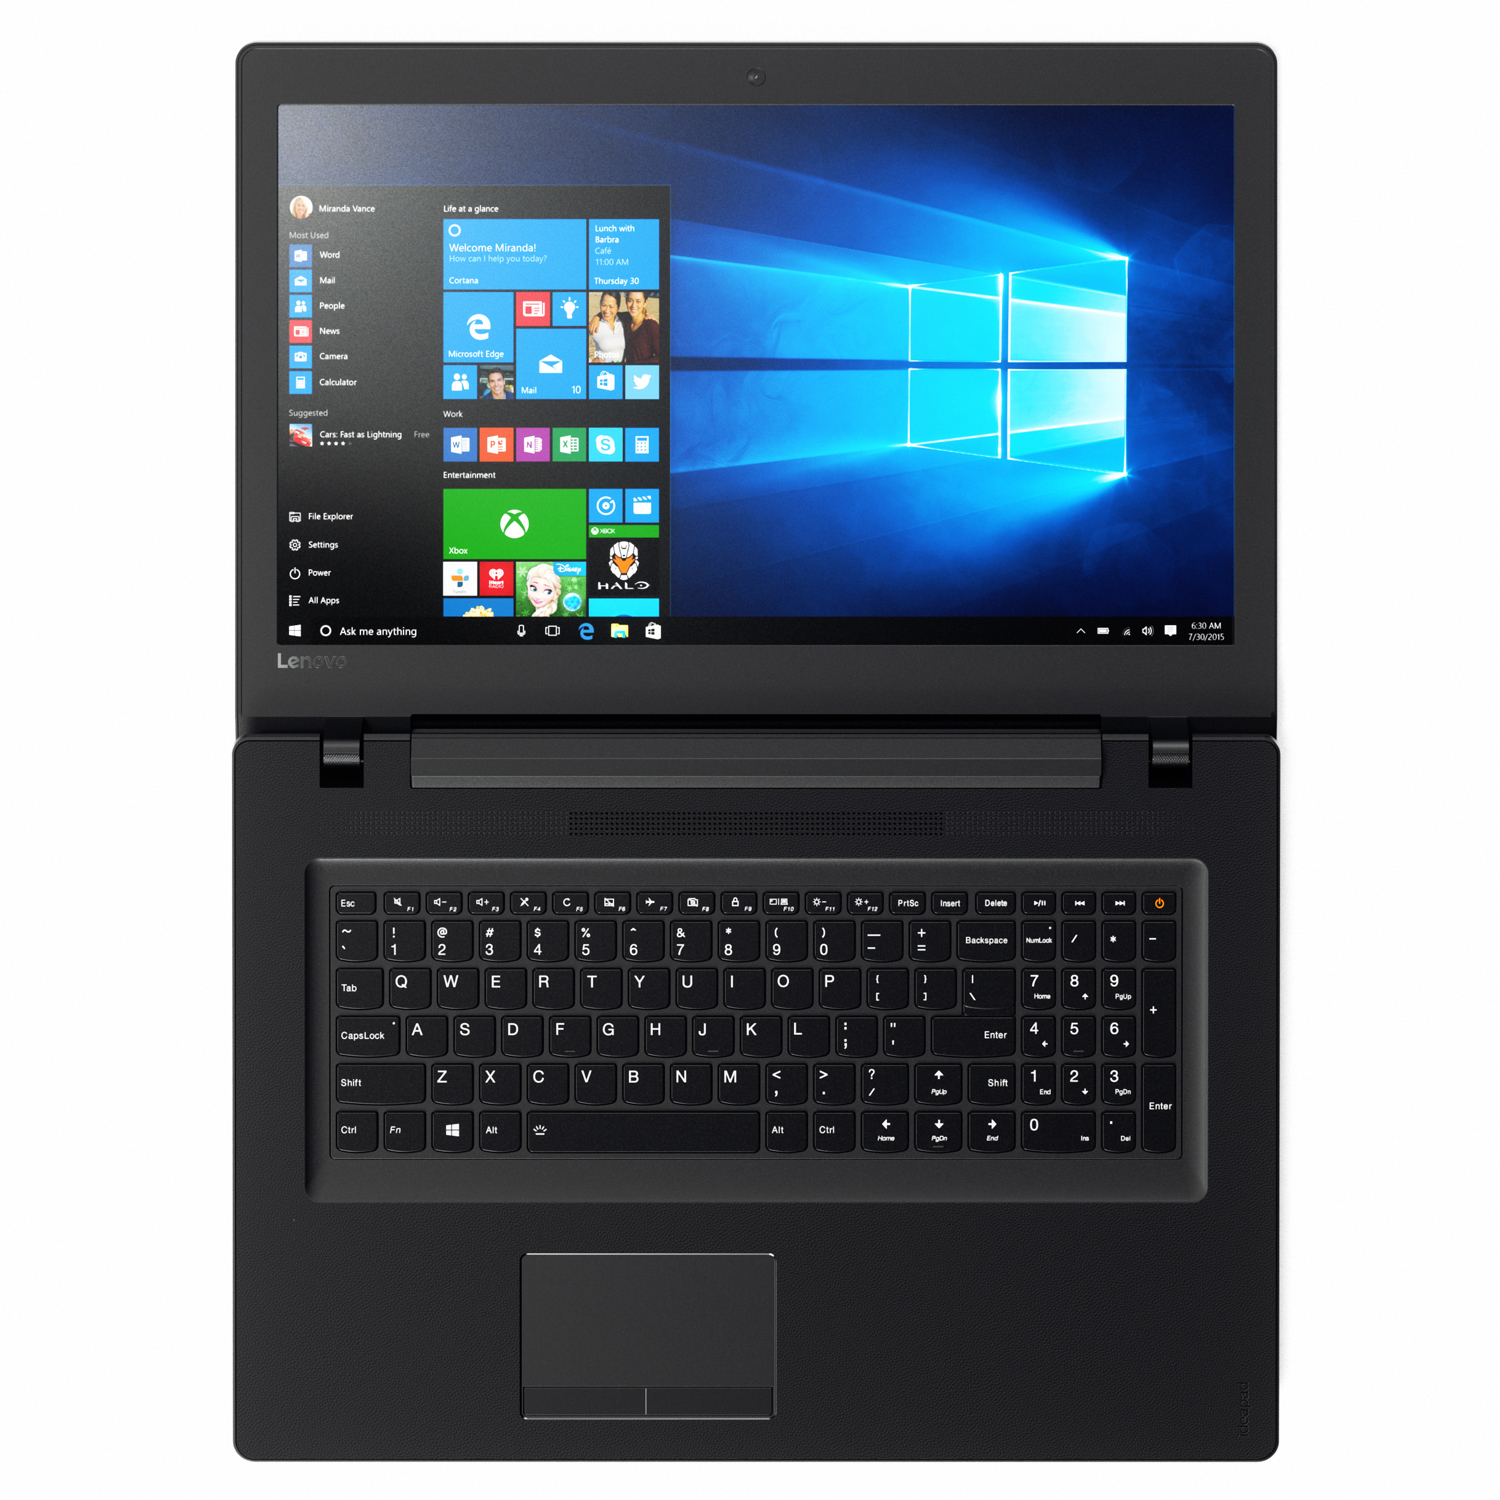
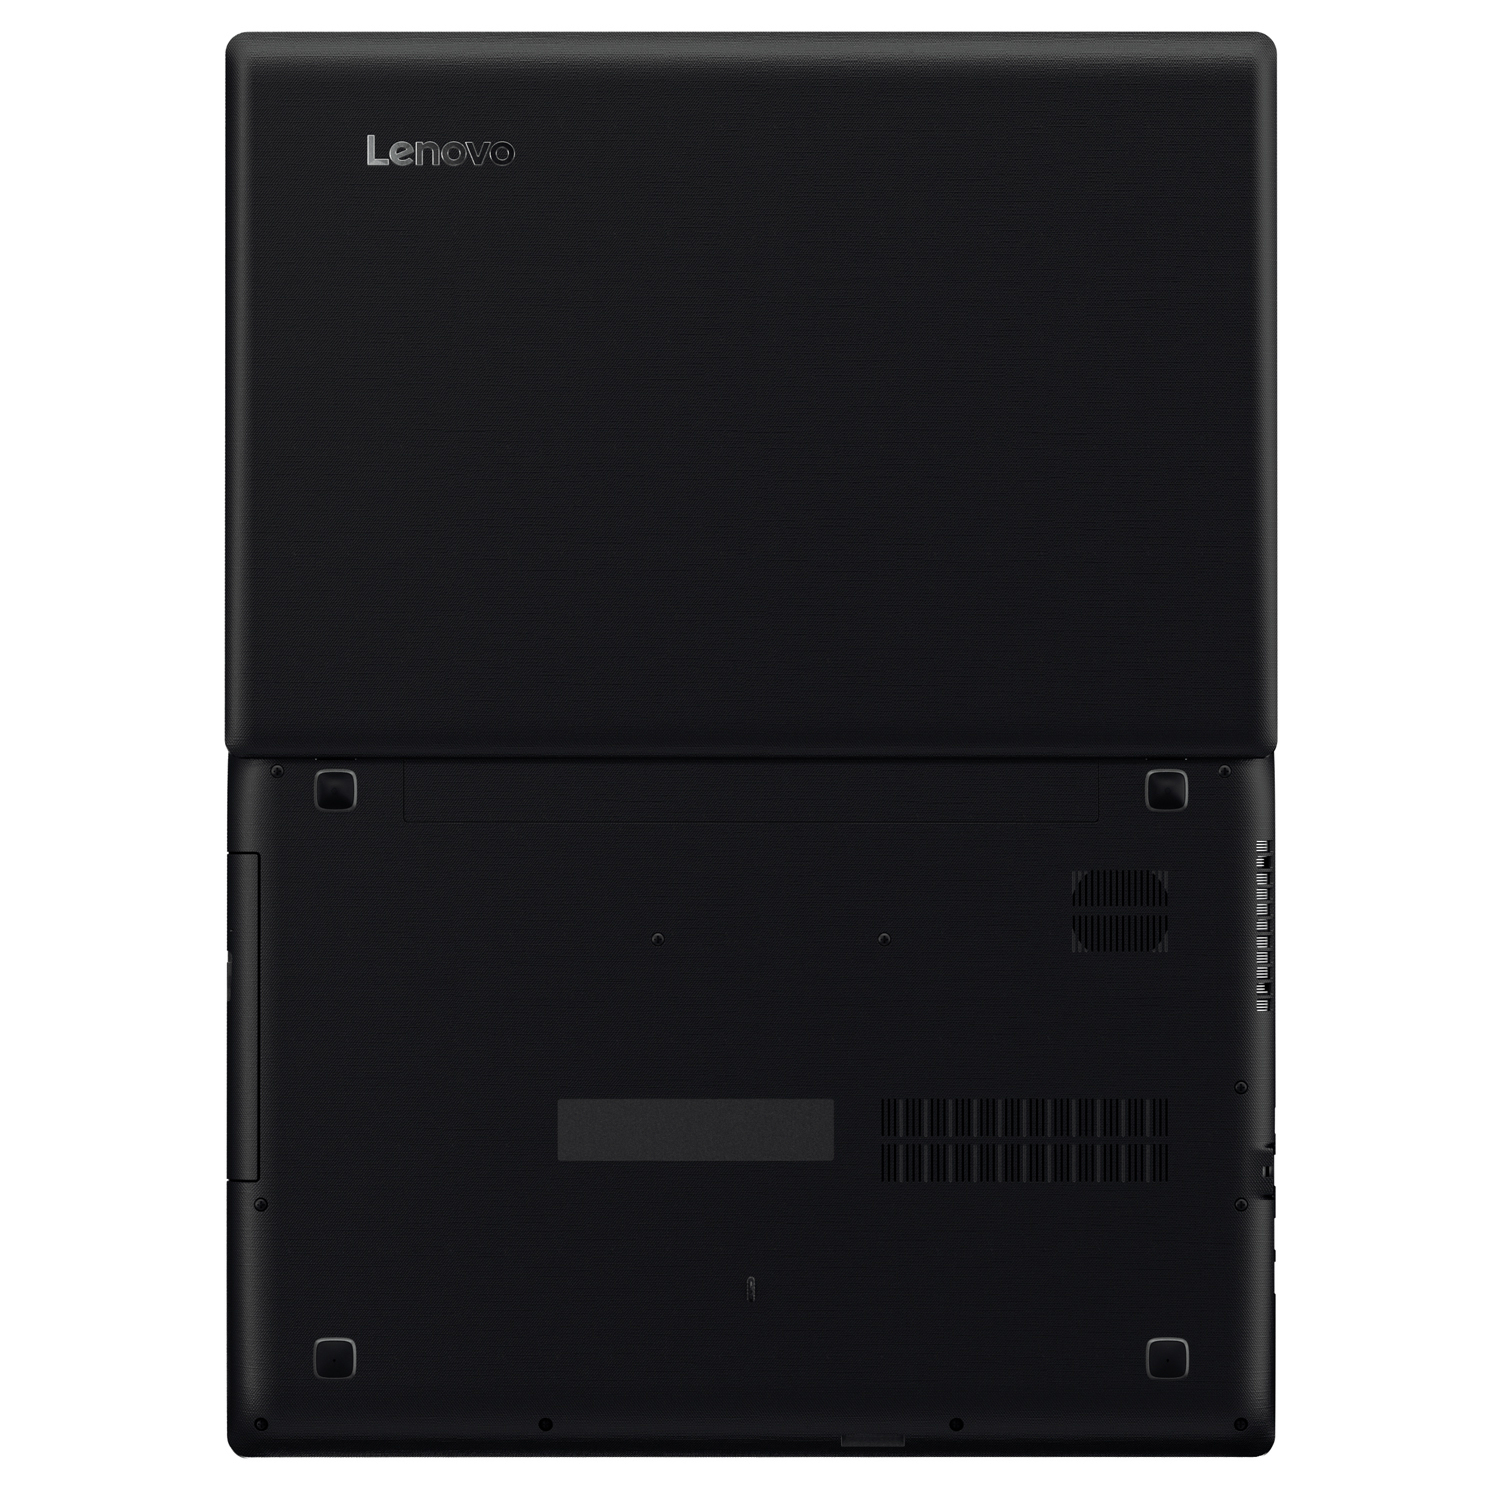
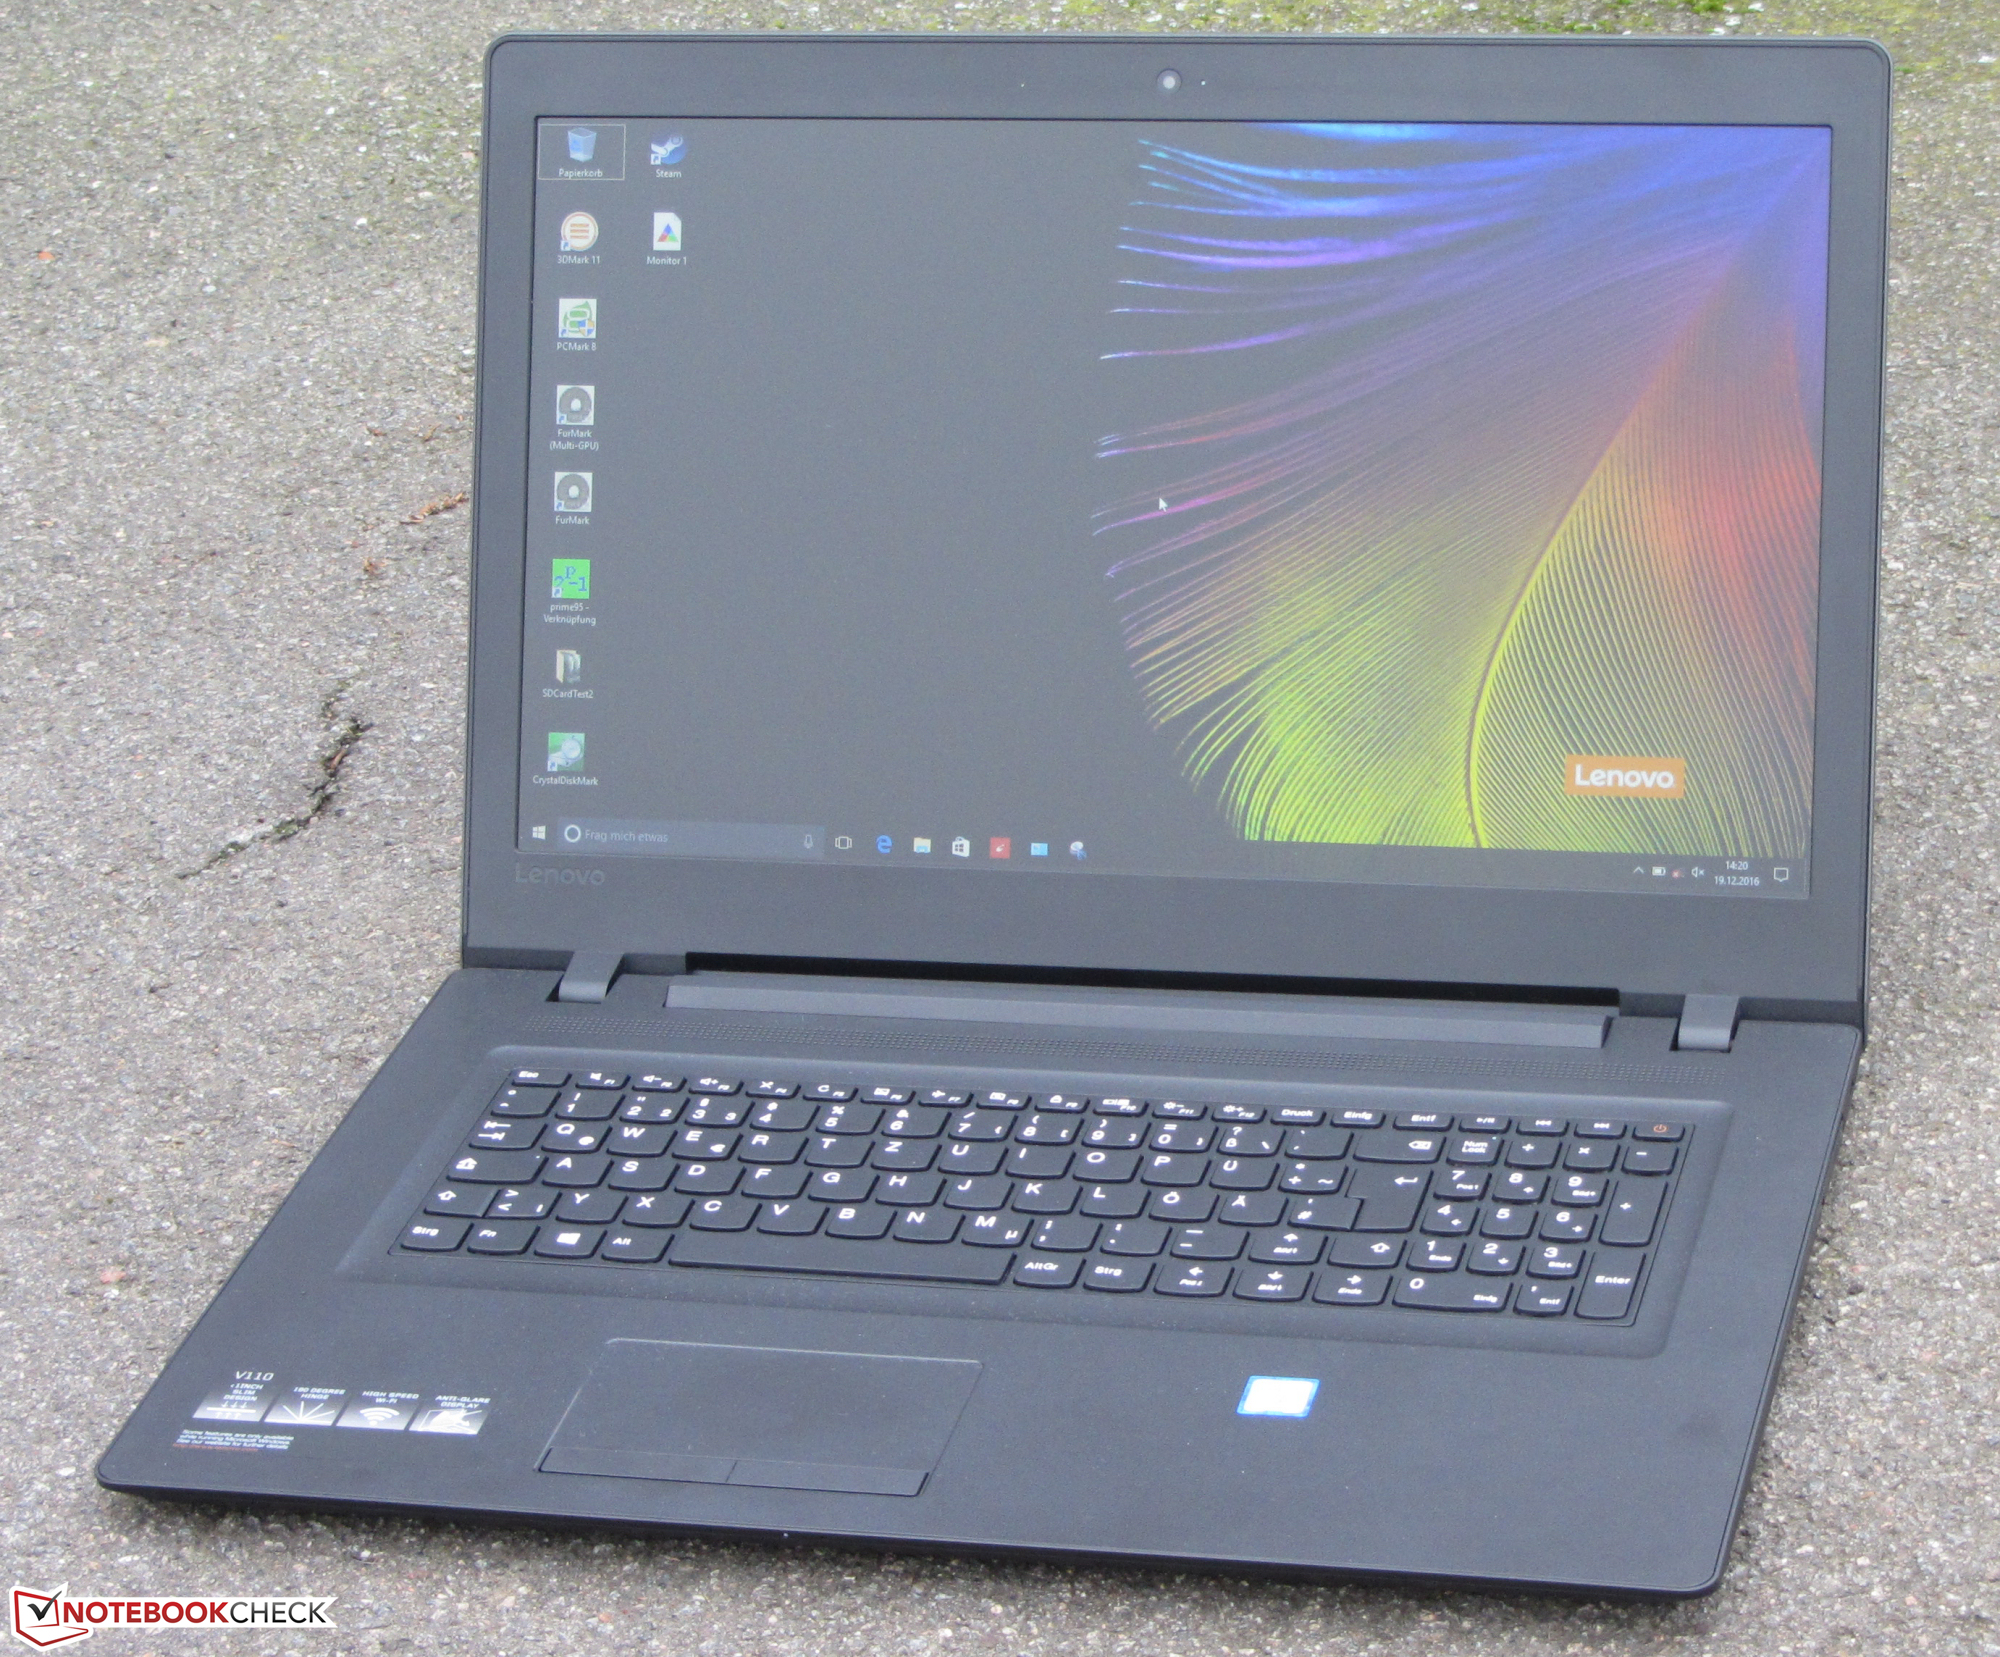
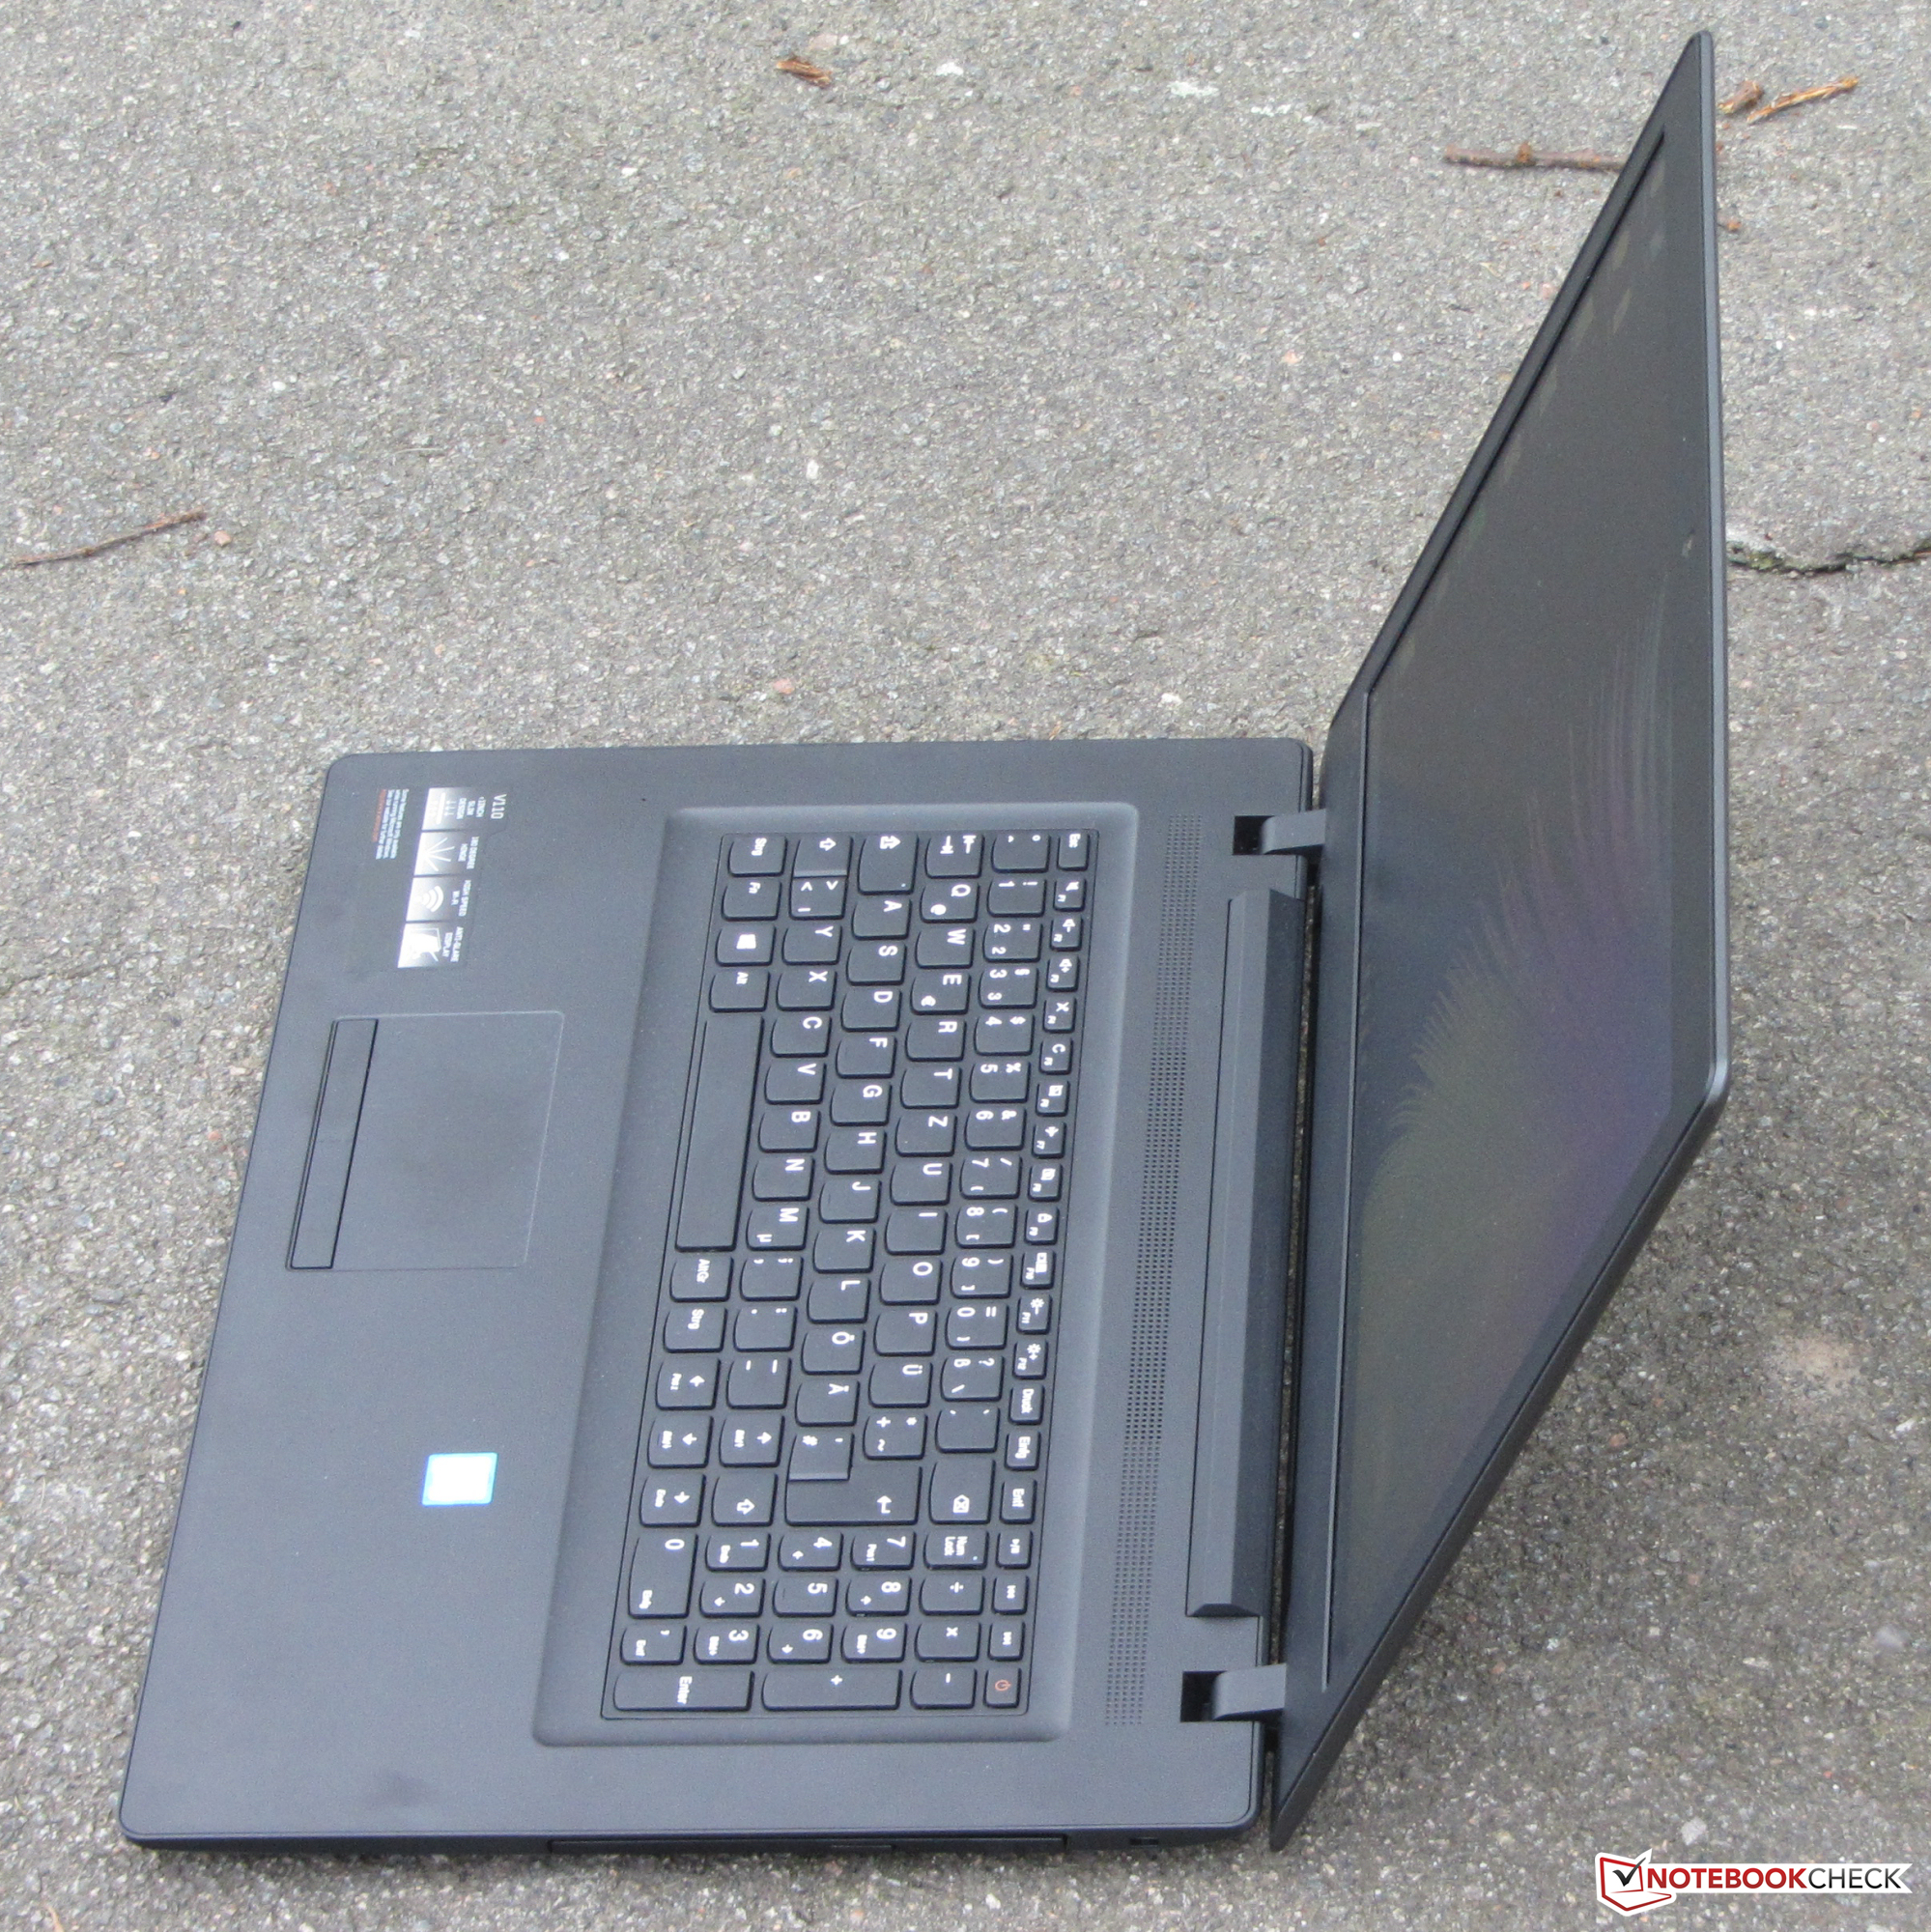
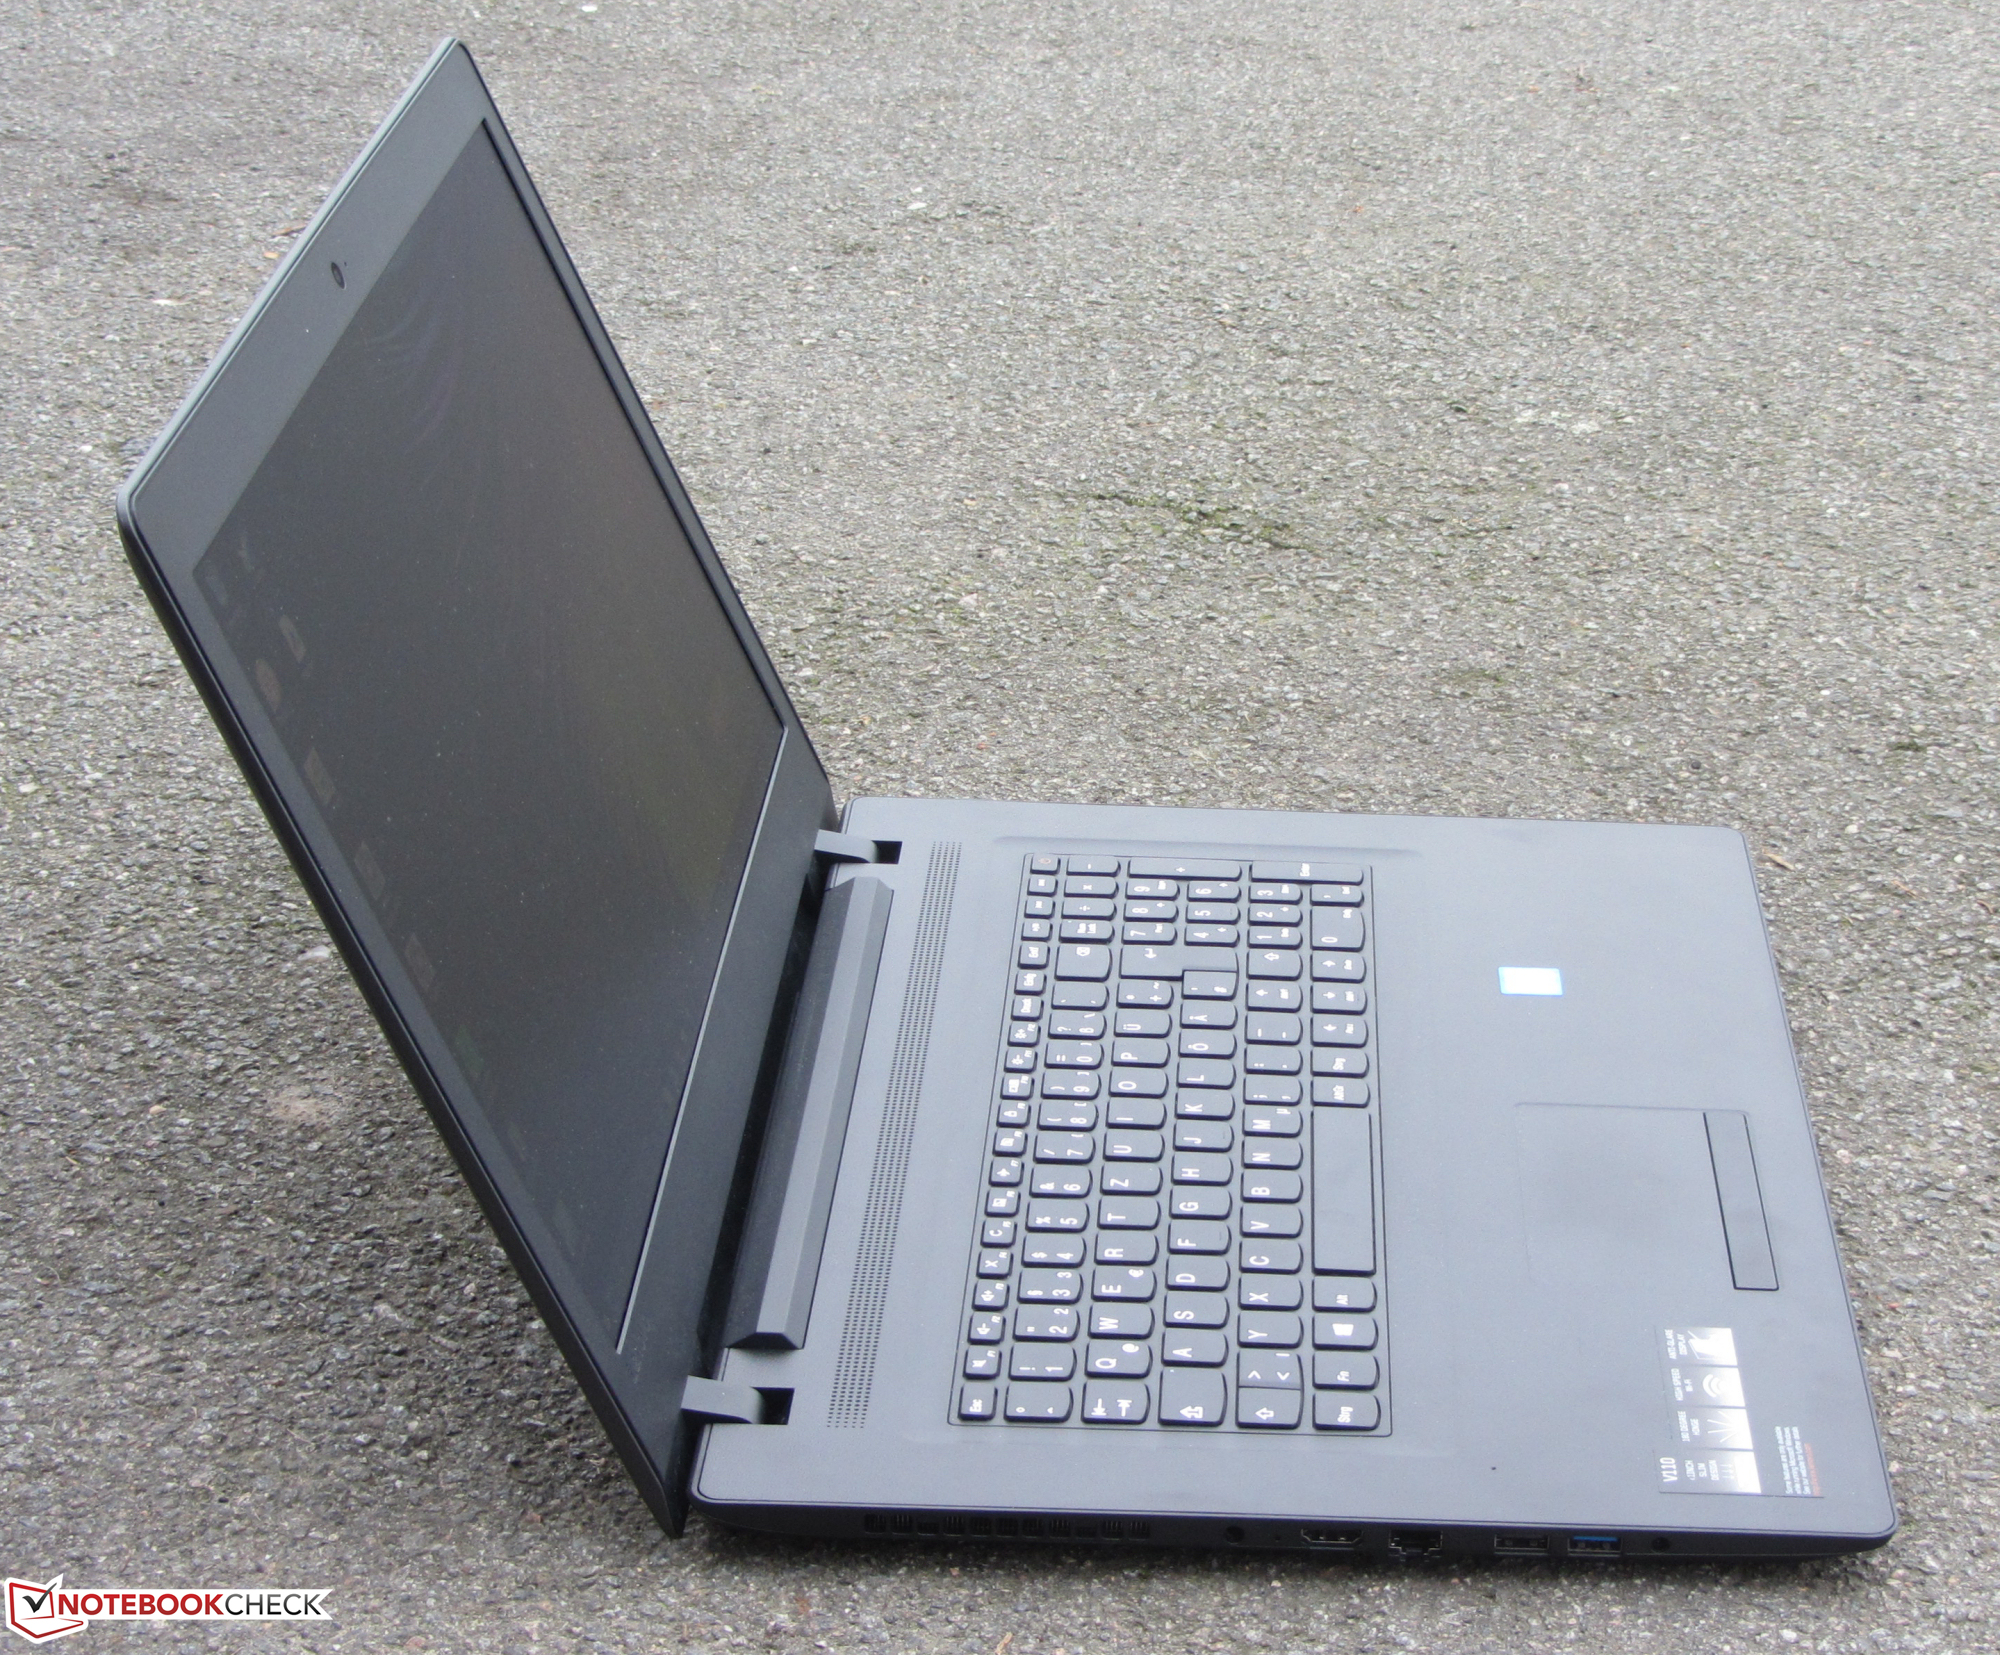
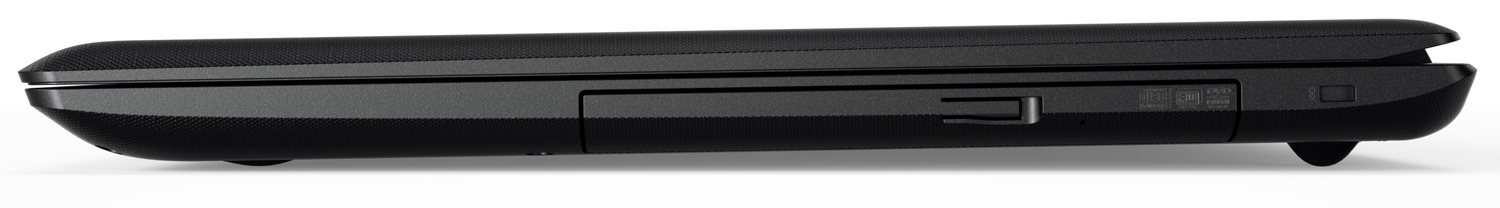
El Lenovo IdeaPad es un portátil de oficina de 17.3" dirigido a individuos y pequeñas empresas. El portátil ofrece rendimiento suficiente gracias al procesador Kaby Lake. El modelo nunca se calienta demasiado o hace demasiado ruido en inactivo. El portátil trae un HDD de 1 TB, pero para un dispositivo de esta clase, es más importante tener tiempos de carga más rápido que montones de espacio de almacenamiento. Puedes cambiar el HDD con un SSD, pero tendrás que abrir toda la carcasa ya que no hay escotilla de mantenimiento.
El teclado del portátil no es el mejor, pero es aceptable. El portátil es bueno para el uso estacionario, ya que su aguante de batería, pantalla, y tamaño limitan su uso móvil. La pantalla del modelo de 17.3" es oscura y tiene poco contraste y ángulo de visión. Nos gustan las superficies mate.
Lenovo pide mucho por este portátil, pero no cumple con nuestras expectativas.
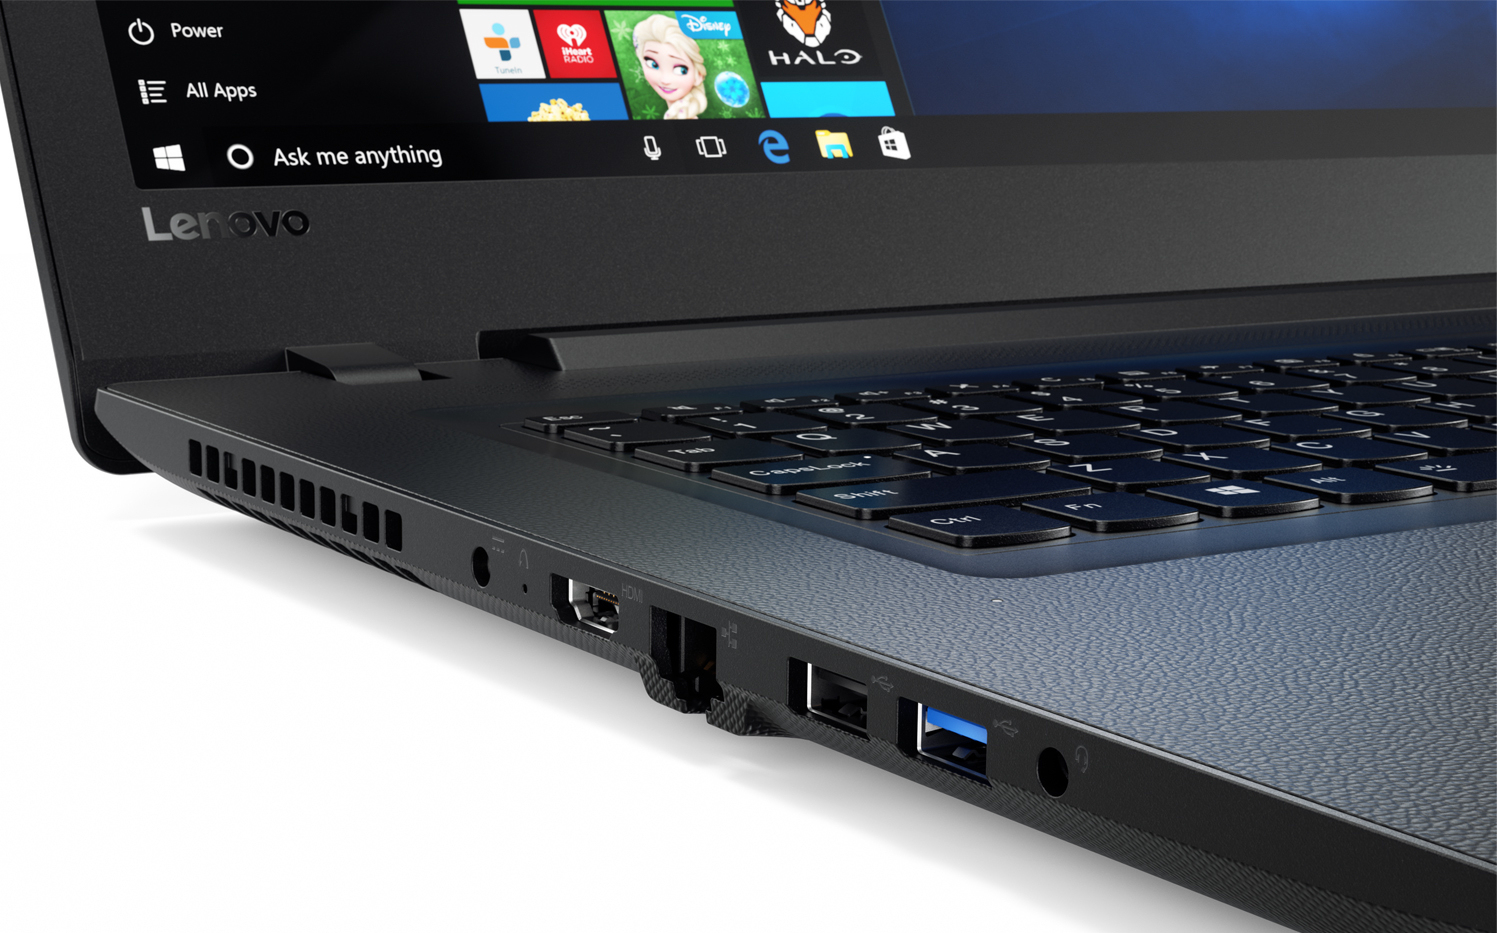
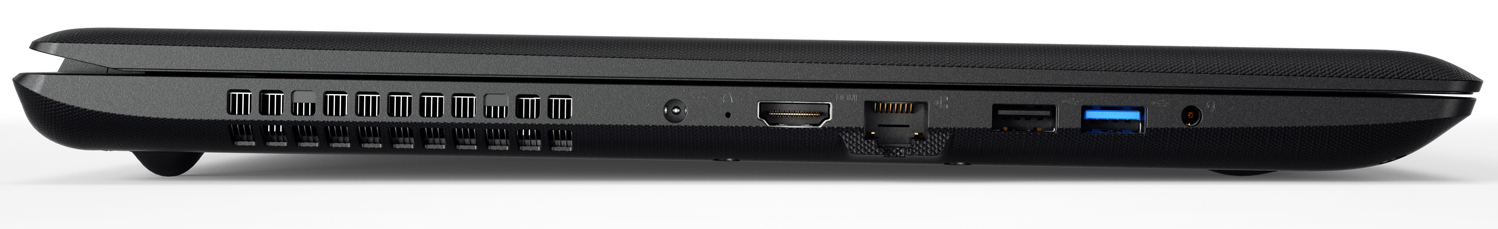
A fecha de testeo, el IdeaPad se vende por entre 600 a 700 Euros. La licencia Windows 10 Professional del portátil aumenta más el precio, pero es mucho dinero para un portátil de oficina con muchas debilidades. El portátil sólo tiene un puerto Fast Ethernet. Hoy día el estándar es Gigabit Ethernet. La garantía se limita a 1 año, pero el precio de compra debería ser motivo suficiente para una garantía de 2 años. El ventilador del portátil puede resultar una distracción con tanto silbido. Por último, la carcasa es demasiado endeble en ciertas áreas.
Para la categoría de 17.3", el Acer Aspire E5-774 es una mejor opción. El dispositivo tiene una mejor pantalla FHD, un SSD, más aguante de batería, y 2 años de garantía. El comprador tendrá que añadir el precio de una licencia Windows al de compra de 550 Euros.
Pronto publicaremos el análisis del modelo hermano, el IdeaPad 110-17IKB. Este modelo ofrecerá una GPU dedicada Radeon R5 M430.
Ésta es una versión acortada del análisis original. Puedes leer el análisis completo en inglés aquí.
Lenovo IdeaPad V110-17IKB 80V20006GE
- 12/22/2016 v6 (old)
Sascha Mölck