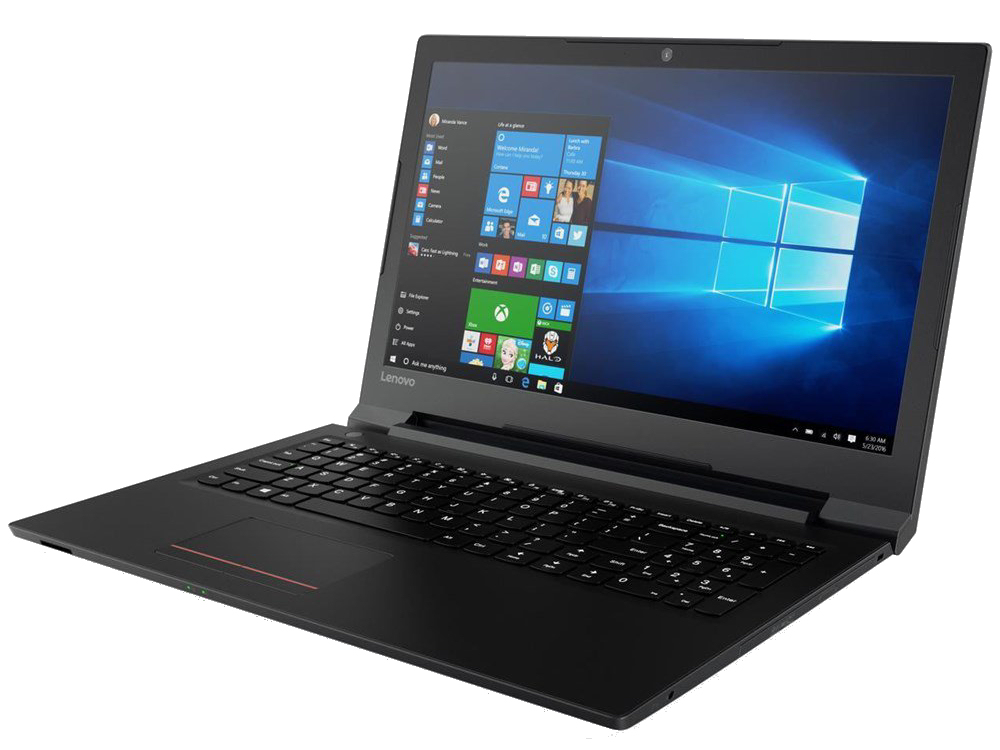
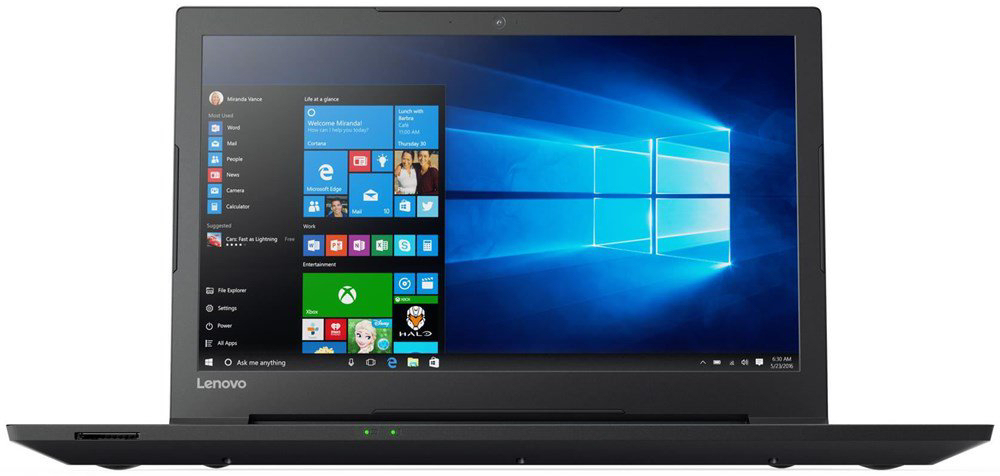
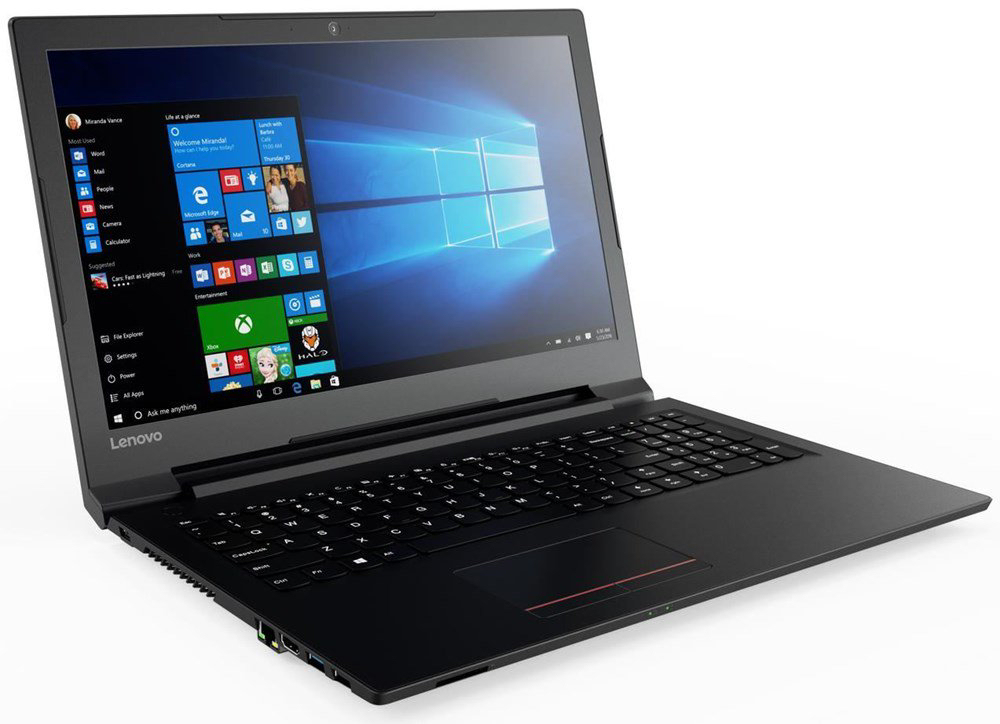
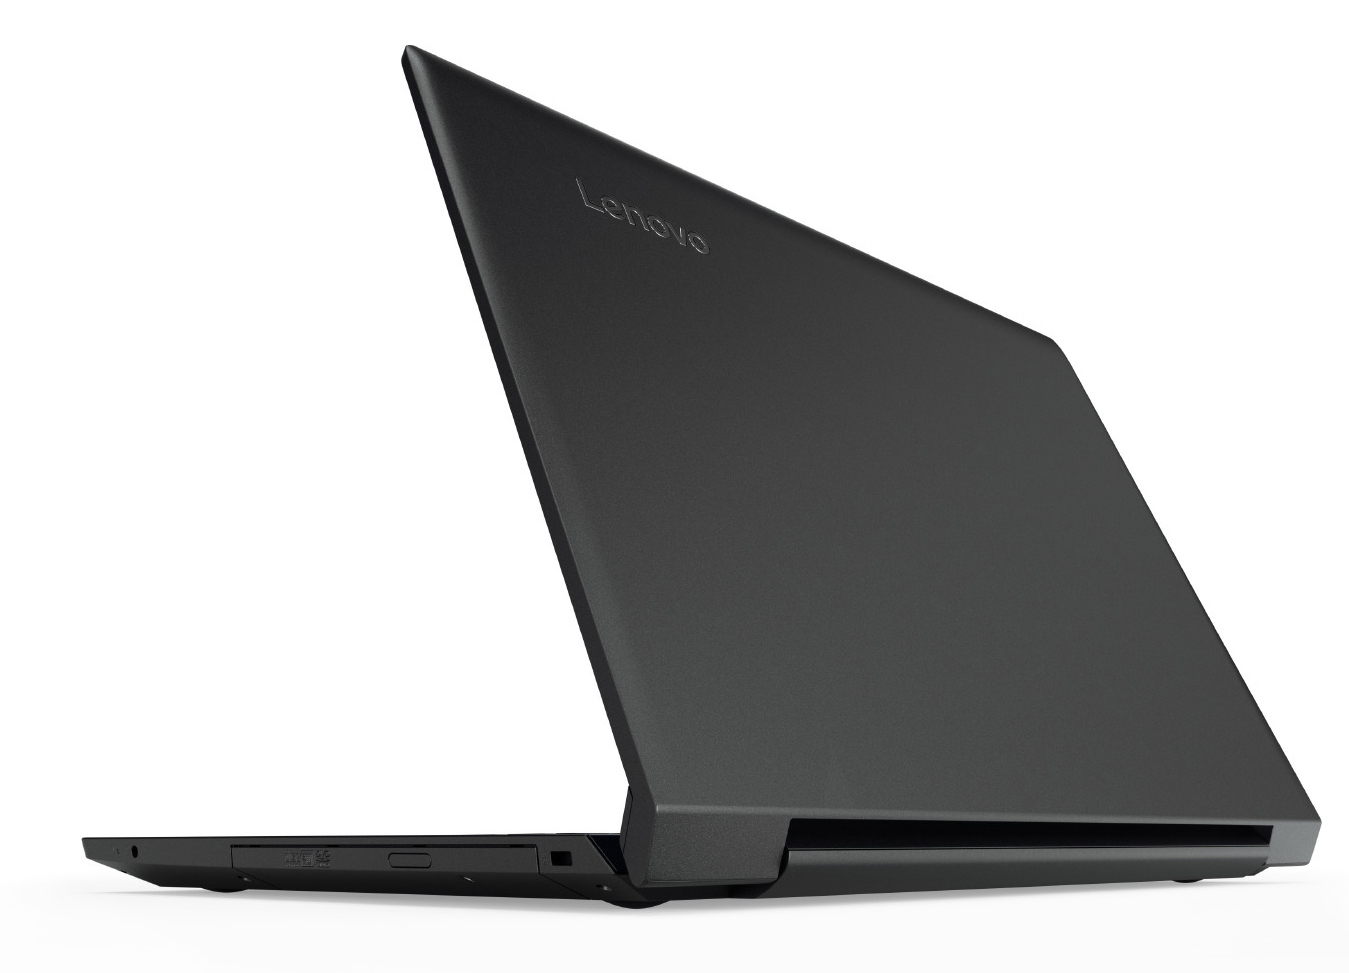
Breve análisis del portátil Lenovo V110-15IKB (Pentium 4415U, SSD, HD-Display)
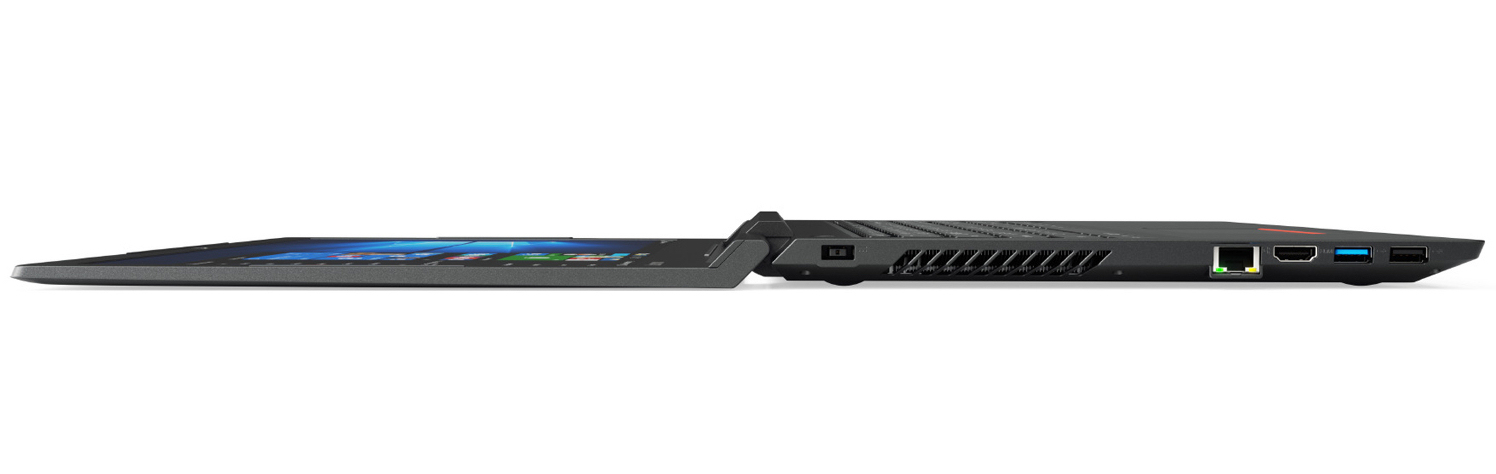
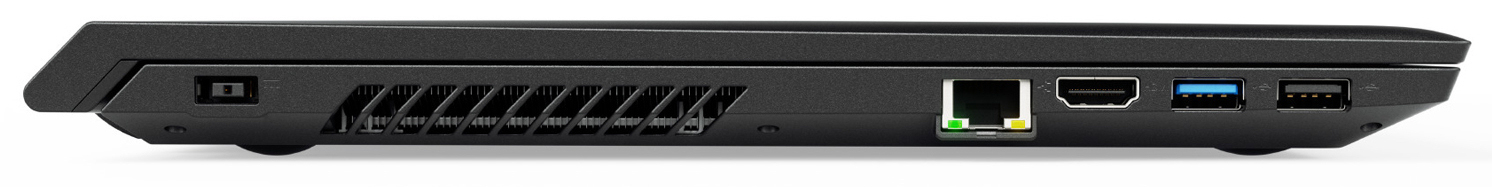
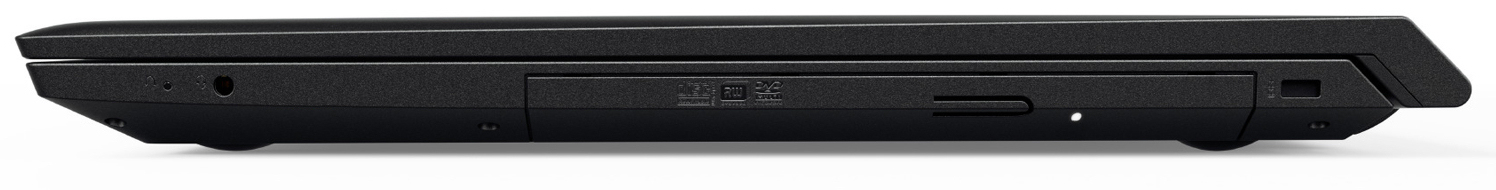
Connectivity

| SD Card Reader | |
| average JPG Copy Test (av. of 3 runs) | |
| HP 15-ba077ng (Toshiba Exceria Pro SDXC 64 GB UHS-II) | |
| Lenovo Ideapad 110-15ACL 80TJ00H0GE (Toshiba Exceria Pro SDXC 64 GB UHS-II) | |
| Lenovo IdeaPad V110-15IKB 80TH001SGE (Toshiba Exceria Pro SDXC 64 GB UHS-II) | |
| HP 250 G5 SP X0N33EA | |
| Toshiba Satellite Pro R50-C-16V (Toshiba Exceria Pro SDXC 64 GB UHS-II) | |
| Acer Aspire ES1-533-P7WA (Toshiba Exceria Pro SDXC 64 GB UHS-II) | |
| maximum AS SSD Seq Read Test (1GB) | |
| Lenovo Ideapad 110-15ACL 80TJ00H0GE (Toshiba Exceria Pro SDXC 64 GB UHS-II) | |
| HP 15-ba077ng (Toshiba Exceria Pro SDXC 64 GB UHS-II) | |
| Acer Aspire ES1-533-P7WA (Toshiba Exceria Pro SDXC 64 GB UHS-II) | |
| Lenovo IdeaPad V110-15IKB 80TH001SGE (Toshiba Exceria Pro SDXC 64 GB UHS-II) | |
| Toshiba Satellite Pro R50-C-16V (Toshiba Exceria Pro SDXC 64 GB UHS-II) | |
| |||||||||||||||||||||||||
iluminación: 75 %
Brillo con batería: 245 cd/m²
Contraste: 540:1 (Negro: 0.45 cd/m²)
ΔE ColorChecker Calman: 11.69 | ∀{0.5-29.43 Ø4.71}
ΔE Greyscale Calman: 13.12 | ∀{0.09-98 Ø4.96}
59% sRGB (Argyll 1.6.3 3D)
37% AdobeRGB 1998 (Argyll 1.6.3 3D)
40.2% AdobeRGB 1998 (Argyll 3D)
58.6% sRGB (Argyll 3D)
38.91% Display P3 (Argyll 3D)
Gamma: 2.24
CCT: 16905 K
| Lenovo IdeaPad V110-15IKB 80TH001SGE TN LED, 1366x768, 15.6" | HP 15-ba077ng TN LED, 1920x1080, 15.6" | Acer Aspire ES1-533-P7WA TN LED, 1920x1080, 15.6" | Lenovo Ideapad 110-15ACL 80TJ00H0GE TN LED, 1366x768, 15.6" | HP 250 G5 SP X0N33EA TN, 1920x1080, 15.6" | Toshiba Satellite Pro R50-C-16V TN LED, 1366x768, 15.6" | |
|---|---|---|---|---|---|---|
| Display | 3% | -2% | -4% | -6% | 4% | |
| Display P3 Coverage (%) | 38.91 | 39.98 3% | 38.04 -2% | 37.39 -4% | 36.51 -6% | 40.6 4% |
| sRGB Coverage (%) | 58.6 | 60.2 3% | 57.2 -2% | 56.2 -4% | 55 -6% | 61.2 4% |
| AdobeRGB 1998 Coverage (%) | 40.2 | 41.31 3% | 39.3 -2% | 38.63 -4% | 37.72 -6% | 41.95 4% |
| Response Times | -12% | -16% | -35% | -10% | -56% | |
| Response Time Grey 50% / Grey 80% * (ms) | 39 ? | 42 ? -8% | 43 ? -10% | 58 -49% | 40 ? -3% | 68 ? -74% |
| Response Time Black / White * (ms) | 19 ? | 22 ? -16% | 23 ? -21% | 23 -21% | 22 ? -16% | 26 ? -37% |
| PWM Frequency (Hz) | 10000 ? | 50 ? | 200 ? | 217 ? | ||
| Screen | -7% | -7% | 7% | -2% | 1% | |
| Brightness middle (cd/m²) | 243 | 209 -14% | 201 -17% | 253 4% | 219 -10% | 226 -7% |
| Brightness (cd/m²) | 233 | 200 -14% | 202 -13% | 246 6% | 222 -5% | 217 -7% |
| Brightness Distribution (%) | 75 | 88 17% | 92 23% | 86 15% | 85 13% | 91 21% |
| Black Level * (cd/m²) | 0.45 | 0.56 -24% | 0.67 -49% | 0.44 2% | 0.39 13% | 0.58 -29% |
| Contrast (:1) | 540 | 373 -31% | 300 -44% | 575 6% | 562 4% | 390 -28% |
| Colorchecker dE 2000 * | 11.69 | 12.21 -4% | 10.36 11% | 9.2 21% | 12.67 -8% | 9.84 16% |
| Colorchecker dE 2000 max. * | 20.08 | 20.66 -3% | 18.88 6% | 17.68 12% | 20.99 -5% | 16.77 16% |
| Greyscale dE 2000 * | 13.12 | 13.48 -3% | 11.06 16% | 11.05 16% | 13.82 -5% | 11.1 15% |
| Gamma | 2.24 98% | 2.34 94% | 2.56 86% | 2.55 86% | 2.63 84% | 2.35 94% |
| CCT | 16905 38% | 15364 42% | 11368 57% | 11451 57% | 15633 42% | 11979 54% |
| Color Space (Percent of AdobeRGB 1998) (%) | 37 | 38 3% | 36 -3% | 36 -3% | 35 -5% | 39 5% |
| Color Space (Percent of sRGB) (%) | 59 | 60 2% | 57 -3% | 56 -5% | 55 -7% | 61 3% |
| Media total (Programa/Opciones) | -5% /
-6% | -8% /
-7% | -11% /
-1% | -6% /
-3% | -17% /
-6% |
* ... más pequeño es mejor
Parpadeo de Pantalla / PWM (Pulse-Width Modulation)
| Parpadeo de Pantalla / PWM detectado | 10000 Hz | ≤ 20 % de brillo | 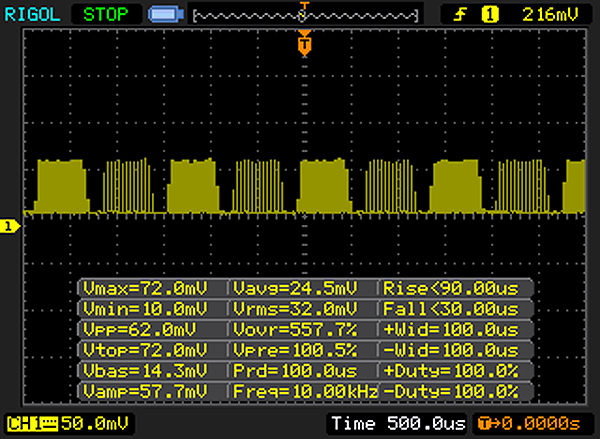 |
La retroiluminación del display parpadea a 10000 Hz (seguramente usa PWM - Pulse-Width Modulation) a un brillo del 20 % e inferior. Sobre este nivel de brillo no debería darse parpadeo / PWM. La frecuencia de 10000 Hz es bastante alta, por lo que la mayoría de gente sensible al parpadeo no debería ver parpadeo o tener fatiga visual. Comparación: 52 % de todos los dispositivos testados no usaron PWM para atenuar el display. Si se usó, medimos una media de 7757 (mínimo: 5 - máxmo: 343500) Hz. | |||
Tiempos de respuesta del display
| ↔ Tiempo de respuesta de Negro a Blanco | ||
|---|---|---|
| 19 ms ... subida ↗ y bajada ↘ combinada | ↗ 14 ms subida | 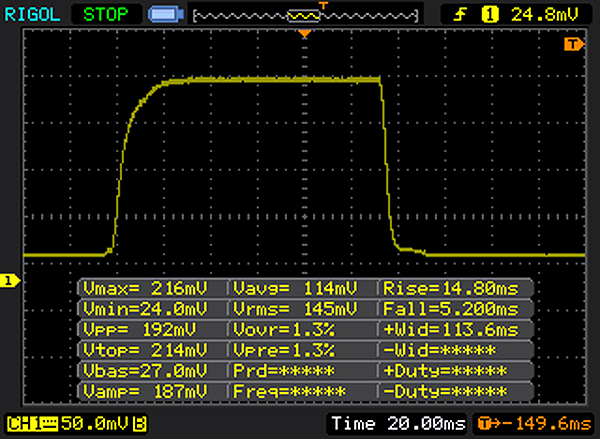 |
| ↘ 5 ms bajada | ||
| La pantalla mostró buenos tiempos de respuesta en nuestros tests pero podría ser demasiado lenta para los jugones competitivos. En comparación, todos los dispositivos de prueba van de ##min### (mínimo) a 240 (máximo) ms. » 42 % de todos los dispositivos son mejores. Eso quiere decir que el tiempo de respuesta es similar al dispositivo testado medio (19.8 ms). | ||
| ↔ Tiempo de respuesta 50% Gris a 80% Gris | ||
| 39 ms ... subida ↗ y bajada ↘ combinada | ↗ 21 ms subida | 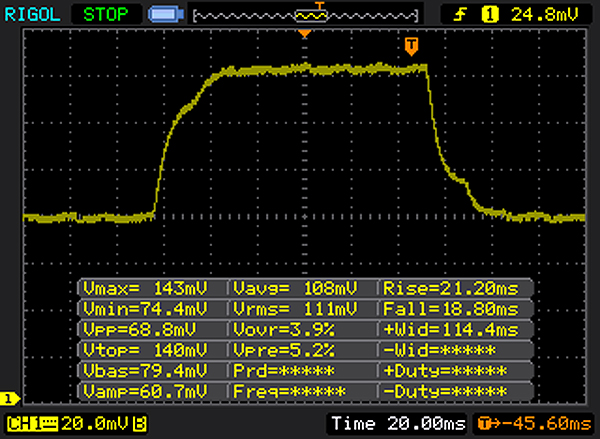 |
| ↘ 18 ms bajada | ||
| La pantalla mostró tiempos de respuesta lentos en nuestros tests y podría ser demasiado lenta para los jugones. En comparación, todos los dispositivos de prueba van de ##min### (mínimo) a 636 (máximo) ms. » 59 % de todos los dispositivos son mejores. Eso quiere decir que el tiempo de respuesta es peor que la media (31 ms) de todos los dispositivos testados. | ||
| Geekbench 4.4 | |
| 64 Bit Multi-Core Score | |
| Asus X510UA-BR305T | |
| Lenovo IdeaPad V110-15IKB 80TH001SGE | |
| 64 Bit Single-Core Score | |
| Asus X510UA-BR305T | |
| Lenovo IdeaPad V110-15IKB 80TH001SGE | |
| PCMark 7 Score | 4795 puntos | |
| PCMark 8 Home Score Accelerated v2 | 3230 puntos | |
| PCMark 8 Creative Score Accelerated v2 | 3514 puntos | |
| PCMark 8 Work Score Accelerated v2 | 4224 puntos | |
| PCMark 10 Score | 2492 puntos | |
ayuda | ||

| Lenovo IdeaPad V110-15IKB 80TH001SGE Ramxel S121 RTNRB256RFM4KWDL | HP 15-ba077ng SanDisk Z400s SD8SNAT-256G | Acer Aspire ES1-533-P7WA Toshiba MQ01ABD100 | Lenovo Ideapad 110-15ACL 80TJ00H0GE Seagate Mobile HDD 1TB ST1000LM035 | HP 250 G5 SP X0N33EA SanDisk Z400s SD8SNAT-256G | Toshiba Satellite Pro R50-C-16V TOSHIBA MQ01ABD075 | |
|---|---|---|---|---|---|---|
| CrystalDiskMark 3.0 | -19% | -91% | -91% | -5% | -92% | |
| Read Seq (MB/s) | 477.4 | 447.4 -6% | 107.6 -77% | 92.1 -81% | 509 7% | 96.5 -80% |
| Write Seq (MB/s) | 284.2 | 243.3 -14% | 96.6 -66% | 88.5 -69% | 322.1 13% | 77.9 -73% |
| Read 512 (MB/s) | 356.3 | 333.4 -6% | 22.5 -94% | 32.94 -91% | 321.2 -10% | 20.82 -94% |
| Write 512 (MB/s) | 282.3 | 283.1 0% | 24.23 -91% | 26.71 -91% | 289.4 3% | 19.83 -93% |
| Read 4k (MB/s) | 24.15 | 20.99 -13% | 0.474 -98% | 0.372 -98% | 20.99 -13% | 0.342 -99% |
| Write 4k (MB/s) | 71.9 | 62.7 -13% | 1.089 -98% | 0.283 -100% | 88 22% | 0.836 -99% |
| Read 4k QD32 (MB/s) | 283.7 | 143.1 -50% | 0.861 -100% | 0.921 -100% | 141.3 -50% | 0.595 -100% |
| Write 4k QD32 (MB/s) | 257.3 | 138 -46% | 0.991 -100% | 0.473 -100% | 228.5 -11% | 0.706 -100% |
| 3DMark 05 Standard | 11469 puntos | |
| 3DMark 06 Standard Score | 6869 puntos | |
| 3DMark Vantage P Result | 3715 puntos | |
| 3DMark 11 Performance | 1005 puntos | |
| 3DMark Ice Storm Standard Score | 50537 puntos | |
| 3DMark Cloud Gate Standard Score | 4422 puntos | |
| 3DMark Fire Strike Score | 566 puntos | |
| 3DMark Fire Strike Extreme Score | 272 puntos | |
ayuda | ||
| 3DMark | |
| 1280x720 Ice Storm Standard Graphics | |
| Lenovo V320-17IKB 81AH0002GE | |
| Lenovo ThinkPad E570-20H6S02M00 | |
| Asus Vivobook F556UQ-XO626D | |
| Lenovo IdeaPad V110-15IKB 80TH001SGE | |
| HP 15-ba077ng | |
| HP Pavilion 15-aw004ng | |
| HP 250 G5 SP X0N33EA | |
| Lenovo Yoga 510-14IKB | |
| 1280x720 Cloud Gate Standard Graphics | |
| HP Pavilion 15-aw004ng | |
| Lenovo V320-17IKB 81AH0002GE | |
| HP 15-ba077ng | |
| Lenovo ThinkPad E570-20H6S02M00 | |
| HP 250 G5 SP X0N33EA | |
| Asus Vivobook F556UQ-XO626D | |
| Lenovo IdeaPad V110-15IKB 80TH001SGE | |
| Lenovo Yoga 510-14IKB | |
| HP 15-bw077ax | |
| 1920x1080 Fire Strike Graphics | |
| HP Pavilion 15-aw004ng | |
| HP 15-ba077ng | |
| Lenovo V320-17IKB 81AH0002GE | |
| Lenovo Yoga 510-14IKB | |
| Lenovo ThinkPad E570-20H6S02M00 | |
| HP 15-bw077ax | |
| Lenovo IdeaPad V110-15IKB 80TH001SGE | |
| Asus Vivobook F556UQ-XO626D | |
| bajo | medio | alto | ultra | |
|---|---|---|---|---|
| World of Warcraft (2005) | 125.5 | 61.2 | ||
| Deus Ex Human Revolution (2011) | 50.7 | 29.4 | ||
| The Elder Scrolls V: Skyrim (2011) | 27.8 | 18.6 | 13.6 | |
| Anno 2070 (2011) | 66 | 29.3 | 17.9 | |
| Diablo III (2012) | 39.4 | 25.8 | 22.4 | |
| Counter-Strike: GO (2012) | 94.2 | 70.4 | 42.8 | |
| Tomb Raider (2013) | 50.8 | 23.7 | 16 | |
| BioShock Infinite (2013) | 39.1 | 20.4 | 17.7 | |
| GRID: Autosport (2014) | 106 | 32.7 | ||
| Sims 4 (2014) | 168.9 | 32.5 | ||
| F1 2014 (2014) | 61 | 42 | ||
| Metal Gear Solid V (2015) | 38.5 | 25.2 | ||
| Dota 2 Reborn (2015) | 52.5 | 34.9 | ||
| World of Warships (2015) | 47.3 | 28.8 | ||
| Rainbow Six Siege (2015) | 22.4 | 16.2 | ||
| Overwatch (2016) | 27 | 19.2 | ||
| Battlefield 1 (2016) | 16.1 | 8.9 | ||
| Farming Simulator 17 (2016) | 66.1 | 41.1 | ||
| Resident Evil 7 (2017) | 18.9 | |||
| For Honor (2017) | 13.5 | |||
| Rocket League (2017) | 48.9 | |||
| Team Fortress 2 (2017) | 57.7 | 55.8 | ||
| FIFA 18 (2017) | 35.1 |
Ruido
| Ocioso |
| 30.5 / 30.5 / 31.6 dB(A) |
| Carga |
| 34.3 / 34.8 dB(A) |
 | ||
30 dB silencioso 40 dB(A) audible 50 dB(A) ruidosamente alto |
||
min: | ||
(+) La temperatura máxima en la parte superior es de 32.5 °C / 91 F, frente a la media de 34.3 °C / 94 F, que oscila entre 21.2 y 62.5 °C para la clase Office.
(+) El fondo se calienta hasta un máximo de 31.7 °C / 89 F, frente a la media de 36.8 °C / 98 F
(+) En reposo, la temperatura media de la parte superior es de 22 °C / 72# F, frente a la media del dispositivo de 29.5 °C / 85 F.
(+) El reposamanos y el panel táctil están a una temperatura inferior a la de la piel, con un máximo de 30.8 °C / 87.4 F y, por tanto, son fríos al tacto.
(-) La temperatura media de la zona del reposamanos de dispositivos similares fue de 27.5 °C / 81.5 F (-3.3 °C / -5.9 F).
Lenovo IdeaPad V110-15IKB 80TH001SGE análisis de audio
(-) | altavoces no muy altos (#70.2 dB)
Graves 100 - 315 Hz
(-) | casi sin bajos - de media 27.4% inferior a la mediana
(±) | la linealidad de los graves es media (8.2% delta a frecuencia anterior)
Medios 400 - 2000 Hz
(±) | medios reducidos - de media 11.8% inferior a la mediana
(±) | la linealidad de los medios es media (12.9% delta respecto a la frecuencia anterior)
Altos 2 - 16 kHz
(±) | máximos más altos - de media 9.5% más altos que la mediana
(±) | la linealidad de los máximos es media (10.4% delta a frecuencia anterior)
Total 100 - 16.000 Hz
(-) | el sonido global no es lineal (42.4% de diferencia con la mediana)
En comparación con la misma clase
» 99% de todos los dispositivos probados de esta clase eran mejores, 0% similares, 1% peores
» El mejor tuvo un delta de 7%, la media fue 21%, el peor fue ###max##%
En comparación con todos los dispositivos probados
» 95% de todos los dispositivos probados eran mejores, 0% similares, 4% peores
» El mejor tuvo un delta de 4%, la media fue 23%, el peor fue ###max##%
Apple MacBook 12 (Early 2016) 1.1 GHz análisis de audio
(+) | los altavoces pueden reproducir a un volumen relativamente alto (#83.6 dB)
Graves 100 - 315 Hz
(±) | lubina reducida - en promedio 11.3% inferior a la mediana
(±) | la linealidad de los graves es media (14.2% delta a frecuencia anterior)
Medios 400 - 2000 Hz
(+) | medios equilibrados - a sólo 2.4% de la mediana
(+) | los medios son lineales (5.5% delta a la frecuencia anterior)
Altos 2 - 16 kHz
(+) | máximos equilibrados - a sólo 2% de la mediana
(+) | los máximos son lineales (4.5% delta a la frecuencia anterior)
Total 100 - 16.000 Hz
(+) | el sonido global es lineal (10.2% de diferencia con la mediana)
En comparación con la misma clase
» 7% de todos los dispositivos probados de esta clase eran mejores, 2% similares, 90% peores
» El mejor tuvo un delta de 5%, la media fue 18%, el peor fue ###max##%
En comparación con todos los dispositivos probados
» 5% de todos los dispositivos probados eran mejores, 1% similares, 94% peores
» El mejor tuvo un delta de 4%, la media fue 23%, el peor fue ###max##%
| Off / Standby | |
| Ocioso | |
| Carga |
|
Clave:
min: | |
Pro
Contra
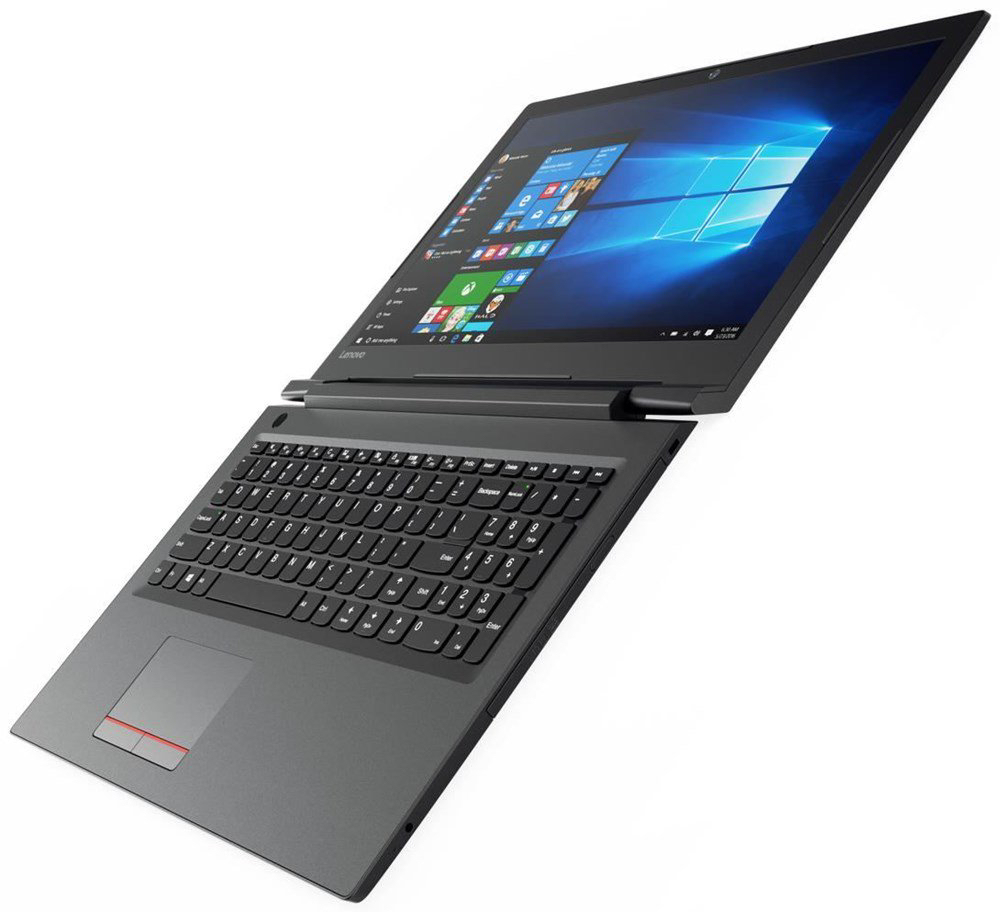
El Lenovo V110-15IKB cuenta con todo lo que necesita un portátil de uso doméstico: un procesador suficientemente fuerte, una SSD rápida y una RAM que funciona en modo de doble canal. También tiene instalado un teclado decente. En total el paquete cuesta unos 400 €.
El portatil de 15.6" de Lenovo consigue puntos con un muy buen ratio precio-rendimiento.
El nivel de precios relativamente bajo también tiene sus pegas. La pantalla no gana ningún premio. Es demasiado oscura, su contraste es demasiado bajo, y también depende del ángulo de visión. El aguante de la batería en Wi-Fi y la rigidez relativamente baja de la carcasa excluyen en gran medida el uso móvil. Además, Lenovo sólo incluye una garantía de un año. No se puede culpar al bajo precio por el ventilador que chirriaba - después de todo, hay ventiladores ruidosos hasta en dispositivos más caros. Sin embargo, esto no debería ser el caso en cualquier computadora portátil.
Ésta es una versión acortada del análisis original. Puedes leer el análisis completo en inglés aquí.
Lenovo IdeaPad V110-15IKB 80TH001SGE
- 10/10/2017 v6 (old)
Sascha Mölck