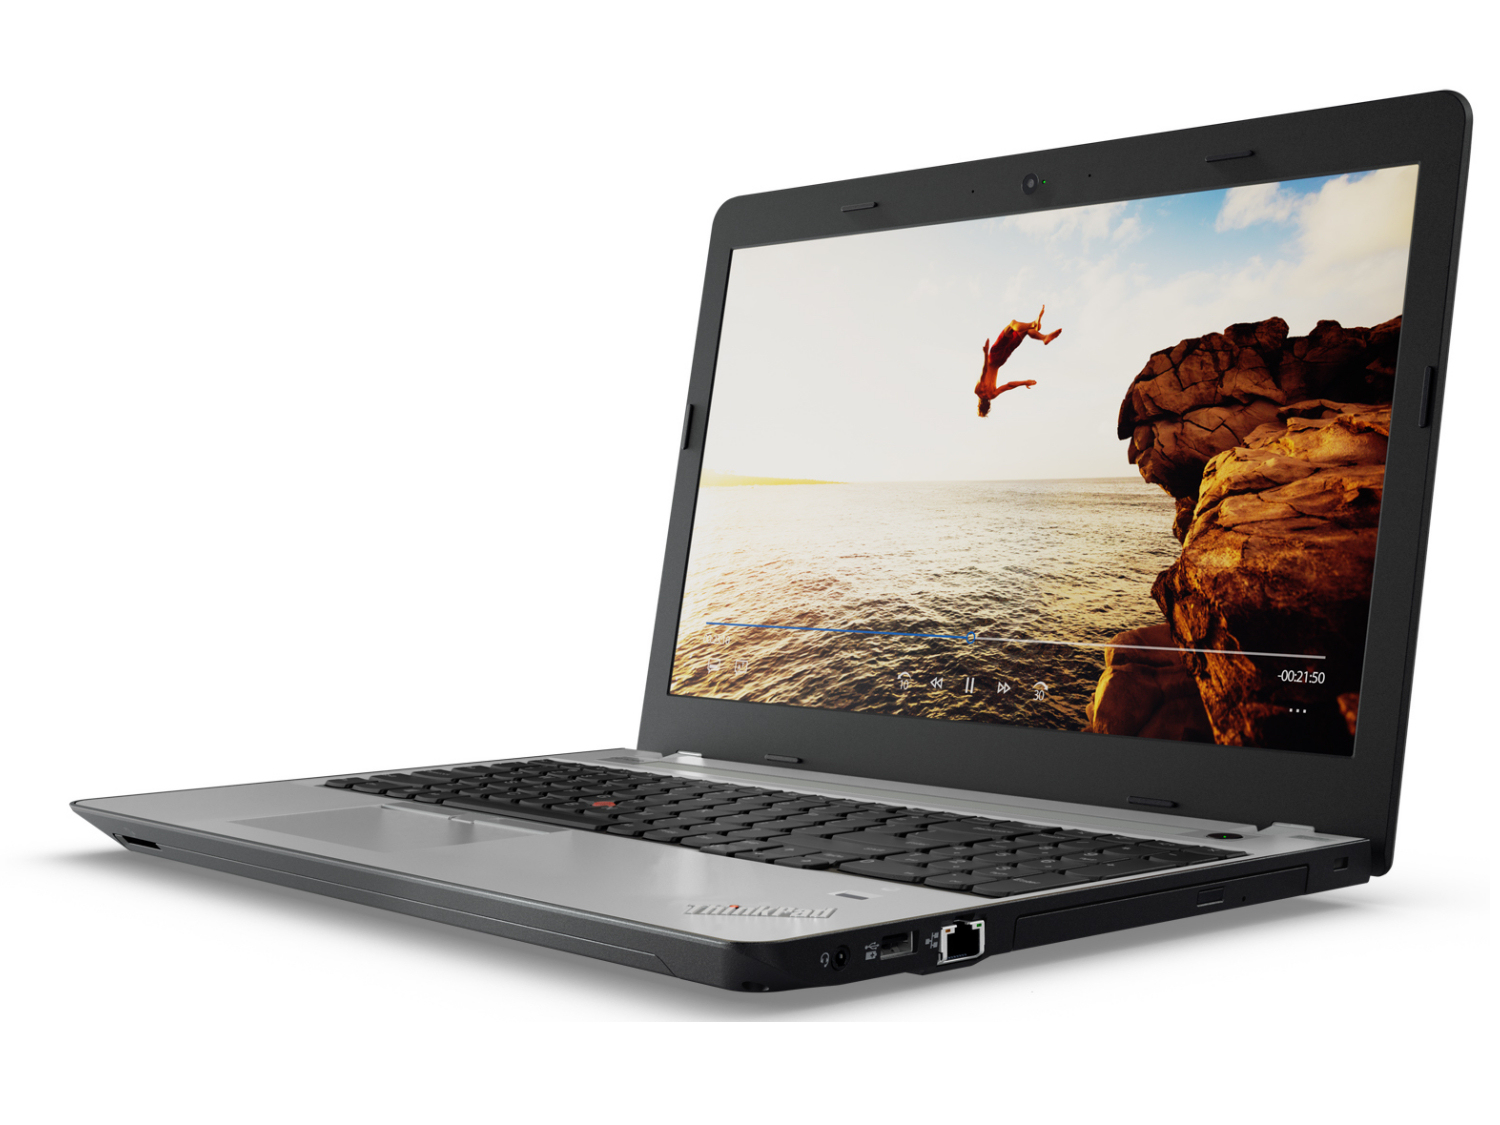
Breve análisis del Lenovo ThinkPad E570 (7200U, HD Display)
| SD Card Reader | |
| average JPG Copy Test (av. of 3 runs) | |
| HP ProBook 450 G4 Y8B60EA | |
| Acer TravelMate P259-MG-71UU (Toshiba Exceria Pro SDXC 64 GB UHS-II) | |
| Lenovo ThinkPad E570-20H6S00000 (Toshiba Exceria Pro SDXC 64 GB UHS-II) | |
| Dell Latitude 15-3570 | |
| maximum AS SSD Seq Read Test (1GB) | |
| HP ProBook 450 G4 Y8B60EA | |
| Lenovo ThinkPad E570-20H6S00000 (Toshiba Exceria Pro SDXC 64 GB UHS-II) | |
| Dell Latitude 15-3570 | |
| Networking | |
| iperf3 transmit AX12 | |
| Lenovo ThinkPad E570-20H6S02M00 | |
| Acer TravelMate P259-MG-71UU | |
| Lenovo ThinkPad E570-20H6S00000 | |
| iperf3 receive AX12 | |
| Acer TravelMate P259-MG-71UU | |
| Lenovo ThinkPad E570-20H6S02M00 | |
| Lenovo ThinkPad E570-20H6S00000 | |
| |||||||||||||||||||||||||
iluminación: 73 %
Brillo con batería: 242 cd/m²
Contraste: 410:1 (Negro: 0.59 cd/m²)
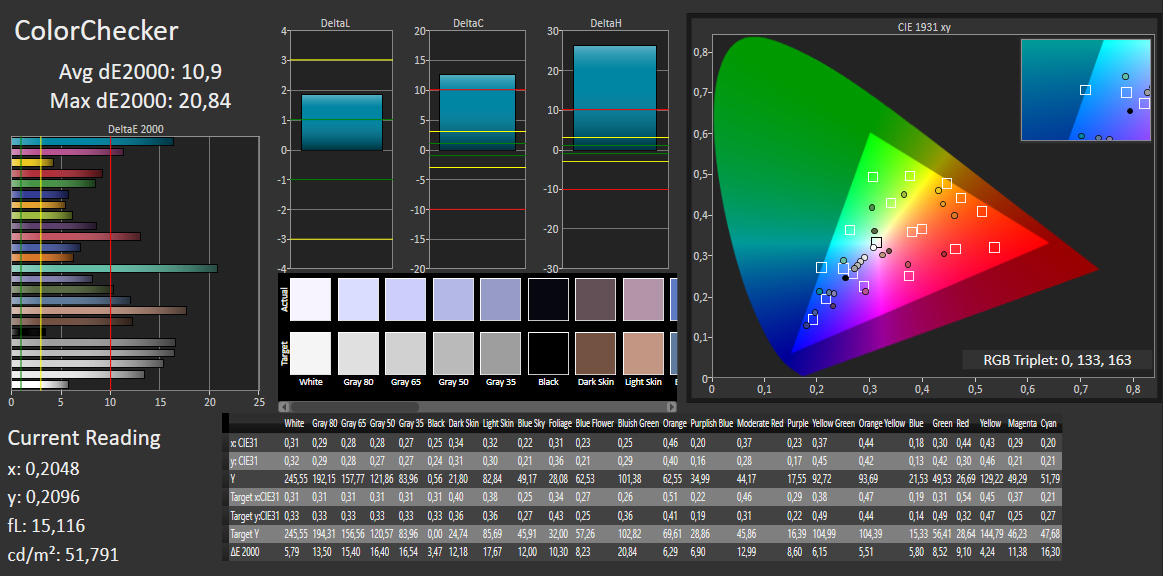
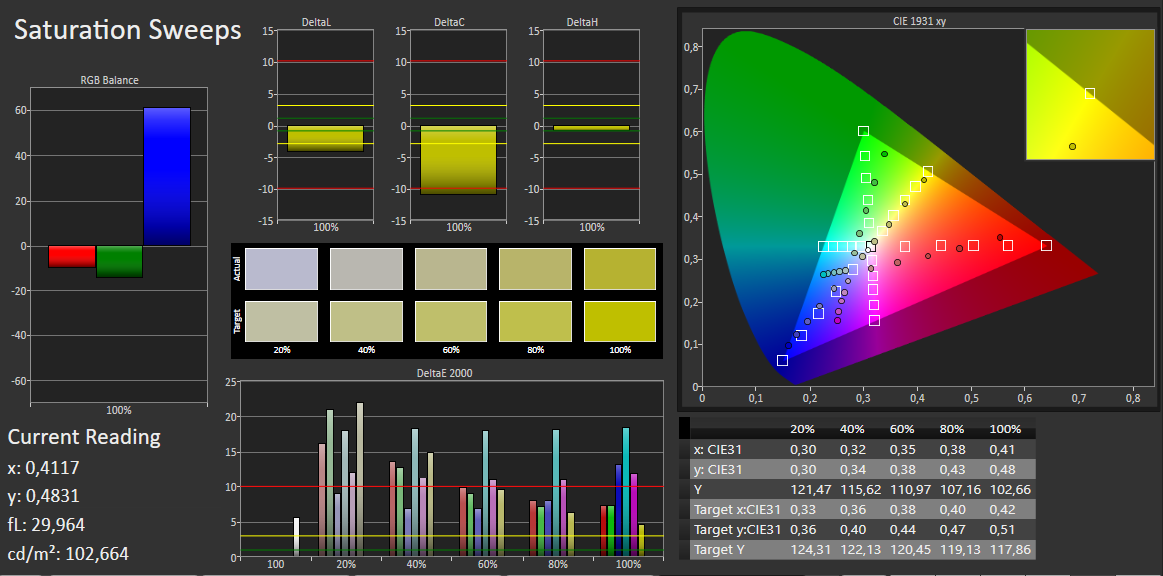
ΔE ColorChecker Calman: 10.9 | ∀{0.5-29.43 Ø4.73}
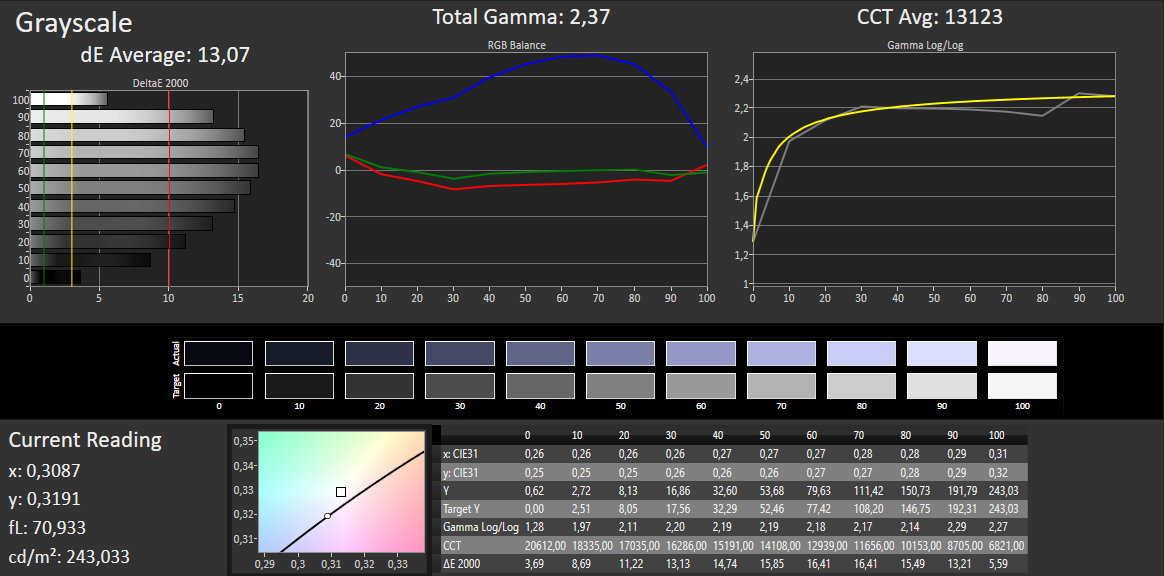
ΔE Greyscale Calman: 13.07 | ∀{0.09-98 Ø4.97}
55% sRGB (Argyll 1.6.3 3D)
35% AdobeRGB 1998 (Argyll 1.6.3 3D)
38.01% AdobeRGB 1998 (Argyll 3D)
55.4% sRGB (Argyll 3D)
36.79% Display P3 (Argyll 3D)
Gamma: 2.37
CCT: 13123 K
| Lenovo ThinkPad E570-20H6S02M00 TN LED, 1366x768, 15.6" | Lenovo ThinkPad E570-20H6S00000 IPS LED, 1920x1080, 15.6" | HP ProBook 450 G4 Y8B60EA TN LED, 1920x1080, 15.6" | Dell Latitude 15-3570 TN LED, 1366x768, 15.6" | Acer TravelMate P259-MG-71UU TN LED, 1920x1080, 15.6" | Fujitsu LifeBook A557 PL IPS, 1920x1080, 15.6" | |
|---|---|---|---|---|---|---|
| Display | 5% | 8% | 10% | 5% | 19% | |
| Display P3 Coverage (%) | 36.79 | 38.65 5% | 39.89 8% | 40.61 10% | 38.58 5% | 44.13 20% |
| sRGB Coverage (%) | 55.4 | 58 5% | 59.5 7% | 61.1 10% | 58 5% | 65.2 18% |
| AdobeRGB 1998 Coverage (%) | 38.01 | 39.94 5% | 41.24 8% | 41.96 10% | 39.85 5% | 45.72 20% |
| Response Times | -47% | -71% | -83% | -31% | ||
| Response Time Grey 50% / Grey 80% * (ms) | 46 ? | 44.8 ? 3% | 51 ? -11% | 37 ? 20% | 43 ? 7% | |
| Response Time Black / White * (ms) | 13 ? | 25.6 ? -97% | 30 ? -131% | 37 ? -185% | 22 ? -69% | |
| PWM Frequency (Hz) | 200 ? | 50 ? | ||||
| Screen | 41% | 7% | -2% | 5% | 52% | |
| Brightness middle (cd/m²) | 242 | 242 0% | 214 -12% | 202 -17% | 180 -26% | 239.5 -1% |
| Brightness (cd/m²) | 233 | 243 4% | 201 -14% | 211 -9% | 178 -24% | 216 -7% |
| Brightness Distribution (%) | 73 | 75 3% | 77 5% | 88 21% | 93 27% | 80 10% |
| Black Level * (cd/m²) | 0.59 | 0.24 59% | 0.43 27% | 0.62 -5% | 0.45 24% | 0.2 66% |
| Contrast (:1) | 410 | 1008 146% | 498 21% | 326 -20% | 400 -2% | 1198 192% |
| Colorchecker dE 2000 * | 10.9 | 4.65 57% | 10.68 2% | 12.35 -13% | 9.91 9% | |
| Colorchecker dE 2000 max. * | 20.84 | 9.64 54% | 18.07 13% | 19.9 5% | 18.19 13% | |
| Greyscale dE 2000 * | 13.07 | 3.39 74% | 11.32 13% | 13.46 -3% | 11.25 14% | |
| Gamma | 2.37 93% | 2.7 81% | 2.26 97% | 2.44 90% | 2.35 94% | |
| CCT | 13123 50% | 6246 104% | 12204 53% | 15217 43% | 12115 54% | |
| Color Space (Percent of AdobeRGB 1998) (%) | 35 | 36.69 5% | 38 9% | 39 11% | 37 6% | |
| Color Space (Percent of sRGB) (%) | 55 | 57.66 5% | 59 7% | 61 11% | 58 5% | |
| Media total (Programa/Opciones) | -0% /
22% | -19% /
-3% | -25% /
-10% | -7% /
-0% | 36% /
40% |
* ... más pequeño es mejor
Parpadeo de Pantalla / PWM (Pulse-Width Modulation)
| Parpadeo de Pantalla / PWM detectado | 200 Hz | ≤ 90 % de brillo | 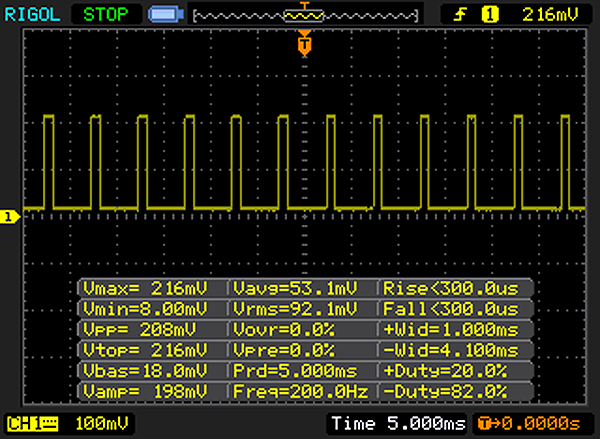 |
La retroiluminación del display parpadea a 200 Hz (seguramente usa PWM - Pulse-Width Modulation) a un brillo del 90 % e inferior. Sobre este nivel de brillo no debería darse parpadeo / PWM. La frecuencia de 200 Hz es relativamente baja, por lo que la gente sensible debería ver parpadeos y padecer fatiga visual por la pantalla (usado al brillo indicado a continuación). Comparación: 52 % de todos los dispositivos testados no usaron PWM para atenuar el display. Si se usó, medimos una media de 7798 (mínimo: 5 - máxmo: 343500) Hz. | |||
Tiempos de respuesta del display
| ↔ Tiempo de respuesta de Negro a Blanco | ||
|---|---|---|
| 13 ms ... subida ↗ y bajada ↘ combinada | ↗ 8 ms subida | 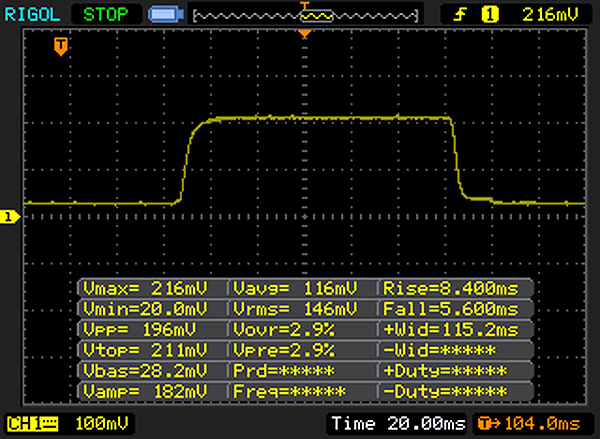 |
| ↘ 5 ms bajada | ||
| La pantalla mostró buenos tiempos de respuesta en nuestros tests pero podría ser demasiado lenta para los jugones competitivos. En comparación, todos los dispositivos de prueba van de ##min### (mínimo) a 240 (máximo) ms. » 33 % de todos los dispositivos son mejores. Esto quiere decir que el tiempo de respuesta medido es mejor que la media (19.9 ms) de todos los dispositivos testados. | ||
| ↔ Tiempo de respuesta 50% Gris a 80% Gris | ||
| 46 ms ... subida ↗ y bajada ↘ combinada | ↗ 24 ms subida | 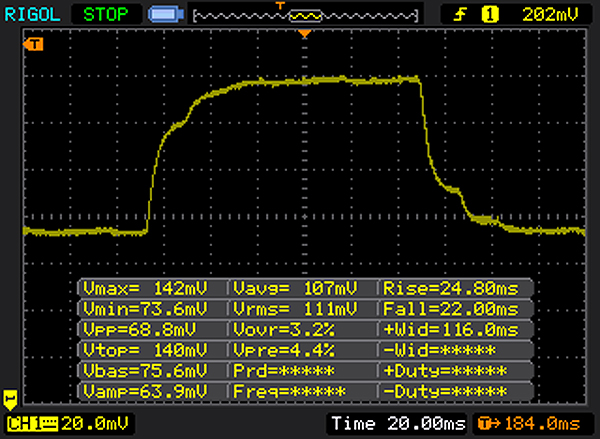 |
| ↘ 22 ms bajada | ||
| La pantalla mostró tiempos de respuesta lentos en nuestros tests y podría ser demasiado lenta para los jugones. En comparación, todos los dispositivos de prueba van de ##min### (mínimo) a 636 (máximo) ms. » 79 % de todos los dispositivos son mejores. Eso quiere decir que el tiempo de respuesta es peor que la media (31.1 ms) de todos los dispositivos testados. | ||
| Cinebench R15 | |
| CPU Single 64Bit | |
| HP ProBook 450 G4 Y8B60EA | |
| Acer TravelMate P259-MG-71UU | |
| Lenovo ThinkPad E570-20H6S00000 | |
| Fujitsu LifeBook A557 PL | |
| Lenovo ThinkPad E570-20H6S02M00 | |
| Dell Latitude 15-3570 | |
| CPU Multi 64Bit | |
| HP ProBook 450 G4 Y8B60EA | |
| Lenovo ThinkPad E570-20H6S00000 | |
| Acer TravelMate P259-MG-71UU | |
| Fujitsu LifeBook A557 PL | |
| Lenovo ThinkPad E570-20H6S02M00 | |
| Dell Latitude 15-3570 | |
| Cinebench R11.5 | |
| CPU Multi 64Bit | |
| Lenovo ThinkPad E570-20H6S02M00 | |
| Acer TravelMate P259-MG-71UU | |
| CPU Single 64Bit | |
| Acer TravelMate P259-MG-71UU | |
| Lenovo ThinkPad E570-20H6S02M00 | |
| Cinebench R10 | |
| Rendering Multiple CPUs 32Bit | |
| Acer TravelMate P259-MG-71UU | |
| Lenovo ThinkPad E570-20H6S02M00 | |
| Rendering Single 32Bit | |
| Lenovo ThinkPad E570-20H6S02M00 | |
| Acer TravelMate P259-MG-71UU | |
| Geekbench 3 | |
| 32 Bit Multi-Core Score | |
| Acer TravelMate P259-MG-71UU | |
| Lenovo ThinkPad E570-20H6S02M00 | |
| 32 Bit Single-Core Score | |
| Acer TravelMate P259-MG-71UU | |
| Lenovo ThinkPad E570-20H6S02M00 | |
| Geekbench 4.0 | |
| 64 Bit Multi-Core Score | |
| Acer TravelMate P259-MG-71UU | |
| Lenovo ThinkPad E570-20H6S02M00 | |
| 64 Bit Single-Core Score | |
| Acer TravelMate P259-MG-71UU | |
| Lenovo ThinkPad E570-20H6S02M00 | |
| Geekbench 4.4 | |
| 64 Bit Multi-Core Score | |
| Lenovo ThinkPad E570-20H6S02M00 | |
| 64 Bit Single-Core Score | |
| Lenovo ThinkPad E570-20H6S02M00 | |
| JetStream 1.1 - 1.1 Total | |
| HP ProBook 450 G4 Y8B60EA | |
| Lenovo ThinkPad E570-20H6S02M00 | |
| Lenovo ThinkPad E570-20H6S00000 | |
| Acer TravelMate P259-MG-71UU | |
| PCMark 7 Score | 5232 puntos | |
| PCMark 8 Home Score Accelerated v2 | 3714 puntos | |
| PCMark 8 Creative Score Accelerated v2 | 4456 puntos | |
| PCMark 8 Work Score Accelerated v2 | 4857 puntos | |
| PCMark 10 Score | 3235 puntos | |
ayuda | ||

| Lenovo ThinkPad E570-20H6S02M00 Samsung PM961 MZVLW256HEHP | Dell Latitude 15-3570 Samsung CM871 MZNLF128HCHP | Acer TravelMate P259-MG-71UU Liteonit CV3-8D256 | Fujitsu LifeBook A557 PL Samsung CM871a MZNTY256HDHP | Lenovo ThinkPad E570-20H6S00000 Toshiba THNSF5256GPUK | |
|---|---|---|---|---|---|
| CrystalDiskMark 3.0 | -81% | -58% | -55% | -31% | |
| Read Seq (MB/s) | 1589 | 453.2 -71% | 478.5 -70% | 520 -67% | 1140 -28% |
| Write Seq (MB/s) | 1217 | 137.7 -89% | 258.2 -79% | 337 -72% | 468.1 -62% |
| Read 512 (MB/s) | 1155 | 308.5 -73% | 254.3 -78% | 400.8 -65% | 759 -34% |
| Write 512 (MB/s) | 783 | 134.1 -83% | 264.8 -66% | 240.7 -69% | 414 -47% |
| Read 4k (MB/s) | 59.7 | 19.06 -68% | 28.32 -53% | 34.16 -43% | 34.3 -43% |
| Write 4k (MB/s) | 148.8 | 21.31 -86% | 76.3 -49% | 95.4 -36% | 123.4 -17% |
| Read 4k QD32 (MB/s) | 473.6 | 93.5 -80% | 346.2 -27% | 293.9 -38% | 530 12% |
| Write 4k QD32 (MB/s) | 428.7 | 23.3 -95% | 240.2 -44% | 225.1 -47% | 319.2 -26% |
| 3DMark 11 Performance | 1518 puntos | |
| 3DMark Ice Storm Standard Score | 55340 puntos | |
| 3DMark Cloud Gate Standard Score | 5776 puntos | |
| 3DMark Fire Strike Score | 763 puntos | |
ayuda | ||
| 3DMark 11 - 1280x720 Performance GPU | |
| Lenovo ThinkPad E570-20H6S00000 | |
| Acer TravelMate P259-MG-71UU | |
| HP ProBook 450 G4 Y8B60EA | |
| Fujitsu LifeBook A557 PL | |
| Lenovo ThinkPad E570-20H6S02M00 | |
| Dell Latitude 15-3570 | |
| 3DMark | |
| 1280x720 Cloud Gate Standard Graphics | |
| Lenovo ThinkPad E570-20H6S00000 | |
| Acer TravelMate P259-MG-71UU | |
| HP ProBook 450 G4 Y8B60EA | |
| Lenovo ThinkPad E570-20H6S02M00 | |
| Fujitsu LifeBook A557 PL | |
| Dell Latitude 15-3570 | |
| 1920x1080 Fire Strike Graphics | |
| Lenovo ThinkPad E570-20H6S00000 | |
| Acer TravelMate P259-MG-71UU | |
| HP ProBook 450 G4 Y8B60EA | |
| Lenovo ThinkPad E570-20H6S02M00 | |
| Fujitsu LifeBook A557 PL | |
| bajo | medio | alto | ultra | |
|---|---|---|---|---|
| Tomb Raider (2013) | 63.6 | 33.8 | 19.2 | |
| BioShock Infinite (2013) | 41.8 | 24.5 | 20.2 | |
| Rise of the Tomb Raider (2016) | 16.7 | 10.4 |
| BioShock Infinite - 1280x720 Very Low Preset | |
| Lenovo ThinkPad E570-20H6S00000 | |
| Acer TravelMate P259-MG-71UU | |
| HP ProBook 450 G4 Y8B60EA | |
| Lenovo ThinkPad E570-20H6S02M00 | |
| Dell Latitude 15-3570 | |
Ruido
| Ocioso |
| 30.6 / 30.6 / 30.6 dB(A) |
| HDD |
| 31.4 dB(A) |
| DVD |
| 33.1 / dB(A) |
| Carga |
| 31.8 / 31.3 dB(A) |
 | ||
30 dB silencioso 40 dB(A) audible 50 dB(A) ruidosamente alto |
||
min: | ||
| Lenovo ThinkPad E570-20H6S02M00 i5-7200U, HD Graphics 620 | Lenovo ThinkPad E570-20H6S00000 i5-7200U, GeForce GTX 950M | HP ProBook 450 G4 Y8B60EA i7-7500U, GeForce 930MX | Dell Latitude 15-3570 6200U, HD Graphics 520 | Acer TravelMate P259-MG-71UU 6500U, GeForce 940MX | Fujitsu LifeBook A557 PL i5-7200U, HD Graphics 620 | |
|---|---|---|---|---|---|---|
| Noise | -3% | -12% | -4% | -8% | -13% | |
| apagado / medio ambiente * (dB) | 30.6 | 29 5% | 31.6 -3% | 31 -1% | 30.5 -0% | |
| Idle Minimum * (dB) | 30.6 | 29 5% | 32.6 -7% | 31 -1% | 31.6 -3% | 30 2% |
| Idle Average * (dB) | 30.6 | 29 5% | 32.6 -7% | 31 -1% | 31.6 -3% | 32.5 -6% |
| Idle Maximum * (dB) | 30.6 | 29 5% | 33 -8% | 31 -1% | 32 -5% | 35 -14% |
| Load Average * (dB) | 31.8 | 34.3 -8% | 38.9 -22% | 34.2 -8% | 35.5 -12% | 37.5 -18% |
| Load Maximum * (dB) | 31.3 | 40.1 -28% | 38.9 -24% | 34.3 -10% | 38.3 -22% | 40.3 -29% |
* ... más pequeño es mejor
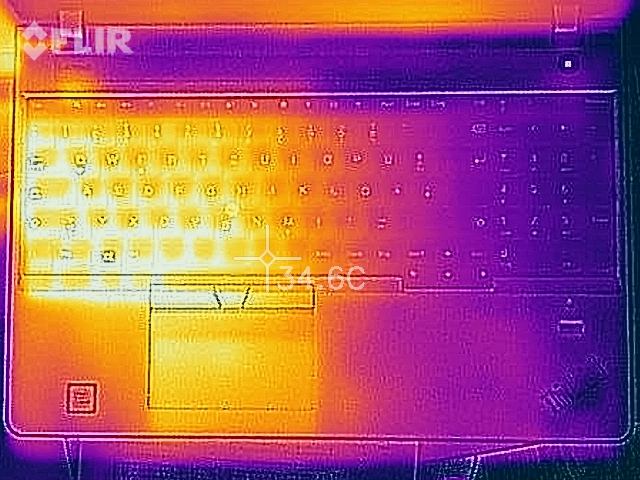
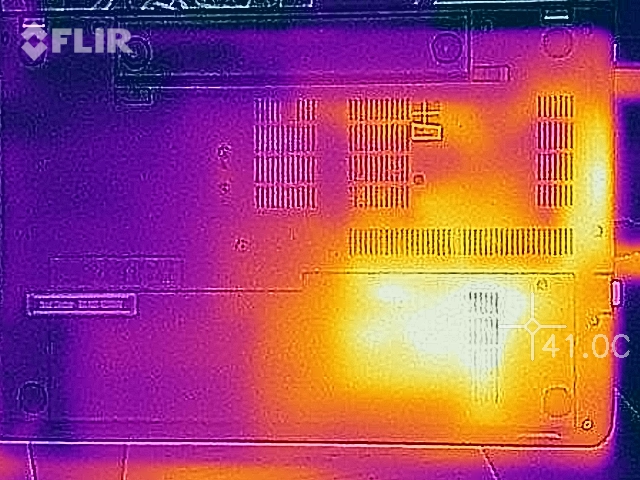
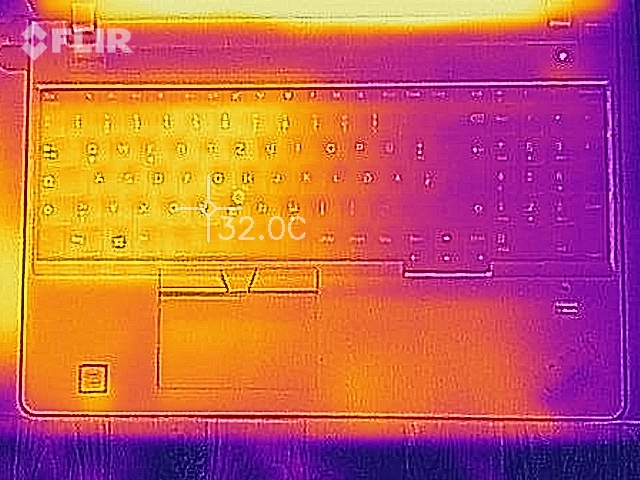
(+) La temperatura máxima en la parte superior es de 33.2 °C / 92 F, frente a la media de 34.3 °C / 94 F, que oscila entre 21.2 y 62.5 °C para la clase Office.
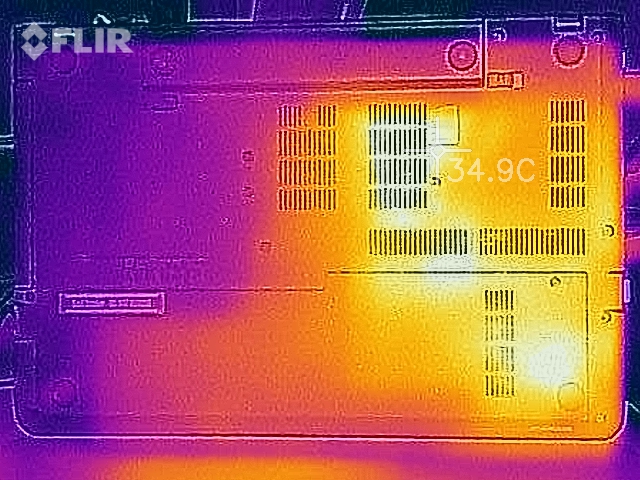
(+) El fondo se calienta hasta un máximo de 39.4 °C / 103 F, frente a la media de 36.8 °C / 98 F
(+) En reposo, la temperatura media de la parte superior es de 24.7 °C / 76# F, frente a la media del dispositivo de 29.5 °C / 85 F.
(+) Los reposamanos y el panel táctil alcanzan como máximo la temperatura de la piel (32.1 °C / 89.8 F) y, por tanto, no están calientes.
(-) La temperatura media de la zona del reposamanos de dispositivos similares fue de 27.5 °C / 81.5 F (-4.6 °C / -8.3 F).
| Lenovo ThinkPad E570-20H6S02M00 i5-7200U, HD Graphics 620 | Lenovo ThinkPad E570-20H6S00000 i5-7200U, GeForce GTX 950M | HP ProBook 450 G4 Y8B60EA i7-7500U, GeForce 930MX | Dell Latitude 15-3570 6200U, HD Graphics 520 | Acer TravelMate P259-MG-71UU 6500U, GeForce 940MX | Fujitsu LifeBook A557 PL i5-7200U, HD Graphics 620 | |
|---|---|---|---|---|---|---|
| Heat | -13% | -15% | -17% | -7% | 1% | |
| Maximum Upper Side * (°C) | 33.2 | 46.6 -40% | 44.3 -33% | 36.1 -9% | 35.1 -6% | 34.8 -5% |
| Maximum Bottom * (°C) | 39.4 | 49.1 -25% | 46.3 -18% | 47 -19% | 46.7 -19% | 38.1 3% |
| Idle Upper Side * (°C) | 25.9 | 24.6 5% | 27.8 -7% | 31.7 -22% | 27 -4% | 25.9 -0% |
| Idle Bottom * (°C) | 27.8 | 25.1 10% | 27.7 -0% | 32.9 -18% | 27.4 1% | 26.6 4% |
* ... más pequeño es mejor
Lenovo ThinkPad E570-20H6S02M00 análisis de audio
(-) | altavoces no muy altos (#71.4 dB)
Graves 100 - 315 Hz
(-) | casi sin bajos - de media 17.1% inferior a la mediana
(±) | la linealidad de los graves es media (10.9% delta a frecuencia anterior)
Medios 400 - 2000 Hz
(+) | medios equilibrados - a sólo 3.9% de la mediana
(±) | la linealidad de los medios es media (8.2% delta respecto a la frecuencia anterior)
Altos 2 - 16 kHz
(+) | máximos equilibrados - a sólo 3.4% de la mediana
(±) | la linealidad de los máximos es media (7% delta a frecuencia anterior)
Total 100 - 16.000 Hz
(±) | la linealidad del sonido global es media (20.3% de diferencia con la mediana)
En comparación con la misma clase
» 44% de todos los dispositivos probados de esta clase eran mejores, 10% similares, 46% peores
» El mejor tuvo un delta de 7%, la media fue 21%, el peor fue ###max##%
En comparación con todos los dispositivos probados
» 53% de todos los dispositivos probados eran mejores, 8% similares, 39% peores
» El mejor tuvo un delta de 4%, la media fue 24%, el peor fue ###max##%
Apple MacBook 12 (Early 2016) 1.1 GHz análisis de audio
(+) | los altavoces pueden reproducir a un volumen relativamente alto (#83.6 dB)
Graves 100 - 315 Hz
(±) | lubina reducida - en promedio 11.3% inferior a la mediana
(±) | la linealidad de los graves es media (14.2% delta a frecuencia anterior)
Medios 400 - 2000 Hz
(+) | medios equilibrados - a sólo 2.4% de la mediana
(+) | los medios son lineales (5.5% delta a la frecuencia anterior)
Altos 2 - 16 kHz
(+) | máximos equilibrados - a sólo 2% de la mediana
(+) | los máximos son lineales (4.5% delta a la frecuencia anterior)
Total 100 - 16.000 Hz
(+) | el sonido global es lineal (10.2% de diferencia con la mediana)
En comparación con la misma clase
» 7% de todos los dispositivos probados de esta clase eran mejores, 2% similares, 91% peores
» El mejor tuvo un delta de 5%, la media fue 18%, el peor fue ###max##%
En comparación con todos los dispositivos probados
» 5% de todos los dispositivos probados eran mejores, 1% similares, 94% peores
» El mejor tuvo un delta de 4%, la media fue 24%, el peor fue ###max##%
Frequency diagram comparison (checkboxes above can be turned on/off!)
| Off / Standby | |
| Ocioso | |
| Carga |
|
Clave:
min: | |
| Lenovo ThinkPad E570-20H6S02M00 i5-7200U, HD Graphics 620 | Lenovo ThinkPad E570-20H6S00000 i5-7200U, GeForce GTX 950M | HP ProBook 450 G4 Y8B60EA i7-7500U, GeForce 930MX | Dell Latitude 15-3570 6200U, HD Graphics 520 | Acer TravelMate P259-MG-71UU 6500U, GeForce 940MX | Fujitsu LifeBook A557 PL i5-7200U, HD Graphics 620 | |
|---|---|---|---|---|---|---|
| Power Consumption | -45% | -40% | -18% | -71% | -44% | |
| Idle Minimum * (Watt) | 2.9 | 2.8 3% | 3.8 -31% | 4.9 -69% | 7 -141% | 6.3 -117% |
| Idle Average * (Watt) | 5.8 | 6.3 -9% | 6.6 -14% | 7.2 -24% | 8 -38% | 8.1 -40% |
| Idle Maximum * (Watt) | 6.6 | 6.9 -5% | 11.3 -71% | 7.5 -14% | 10.6 -61% | 12.7 -92% |
| Load Average * (Watt) | 29 | 51.6 -78% | 38 -31% | 25.4 12% | 39.7 -37% | 20.7 29% |
| Load Maximum * (Watt) | 29.4 | 69.7 -137% | 45 -53% | 28 5% | 51.9 -77% | 28.9 2% |
* ... más pequeño es mejor
| Lenovo ThinkPad E570-20H6S02M00 i5-7200U, HD Graphics 620, 42 Wh | Lenovo ThinkPad E570-20H6S00000 i5-7200U, GeForce GTX 950M, 41 Wh | HP ProBook 450 G4 Y8B60EA i7-7500U, GeForce 930MX, 45 Wh | Dell Latitude 15-3570 6200U, HD Graphics 520, 65 Wh | Acer TravelMate P259-MG-71UU 6500U, GeForce 940MX, 41 Wh | Fujitsu LifeBook A557 PL i5-7200U, HD Graphics 620, 49 Wh | |
|---|---|---|---|---|---|---|
| Duración de Batería | 9% | 6% | 27% | -40% | -10% | |
| Reader / Idle (h) | 18.1 | 14.7 -19% | 12.4 -31% | 17.1 -6% | 10.3 -43% | 16.3 -10% |
| H.264 (h) | 6.5 | 4.1 -37% | ||||
| WiFi v1.3 (h) | 7.2 | 7.7 7% | 8.6 19% | 9 25% | 4.7 -35% | |
| Load (h) | 1.6 | 2.2 38% | 2.1 31% | 2.6 63% | 0.9 -44% | |
| WiFi (h) | 7.4 |
Pro
Contra
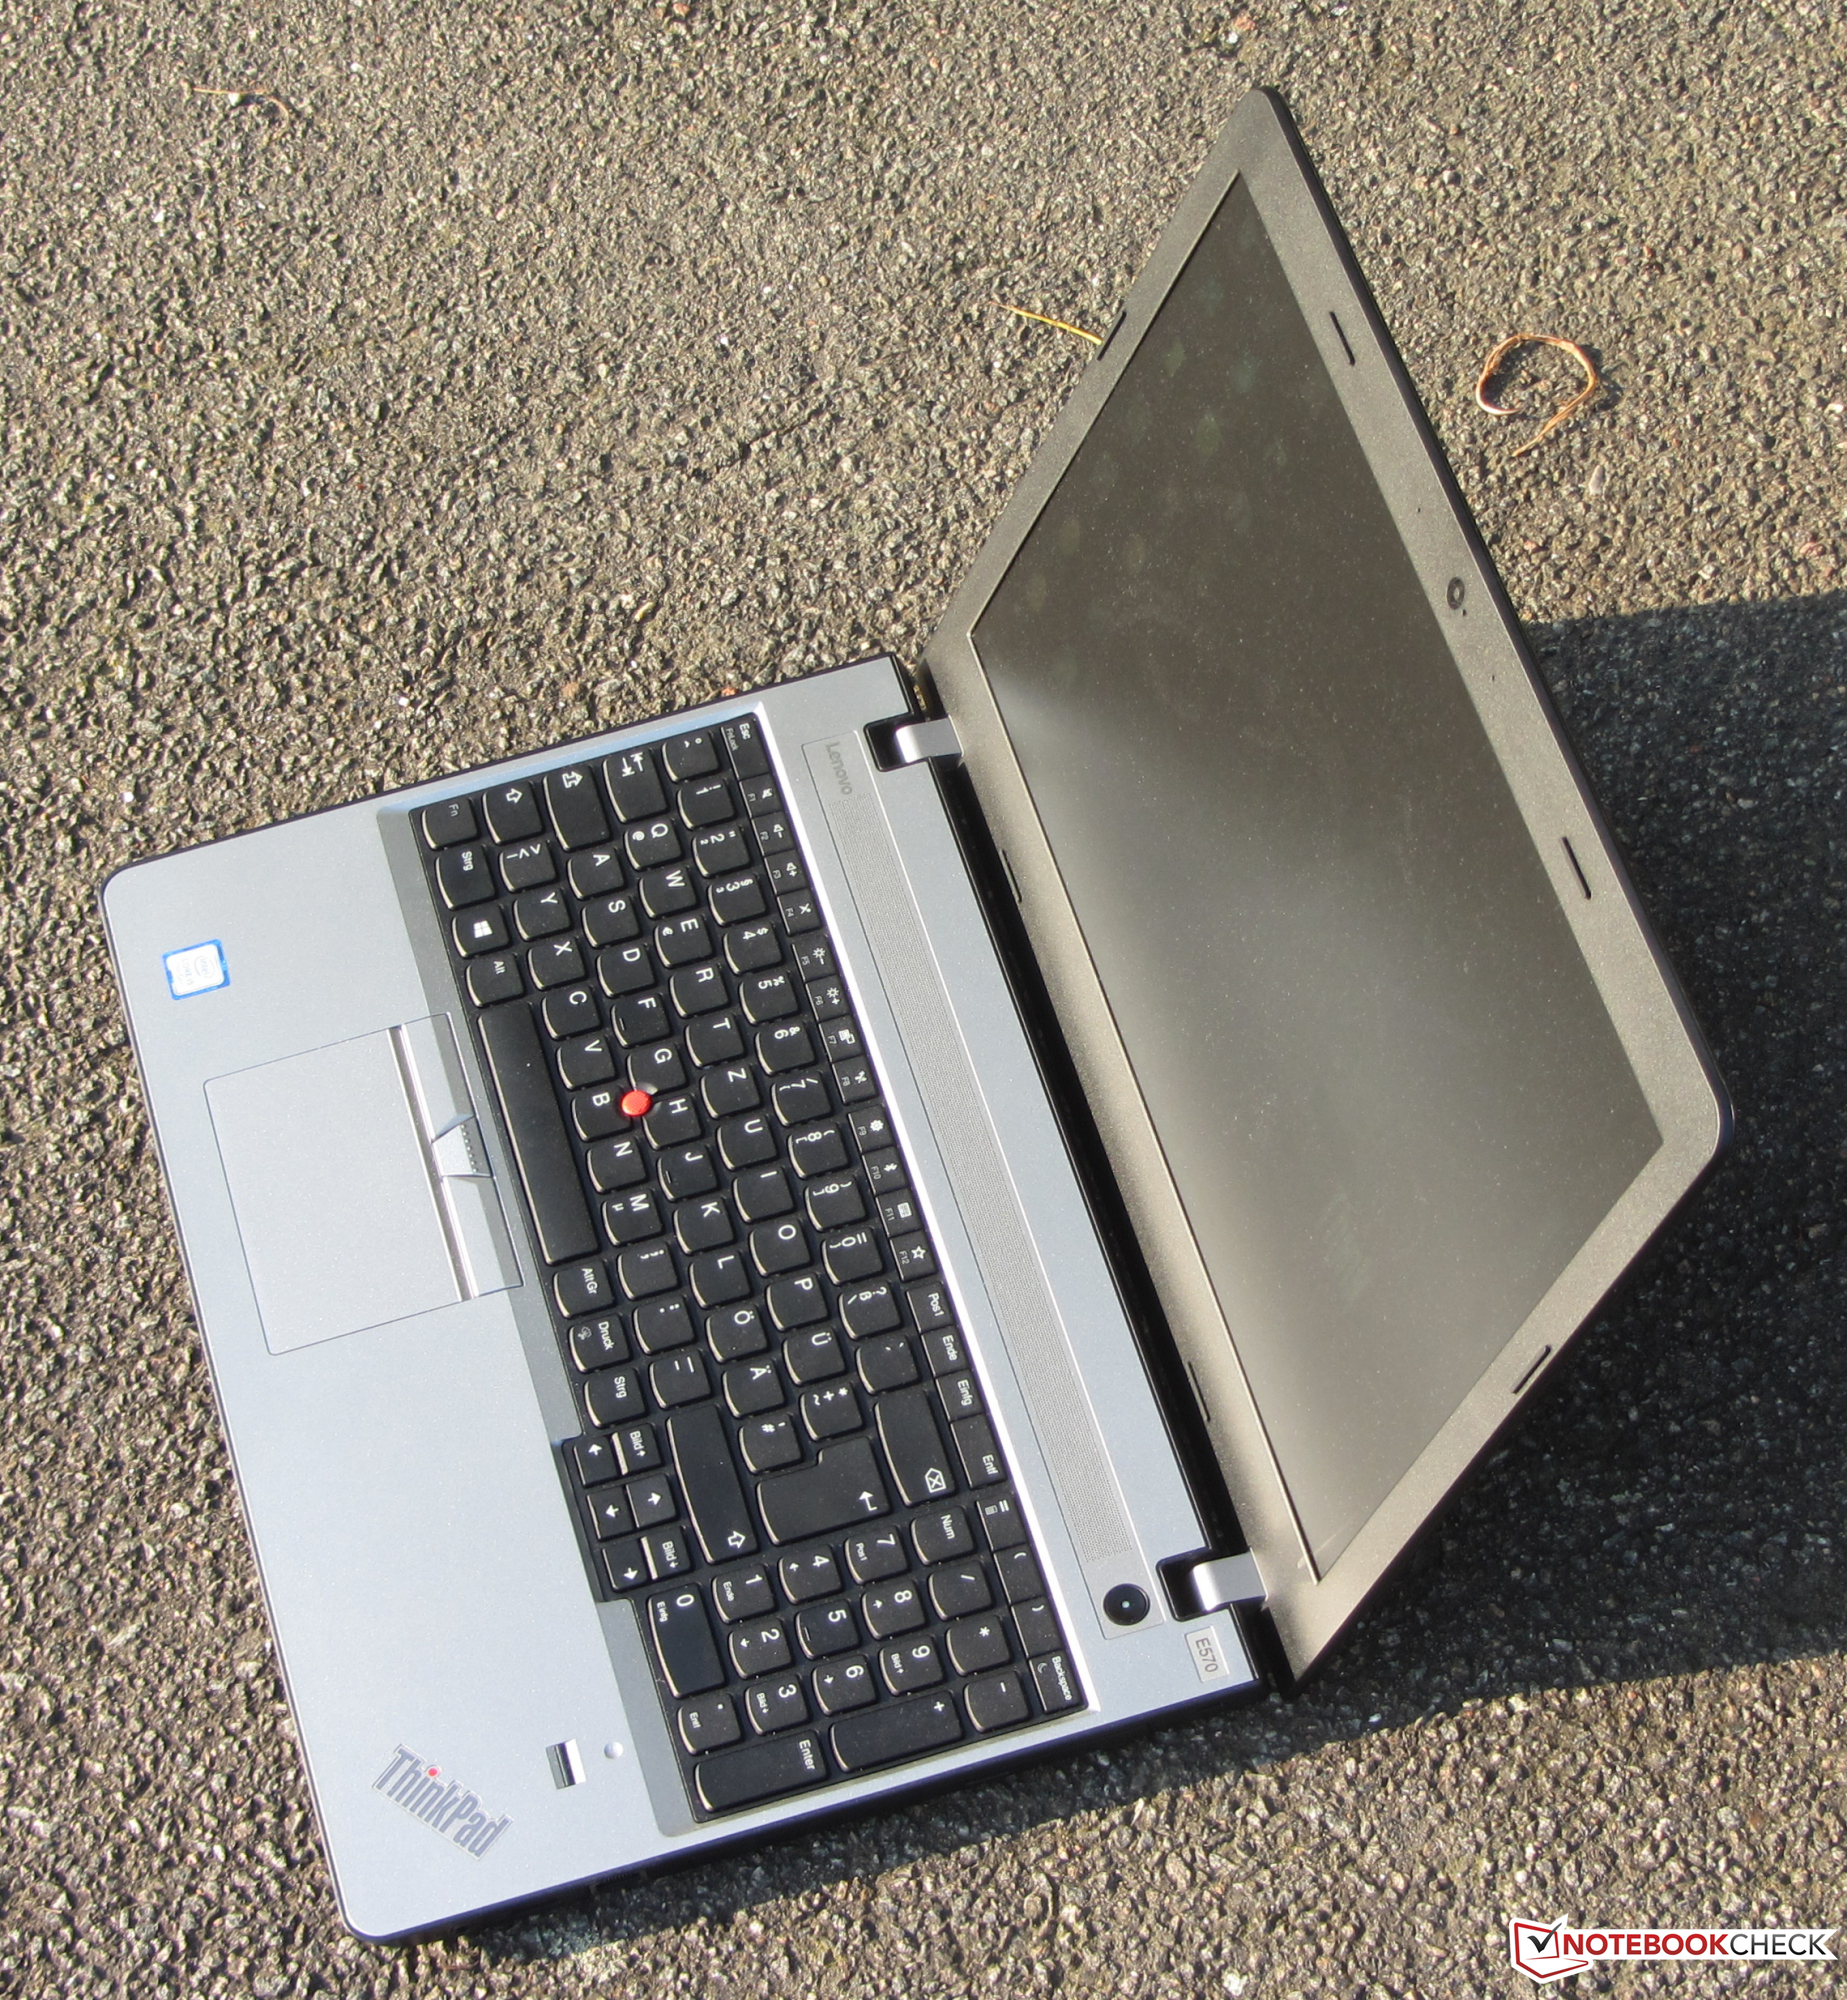
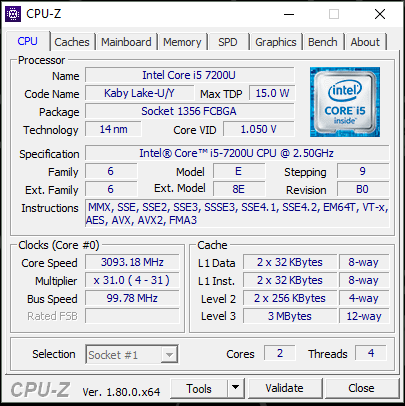
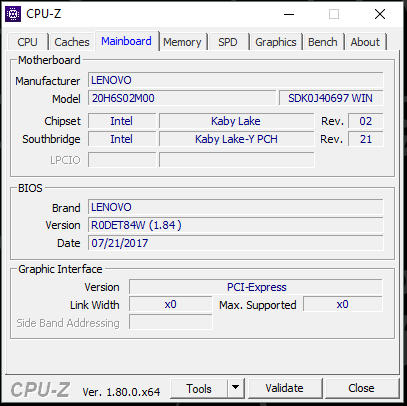
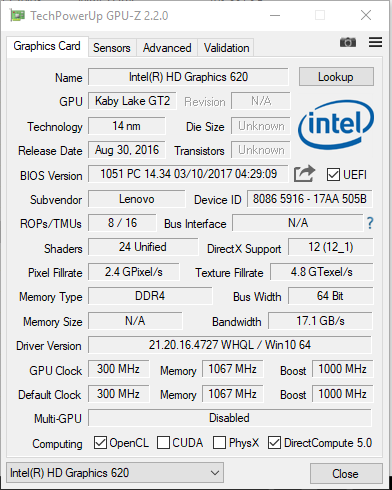
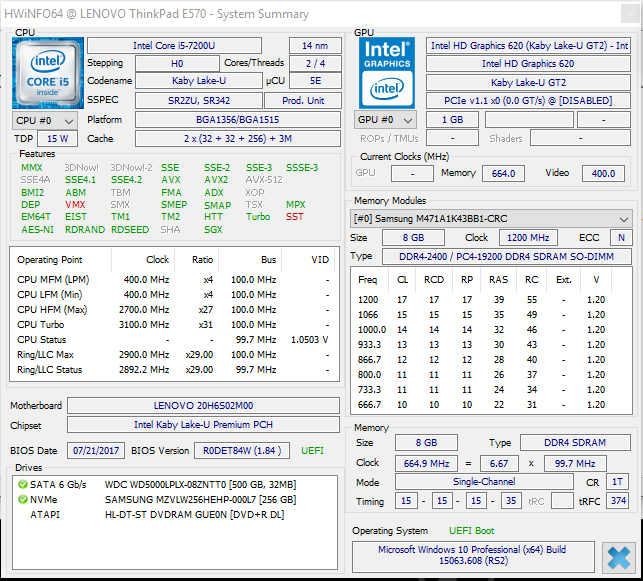
El ThinkPad trae un procesador Core i5 Kaby Lake, que tiene potencia más que suficiente para las aplicaciones ofimáticas y de internet. El portátil va quedo durante toda la gama de cargas y apenas se calienta.
Un veloz SSD NVMe asegura un sistema rápido. Un HDD de 500 GB de 2.5" ofrece almacenamiento adicional. Sendos discos pueden reemplazarse fácilmente gracias a una gran escotilla de mantenimiento. Como su predecesor, el ThinkPad E570 también trae un buen teclado. Y el aguante de batería es soberbio.
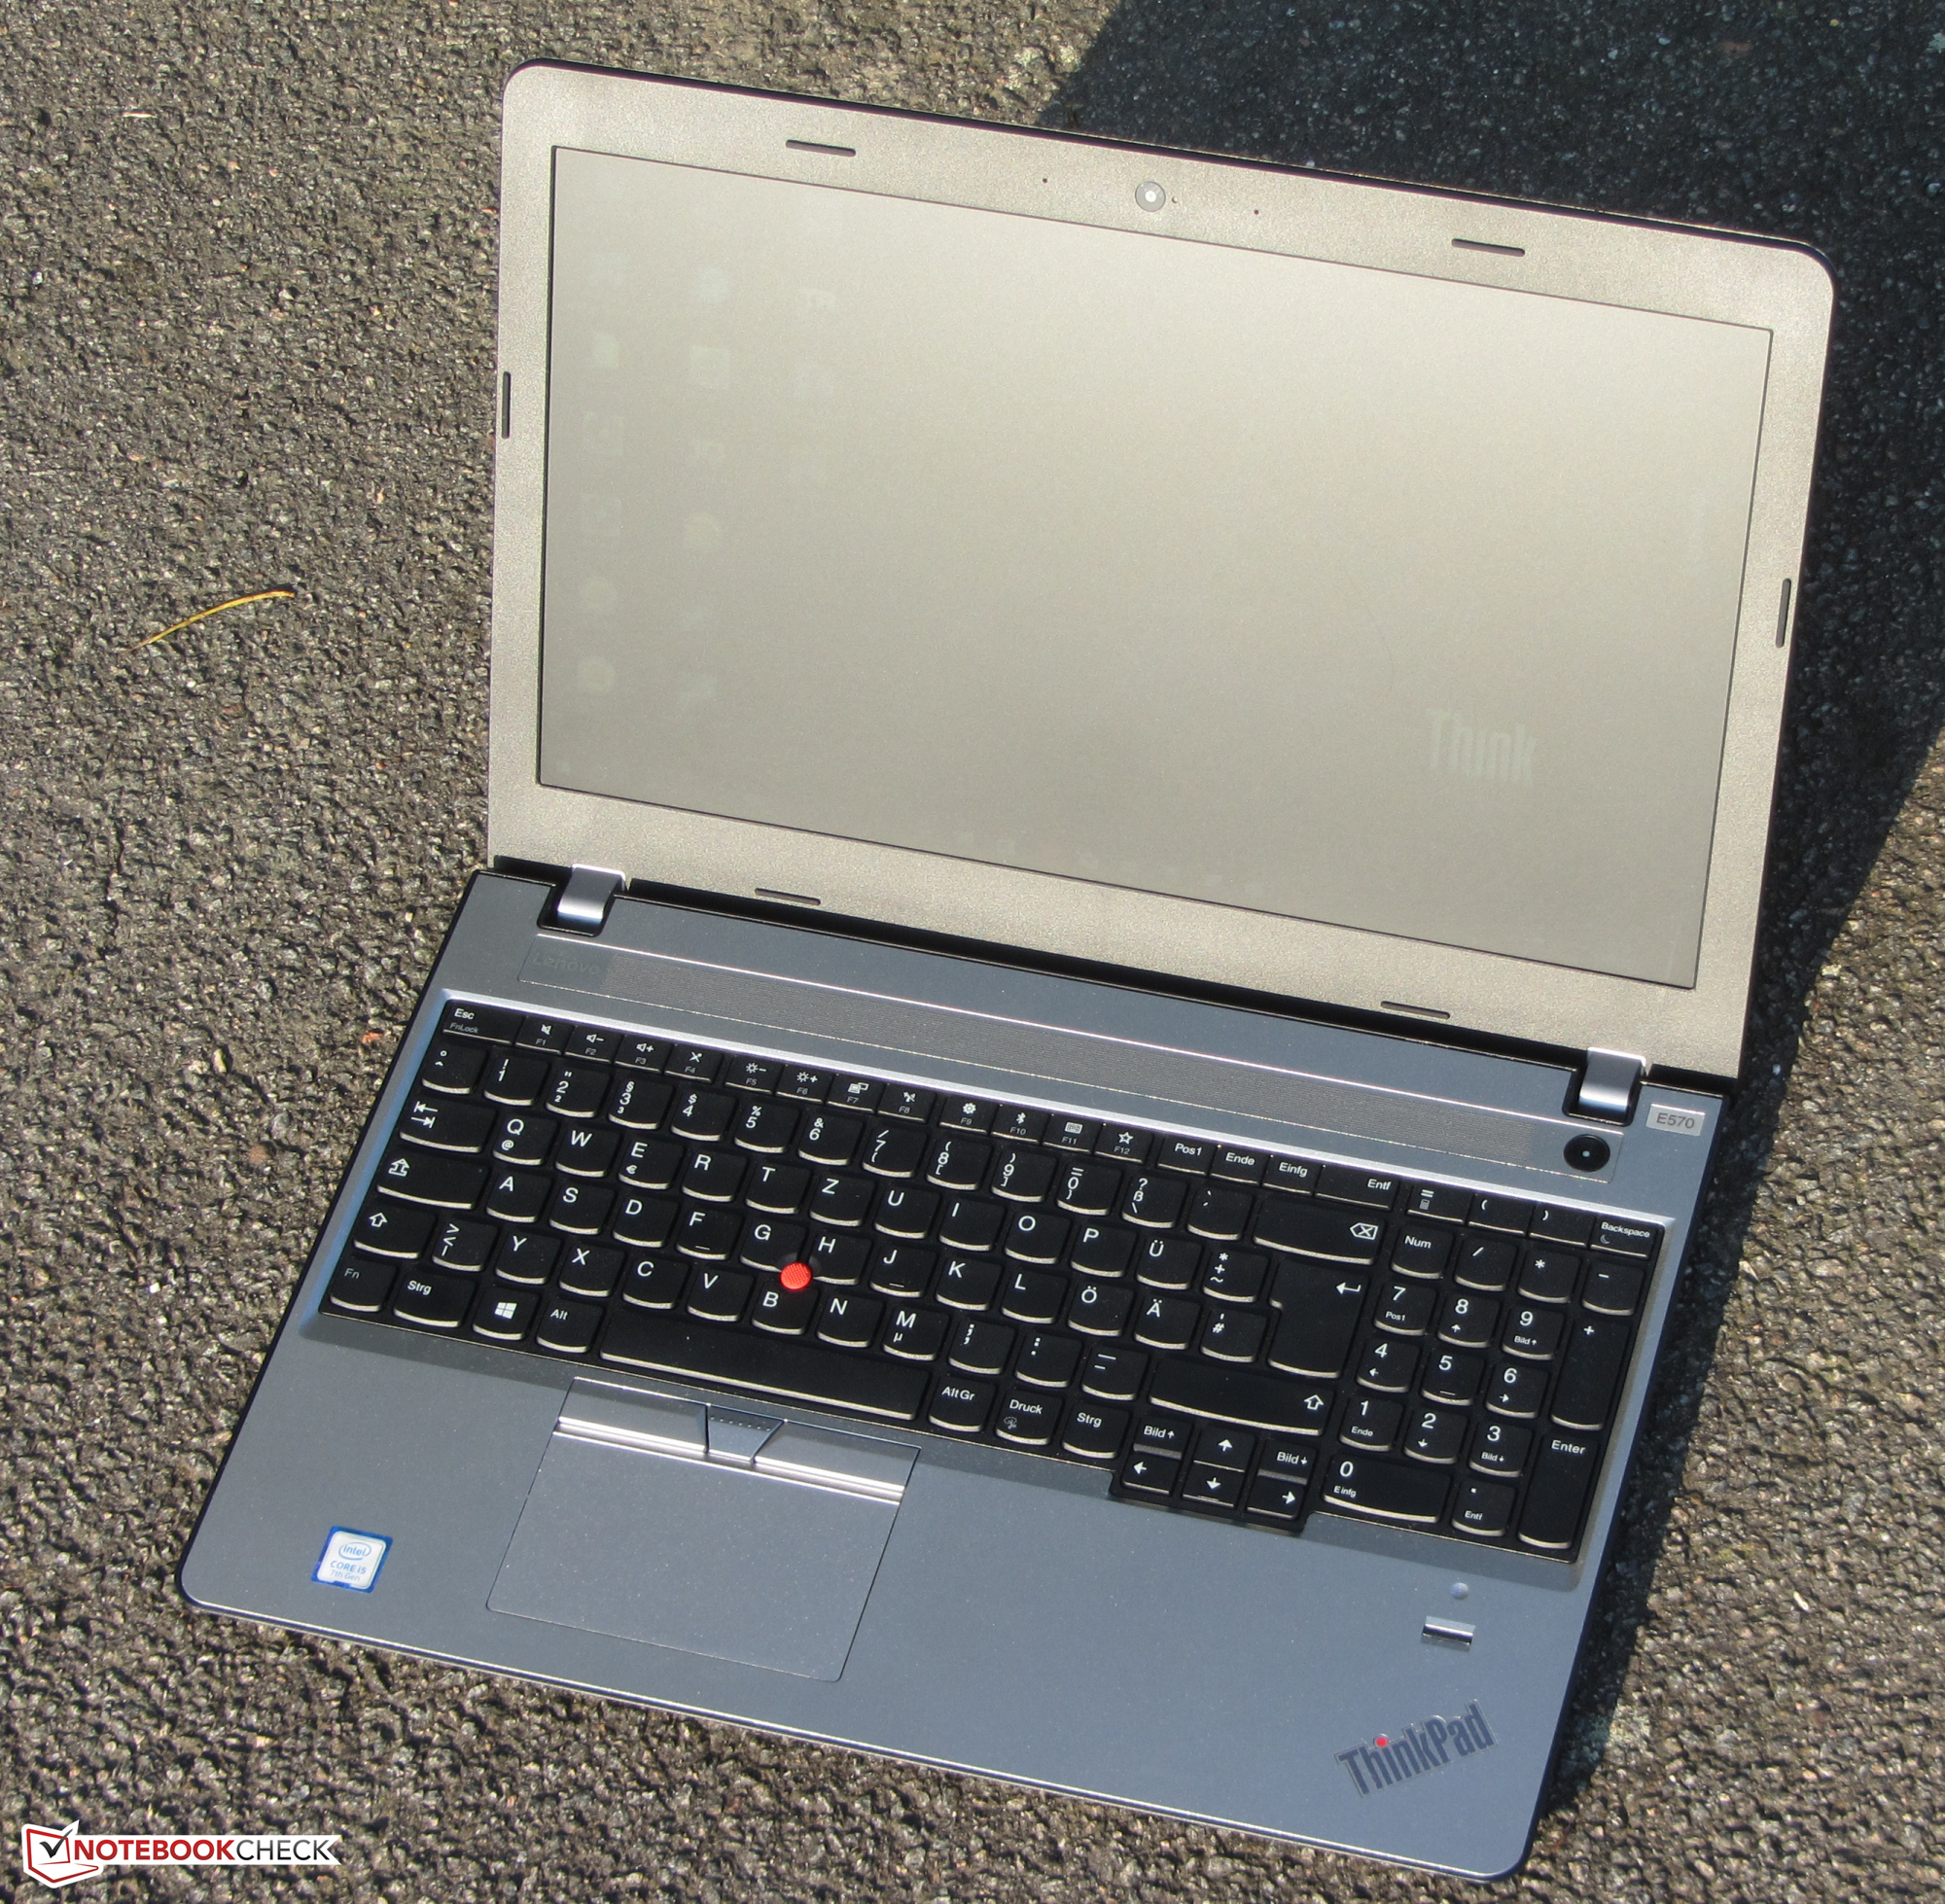
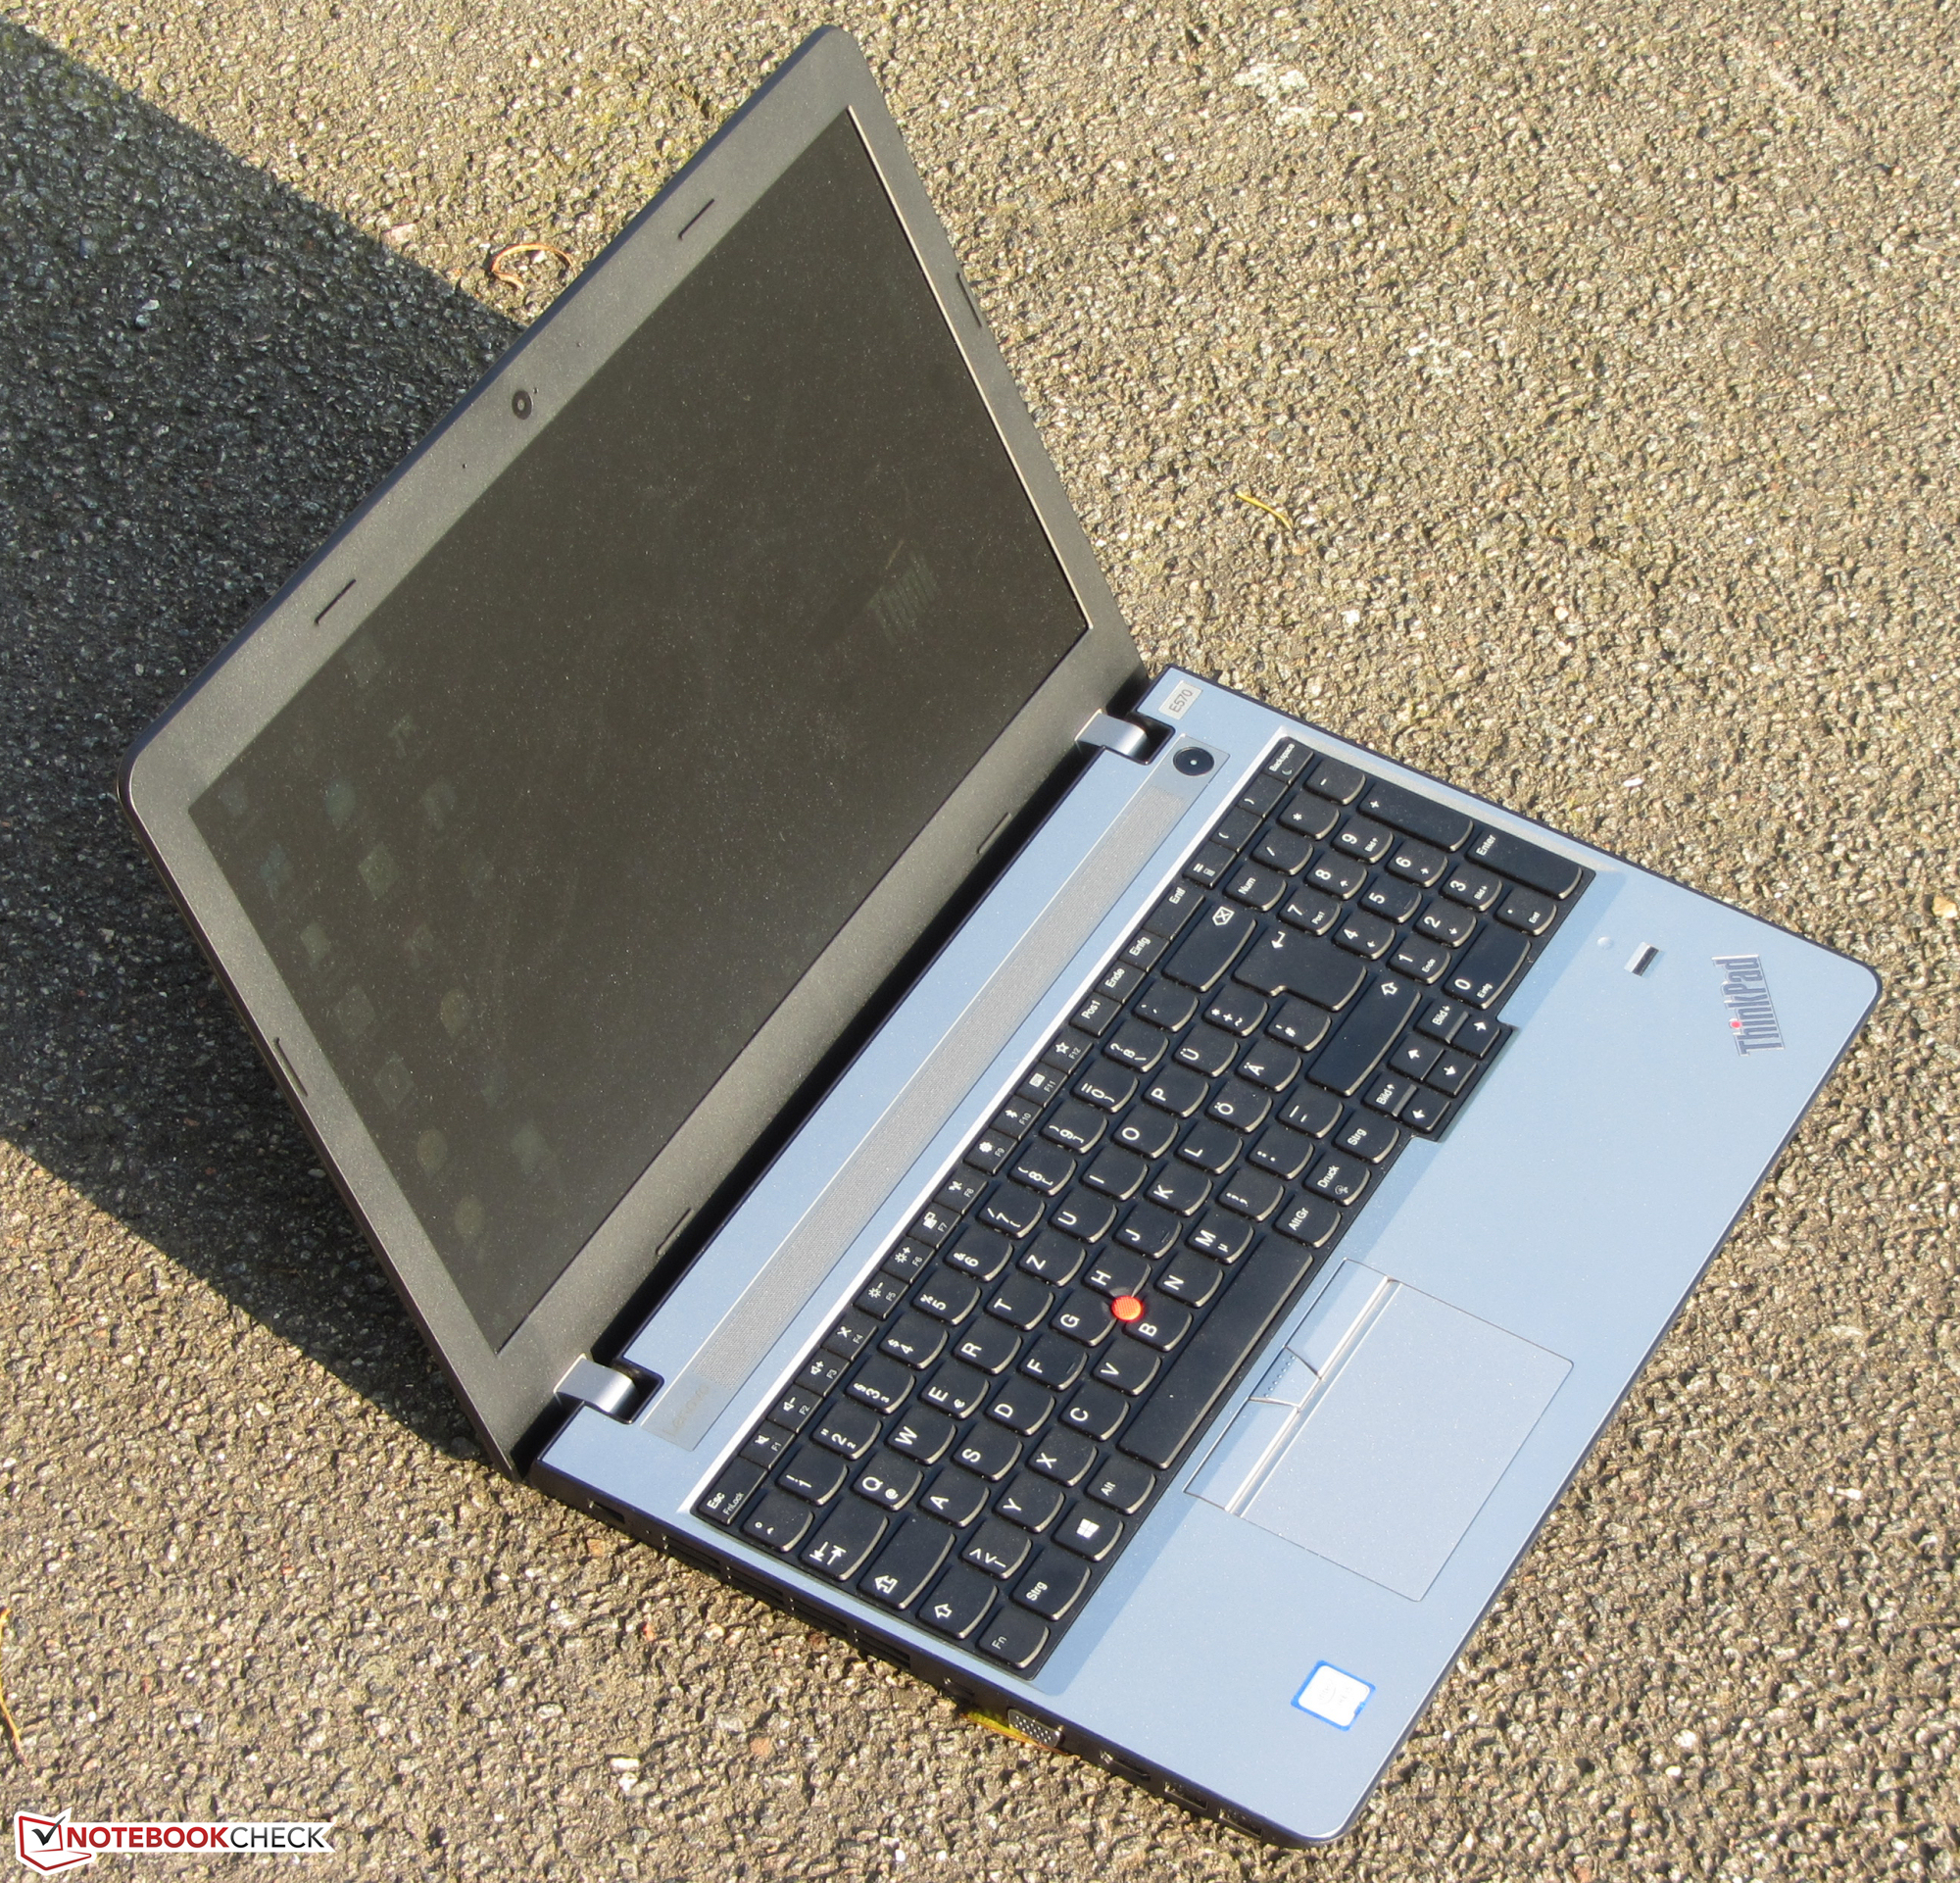
Lenovo ha tomado la decisión errónea con la pantalla. Recomendamos el modelo IPS FHD.
Además de la imprecisión en la reproducción del color y la falta de gráfica dedicada, la principal diferencia entre nuestro modelo de pruebas y el E570 testado anteriormente es la pantalla screen. Lenovo ha instalado un panel HD que no convence. Es oscuro, depende del ángulo de visión, y muestra parpadeo PWM. Los usuarios interesados en el ThinkPad deberían optar por un modelo IPS FHD.
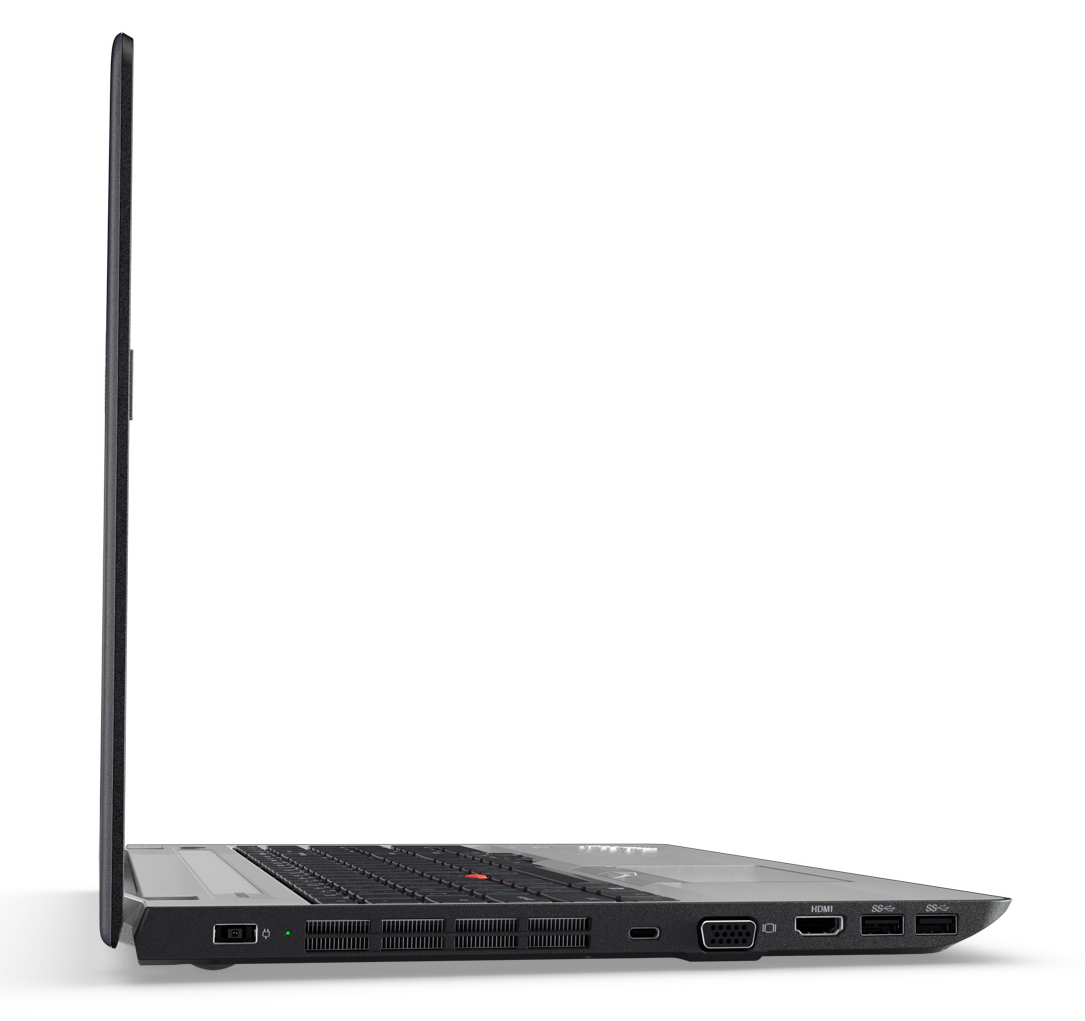
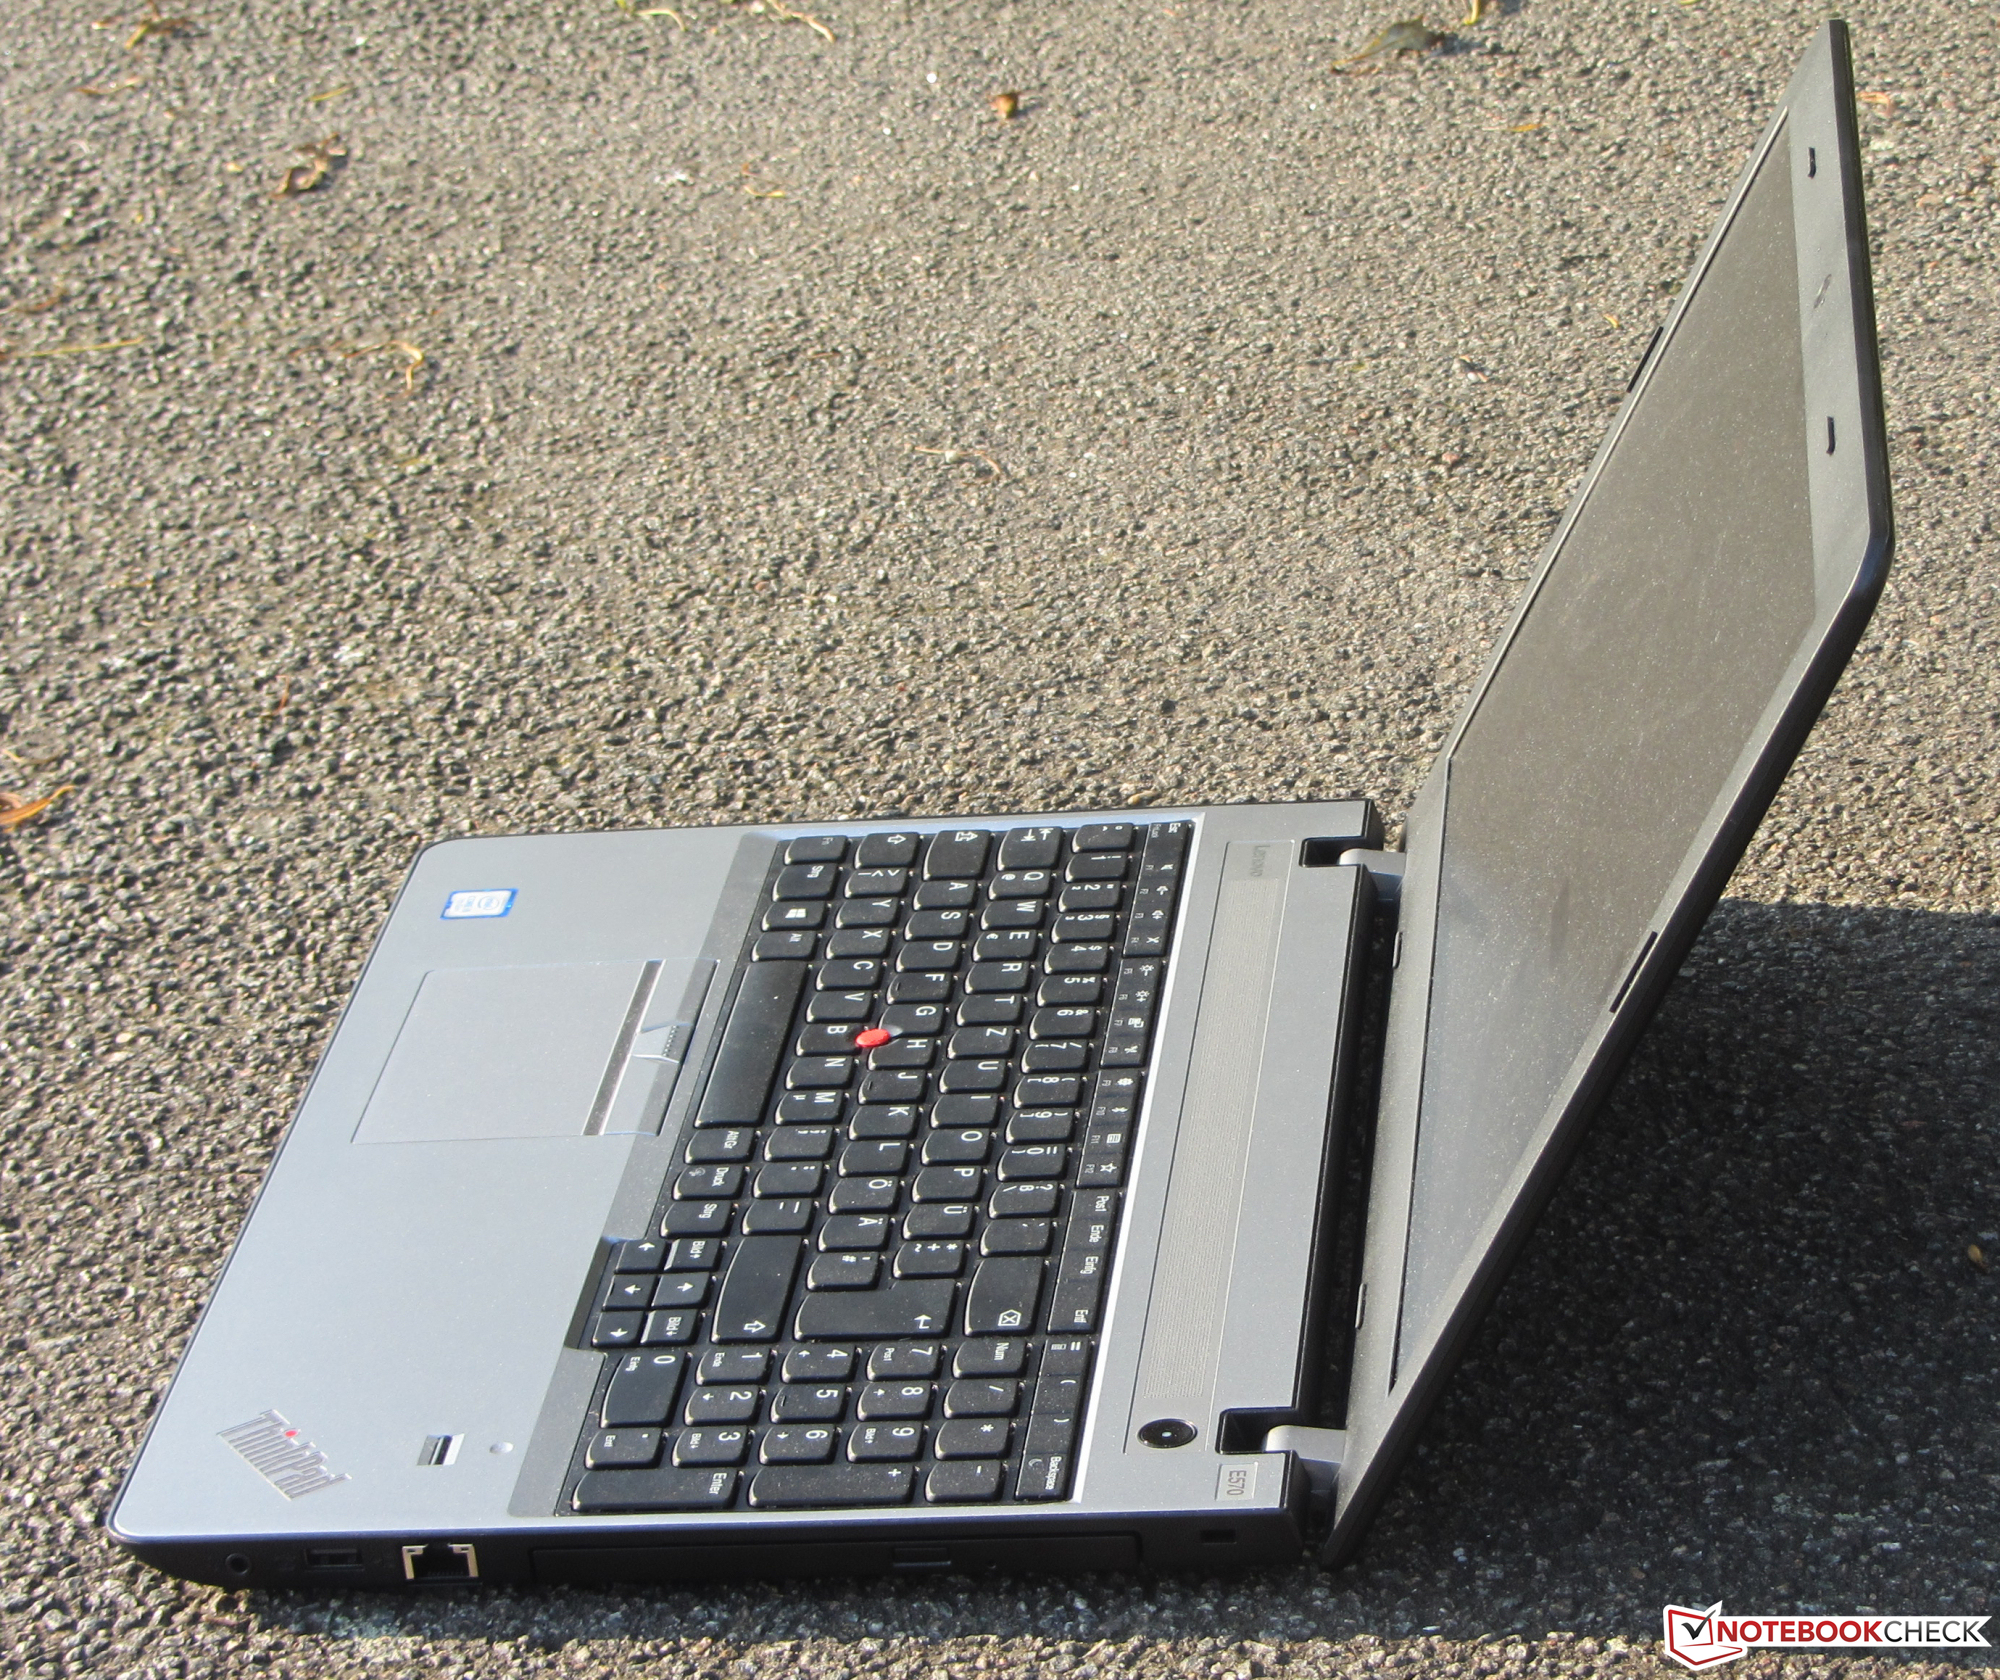
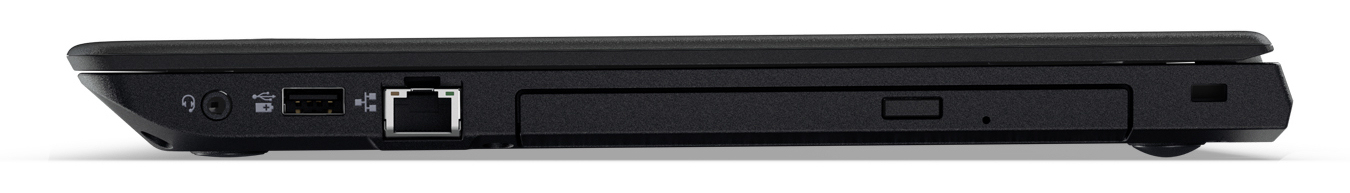
Además de la pantalla, hay más cosas que criticarle al ThinkPad. La carcasa del E570 no es particularmente robusta. Es un paso atrás respecto al predecesor. Otro paso atrás es la omisión del puerto de anclaje (OneLink). Las bases de anclaje OneLink existentes no se pueden usar y tendrán que reemplazarse con modelos USB cuando sea necesario. Las baterías de ThinkPad E560 tampoco se pueden usar. Lo que es más, Lenovo sólo incluye 1 año de garantía con el portátil.
Ésta es una versión acortada del análisis original. Puedes leer el análisis completo en inglés aquí.
Lenovo ThinkPad E570-20H6S02M00
- 10/02/2017 v6 (old)
Sascha Mölck