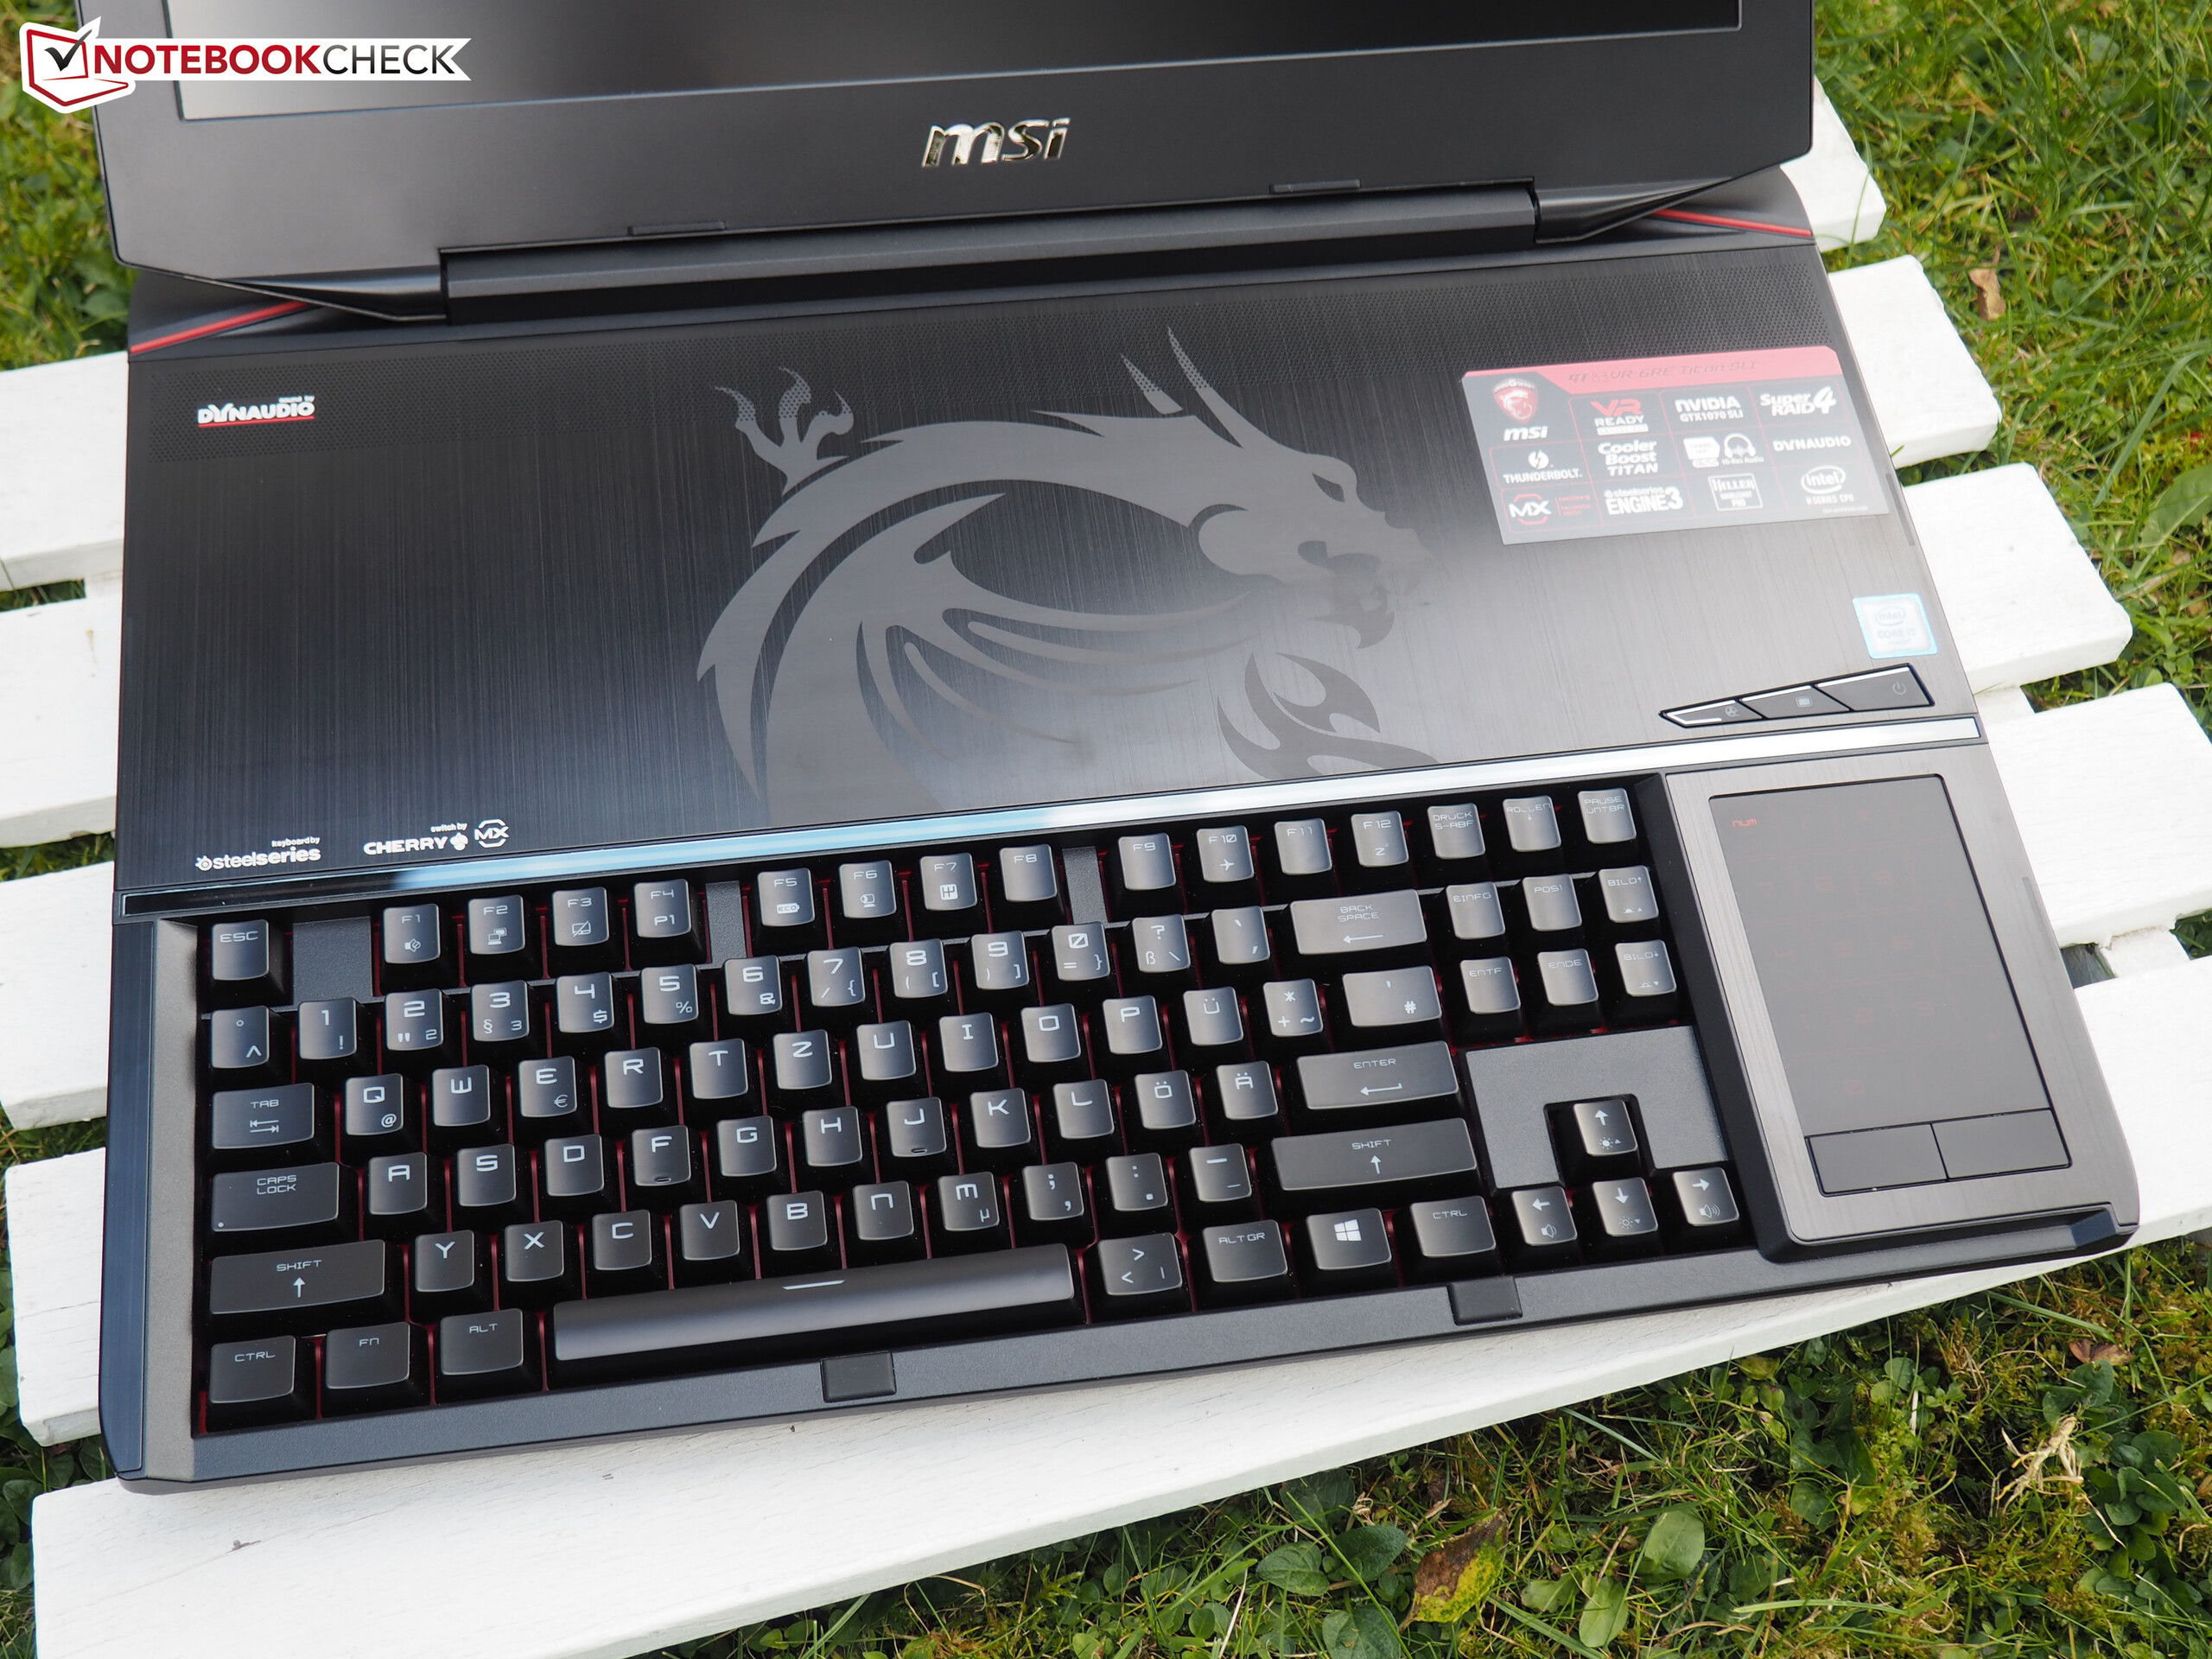
Breve análisis del MSI GT83VR 7RF (7920HQ, GTX 1080 SLI, Full HD)
| SD Card Reader | |
| average JPG Copy Test (av. of 3 runs) | |
| Asus G701VIK-BA049T | |
| MSI GT73VR 7RF-296 | |
| Schenker XMG U727 2017 | |
| MSI GT83VR-6RE32SR451 | |
| MSI GT83VR 7RF-206 Titan SLI | |
| Acer Predator 17 X GX-792-76DL | |
| maximum AS SSD Seq Read Test (1GB) | |
| Asus G701VIK-BA049T | |
| MSI GT73VR 7RF-296 | |
| Schenker XMG U727 2017 | |
| MSI GT83VR 7RF-206 Titan SLI | |
| MSI GT83VR-6RE32SR451 | |
| Acer Predator 17 X GX-792-76DL | |
| |||||||||||||||||||||||||
iluminación: 83 %
Brillo con batería: 266 cd/m²
Contraste: 760:1 (Negro: 0.35 cd/m²)
ΔE ColorChecker Calman: 3.88 | ∀{0.5-29.43 Ø4.73}
ΔE Greyscale Calman: 5.2 | ∀{0.09-98 Ø4.97}
91% sRGB (Argyll 1.6.3 3D)
59% AdobeRGB 1998 (Argyll 1.6.3 3D)
66.4% AdobeRGB 1998 (Argyll 3D)
90.8% sRGB (Argyll 3D)
65.7% Display P3 (Argyll 3D)
Gamma: 2.41
CCT: 7680 K
| MSI GT83VR 7RF-206 Titan SLI Samsung 184HL (SDC4C48), 1920x1080, 18.4" | MSI GT83VR-6RE32SR451 Samsung 184HL (SDC4C48), 1920x1080, 18.4" | Schenker XMG U727 2017 AU Optronics B173ZAN01.0 (AUO109B), 3840x2160, 17.3" | Acer Predator 17 X GX-792-76DL LP173WF4-SPF5 (LGD056D), 1920x1080, 17.3" | Asus G701VIK-BA049T B173HAN01.1 (AUO119D), 1920x1080, 17.3" | MSI GT73VR 7RF-296 N173HHE-G32 (CMN1747), 1920x1080, 17.3" | |
|---|---|---|---|---|---|---|
| Display | -0% | 31% | -5% | -0% | 25% | |
| Display P3 Coverage (%) | 65.7 | 65.8 0% | 86.6 32% | 66 0% | 68.8 5% | 90.6 38% |
| sRGB Coverage (%) | 90.8 | 90.3 -1% | 99.9 10% | 83.7 -8% | 87.7 -3% | 99.9 10% |
| AdobeRGB 1998 Coverage (%) | 66.4 | 66.1 0% | 99.5 50% | 61.2 -8% | 64.1 -3% | 84.7 28% |
| Response Times | 8% | -16% | -17% | 9% | 52% | |
| Response Time Grey 50% / Grey 80% * (ms) | 38.4 ? | 37 ? 4% | 44 ? -15% | 45 ? -17% | 38 ? 1% | 26 ? 32% |
| Response Time Black / White * (ms) | 24 ? | 21 ? 12% | 28 ? -17% | 28 ? -17% | 20 ? 17% | 7 ? 71% |
| PWM Frequency (Hz) | 250 ? | 250 ? | ||||
| Screen | 20% | 31% | 14% | 15% | -18% | |
| Brightness middle (cd/m²) | 266 | 310 17% | 362 36% | 380 43% | 306 15% | 307 15% |
| Brightness (cd/m²) | 243 | 277 14% | 344 42% | 362 49% | 299 23% | 284 17% |
| Brightness Distribution (%) | 83 | 84 1% | 85 2% | 91 10% | 91 10% | 85 2% |
| Black Level * (cd/m²) | 0.35 | 0.4 -14% | 0.35 -0% | 0.37 -6% | 0.27 23% | 0.25 29% |
| Contrast (:1) | 760 | 775 2% | 1034 36% | 1027 35% | 1133 49% | 1228 62% |
| Colorchecker dE 2000 * | 3.88 | 1.83 53% | 2.46 37% | 4.12 -6% | 3.98 -3% | 9.65 -149% |
| Colorchecker dE 2000 max. * | 8.31 | 3.92 53% | 4.26 49% | 8.19 1% | 7.29 12% | 16.36 -97% |
| Greyscale dE 2000 * | 5.2 | 1.38 73% | 2.9 44% | 3.95 24% | 4.15 20% | 10.07 -94% |
| Gamma | 2.41 91% | 2.44 90% | 2.31 95% | 2.47 89% | 2.45 90% | 2.12 104% |
| CCT | 7680 85% | 6723 97% | 6120 106% | 6539 99% | 7386 88% | 12145 54% |
| Color Space (Percent of AdobeRGB 1998) (%) | 59 | 59 0% | 88 49% | 55 -7% | 58 -2% | 75 27% |
| Color Space (Percent of sRGB) (%) | 91 | 90 -1% | 100 10% | 84 -8% | 89 -2% | 100 10% |
| Media total (Programa/Opciones) | 9% /
14% | 15% /
24% | -3% /
6% | 8% /
11% | 20% /
0% |
* ... más pequeño es mejor
Tiempos de respuesta del display
| ↔ Tiempo de respuesta de Negro a Blanco | ||
|---|---|---|
| 24 ms ... subida ↗ y bajada ↘ combinada | ↗ 14.8 ms subida | 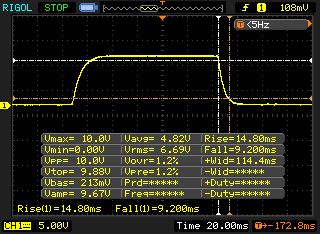 |
| ↘ 9.2 ms bajada | ||
| La pantalla mostró buenos tiempos de respuesta en nuestros tests pero podría ser demasiado lenta para los jugones competitivos. En comparación, todos los dispositivos de prueba van de ##min### (mínimo) a 240 (máximo) ms. » 54 % de todos los dispositivos son mejores. Eso quiere decir que el tiempo de respuesta es peor que la media (19.9 ms) de todos los dispositivos testados. | ||
| ↔ Tiempo de respuesta 50% Gris a 80% Gris | ||
| 38.4 ms ... subida ↗ y bajada ↘ combinada | ↗ 18.8 ms subida | 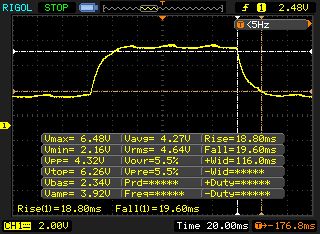 |
| ↘ 19.6 ms bajada | ||
| La pantalla mostró tiempos de respuesta lentos en nuestros tests y podría ser demasiado lenta para los jugones. En comparación, todos los dispositivos de prueba van de ##min### (mínimo) a 636 (máximo) ms. » 57 % de todos los dispositivos son mejores. Eso quiere decir que el tiempo de respuesta es peor que la media (31.1 ms) de todos los dispositivos testados. | ||
Parpadeo de Pantalla / PWM (Pulse-Width Modulation)
| Parpadeo de Pantalla / PWM detectado | 250 Hz | ≤ 90 % de brillo | 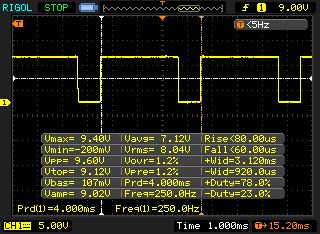 |
La retroiluminación del display parpadea a 250 Hz (seguramente usa PWM - Pulse-Width Modulation) a un brillo del 90 % e inferior. Sobre este nivel de brillo no debería darse parpadeo / PWM. La frecuencia de 250 Hz es relativamente baja, por lo que la gente sensible debería ver parpadeos y padecer fatiga visual por la pantalla (usado al brillo indicado a continuación). Comparación: 52 % de todos los dispositivos testados no usaron PWM para atenuar el display. Si se usó, medimos una media de 7794 (mínimo: 5 - máxmo: 343500) Hz. | |||
| PCMark 8 | |
| Home Score Accelerated v2 | |
| Acer Predator 17 X GX-792-76DL | |
| Asus G701VIK-BA049T | |
| MSI GT83VR-6RE32SR451 | |
| MSI GT83VR 7RF-206 Titan SLI | |
| Schenker XMG U727 2017 | |
| Work Score Accelerated v2 | |
| Acer Predator 17 X GX-792-76DL | |
| Asus G701VIK-BA049T | |
| MSI GT83VR-6RE32SR451 | |
| MSI GT83VR 7RF-206 Titan SLI | |
| Schenker XMG U727 2017 | |
| PCMark 8 Home Score Accelerated v2 | 5159 puntos | |
| PCMark 8 Work Score Accelerated v2 | 5487 puntos | |
| PCMark 10 Score | 5489 puntos | |
ayuda | ||
| MSI GT83VR 7RF-206 Titan SLI 2x Toshiba NVMe THNSN5256GPU7 (RAID 0) | MSI GT83VR-6RE32SR451 2x Samsung SM951 MZVPV256HDGL (RAID 0) | Schenker XMG U727 2017 Samsung SM961 MZVPW256 m.2 PCI-e | Acer Predator 17 X GX-792-76DL Toshiba NVMe THNSN5512GPU7 | Asus G701VIK-BA049T 2x Samsung SM961 MZVPW256HEGL NVMe (RAID 0) | MSI GT73VR 7RF-296 2x Samsung SM951 MZVPV256HDGL (RAID 0) | |
|---|---|---|---|---|---|---|
| CrystalDiskMark 3.0 | 5% | -7% | -16% | 19% | 13% | |
| Read Seq (MB/s) | 3045 | 3284 8% | 1781 -42% | 1494 -51% | 3487 15% | 3219 6% |
| Write Seq (MB/s) | 2149 | 2548 19% | 1515 -30% | 1371 -36% | 2690 25% | 2572 20% |
| Read 512 (MB/s) | 1774 | 1728 -3% | 371.4 -79% | 898 -49% | 1499 -16% | 1776 0% |
| Write 512 (MB/s) | 1788 | 2352 32% | 1073 -40% | 1273 -29% | 2493 39% | 2445 37% |
| Read 4k (MB/s) | 40.84 | 50.1 23% | 61.5 51% | 43.82 7% | 53.7 31% | 51.1 25% |
| Write 4k (MB/s) | 138.9 | 137.6 -1% | 195.6 41% | 161.6 16% | 133.2 -4% | 141.3 2% |
| Read 4k QD32 (MB/s) | 635 | 506 -20% | 755 19% | 669 5% | 795 25% | 658 4% |
| Write 4k QD32 (MB/s) | 512 | 435.4 -15% | 642 25% | 552 8% | 699 37% | 554 8% |

| 3DMark - 1920x1080 Fire Strike Graphics | |
| MSI GT83VR 7RF-206 Titan SLI | |
| MSI GT83VR-6RE32SR451 | |
| Asus G701VIK-BA049T | |
| Acer Predator 17 X GX-792-76DL | |
| Schenker XMG U727 2017 | |
| MSI GT73VR 7RF-296 | |
| 3DMark 11 - 1280x720 Performance GPU | |
| MSI GT83VR 7RF-206 Titan SLI | |
| MSI GT83VR-6RE32SR451 | |
| Asus G701VIK-BA049T | |
| Schenker XMG U727 2017 | |
| MSI GT73VR 7RF-296 | |
| Acer Predator 17 X GX-792-76DL | |
| 3DMark 11 Performance | 25018 puntos | |
| 3DMark Ice Storm Standard Score | 161549 puntos | |
| 3DMark Cloud Gate Standard Score | 32233 puntos | |
| 3DMark Fire Strike Score | 22192 puntos | |
ayuda | ||
| The Witcher 3 | |
| 3840x2160 High Graphics & Postprocessing (Nvidia HairWorks Off) | |
| MSI GT83VR 7RF-206 Titan SLI | |
| Schenker XMG U727 2017 | |
| 1920x1080 Ultra Graphics & Postprocessing (HBAO+) | |
| MSI GT83VR 7RF-206 Titan SLI | |
| Schenker XMG U727 2017 | |
| Deus Ex Mankind Divided - 1920x1080 Ultra Preset AA:2xMS AF:8x | |
| MSI GT83VR 7RF-206 Titan SLI | |
| Battlefield 1 | |
| 3840x2160 High Preset AA:T | |
| MSI GT83VR 7RF-206 Titan SLI | |
| Schenker XMG U727 2017 | |
| 1920x1080 Ultra Preset AA:T | |
| MSI GT83VR 7RF-206 Titan SLI | |
| Schenker XMG U727 2017 | |
| Titanfall 2 | |
| 3840x2160 High / Enabled AA:TS AF:8x | |
| MSI GT83VR 7RF-206 Titan SLI | |
| Schenker XMG U727 2017 | |
| 1920x1080 Very High (Insane Texture Quality) / Enabled AA:TS AF:16x | |
| MSI GT83VR 7RF-206 Titan SLI | |
| Schenker XMG U727 2017 | |
| Call of Duty Infinite Warfare | |
| 3840x2160 High / On AA:FX | |
| MSI GT83VR 7RF-206 Titan SLI | |
| Schenker XMG U727 2017 | |
| 1920x1080 Ultra / On AA:T2X SM | |
| MSI GT83VR 7RF-206 Titan SLI | |
| Schenker XMG U727 2017 | |
| Dishonored 2 | |
| 3840x2160 High Preset AA:TX | |
| MSI GT83VR 7RF-206 Titan SLI | |
| Schenker XMG U727 2017 | |
| 1920x1080 Ultra Preset AA:TX | |
| Schenker XMG U727 2017 | |
| MSI GT83VR 7RF-206 Titan SLI | |
| Watch Dogs 2 | |
| 3840x2160 High Preset | |
| MSI GT83VR 7RF-206 Titan SLI | |
| Schenker XMG U727 2017 | |
| 1920x1080 Ultra Preset | |
| MSI GT83VR 7RF-206 Titan SLI | |
| Schenker XMG U727 2017 | |
| Resident Evil 7 | |
| 3840x2160 High / On AA:FXAA+T | |
| Desktop PC | |
| MSI GT83VR 7RF-206 Titan SLI | |
| Schenker XMG U727 2017 | |
| 1920x1080 Very High / On AA:FXAA+T | |
| Desktop PC | |
| Schenker XMG U727 2017 | |
| MSI GT83VR 7RF-206 Titan SLI | |
| For Honor | |
| 3840x2160 High Preset AA:T AF:8x | |
| MSI GT83VR 7RF-206 Titan SLI | |
| Desktop PC | |
| Schenker XMG U727 2017 | |
| 1920x1080 Extreme Preset AA:T AF:16x | |
| MSI GT83VR 7RF-206 Titan SLI | |
| Desktop PC | |
| Schenker XMG U727 2017 | |
| Ghost Recon Wildlands | |
| 3840x2160 Very High Preset AA:T AF:8x | |
| MSI GT83VR 7RF-206 Titan SLI | |
| Desktop PC | |
| 1920x1080 Ultra Preset AA:T AF:16x | |
| MSI GT83VR 7RF-206 Titan SLI | |
| Desktop PC | |
| Mass Effect Andromeda | |
| 3840x2160 High Preset (Resolution Scale Mode off) AA:T | |
| MSI GT83VR 7RF-206 Titan SLI | |
| Desktop PC | |
| 1920x1080 Ultra Preset (Resolution Scale Mode off) AA:T | |
| Desktop PC | |
| MSI GT83VR 7RF-206 Titan SLI | |
| Warhammer 40.000: Dawn of War III | |
| 3840x2160 High / On (100 % Gameplay Resolution) AA:High | |
| MSI GT83VR 7RF-206 Titan SLI | |
| Desktop PC | |
| 1920x1080 Maximum / On (100 % Gameplay Resolution) AA:High | |
| MSI GT83VR 7RF-206 Titan SLI | |
| Desktop PC | |
| Prey | |
| 3840x2160 High Preset AA:2TX SM AF:8x | |
| MSI GT83VR 7RF-206 Titan SLI | |
| Desktop PC | |
| 1920x1080 Very High Preset AA:2TX SM AF:16x | |
| Desktop PC | |
| MSI GT83VR 7RF-206 Titan SLI | |
| Rocket League | |
| 3840x2160 High Quality AA:High FX | |
| MSI GT83VR 7RF-206 Titan SLI | |
| Desktop PC | |
| 1920x1080 High Quality AA:High FX | |
| Desktop PC | |
| MSI GT83VR 7RF-206 Titan SLI | |
| Dirt 4 - 1920x1080 Ultra Preset AA:4xMS AF:16x | |
| Desktop PC | |
| MSI GT83VR 7RF-206 Titan SLI | |
| bajo | medio | alto | ultra | 4K | |
|---|---|---|---|---|---|
| The Witcher 3 (2015) | 181 | 115 | 89.2 | ||
| Deus Ex Mankind Divided (2016) | 79.7 | 73.3 | |||
| Battlefield 1 (2016) | 157 | 145 | 76.7 | ||
| Titanfall 2 (2016) | 144 | 143 | 74.2 | ||
| Call of Duty Infinite Warfare (2016) | 124 | 124 | 76.1 | ||
| Dishonored 2 (2016) | 88.1 | 77.4 | 71.2 | ||
| Watch Dogs 2 (2016) | 118 | 102 | 75.6 | ||
| Resident Evil 7 (2017) | 192 | 162 | 56.3 | ||
| For Honor (2017) | 194 | 182 | 108 | ||
| Ghost Recon Wildlands (2017) | 122 | 82.7 | 65.4 | ||
| Mass Effect Andromeda (2017) | 89 | 83.6 | 60 | ||
| Warhammer 40.000: Dawn of War III (2017) | 100 | 97.4 | 79.8 | ||
| Prey (2017) | 143 | 141 | 83.9 | ||
| Rocket League (2017) | 232 | 169 | |||
| Dirt 4 (2017) | 134 | 84.1 |
Ruido
| Ocioso |
| 35 / 38 / 41 dB(A) |
| DVD |
| 38 / dB(A) |
| Carga |
| 52 / 59 dB(A) |
 | ||
30 dB silencioso 40 dB(A) audible 50 dB(A) ruidosamente alto |
||
min: | ||
| MSI GT83VR 7RF-206 Titan SLI GeForce GTX 1080 SLI (Laptop), i7-7920HQ | MSI GT83VR-6RE32SR451 GeForce GTX 1070 SLI (Laptop), 6820HK | Schenker XMG U727 2017 GeForce GTX 1080 Mobile, i7-7700K | Acer Predator 17 X GX-792-76DL GeForce GTX 1080 Mobile, i7-7820HK | Asus G701VIK-BA049T GeForce GTX 1080 Mobile, i7-7820HK | MSI GT73VR 7RF-296 GeForce GTX 1080 Mobile, i7-7820HK | |
|---|---|---|---|---|---|---|
| Noise | 8% | 9% | 11% | 10% | 9% | |
| apagado / medio ambiente * (dB) | 31 | 30 3% | 30 3% | 30 3% | 30 3% | 30 3% |
| Idle Minimum * (dB) | 35 | 33 6% | 31 11% | 33 6% | 30 14% | 34 3% |
| Idle Average * (dB) | 38 | 34 11% | 34 11% | 35 8% | 31 18% | 35 8% |
| Idle Maximum * (dB) | 41 | 35 15% | 37 10% | 37 10% | 36 12% | 37 10% |
| Load Average * (dB) | 52 | 48 8% | 44 15% | 40 23% | 47 10% | 39 25% |
| Witcher 3 ultra * (dB) | 53 | 51 4% | ||||
| Load Maximum * (dB) | 59 | 57 3% | 52 12% | 50 15% | 56 5% | 56 5% |
* ... más pequeño es mejor
(-) La temperatura máxima en la parte superior es de 46 °C / 115 F, frente a la media de 40.4 °C / 105 F, que oscila entre 21.2 y 68.8 °C para la clase Gaming.
(-) El fondo se calienta hasta un máximo de 53 °C / 127 F, frente a la media de 43.2 °C / 110 F
(+) En reposo, la temperatura media de la parte superior es de 29.7 °C / 85# F, frente a la media del dispositivo de 33.9 °C / 93 F.
(±) Jugando a The Witcher 3, la temperatura media de la parte superior es de 35.7 °C / 96 F, frente a la media del dispositivo de 33.9 °C / 93 F.
(+) El reposamanos y el panel táctil están a una temperatura inferior a la de la piel, con un máximo de 26 °C / 78.8 F y, por tanto, son fríos al tacto.
(+) La temperatura media de la zona del reposamanos de dispositivos similares fue de 28.8 °C / 83.8 F (+2.8 °C / 5 F).
| MSI GT83VR 7RF-206 Titan SLI GeForce GTX 1080 SLI (Laptop), i7-7920HQ | MSI GT83VR-6RE32SR451 GeForce GTX 1070 SLI (Laptop), 6820HK | Schenker XMG U727 2017 GeForce GTX 1080 Mobile, i7-7700K | Acer Predator 17 X GX-792-76DL GeForce GTX 1080 Mobile, i7-7820HK | Asus G701VIK-BA049T GeForce GTX 1080 Mobile, i7-7820HK | MSI GT73VR 7RF-296 GeForce GTX 1080 Mobile, i7-7820HK | |
|---|---|---|---|---|---|---|
| Heat | 22% | -8% | 3% | 4% | 12% | |
| Maximum Upper Side * (°C) | 46 | 35.8 22% | 47.5 -3% | 44.2 4% | 50.9 -11% | 39.8 13% |
| Maximum Bottom * (°C) | 53 | 42.8 19% | 56 -6% | 43 19% | 44.6 16% | 47.8 10% |
| Idle Upper Side * (°C) | 33 | 24.7 25% | 34.5 -5% | 32.4 2% | 29.9 9% | 27.1 18% |
| Idle Bottom * (°C) | 29 | 22.8 21% | 33.6 -16% | 32.8 -13% | 28.8 1% | 27.4 6% |
* ... más pequeño es mejor
MSI GT83VR 7RF-206 Titan SLI análisis de audio
(+) | los altavoces pueden reproducir a un volumen relativamente alto (#90 dB)
Graves 100 - 315 Hz
(±) | lubina reducida - en promedio 14.3% inferior a la mediana
(±) | la linealidad de los graves es media (9% delta a frecuencia anterior)
Medios 400 - 2000 Hz
(+) | medios equilibrados - a sólo 4.8% de la mediana
(+) | los medios son lineales (2.6% delta a la frecuencia anterior)
Altos 2 - 16 kHz
(+) | máximos equilibrados - a sólo 3.6% de la mediana
(+) | los máximos son lineales (3.2% delta a la frecuencia anterior)
Total 100 - 16.000 Hz
(+) | el sonido global es lineal (13.7% de diferencia con la mediana)
En comparación con la misma clase
» 21% de todos los dispositivos probados de esta clase eran mejores, 7% similares, 72% peores
» El mejor tuvo un delta de 6%, la media fue 18%, el peor fue ###max##%
En comparación con todos los dispositivos probados
» 15% de todos los dispositivos probados eran mejores, 4% similares, 81% peores
» El mejor tuvo un delta de 4%, la media fue 24%, el peor fue ###max##%
Schenker XMG U727 2017 análisis de audio
(+) | los altavoces pueden reproducir a un volumen relativamente alto (#89 dB)
Graves 100 - 315 Hz
(±) | lubina reducida - en promedio 7.9% inferior a la mediana
(±) | la linealidad de los graves es media (10.7% delta a frecuencia anterior)
Medios 400 - 2000 Hz
(+) | medios equilibrados - a sólo 4.3% de la mediana
(+) | los medios son lineales (4.4% delta a la frecuencia anterior)
Altos 2 - 16 kHz
(+) | máximos equilibrados - a sólo 2.3% de la mediana
(+) | los máximos son lineales (4.6% delta a la frecuencia anterior)
Total 100 - 16.000 Hz
(+) | el sonido global es lineal (11.4% de diferencia con la mediana)
En comparación con la misma clase
» 9% de todos los dispositivos probados de esta clase eran mejores, 3% similares, 88% peores
» El mejor tuvo un delta de 6%, la media fue 18%, el peor fue ###max##%
En comparación con todos los dispositivos probados
» 7% de todos los dispositivos probados eran mejores, 2% similares, 91% peores
» El mejor tuvo un delta de 4%, la media fue 24%, el peor fue ###max##%
| Off / Standby | |
| Ocioso | |
| Carga |
|
Clave:
min: | |
| MSI GT83VR 7RF-206 Titan SLI GeForce GTX 1080 SLI (Laptop), i7-7920HQ | MSI GT83VR-6RE32SR451 GeForce GTX 1070 SLI (Laptop), 6820HK | Schenker XMG U727 2017 GeForce GTX 1080 Mobile, i7-7700K | Acer Predator 17 X GX-792-76DL GeForce GTX 1080 Mobile, i7-7820HK | Asus G701VIK-BA049T GeForce GTX 1080 Mobile, i7-7820HK | MSI GT73VR 7RF-296 GeForce GTX 1080 Mobile, i7-7820HK | |
|---|---|---|---|---|---|---|
| Power Consumption | 22% | 26% | 43% | 44% | 40% | |
| Idle Minimum * (Watt) | 45 | 32 29% | 32 29% | 27 40% | 24 47% | 29 36% |
| Idle Average * (Watt) | 54 | 47 13% | 43 20% | 32 41% | 31 43% | 35 35% |
| Idle Maximum * (Watt) | 62 | 52 16% | 51 18% | 41 34% | 38 39% | 40 35% |
| Load Average * (Watt) | 178 | 152 15% | 138 22% | 102 43% | 98 45% | 94 47% |
| Witcher 3 ultra * (Watt) | 380 | 279 27% | ||||
| Load Maximum * (Watt) | 586 | 366 38% | 350 40% | 248 58% | 320 45% | 315 46% |
* ... más pequeño es mejor
| MSI GT83VR 7RF-206 Titan SLI GeForce GTX 1080 SLI (Laptop), i7-7920HQ, 75.24 Wh | MSI GT83VR-6RE32SR451 GeForce GTX 1070 SLI (Laptop), 6820HK, 75 Wh | Schenker XMG U727 2017 GeForce GTX 1080 Mobile, i7-7700K, 89 Wh | Acer Predator 17 X GX-792-76DL GeForce GTX 1080 Mobile, i7-7820HK, 88.8 Wh | Asus G701VIK-BA049T GeForce GTX 1080 Mobile, i7-7820HK, 93 Wh | MSI GT73VR 7RF-296 GeForce GTX 1080 Mobile, i7-7820HK, 75.2 Wh | |
|---|---|---|---|---|---|---|
| Duración de Batería | -2% | 51% | 92% | 93% | 35% | |
| Reader / Idle (h) | 2.4 | 2.5 4% | 3.7 54% | 5.2 117% | 5.7 138% | |
| WiFi v1.3 (h) | 2 | 2 0% | 2.8 40% | 4.2 110% | 4 100% | 2.7 35% |
| Load (h) | 1 | 0.9 -10% | 1.6 60% | 1.5 50% | 1.4 40% | |
| H.264 (h) | 3.4 | 2.4 |
Pro
Contra
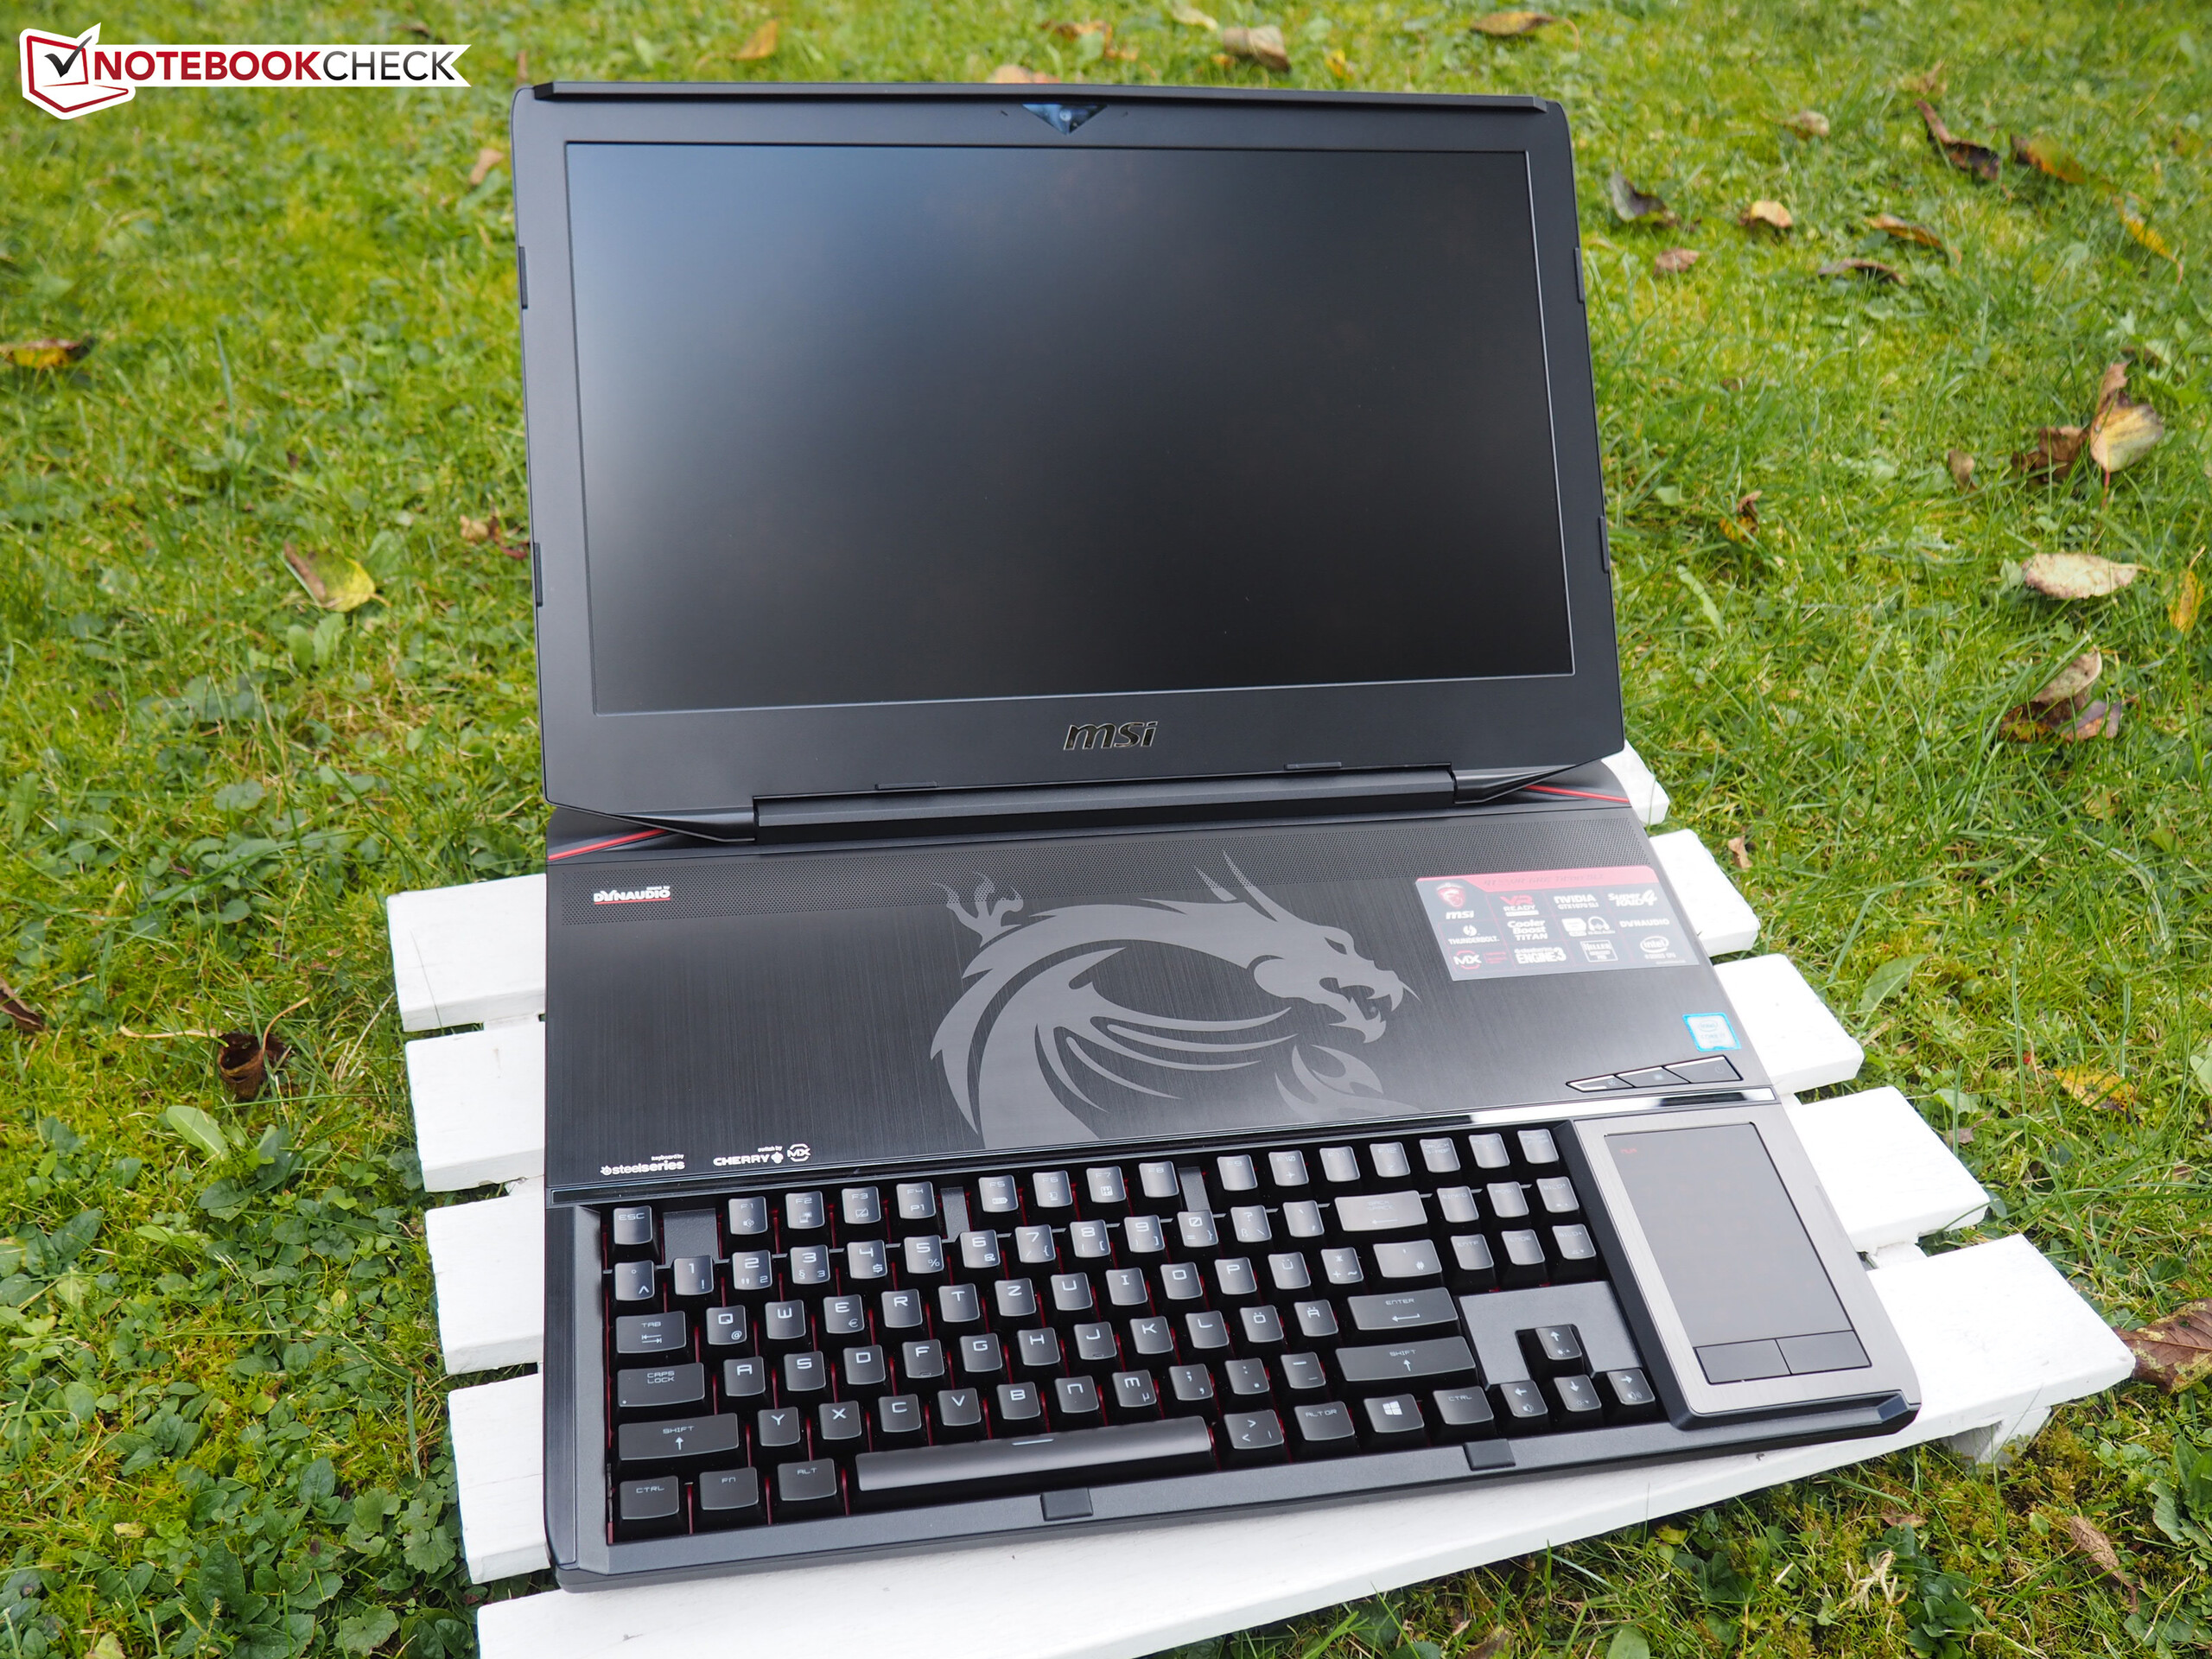
Si sólo miras el rendimiento, lo que ofrece el MSI GT83VR es excelente.
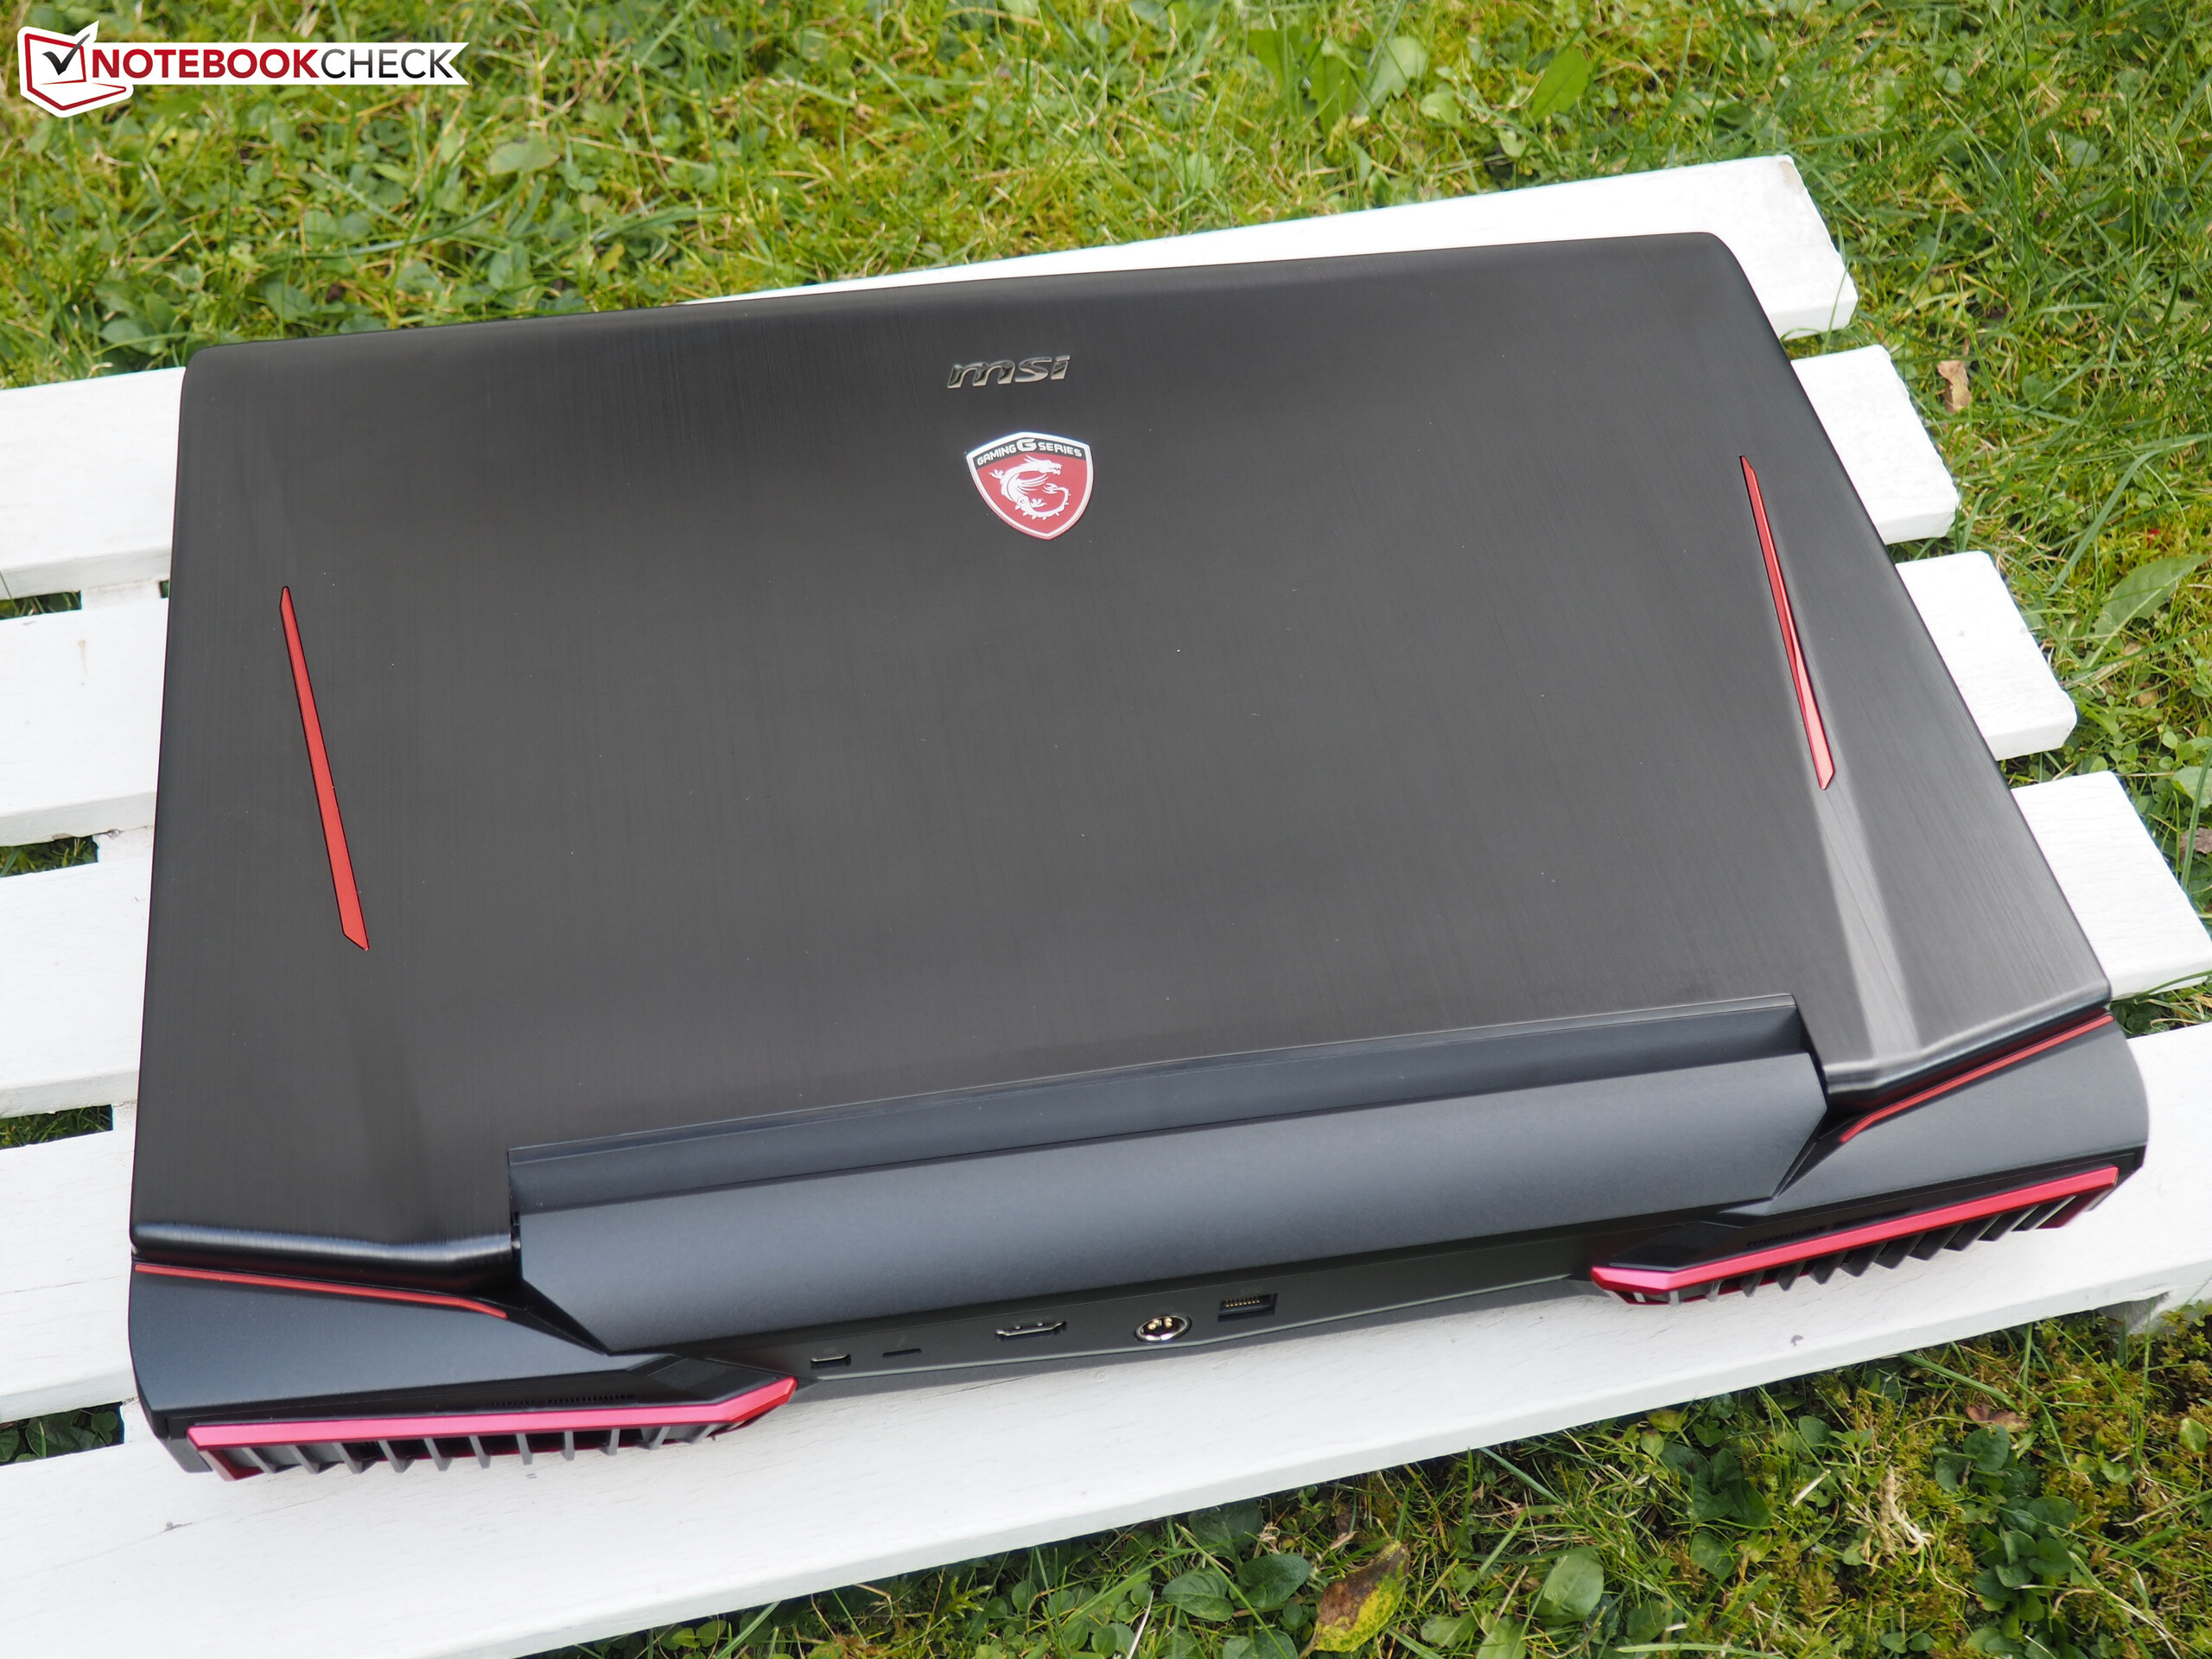
Difícilmente hay un portátil de gama alta con tantas reservas para los juegos modernos - ya sea CPU, GPU, o RAM. Sin embargo, el precio de este rendimiento casi sin rival no es sólo un enorme agujero en la cartera (el modelo de pruebas cuesta más de 5000 Euros), sino que también tiene una enorme y pesada carcasa que sólo puede moverse con cierto esfuerzo.
Nuestras principales quejas son el display y el desarrollo de ruido. Con 1920x1080 pixels y 60 Hz, hasta una única GTX-1080 calcula muy rápido, por lo que el precio extra por el sistema SLI no tiene relación con el beneficio en FPS. Para eso el GT83VR tendría que traer un panel 4K. El incómodo ruido en 3D y el molesto ruido electrónico en inactivo impiden que entre en el Top 10 Gaming.
Para su heredero nos gustaría una carcasa de 17" (hay bastantes paneles 120 Hz y UHD de este tamaño) con chips Max-Q-Graphics – esperamos que más quedos – y soporte G-Sync. Un portátil delgado de 18" con una única GPU también sería una solución interesante para los usuarios que prefieran los displays lo más grande posible.
Ésta es una versión acortada del análisis original. Puedes leer el análisis completo en inglés aquí.
MSI GT83VR 7RF-206 Titan SLI
- 06/17/2017 v6 (old)
Florian Glaser
Price comparison