Breve análisis del Acer Predator 17 X (7820HK, FHD, GTX 1080)


| SD Card Reader | |
| average JPG Copy Test (av. of 3 runs) | |
| Asus G701VIK-BA049T | |
| MSI GT73VR 7RF-296 | |
| MSI GT72VR 7RE-433 | |
| Acer Predator 17 X GX-792-76DL | |
| Acer Predator 17 G9-793-77LG | |
| Aorus X7 v6 | |
| Asus G752VS-XB78K | |
| maximum AS SSD Seq Read Test (1GB) | |
| Asus G701VIK-BA049T | |
| MSI GT73VR 7RF-296 | |
| MSI GT72VR 7RE-433 | |
| Acer Predator 17 X GX-792-76DL | |
| Acer Predator 17 G9-793-77LG | |
| Aorus X7 v6 | |
| Asus G752VS-XB78K | |
| Networking | |
| iperf3 transmit AX12 | |
| Acer Predator 17 X GX-792-76DL | |
| MSI GT73VR 7RF-296 | |
| MSI GT72VR 7RE-433 | |
| Aorus X7 v6 | |
| Asus G701VIK-BA049T | |
| iperf3 receive AX12 | |
| MSI GT73VR 7RF-296 | |
| Acer Predator 17 X GX-792-76DL | |
| Asus G701VIK-BA049T | |
| MSI GT72VR 7RE-433 | |
| Aorus X7 v6 | |
| |||||||||||||||||||||||||
iluminación: 91 %
Brillo con batería: 380 cd/m²
Contraste: 1027:1 (Negro: 0.37 cd/m²)
ΔE ColorChecker Calman: 4.12 | ∀{0.5-29.43 Ø4.73}
ΔE Greyscale Calman: 3.95 | ∀{0.09-98 Ø4.97}
84% sRGB (Argyll 1.6.3 3D)
55% AdobeRGB 1998 (Argyll 1.6.3 3D)
61.2% AdobeRGB 1998 (Argyll 3D)
83.7% sRGB (Argyll 3D)
66% Display P3 (Argyll 3D)
Gamma: 2.47
CCT: 6539 K
| Acer Predator 17 X GX-792-76DL LP173WF4-SPF5 (LGD056D), 1920x1080, 17.3" | MSI GT73VR 7RF-296 N173HHE-G32 (CMN1747), 1920x1080, 17.3" | Asus G701VIK-BA049T B173HAN01.1 (AUO119D), 1920x1080, 17.3" | Asus G752VS-XB78K LG Philips LP173WF4-SPF3 (LGD04E8), 1920x1080, 17.3" | MSI GT72VR 7RE-433 Chi Mei N173HHE-G32 (CMN1747), 1920x1080, 17.3" | Aorus X7 v6 B173QTN01.0 (AUO1096), 2560x1440, 17.3" | Acer Predator 17 G9-793-77LG AU Optronics B173ZAN01.0 (AUO109B), 3840x2160, 17.3" | |
|---|---|---|---|---|---|---|---|
| Display | 31% | 5% | 2% | 4% | -2% | 38% | |
| Display P3 Coverage (%) | 66 | 90.6 37% | 68.8 4% | 66.9 1% | 68.3 3% | 60.9 -8% | 86.9 32% |
| sRGB Coverage (%) | 83.7 | 99.9 19% | 87.7 5% | 85.2 2% | 86.7 4% | 84.2 1% | 100 19% |
| AdobeRGB 1998 Coverage (%) | 61.2 | 84.7 38% | 64.1 5% | 62.3 2% | 63.4 4% | 61.2 0% | 99.4 62% |
| Response Times | 59% | 23% | 19% | 56% | 48% | 16% | |
| Response Time Grey 50% / Grey 80% * (ms) | 45 ? | 26 ? 42% | 38 ? 16% | 38 ? 16% | 29 ? 36% | 31 ? 31% | 37 ? 18% |
| Response Time Black / White * (ms) | 28 ? | 7 ? 75% | 20 ? 29% | 22 ? 21% | 7 ? 75% | 10 ? 64% | 24 ? 14% |
| PWM Frequency (Hz) | |||||||
| Screen | -33% | 2% | 3% | -33% | -31% | 13% | |
| Brightness middle (cd/m²) | 380 | 307 -19% | 306 -19% | 328 -14% | 299 -21% | 343 -10% | 336 -12% |
| Brightness (cd/m²) | 362 | 284 -22% | 299 -17% | 317 -12% | 277 -23% | 312 -14% | 320 -12% |
| Brightness Distribution (%) | 91 | 85 -7% | 91 0% | 88 -3% | 87 -4% | 80 -12% | 88 -3% |
| Black Level * (cd/m²) | 0.37 | 0.25 32% | 0.27 27% | 0.3 19% | 0.27 27% | 0.5 -35% | 0.25 32% |
| Contrast (:1) | 1027 | 1228 20% | 1133 10% | 1093 6% | 1107 8% | 686 -33% | 1344 31% |
| Colorchecker dE 2000 * | 4.12 | 9.65 -134% | 3.98 3% | 3.74 9% | 9.65 -134% | 7.33 -78% | 3.61 12% |
| Colorchecker dE 2000 max. * | 8.19 | 16.36 -100% | 7.29 11% | 8.97 -10% | 15.43 -88% | 10.79 -32% | 6.02 26% |
| Greyscale dE 2000 * | 3.95 | 10.07 -155% | 4.15 -5% | 2.67 32% | 9.68 -145% | 7.6 -92% | 4.78 -21% |
| Gamma | 2.47 89% | 2.12 104% | 2.45 90% | 2.41 91% | 1.89 116% | 2.19 100% | 2.32 95% |
| CCT | 6539 99% | 12145 54% | 7386 88% | 6861 95% | 11652 56% | 9024 72% | 6185 105% |
| Color Space (Percent of AdobeRGB 1998) (%) | 55 | 75 36% | 58 5% | 56 2% | 75 36% | 55 0% | 88 60% |
| Color Space (Percent of sRGB) (%) | 84 | 100 19% | 89 6% | 85 1% | 100 19% | 84 0% | 100 19% |
| Media total (Programa/Opciones) | 19% /
-8% | 10% /
5% | 8% /
5% | 9% /
-14% | 5% /
-15% | 22% /
18% |
* ... más pequeño es mejor
Tiempos de respuesta del display
| ↔ Tiempo de respuesta de Negro a Blanco | ||
|---|---|---|
| 28 ms ... subida ↗ y bajada ↘ combinada | ↗ 6 ms subida | 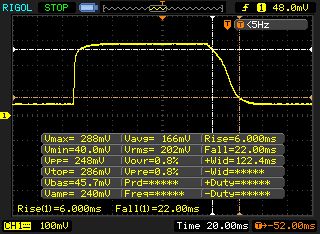 |
| ↘ 22 ms bajada | ||
| La pantalla mostró tiempos de respuesta relativamente lentos en nuestros tests pero podría ser demasiado lenta para los jugones. En comparación, todos los dispositivos de prueba van de ##min### (mínimo) a 240 (máximo) ms. » 71 % de todos los dispositivos son mejores. Eso quiere decir que el tiempo de respuesta es peor que la media (19.9 ms) de todos los dispositivos testados. | ||
| ↔ Tiempo de respuesta 50% Gris a 80% Gris | ||
| 45 ms ... subida ↗ y bajada ↘ combinada | ↗ 18 ms subida | 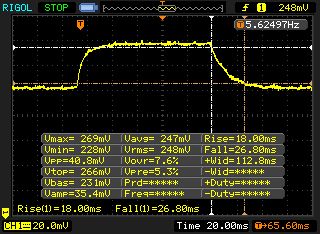 |
| ↘ 27 ms bajada | ||
| La pantalla mostró tiempos de respuesta lentos en nuestros tests y podría ser demasiado lenta para los jugones. En comparación, todos los dispositivos de prueba van de ##min### (mínimo) a 636 (máximo) ms. » 77 % de todos los dispositivos son mejores. Eso quiere decir que el tiempo de respuesta es peor que la media (31.1 ms) de todos los dispositivos testados. | ||
Parpadeo de Pantalla / PWM (Pulse-Width Modulation)
| Parpadeo de Pantalla / PWM no detectado |  | ||
Comparación: 52 % de todos los dispositivos testados no usaron PWM para atenuar el display. Si se usó, medimos una media de 7801 (mínimo: 5 - máxmo: 343500) Hz. | |||
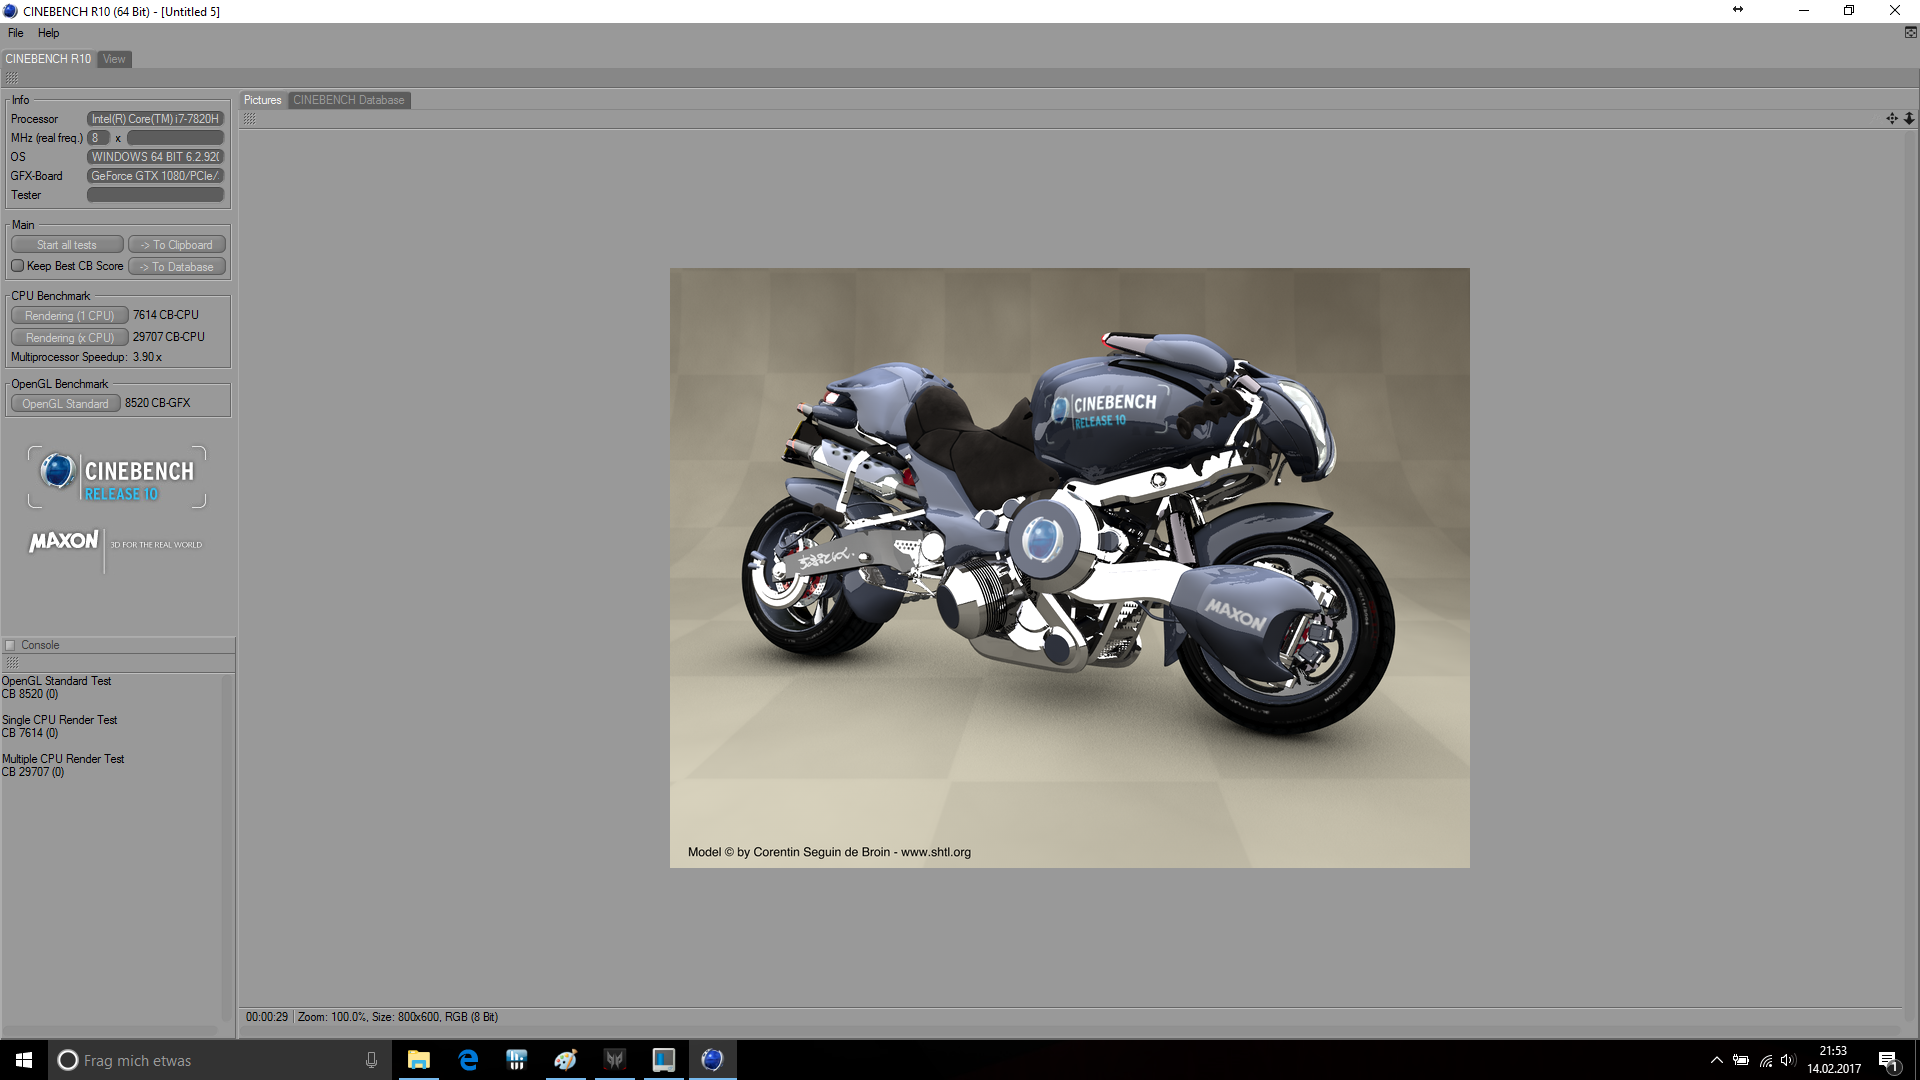
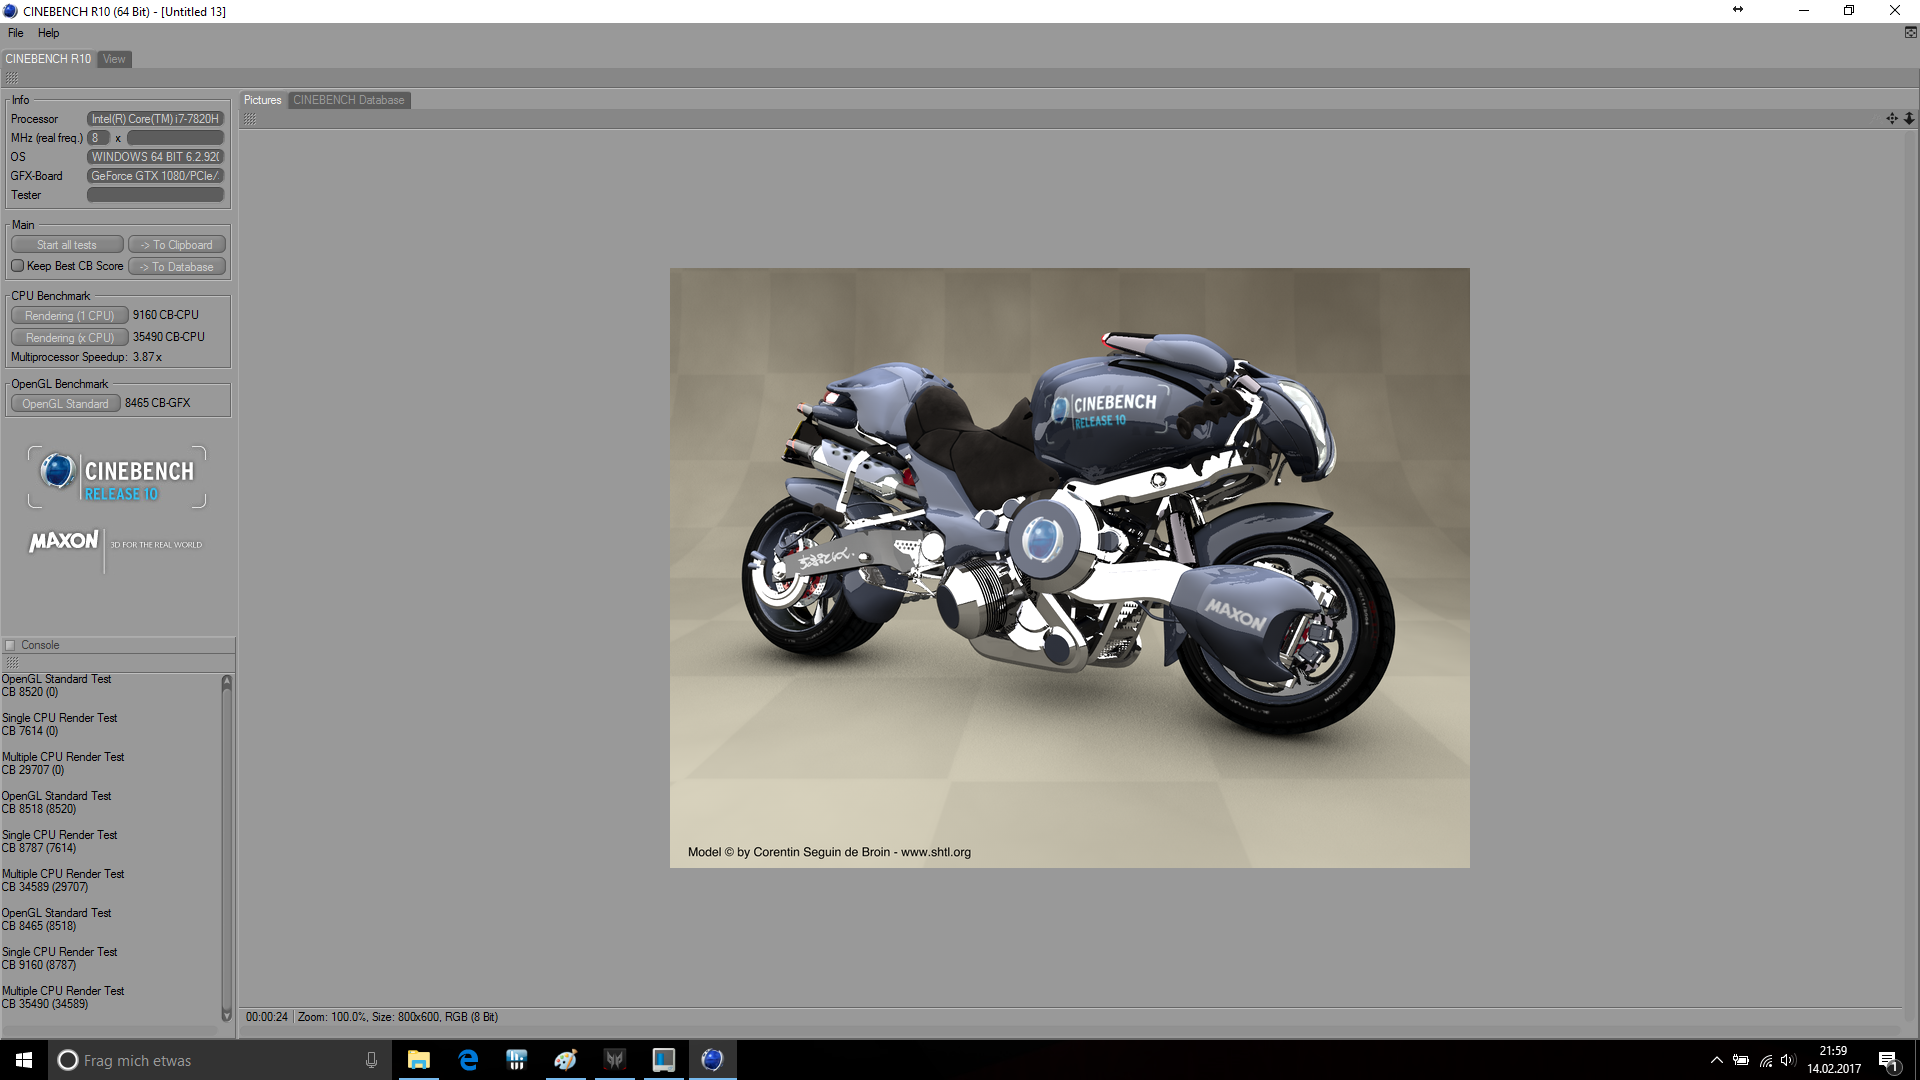
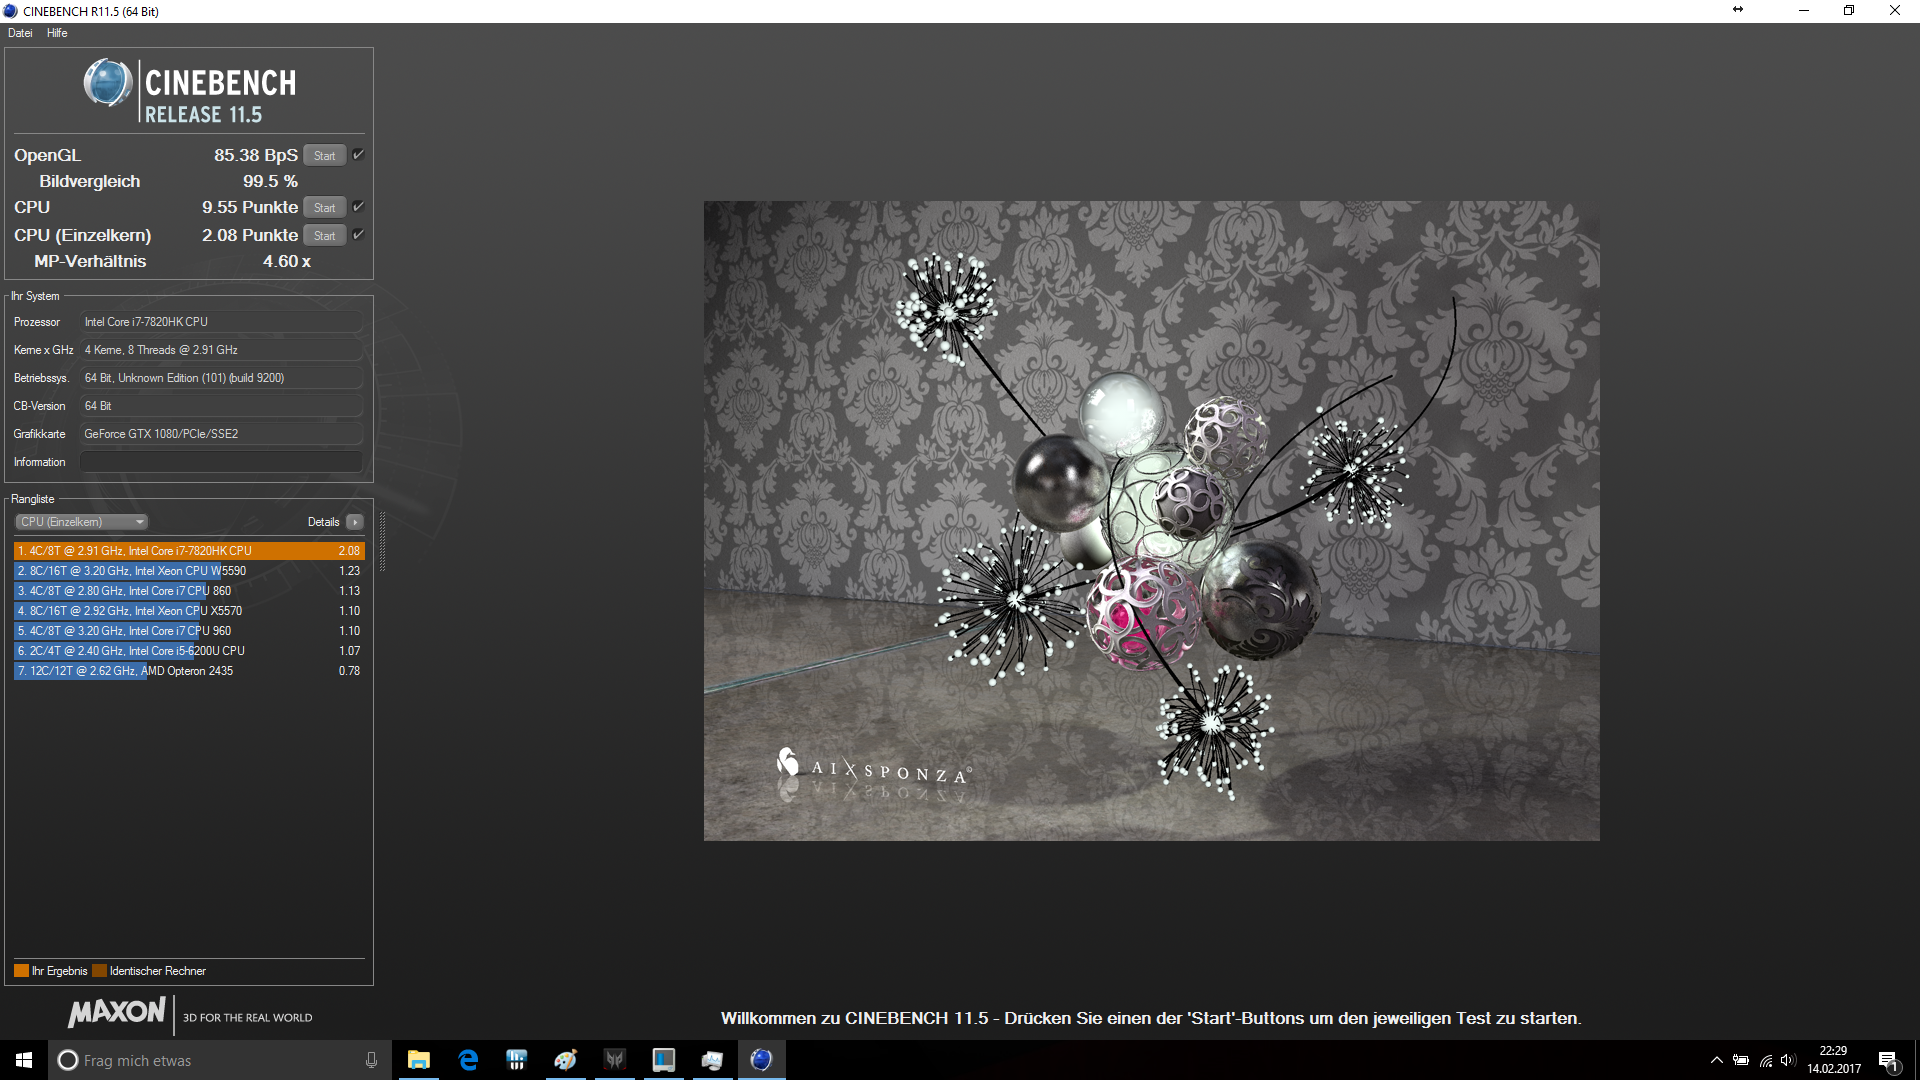
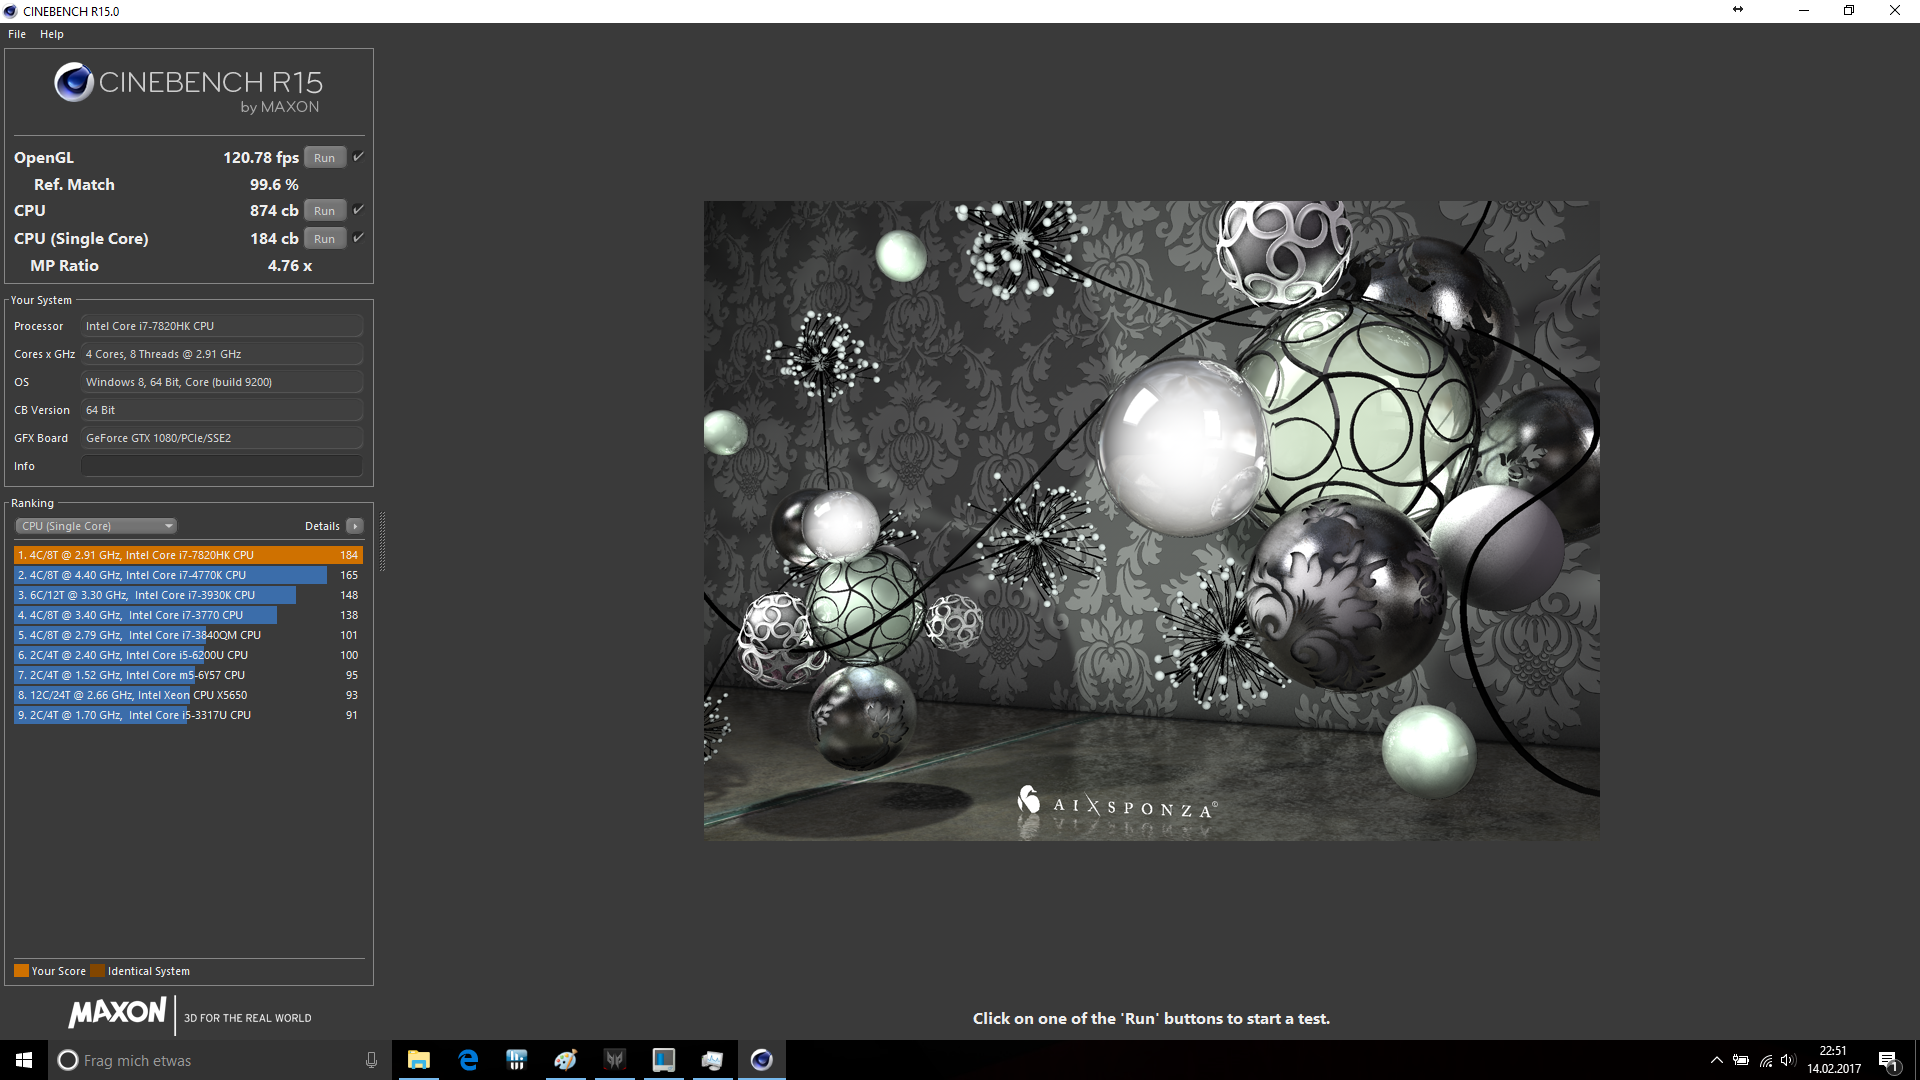
| Cinebench R10 | |
| Rendering Single 32Bit | |
| Acer Predator 17 X GX-792-76DL | |
| Asus G752VS-XB78K | |
| MSI GT72VR 7RE-433 | |
| Rendering Multiple CPUs 32Bit | |
| Acer Predator 17 X GX-792-76DL | |
| Asus G752VS-XB78K | |
| MSI GT72VR 7RE-433 | |
| JetStream 1.1 - 1.1 Total | |
| Acer Predator 17 X GX-792-76DL | |
| MSI GT72VR 7RE-433 | |
| Asus G752VS-XB78K | |
| Octane V2 - Total Score | |
| Acer Predator 17 X GX-792-76DL | |
| MSI GT72VR 7RE-433 | |
| Asus G752VS-XB78K | |
| PCMark 8 | |
| Home Score Accelerated v2 | |
| Acer Predator 17 X GX-792-76DL | |
| Asus G701VIK-BA049T | |
| Asus G752VS-XB78K | |
| MSI GT72VR 7RE-433 | |
| Acer Predator 17 G9-793-77LG | |
| Work Score Accelerated v2 | |
| Acer Predator 17 X GX-792-76DL | |
| Asus G701VIK-BA049T | |
| Asus G752VS-XB78K | |
| MSI GT72VR 7RE-433 | |
| PCMark 7 - Score | |
| Asus G701VIK-BA049T | |
| Acer Predator 17 X GX-792-76DL | |
| MSI GT73VR 7RF-296 | |
| Asus G752VS-XB78K | |
| MSI GT72VR 7RE-433 | |
| Aorus X7 v6 | |
| PCMark Vantage Result | 31085 puntos | |
| PCMark 7 Score | 7667 puntos | |
| PCMark 8 Home Score Accelerated v2 | 5975 puntos | |
| PCMark 8 Creative Score Accelerated v2 | 9309 puntos | |
| PCMark 8 Work Score Accelerated v2 | 6123 puntos | |
ayuda | ||
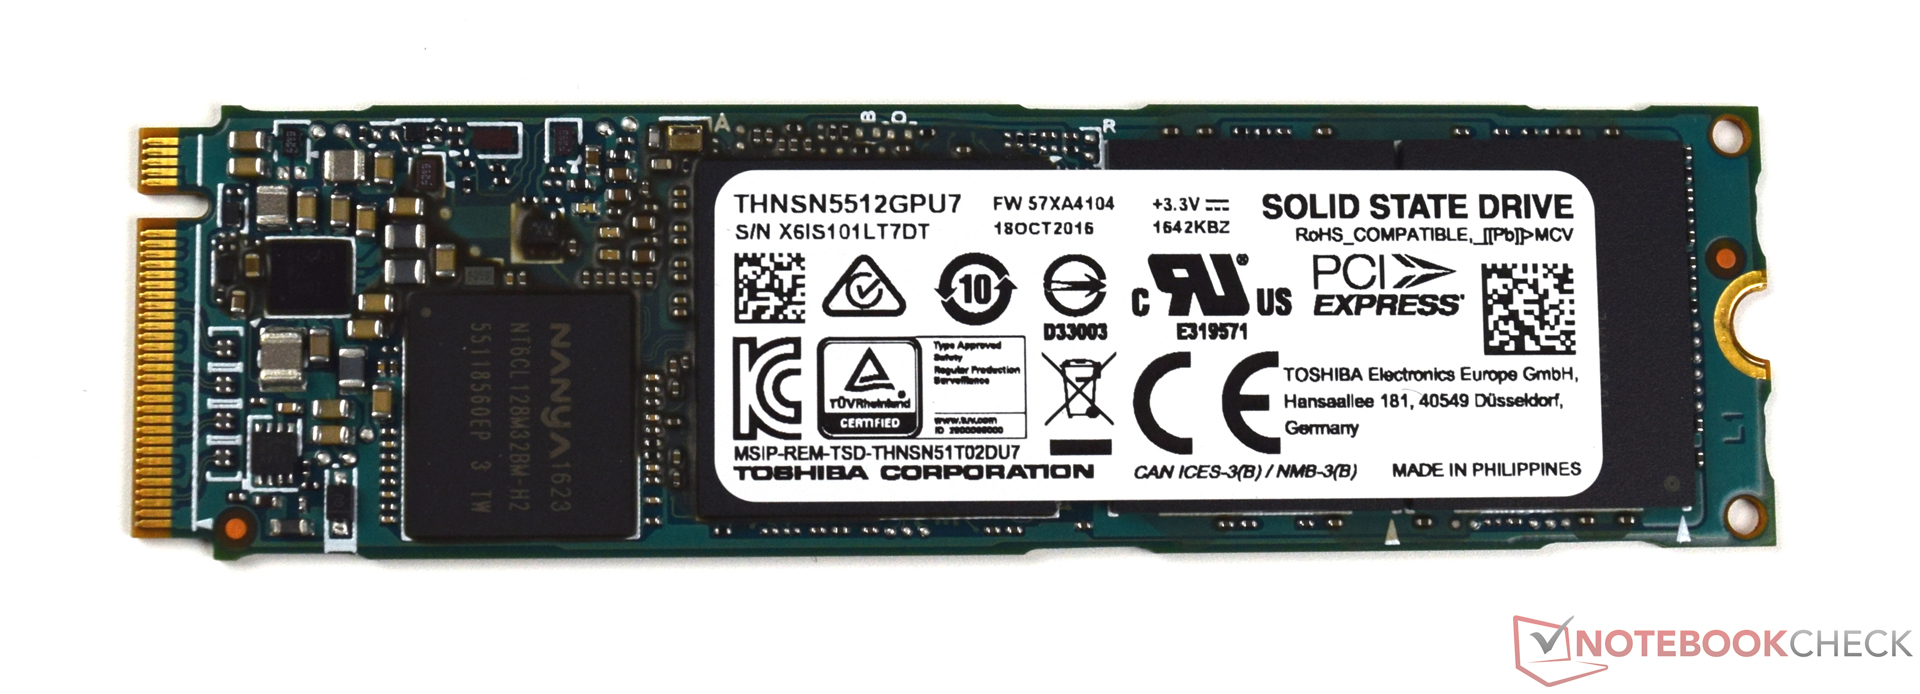
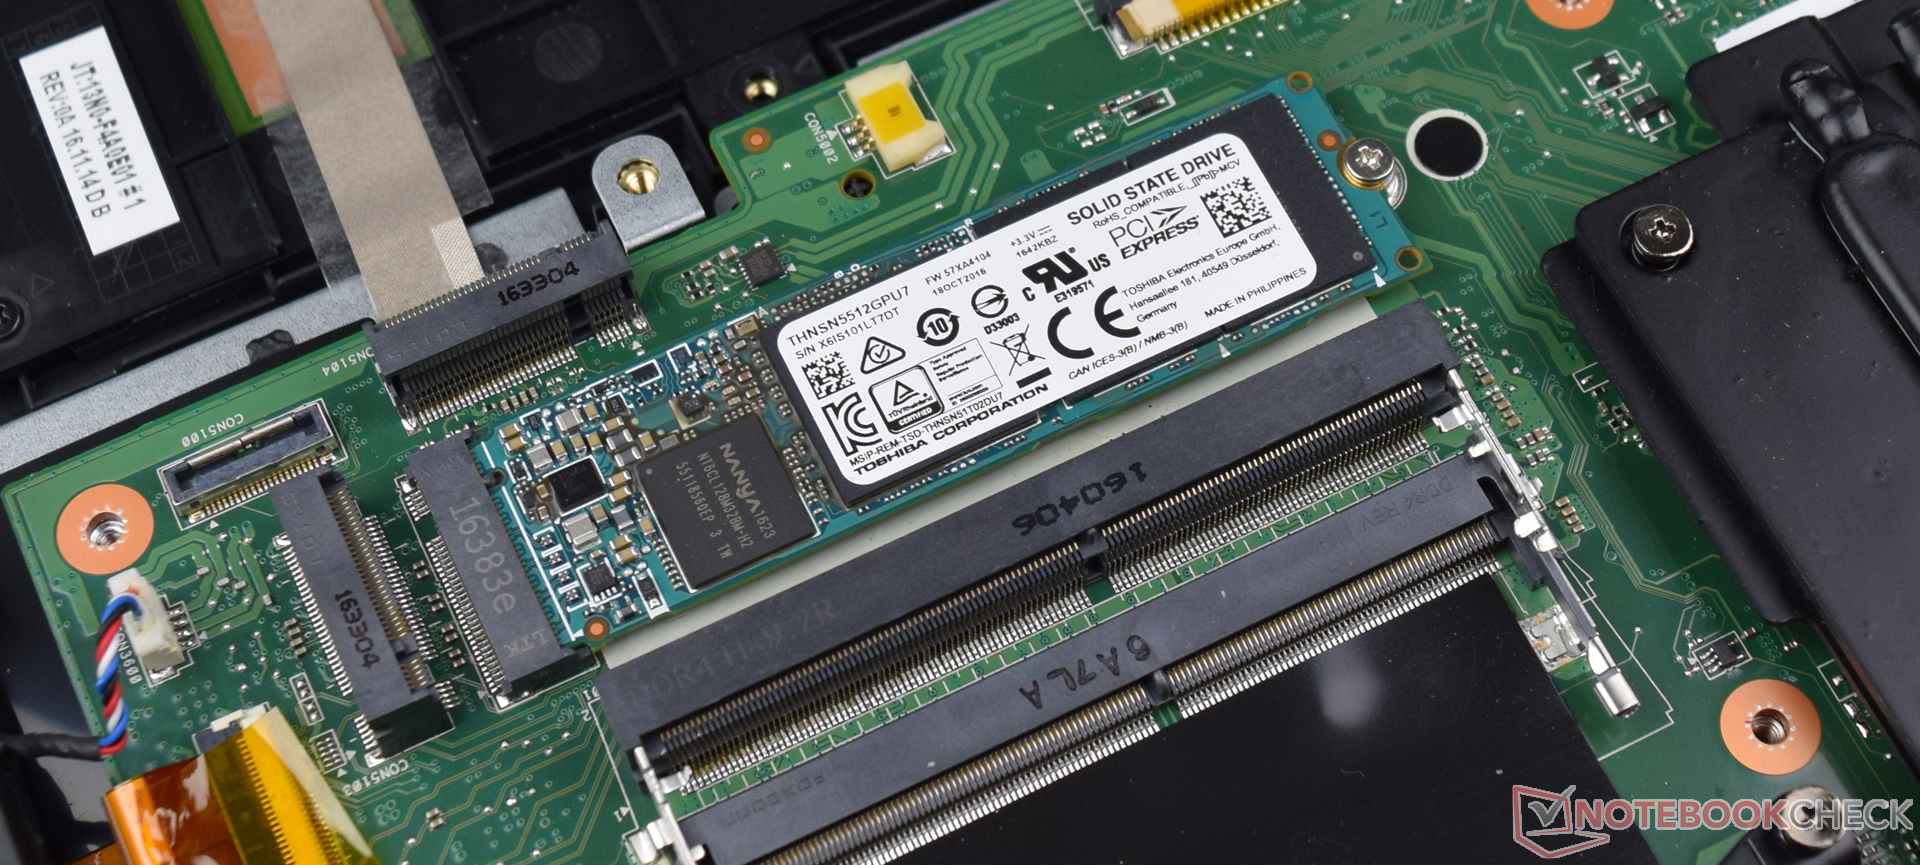
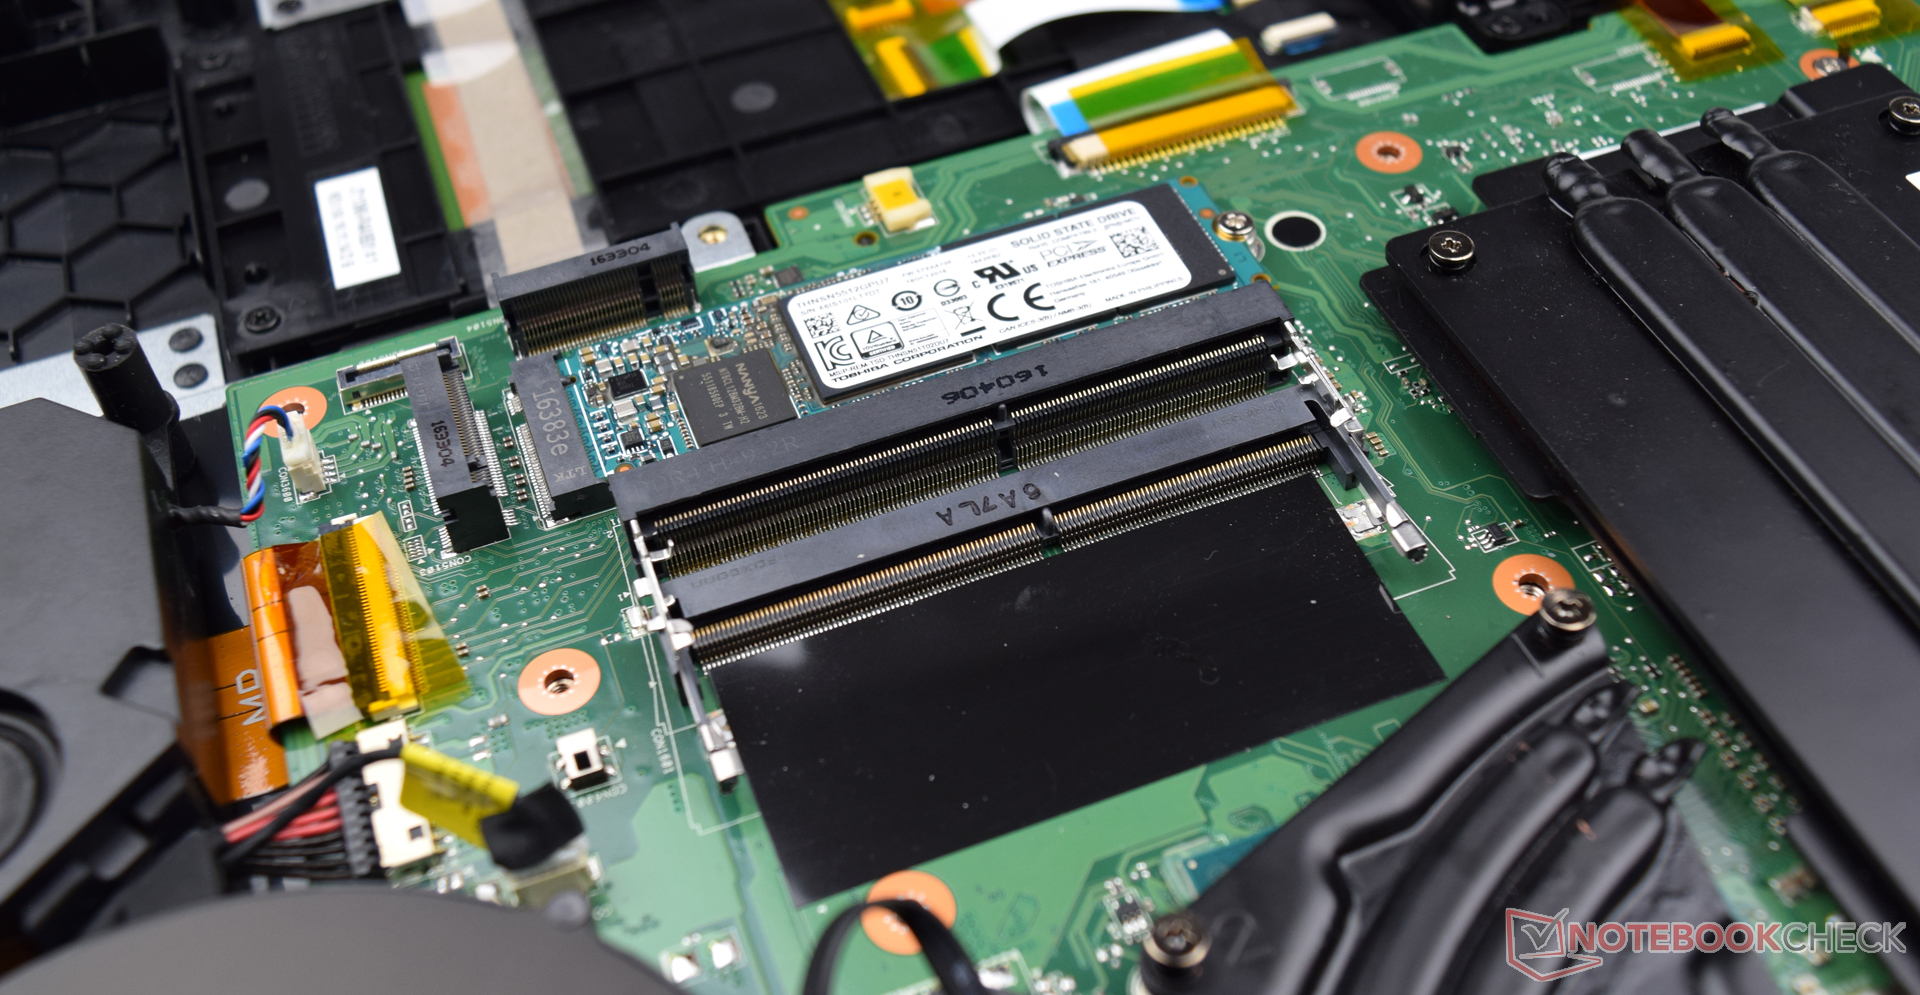
| Acer Predator 17 X GX-792-76DL Toshiba NVMe THNSN5512GPU7 | MSI GT73VR 7RF-296 2x Samsung SM951 MZVPV256HDGL (RAID 0) | Asus G701VIK-BA049T 2x Samsung SM961 MZVPW256HEGL NVMe (RAID 0) | Asus G752VS-XB78K Toshiba NVMe THNSN5512GPU7 | MSI GT72VR 7RE-433 Kingston RBU-SNS8152S3256GG5 | Aorus X7 v6 Toshiba NVMe THNSN5512GPU7 | Acer Predator 17 G9-793-77LG Toshiba NVMe THNSN5256GPU7 | |
|---|---|---|---|---|---|---|---|
| CrystalDiskMark 3.0 | 49% | 55% | 9% | -52% | -1% | ||
| Read Seq (MB/s) | 1494 | 3219 115% | 3487 133% | 1718 15% | 521 -65% | 1499 0% | |
| Write Seq (MB/s) | 1371 | 2572 88% | 2690 96% | 1305 -5% | 311.8 -77% | 1411 3% | |
| Read 512 (MB/s) | 898 | 1776 98% | 1499 67% | 1250 39% | 403.1 -55% | 966 8% | |
| Write 512 (MB/s) | 1273 | 2445 92% | 2493 96% | 1438 13% | 332.3 -74% | 1103 -13% | |
| Read 4k (MB/s) | 43.82 | 51.1 17% | 53.7 23% | 44.42 1% | 33.35 -24% | 44.33 1% | |
| Write 4k (MB/s) | 161.6 | 141.3 -13% | 133.2 -18% | 154.4 -4% | 111.1 -31% | 155.5 -4% | |
| Read 4k QD32 (MB/s) | 669 | 658 -2% | 795 19% | 744 11% | 331.1 -51% | 696 4% | |
| Write 4k QD32 (MB/s) | 552 | 554 0% | 699 27% | 578 5% | 318.3 -42% | 531 -4% |


| 3DMark - 1920x1080 Fire Strike Graphics | |
| Asus G701VIK-BA049T | |
| Acer Predator 17 X GX-792-76DL | |
| MSI GT73VR 7RF-296 | |
| MSI GT72VR 7RE-433 | |
| Aorus X7 v6 | |
| Asus G752VS-XB78K | |
| Acer Predator 17 G9-793-77LG | |
| 3DMark 11 - 1280x720 Performance GPU | |
| Asus G701VIK-BA049T | |
| MSI GT73VR 7RF-296 | |
| Acer Predator 17 X GX-792-76DL | |
| Aorus X7 v6 | |
| MSI GT72VR 7RE-433 | |
| Asus G752VS-XB78K | |
| Acer Predator 17 G9-793-77LG | |
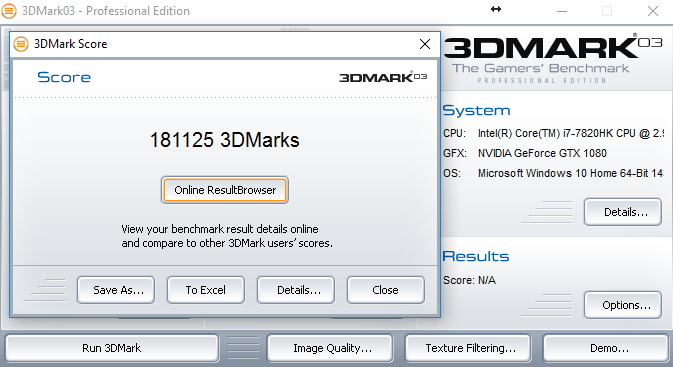
| 3DMark 03 Standard | 181125 puntos | |
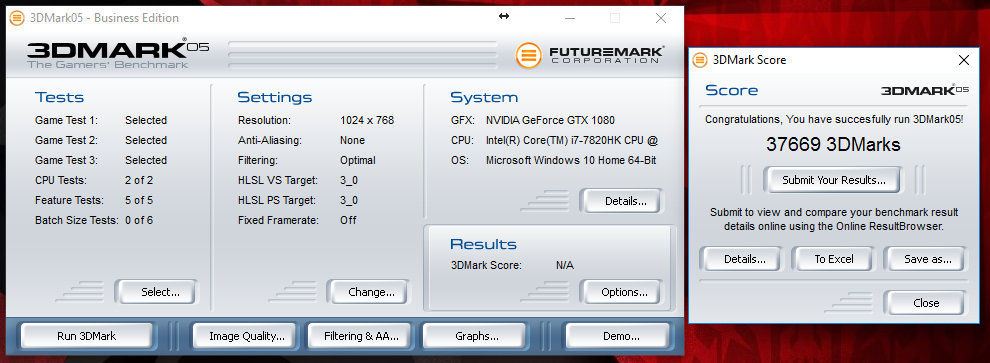
| 3DMark 05 Standard | 37669 puntos | |
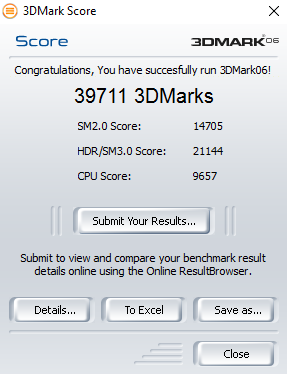
| 3DMark 06 Standard Score | 39711 puntos | |
| 3DMark Vantage P Result | 50346 puntos | |
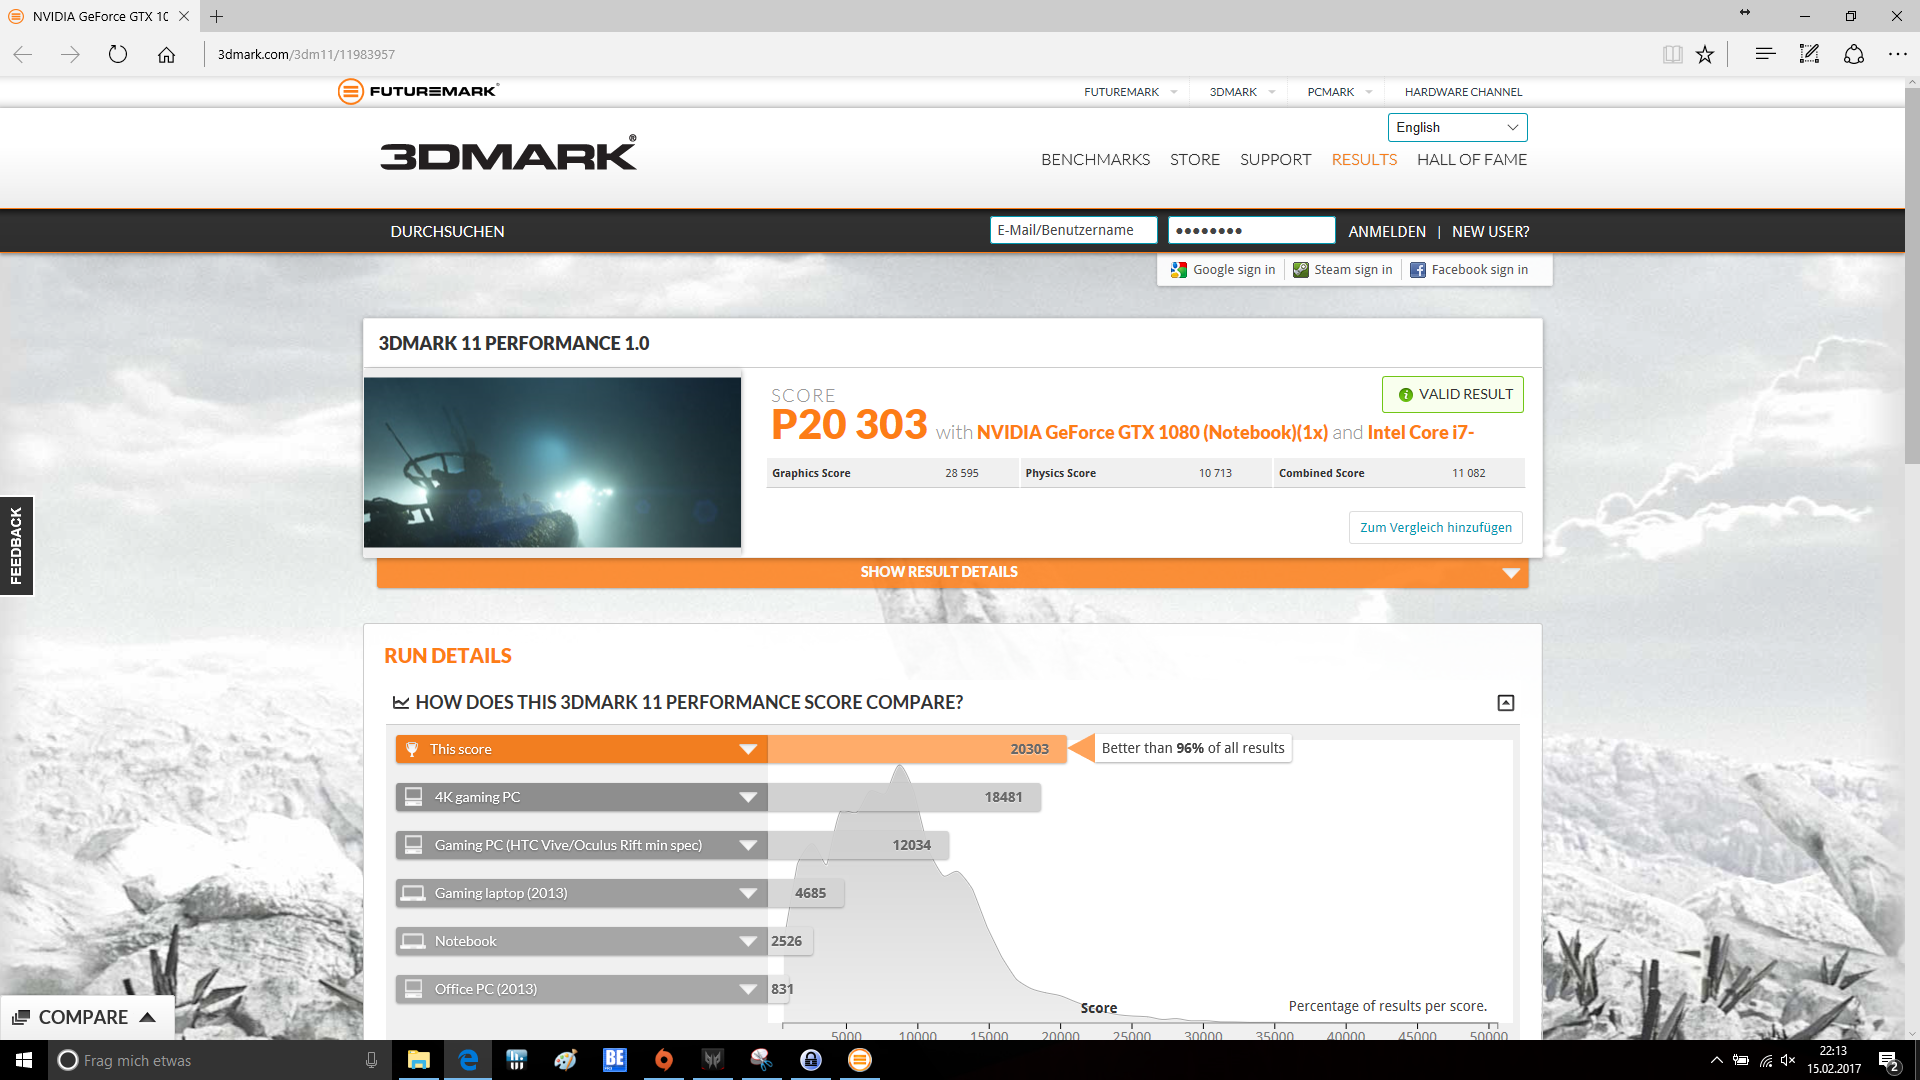
| 3DMark 11 Performance | 20303 puntos | |
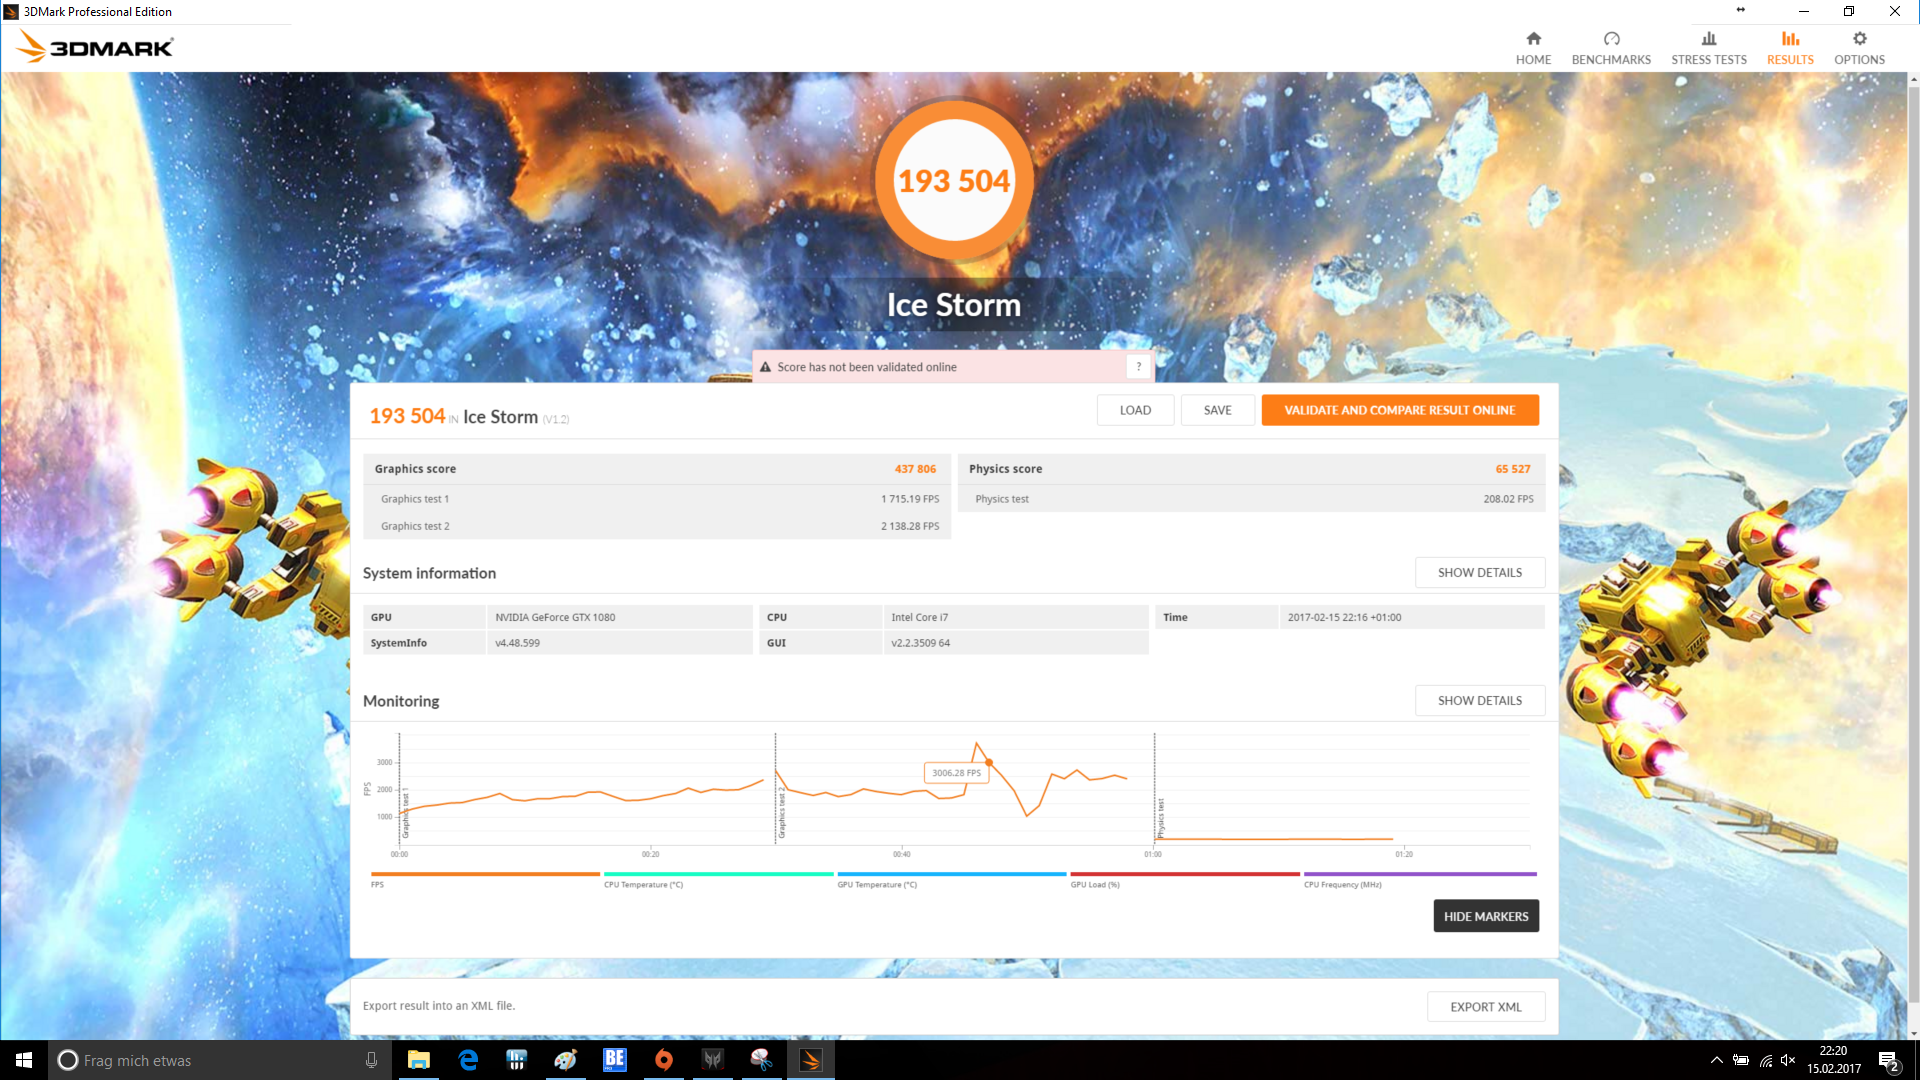
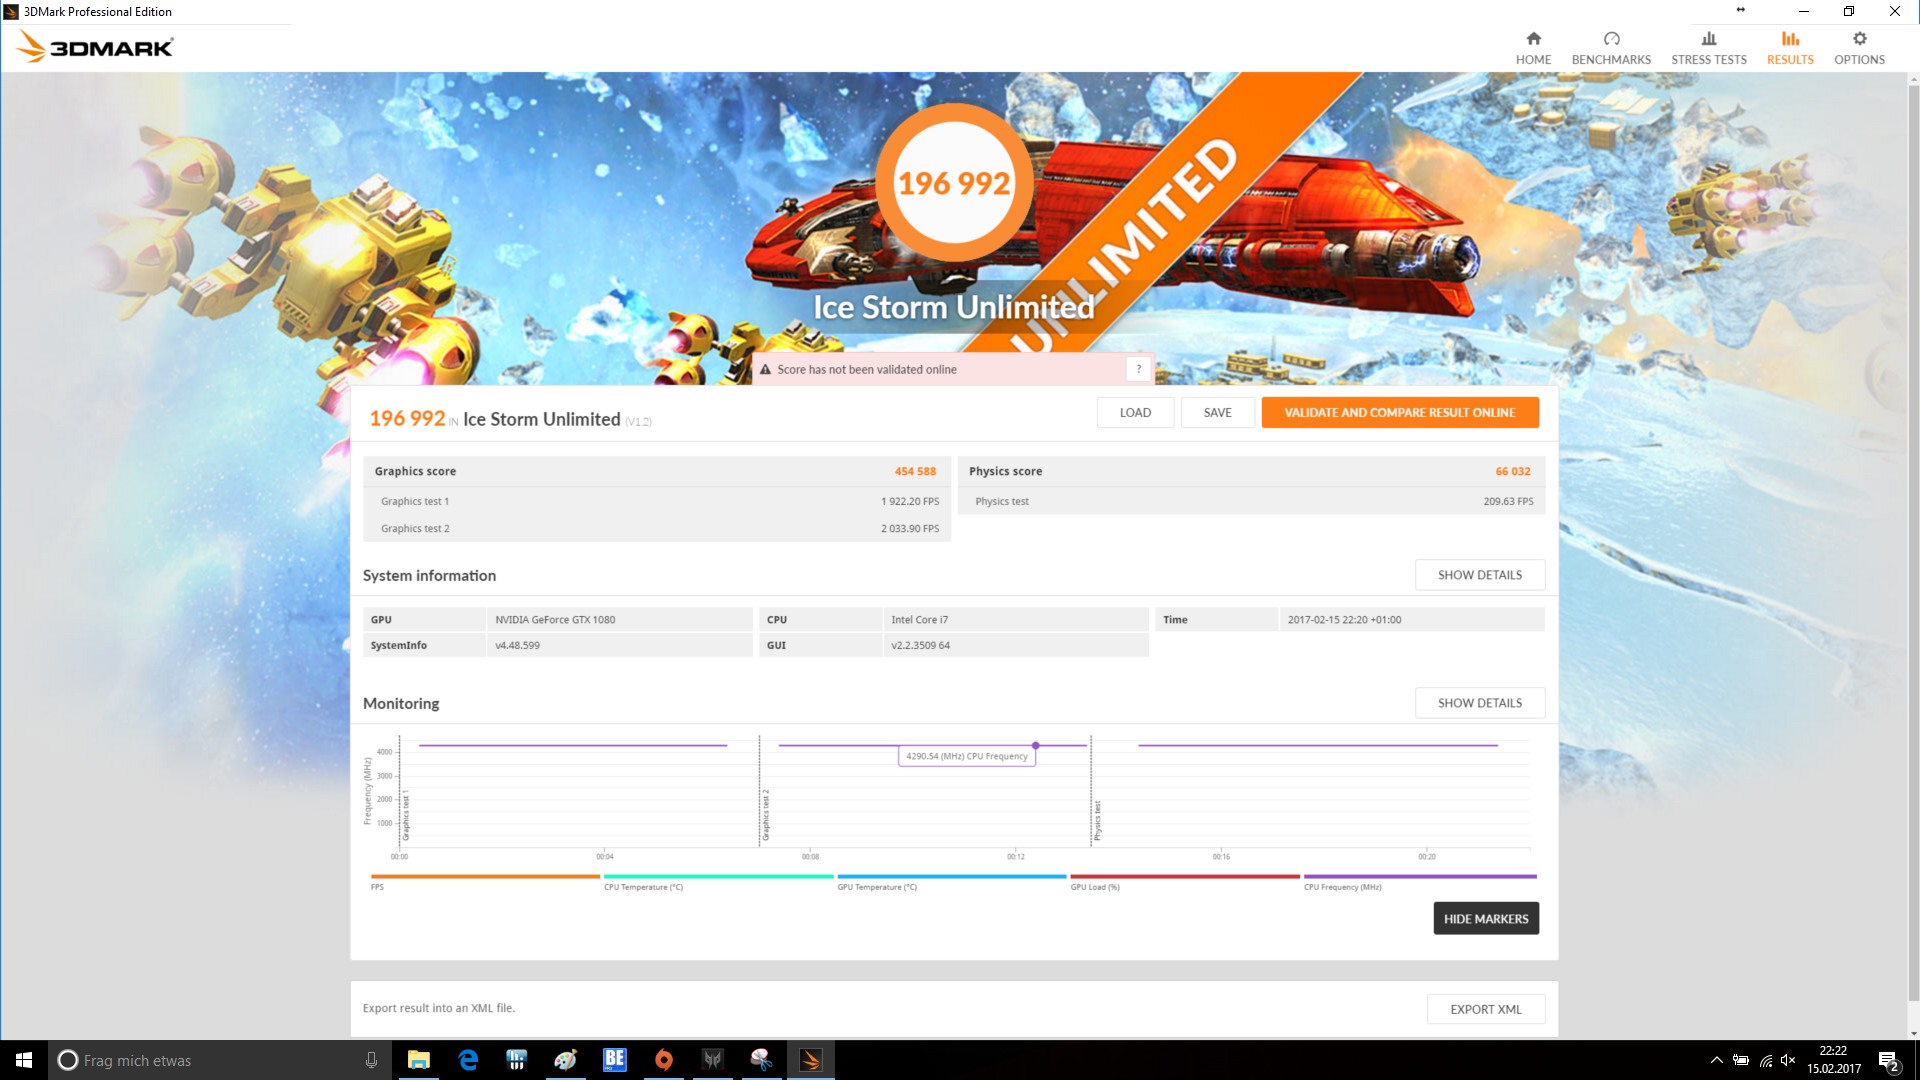
| 3DMark Ice Storm Standard Score | 192504 puntos | |
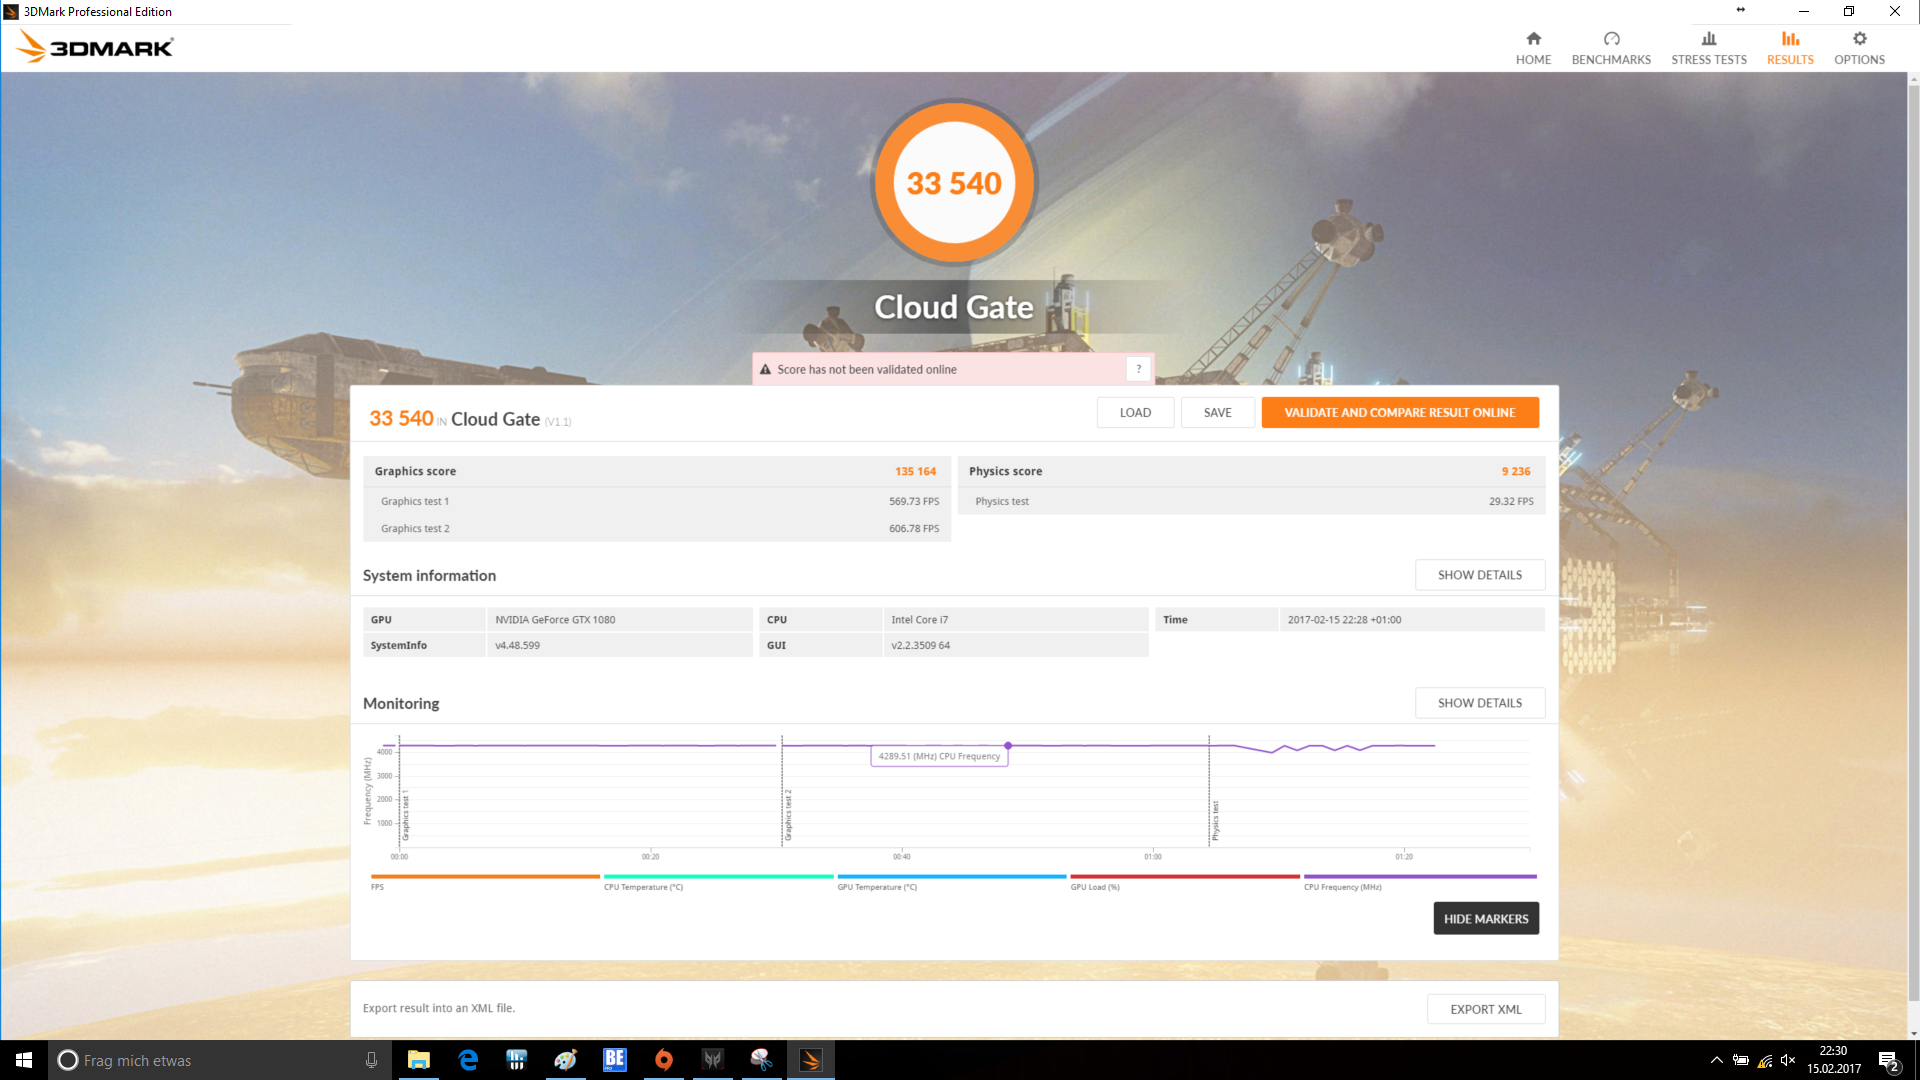
| 3DMark Cloud Gate Standard Score | 33540 puntos | |
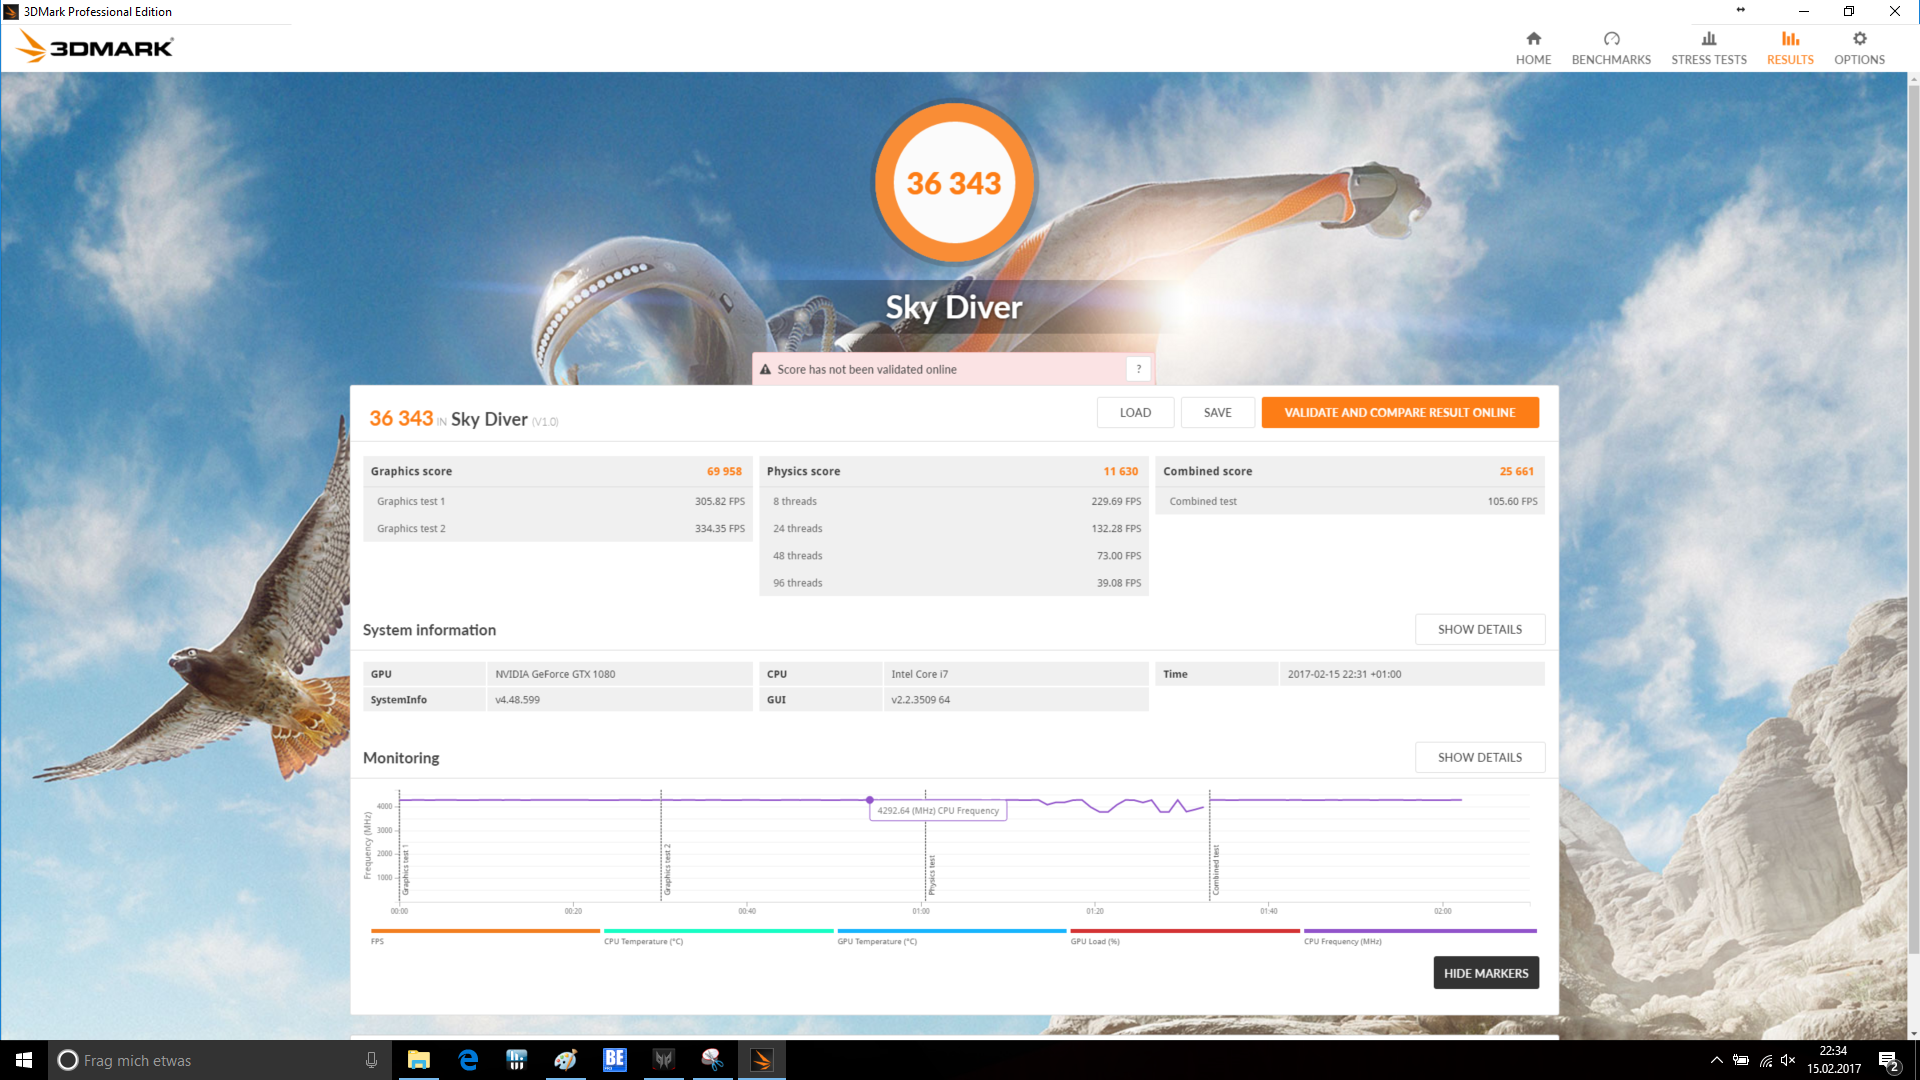
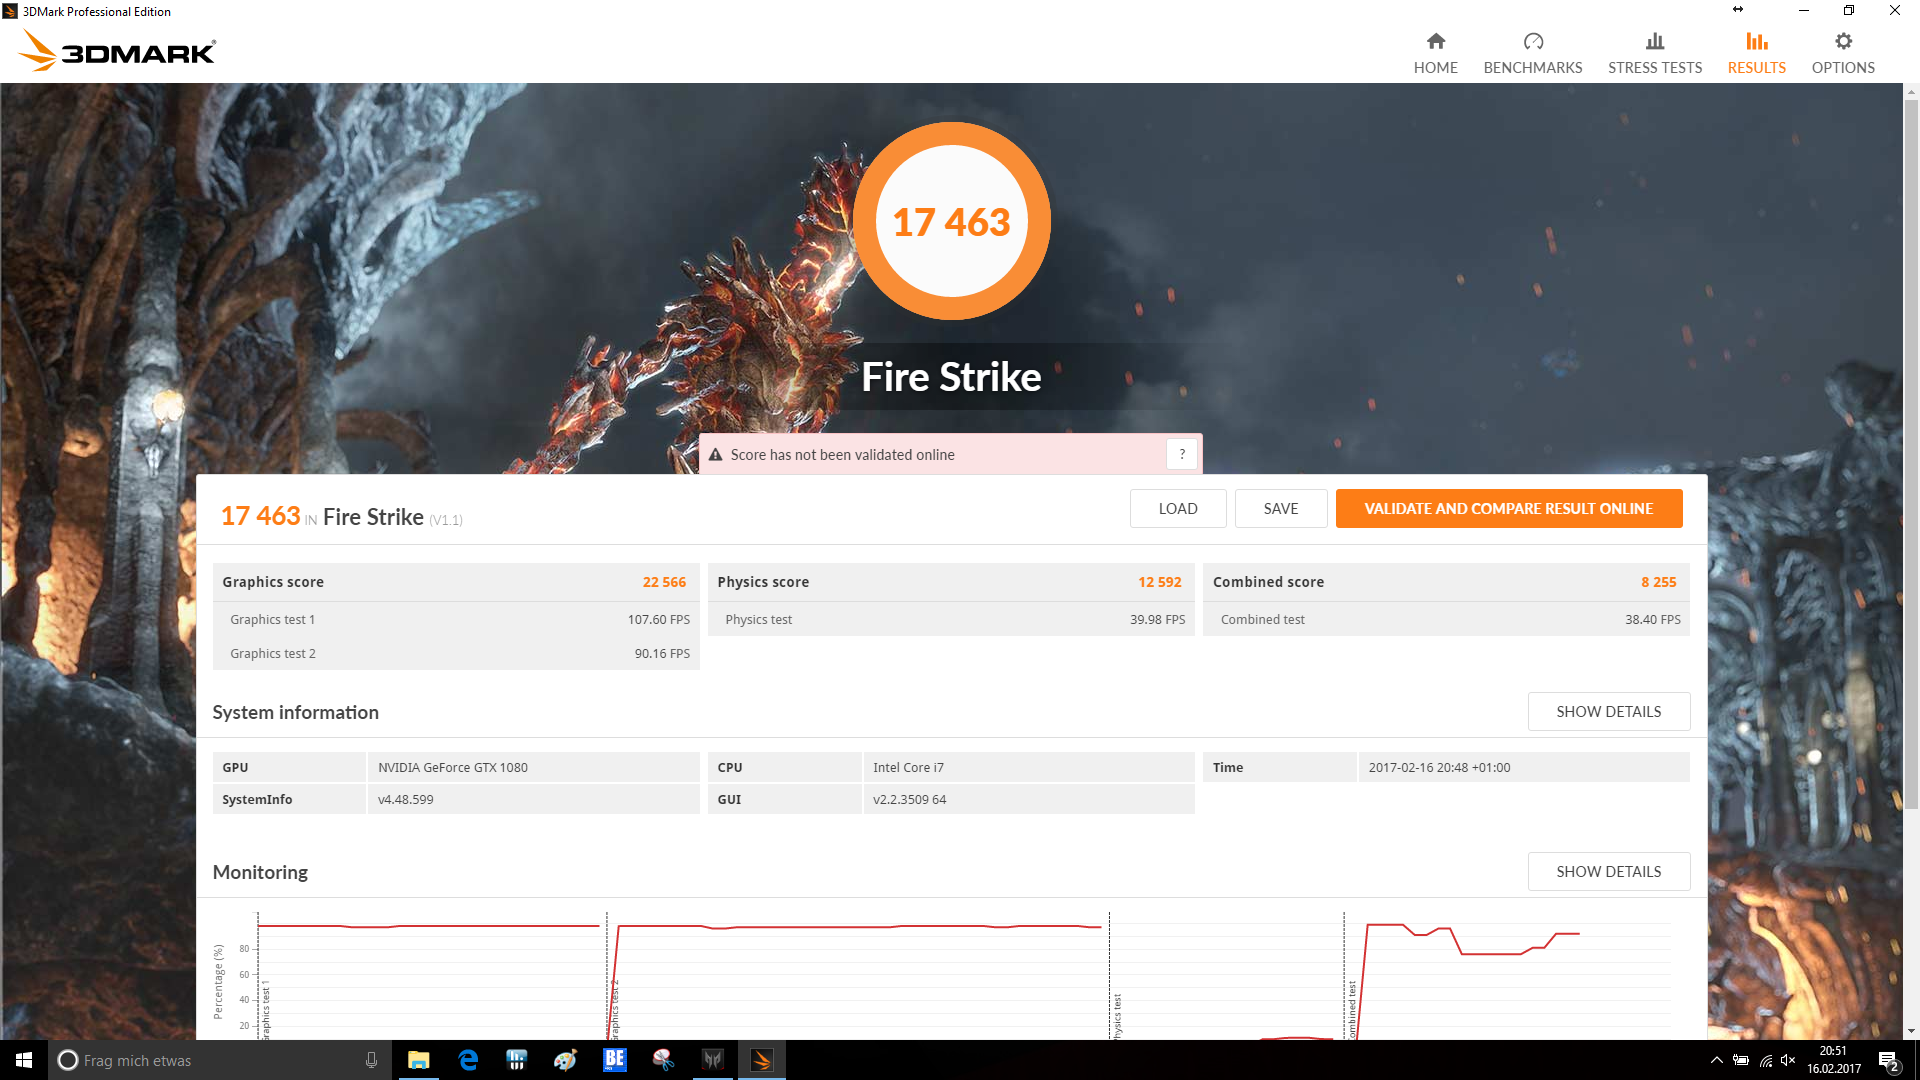
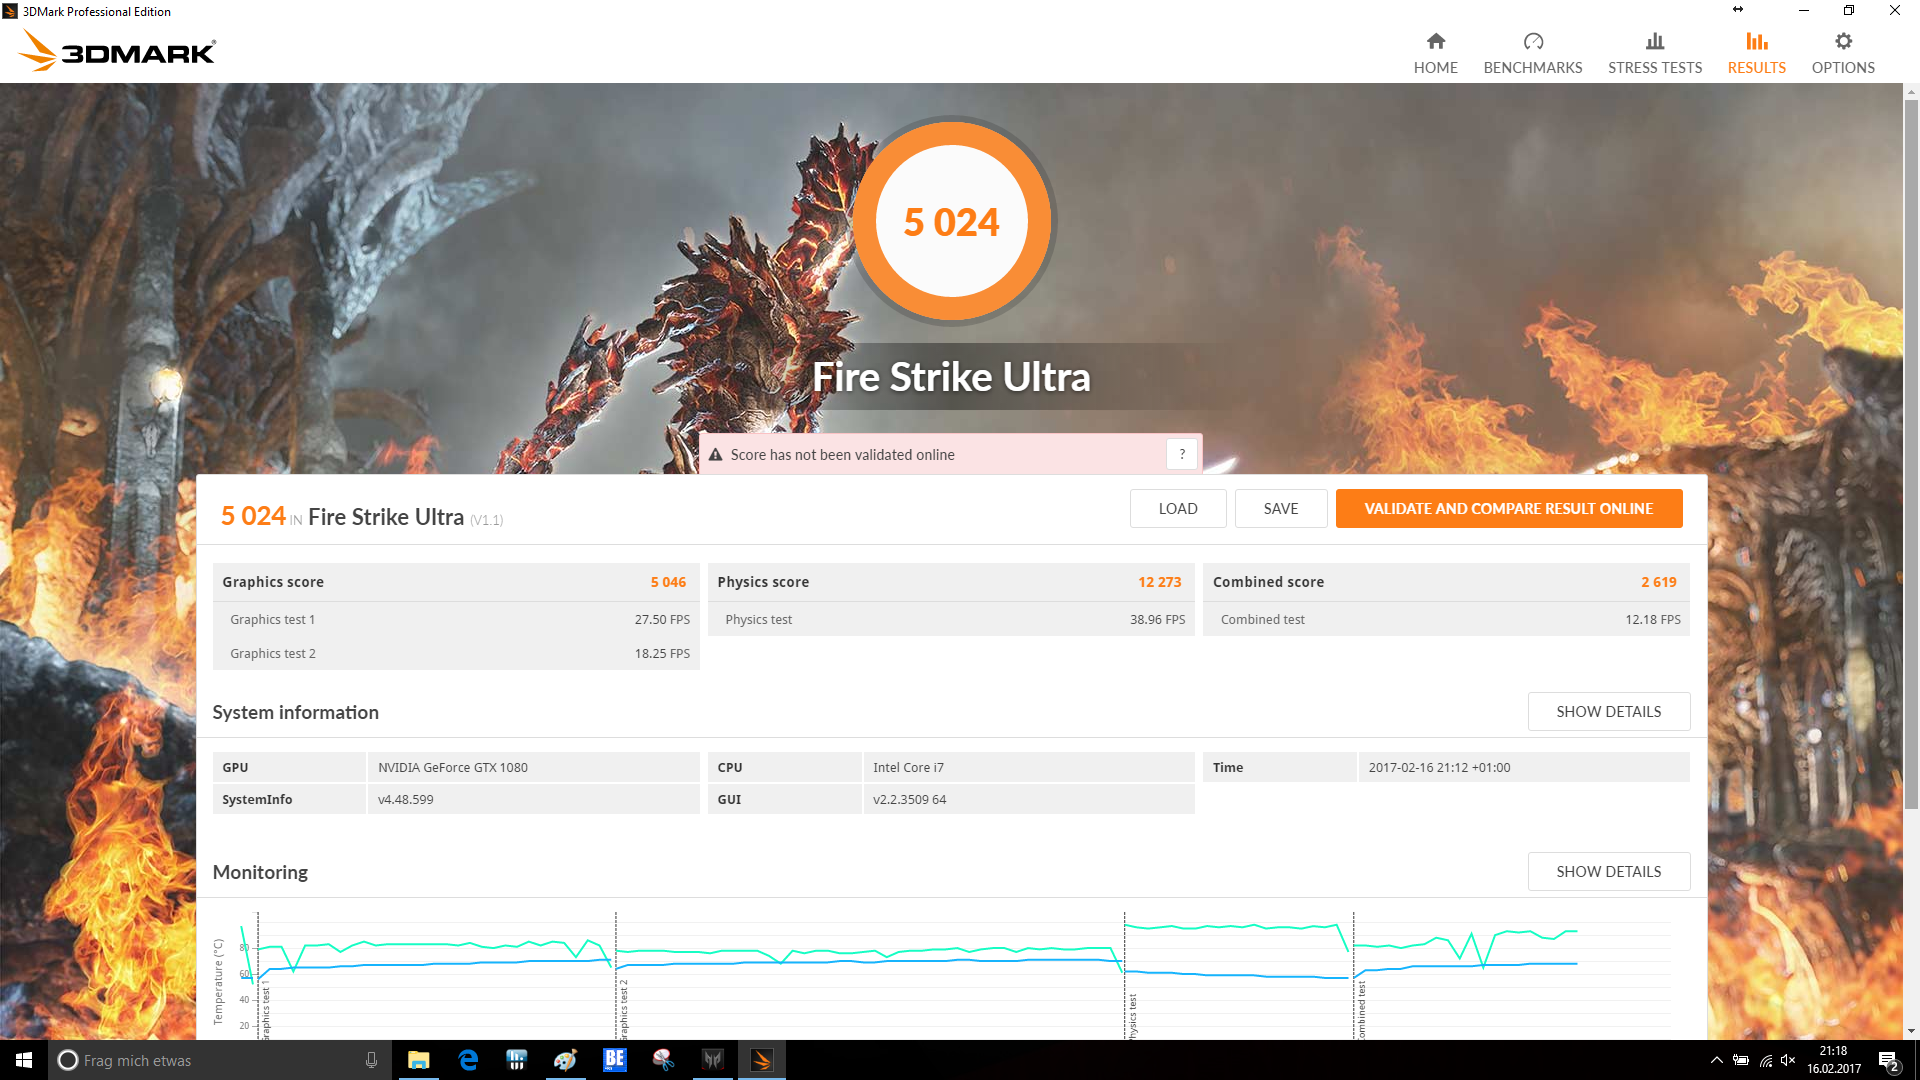
| 3DMark Fire Strike Score | 17463 puntos | |
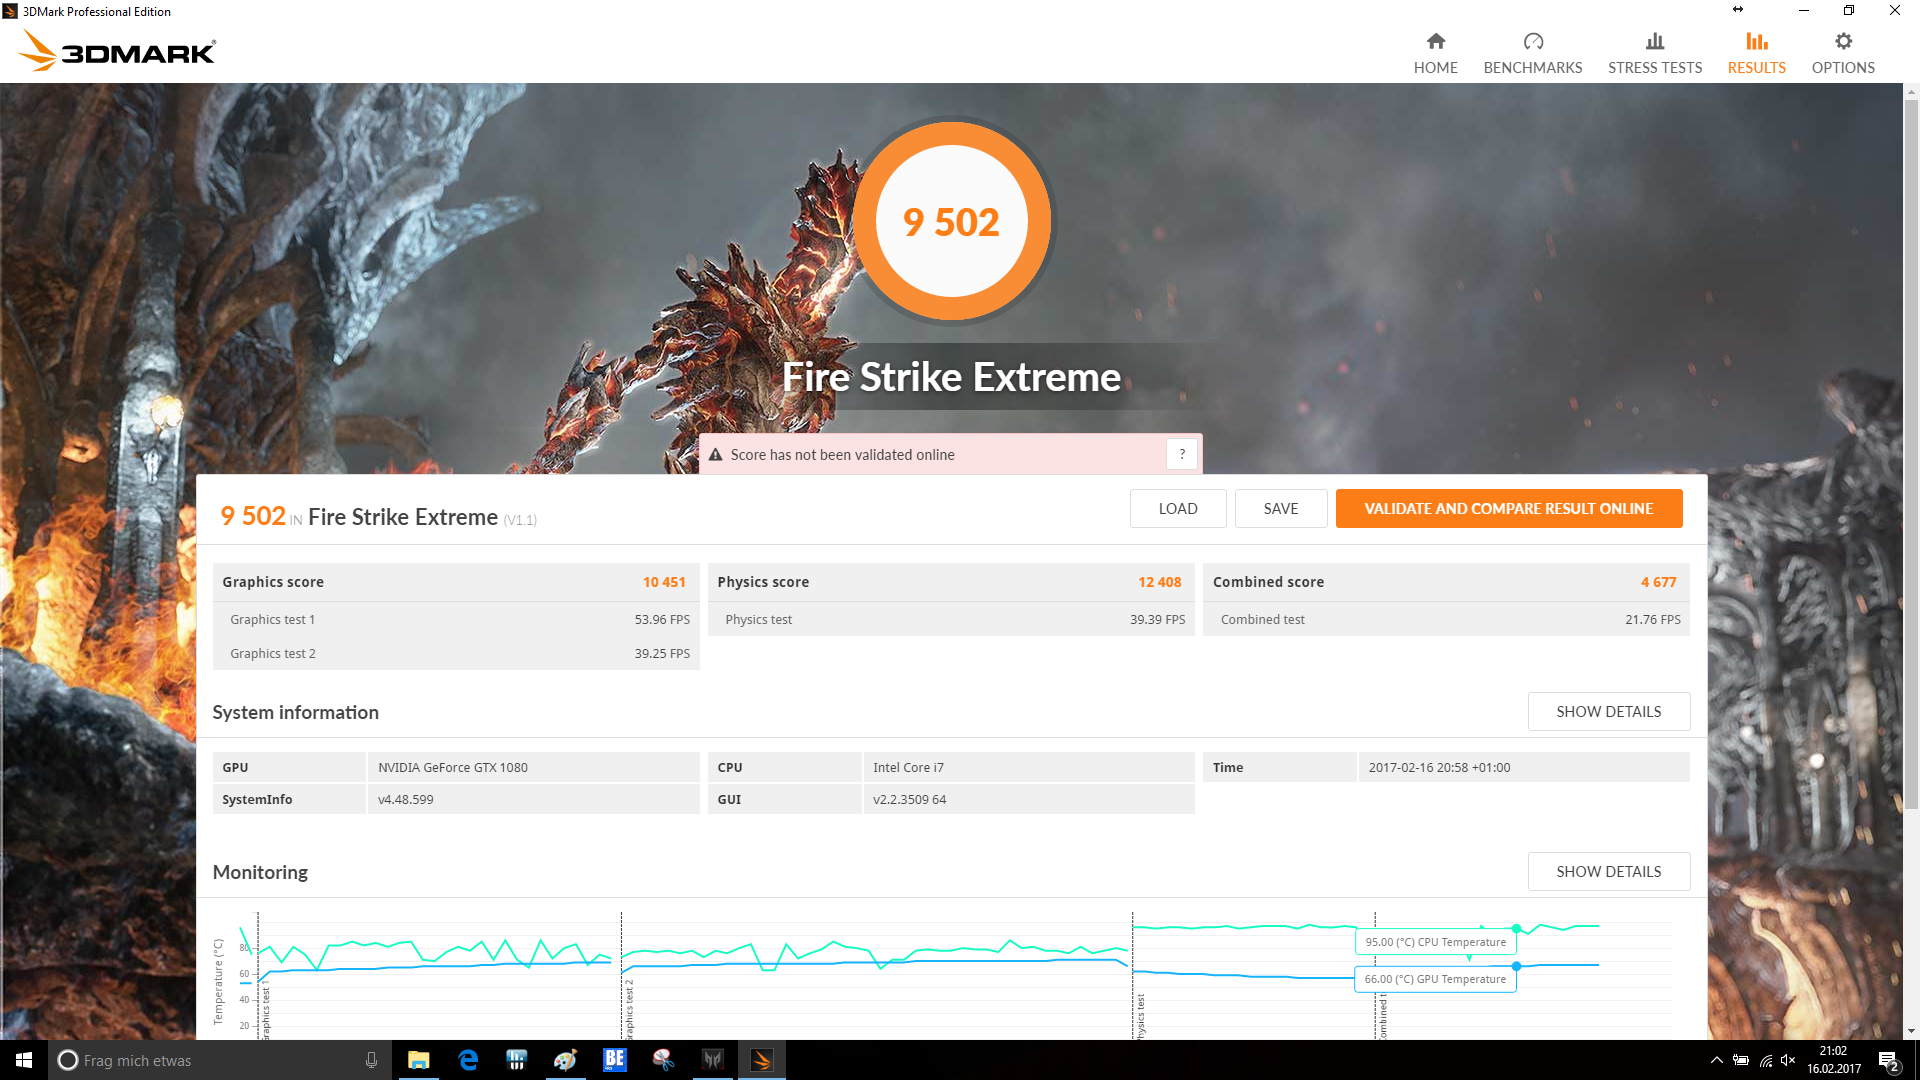
| 3DMark Fire Strike Extreme Score | 9502 puntos | |
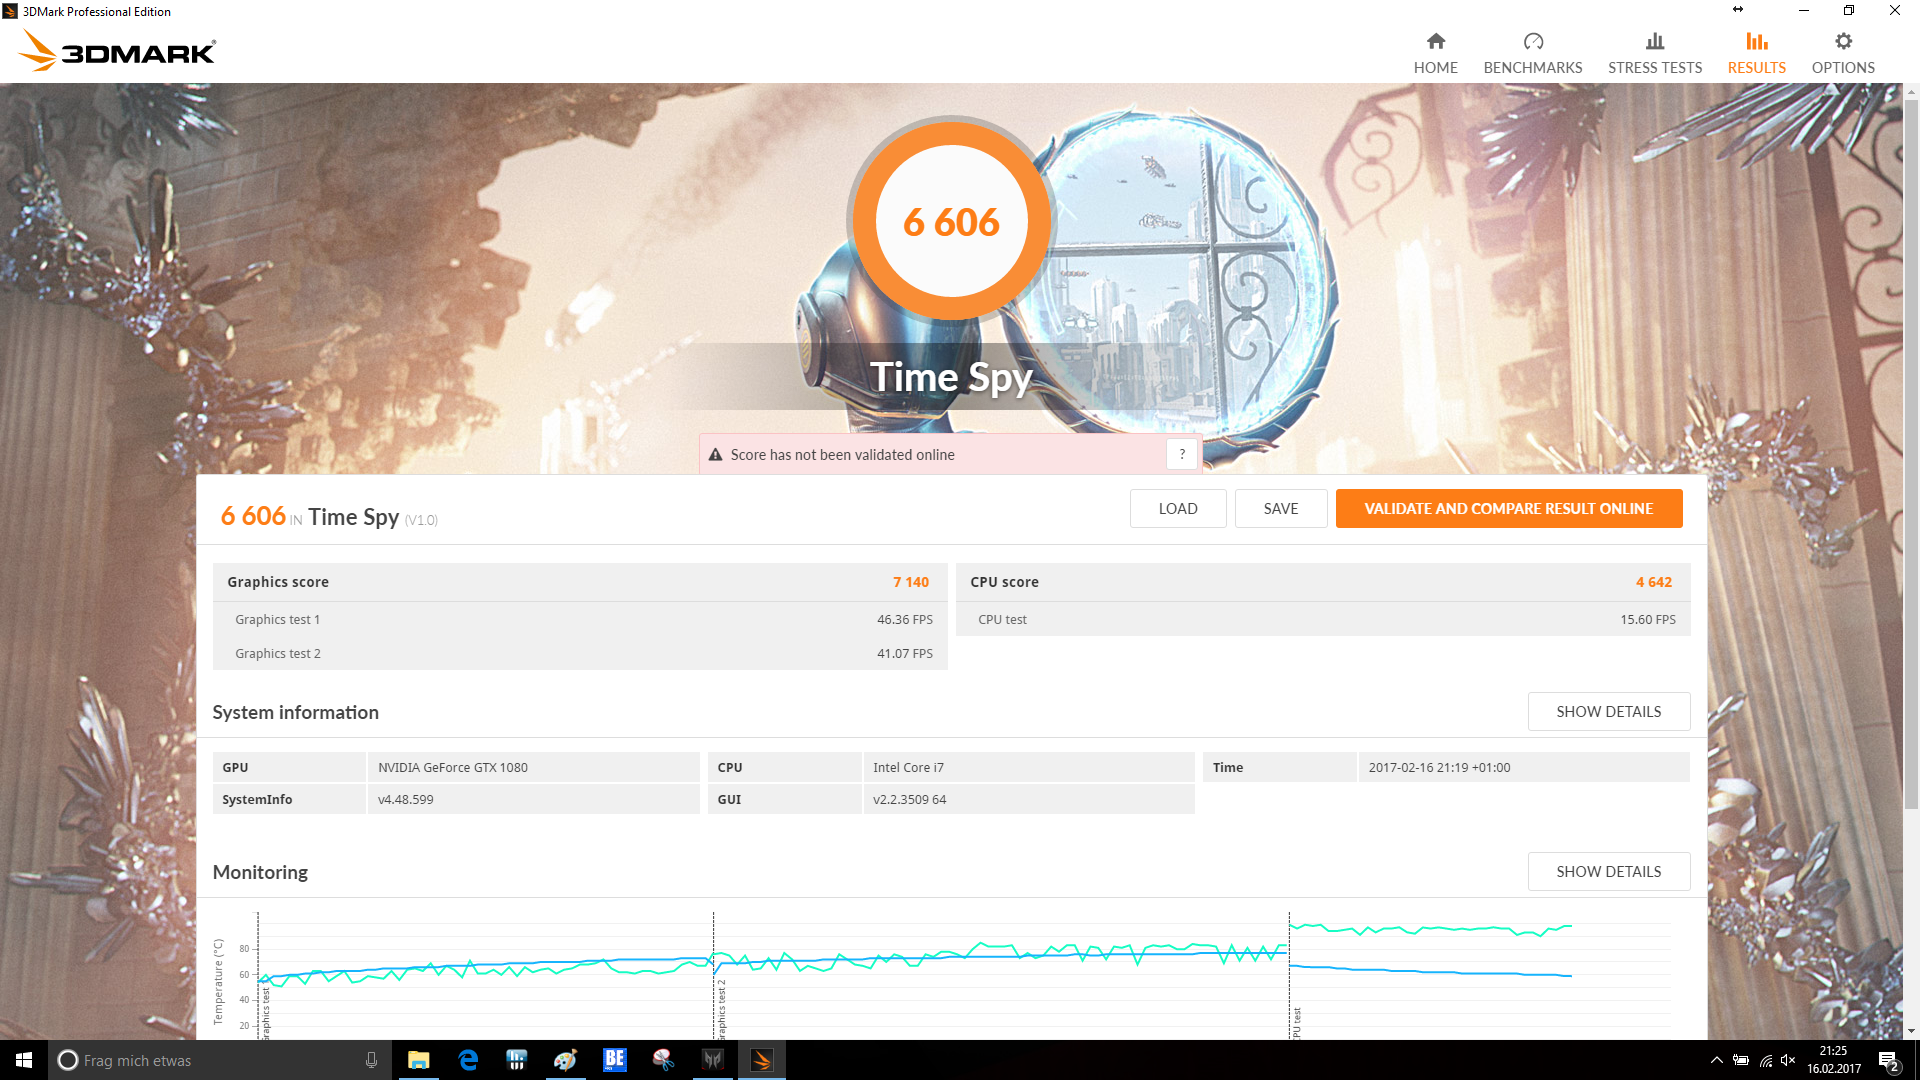
| 3DMark Time Spy Score | 6606 puntos | |
ayuda | ||
| bajo | medio | alto | ultra | 4K | |
|---|---|---|---|---|---|
| BioShock Infinite (2013) | 324.3 | 284.5 | 273.7 | 176.8 | |
| GTA V (2015) | 170.8 | 162.5 | 130.3 | 106.8 | 75.7 |
| The Witcher 3 (2015) | 270.8 | 197.5 | 125.8 | 68.5 | 46.8 |
| Rise of the Tomb Raider (2016) | 260.9 | 218.3 | 153.8 | 126.1 | 61.2 |
| Far Cry Primal (2016) | 157 | 138 | 125 | 107 | 49 |
| The Division (2016) | 258.8 | 201.6 | 122.4 | 97.2 | 48.4 |
| Doom (2016) | 179.9 | 170.2 | 149.1 | 147.8 | 70.3 |
| Deus Ex Mankind Divided (2016) | 145.9 | 136.9 | 98.9 | 54.9 | 34.4 |
| Resident Evil 7 (2017) | 462.9 | 353.4 | 269.3 | 234.1 | 78.5 |
| For Honor (2017) | 265.6 | 190.1 | 177.5 | 134.9 | 59.4 |
Ruido
| Ocioso |
| 33 / 35 / 37 dB(A) |
| HDD |
| 33 dB(A) |
| Carga |
| 40 / 50 dB(A) |
 | ||
30 dB silencioso 40 dB(A) audible 50 dB(A) ruidosamente alto |
||
min: | ||
| Acer Predator 17 X GX-792-76DL i7-7820HK, GeForce GTX 1080 Mobile | MSI GT73VR 7RF-296 i7-7820HK, GeForce GTX 1080 Mobile | Asus G701VIK-BA049T i7-7820HK, GeForce GTX 1080 Mobile | Asus G752VS-XB78K 6820HK, GeForce GTX 1070 Mobile | MSI GT72VR 7RE-433 i7-7700HQ, GeForce GTX 1070 Mobile | Aorus X7 v6 6820HK, GeForce GTX 1070 Mobile | Acer Predator 17 G9-793-77LG 6700HQ, GeForce GTX 1070 Mobile | |
|---|---|---|---|---|---|---|---|
| Noise | -2% | -1% | 5% | 2% | -4% | -3% | |
| apagado / medio ambiente * (dB) | 30 | 30 -0% | 30 -0% | 30 -0% | 31 -3% | 30 -0% | 31 -3% |
| Idle Minimum * (dB) | 33 | 34 -3% | 30 9% | 31 6% | 34 -3% | 33 -0% | 33 -0% |
| Idle Average * (dB) | 35 | 35 -0% | 31 11% | 32 9% | 35 -0% | 35 -0% | 34 3% |
| Idle Maximum * (dB) | 37 | 37 -0% | 36 3% | 33 11% | 37 -0% | 40 -8% | 40 -8% |
| Load Average * (dB) | 40 | 39 2% | 47 -18% | 40 -0% | 37 7% | 43 -8% | 44 -10% |
| Load Maximum * (dB) | 50 | 56 -12% | 56 -12% | 47 6% | 44 12% | 54 -8% | 50 -0% |
* ... más pequeño es mejor

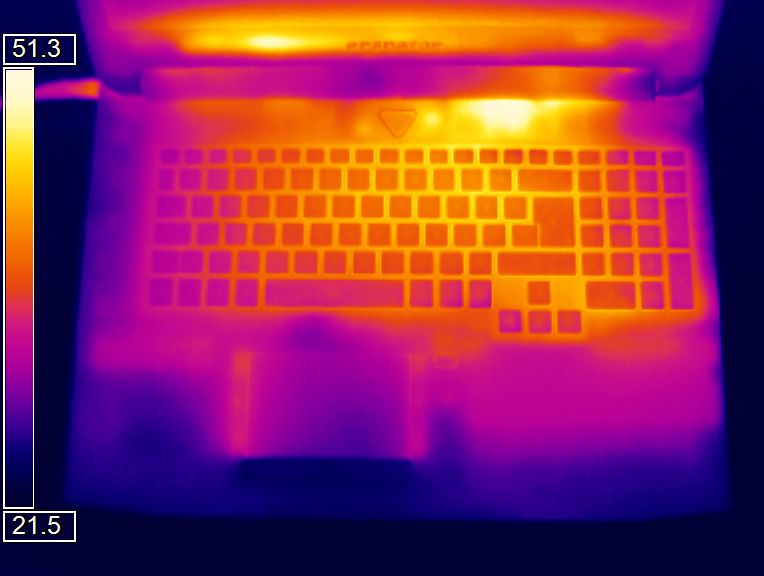
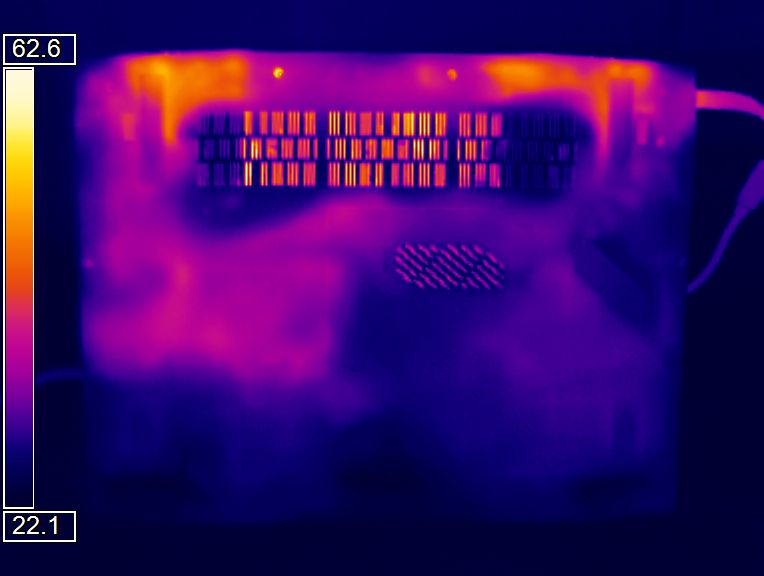
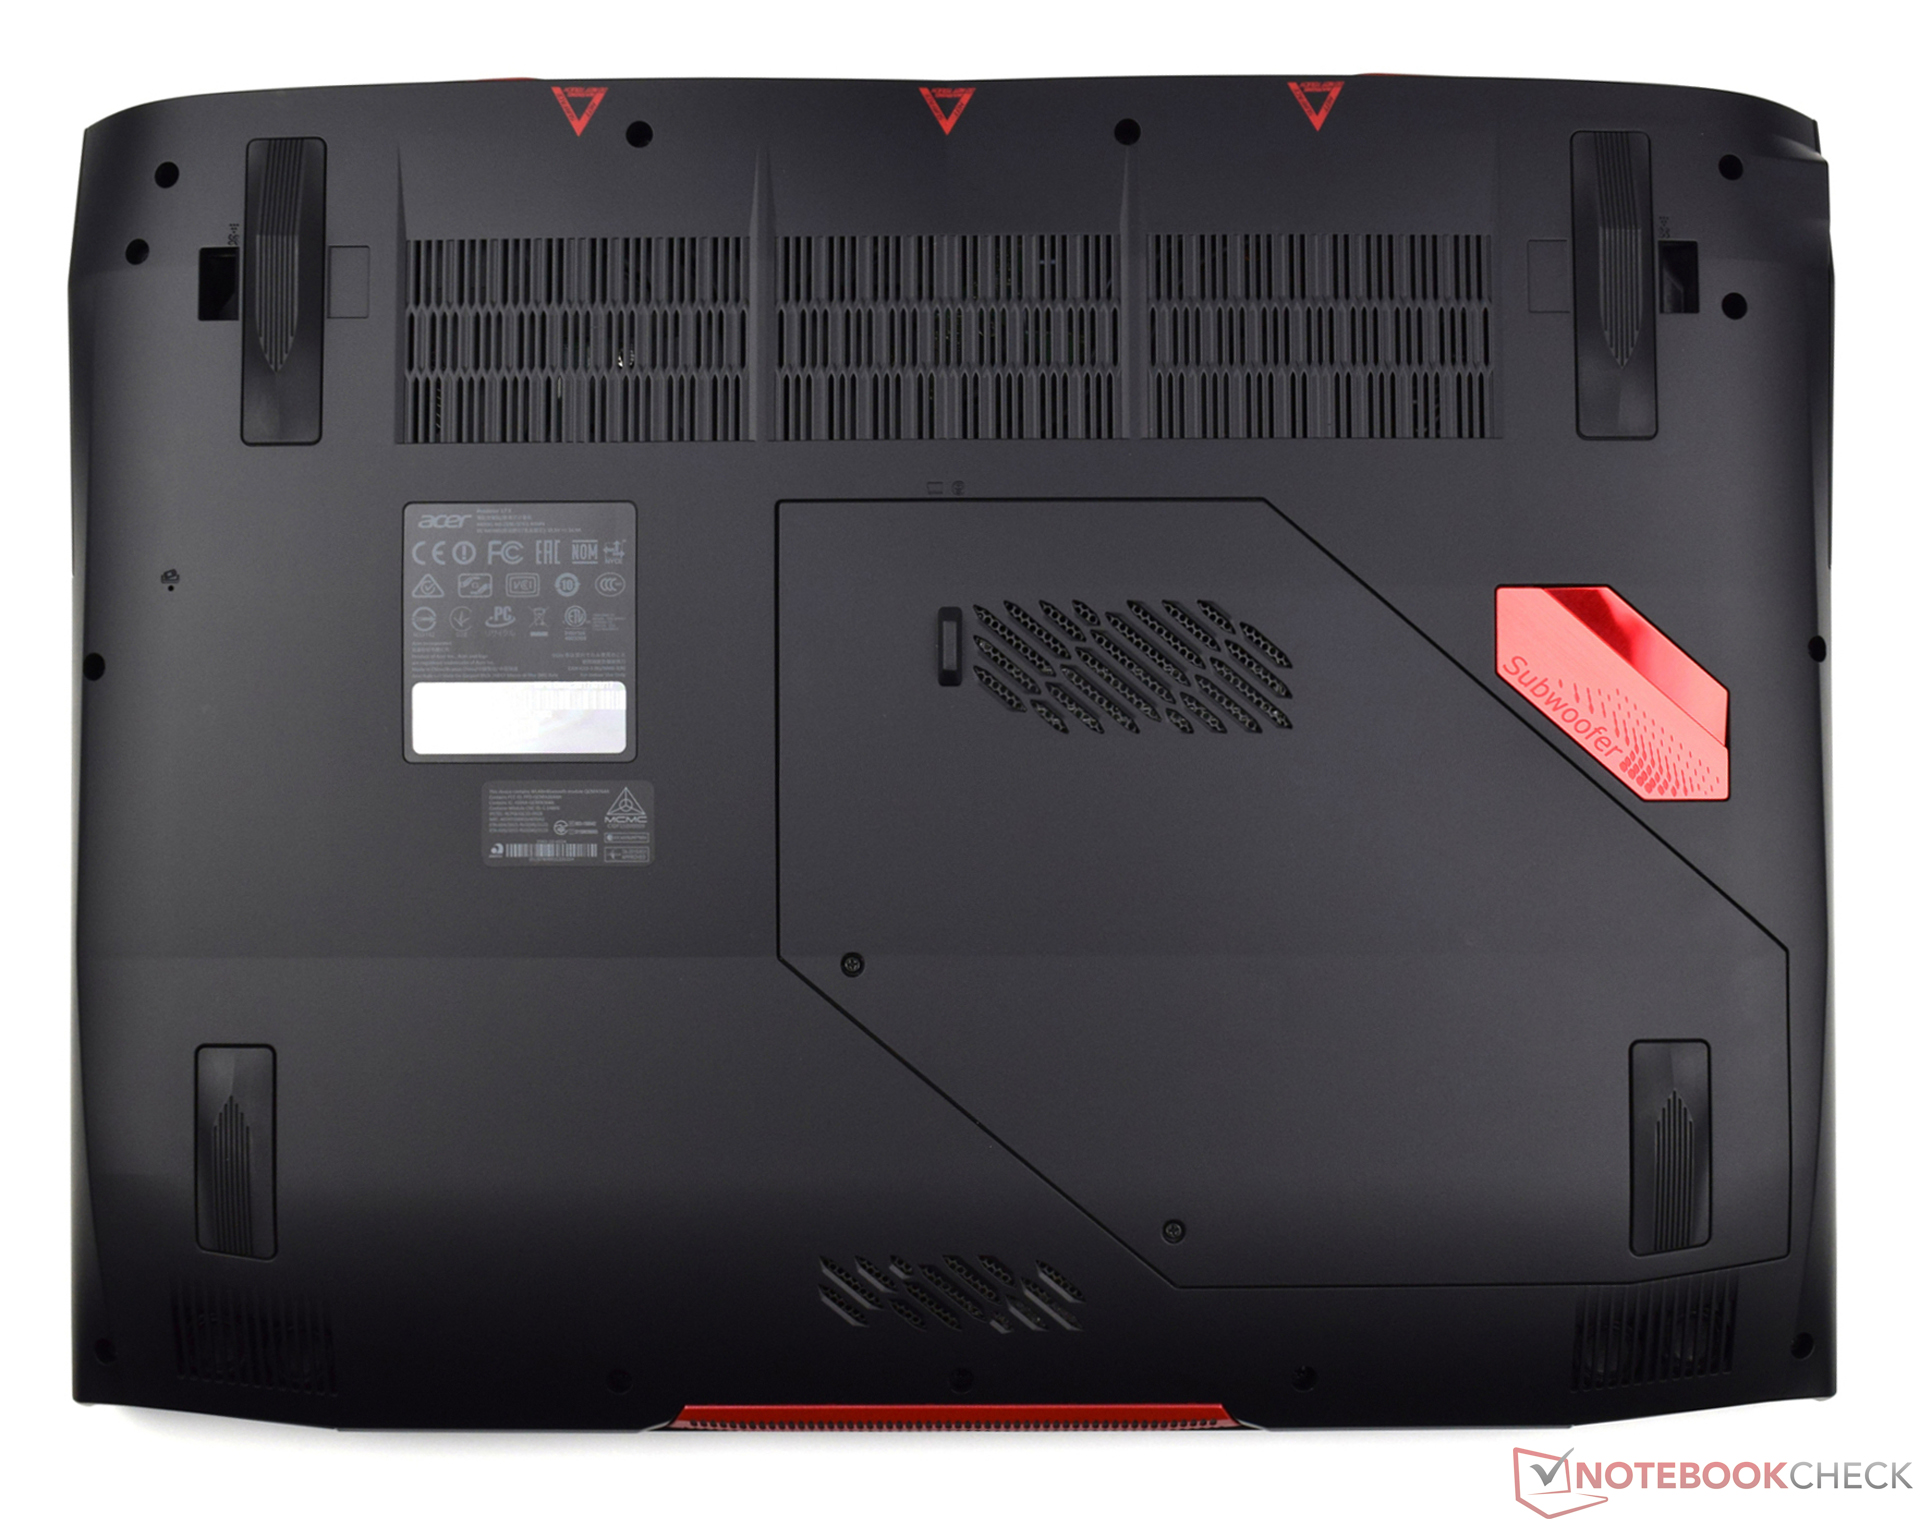
(±) La temperatura máxima en la parte superior es de 44.2 °C / 112 F, frente a la media de 40.4 °C / 105 F, que oscila entre 21.2 y 68.8 °C para la clase Gaming.
(±) El fondo se calienta hasta un máximo de 43 °C / 109 F, frente a la media de 43.2 °C / 110 F
(+) En reposo, la temperatura media de la parte superior es de 29.9 °C / 86# F, frente a la media del dispositivo de 33.9 °C / 93 F.
(+) El reposamanos y el panel táctil están a una temperatura inferior a la de la piel, con un máximo de 31.9 °C / 89.4 F y, por tanto, son fríos al tacto.
(-) La temperatura media de la zona del reposamanos de dispositivos similares fue de 28.8 °C / 83.8 F (-3.1 °C / -5.6 F).
| Acer Predator 17 X GX-792-76DL i7-7820HK, GeForce GTX 1080 Mobile | MSI GT73VR 7RF-296 i7-7820HK, GeForce GTX 1080 Mobile | Asus G701VIK-BA049T i7-7820HK, GeForce GTX 1080 Mobile | Asus G752VS-XB78K 6820HK, GeForce GTX 1070 Mobile | MSI GT72VR 7RE-433 i7-7700HQ, GeForce GTX 1070 Mobile | Aorus X7 v6 6820HK, GeForce GTX 1070 Mobile | Acer Predator 17 G9-793-77LG 6700HQ, GeForce GTX 1070 Mobile | |
|---|---|---|---|---|---|---|---|
| Heat | 8% | 0% | 5% | 8% | -3% | 3% | |
| Maximum Upper Side * (°C) | 44.2 | 39.8 10% | 50.9 -15% | 42.9 3% | 41.5 6% | 47.5 -7% | 42.6 4% |
| Maximum Bottom * (°C) | 43 | 47.8 -11% | 44.6 -4% | 41.5 3% | 50.6 -18% | 54.5 -27% | 44.9 -4% |
| Idle Upper Side * (°C) | 32.4 | 27.1 16% | 29.9 8% | 31.6 2% | 26.4 19% | 28.6 12% | 33.1 -2% |
| Idle Bottom * (°C) | 32.8 | 27.4 16% | 28.8 12% | 29.5 10% | 25.4 23% | 28.8 12% | 28.9 12% |
* ... más pequeño es mejor
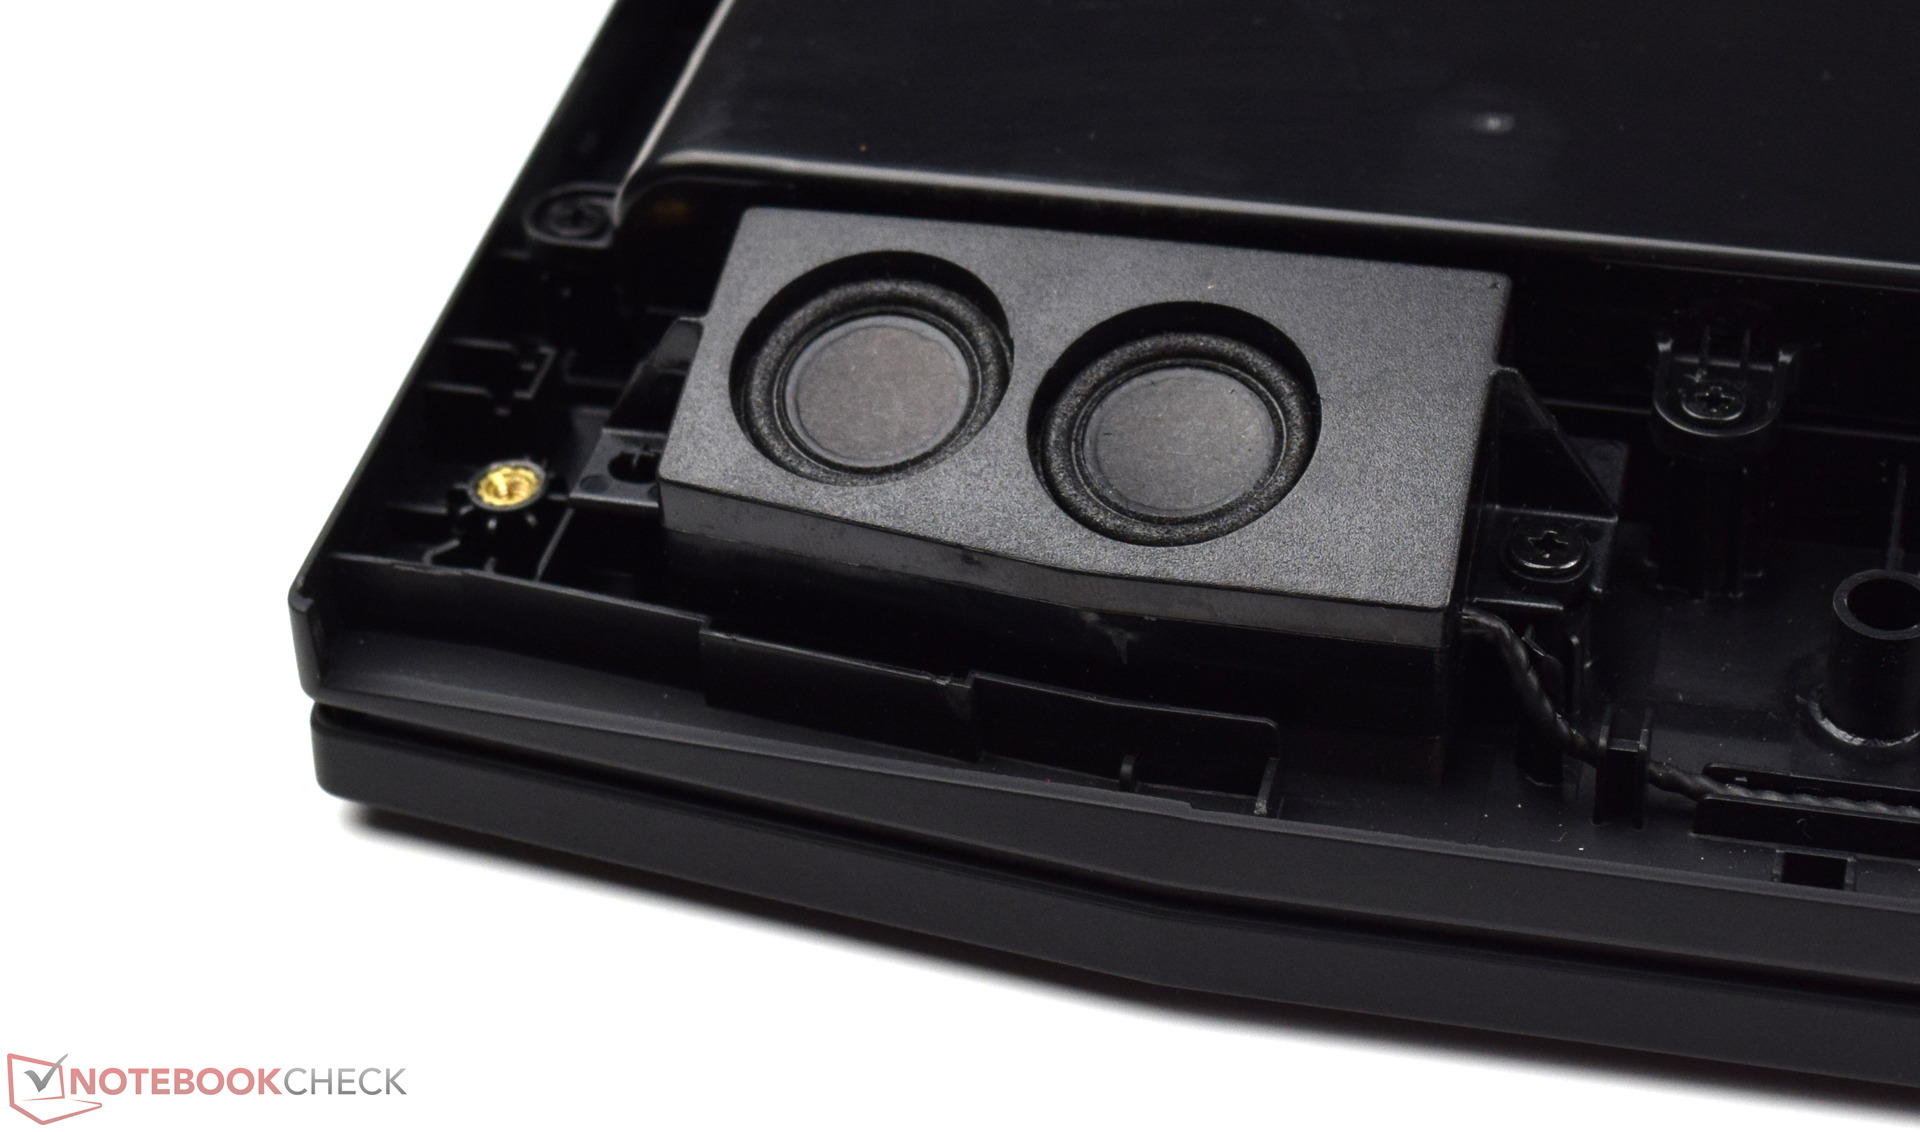
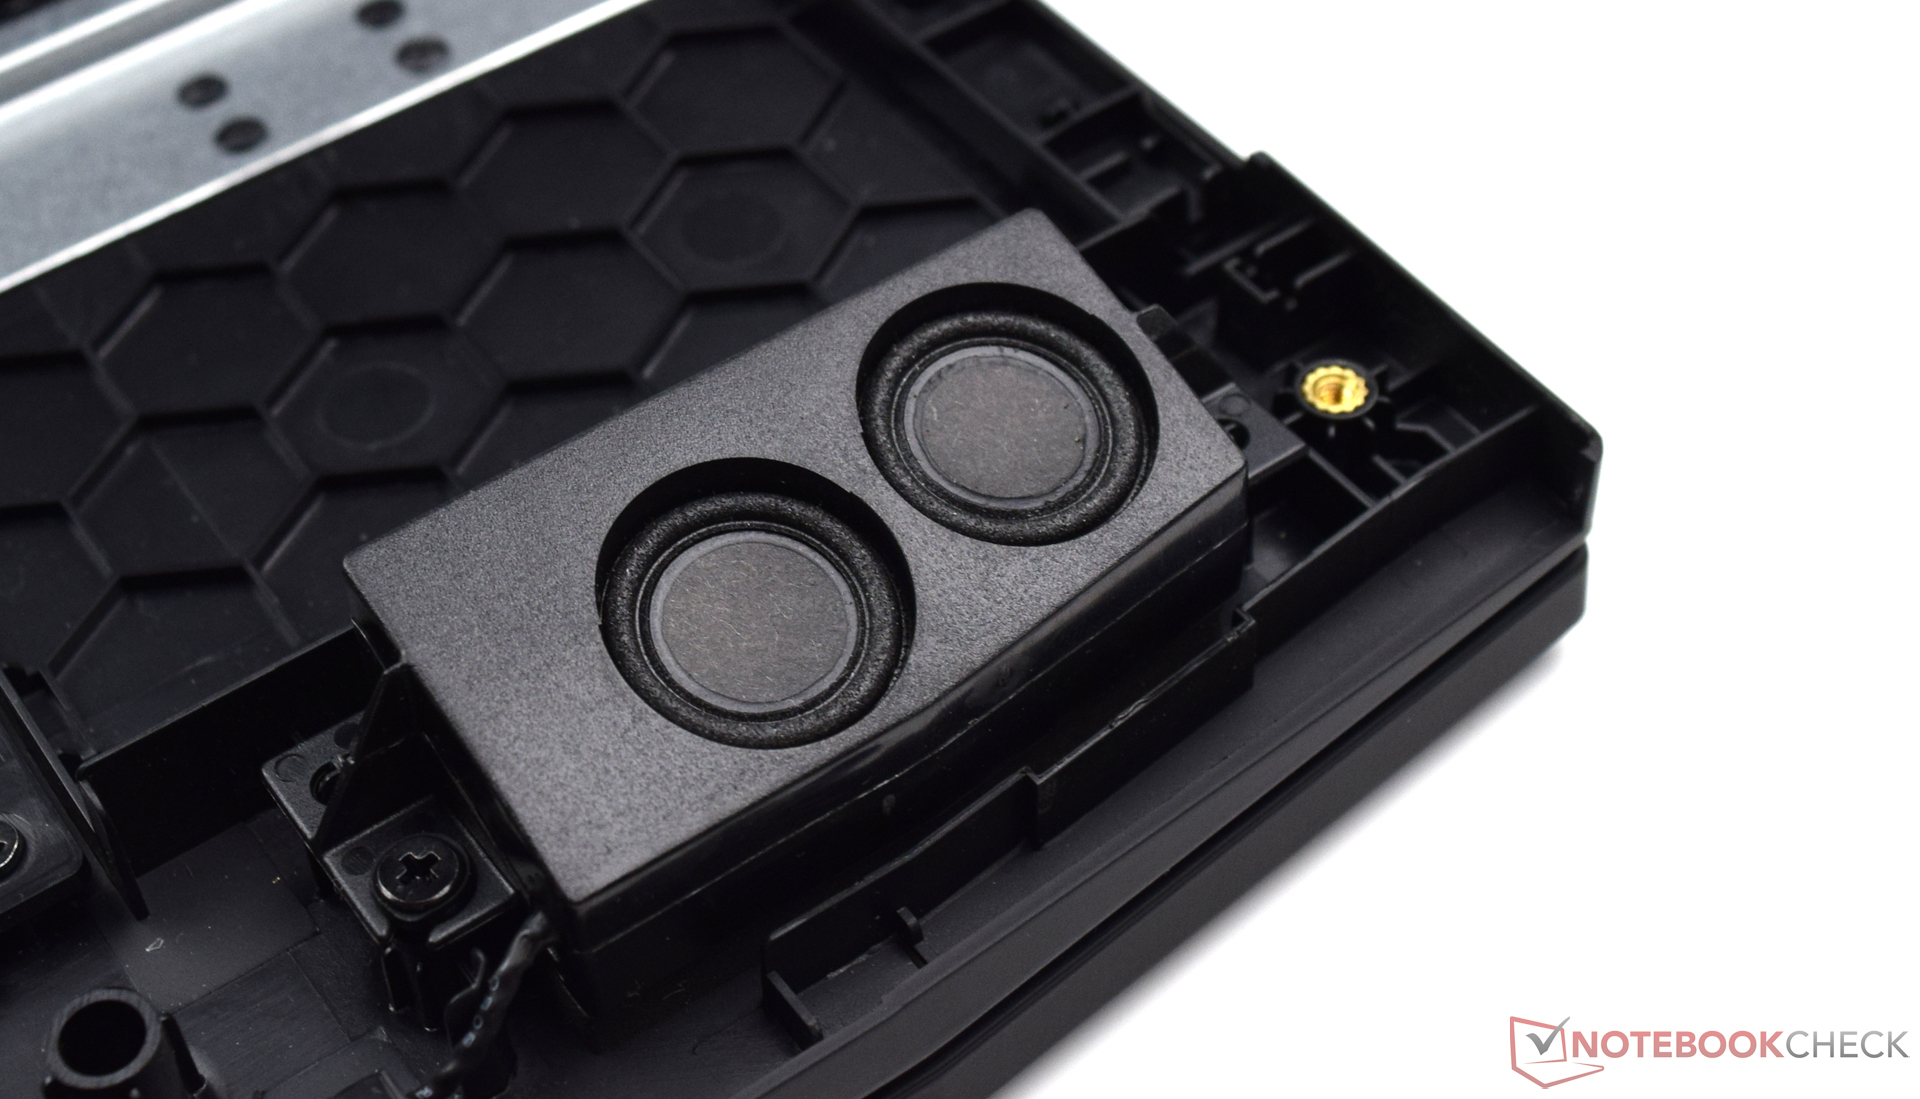
Acer Predator 17 X GX-792-76DL análisis de audio
(+) | los altavoces pueden reproducir a un volumen relativamente alto (#86 dB)
Graves 100 - 315 Hz
(±) | lubina reducida - en promedio 9.6% inferior a la mediana
(±) | la linealidad de los graves es media (9.3% delta a frecuencia anterior)
Medios 400 - 2000 Hz
(+) | medios equilibrados - a sólo 2.6% de la mediana
(+) | los medios son lineales (4.9% delta a la frecuencia anterior)
Altos 2 - 16 kHz
(+) | máximos equilibrados - a sólo 3.9% de la mediana
(+) | los máximos son lineales (6.7% delta a la frecuencia anterior)
Total 100 - 16.000 Hz
(+) | el sonido global es lineal (11.1% de diferencia con la mediana)
En comparación con la misma clase
» 8% de todos los dispositivos probados de esta clase eran mejores, 3% similares, 89% peores
» El mejor tuvo un delta de 6%, la media fue 18%, el peor fue ###max##%
En comparación con todos los dispositivos probados
» 7% de todos los dispositivos probados eran mejores, 2% similares, 92% peores
» El mejor tuvo un delta de 4%, la media fue 24%, el peor fue ###max##%
MSI GT73VR 7RF-296 análisis de audio
(+) | los altavoces pueden reproducir a un volumen relativamente alto (#93 dB)
Graves 100 - 315 Hz
(±) | lubina reducida - en promedio 11.7% inferior a la mediana
(±) | la linealidad de los graves es media (9% delta a frecuencia anterior)
Medios 400 - 2000 Hz
(+) | medios equilibrados - a sólo 3% de la mediana
(+) | los medios son lineales (3.6% delta a la frecuencia anterior)
Altos 2 - 16 kHz
(+) | máximos equilibrados - a sólo 4% de la mediana
(+) | los máximos son lineales (3.5% delta a la frecuencia anterior)
Total 100 - 16.000 Hz
(+) | el sonido global es lineal (13.6% de diferencia con la mediana)
En comparación con la misma clase
» 20% de todos los dispositivos probados de esta clase eran mejores, 7% similares, 73% peores
» El mejor tuvo un delta de 6%, la media fue 18%, el peor fue ###max##%
En comparación con todos los dispositivos probados
» 15% de todos los dispositivos probados eran mejores, 4% similares, 82% peores
» El mejor tuvo un delta de 4%, la media fue 24%, el peor fue ###max##%
| Off / Standby | |
| Ocioso | |
| Carga |
|
Clave:
min: | |
| Acer Predator 17 X GX-792-76DL i7-7820HK, GeForce GTX 1080 Mobile | MSI GT73VR 7RF-296 i7-7820HK, GeForce GTX 1080 Mobile | Asus G701VIK-BA049T i7-7820HK, GeForce GTX 1080 Mobile | Asus G752VS-XB78K 6820HK, GeForce GTX 1070 Mobile | MSI GT72VR 7RE-433 i7-7700HQ, GeForce GTX 1070 Mobile | Aorus X7 v6 6820HK, GeForce GTX 1070 Mobile | Acer Predator 17 G9-793-77LG 6700HQ, GeForce GTX 1070 Mobile | |
|---|---|---|---|---|---|---|---|
| Power Consumption | -7% | -1% | 10% | 22% | -2% | -1% | |
| Idle Minimum * (Watt) | 27 | 29 -7% | 24 11% | 24 11% | 20 26% | 29 -7% | 25 7% |
| Idle Average * (Watt) | 32 | 35 -9% | 31 3% | 31 3% | 27 16% | 31 3% | 35 -9% |
| Idle Maximum * (Watt) | 41 | 40 2% | 38 7% | 36 12% | 31 24% | 38 7% | 46 -12% |
| Load Average * (Watt) | 102 | 94 8% | 98 4% | 94 8% | 86 16% | 111 -9% | 103 -1% |
| Load Maximum * (Watt) | 248 | 315 -27% | 320 -29% | 204 18% | 184 26% | 253 -2% | 223 10% |
* ... más pequeño es mejor


| Acer Predator 17 X GX-792-76DL i7-7820HK, GeForce GTX 1080 Mobile, 88.8 Wh | MSI GT73VR 7RF-296 i7-7820HK, GeForce GTX 1080 Mobile, 75.2 Wh | Asus G701VIK-BA049T i7-7820HK, GeForce GTX 1080 Mobile, 93 Wh | Asus G752VS-XB78K 6820HK, GeForce GTX 1070 Mobile, 90 Wh | MSI GT72VR 7RE-433 i7-7700HQ, GeForce GTX 1070 Mobile, 83 Wh | Aorus X7 v6 6820HK, GeForce GTX 1070 Mobile, 94 Wh | Acer Predator 17 G9-793-77LG 6700HQ, GeForce GTX 1070 Mobile, 88 Wh | |
|---|---|---|---|---|---|---|---|
| Duración de Batería | -33% | -1% | -8% | 1% | -29% | -11% | |
| Reader / Idle (h) | 5.2 | 5.7 10% | 5.2 0% | 5.3 2% | 4.6 -12% | ||
| H.264 (h) | 3.4 | 2.4 -29% | 3.1 -9% | 3.8 12% | |||
| WiFi v1.3 (h) | 4.2 | 2.7 -36% | 4 -5% | 3.5 -17% | 3.8 -10% | 3 -29% | 3.3 -21% |
| Load (h) | 1.5 | 1.4 -7% | 1.4 -7% | 1.5 0% | 1.5 0% |
Pro
Contra
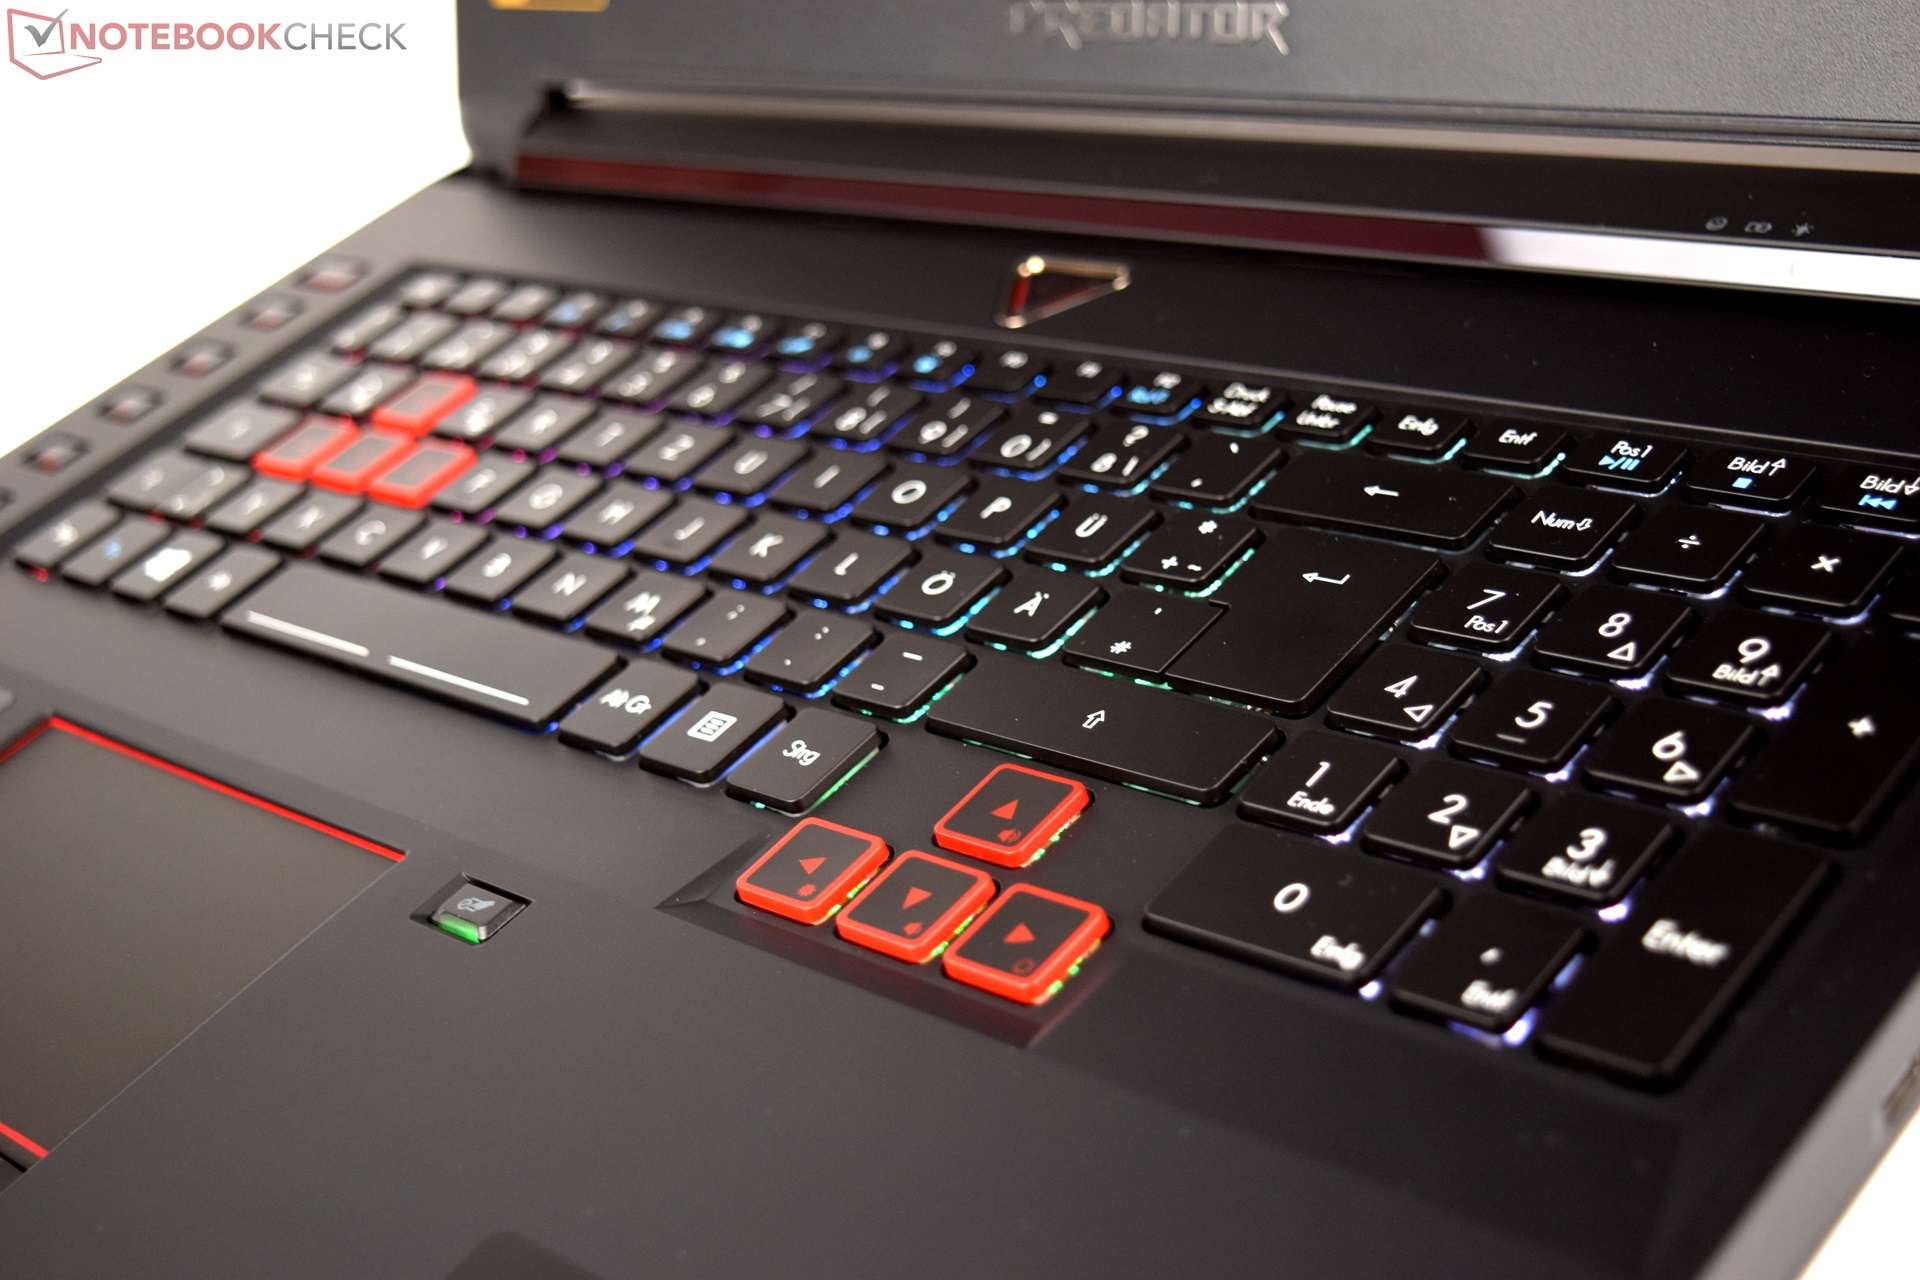
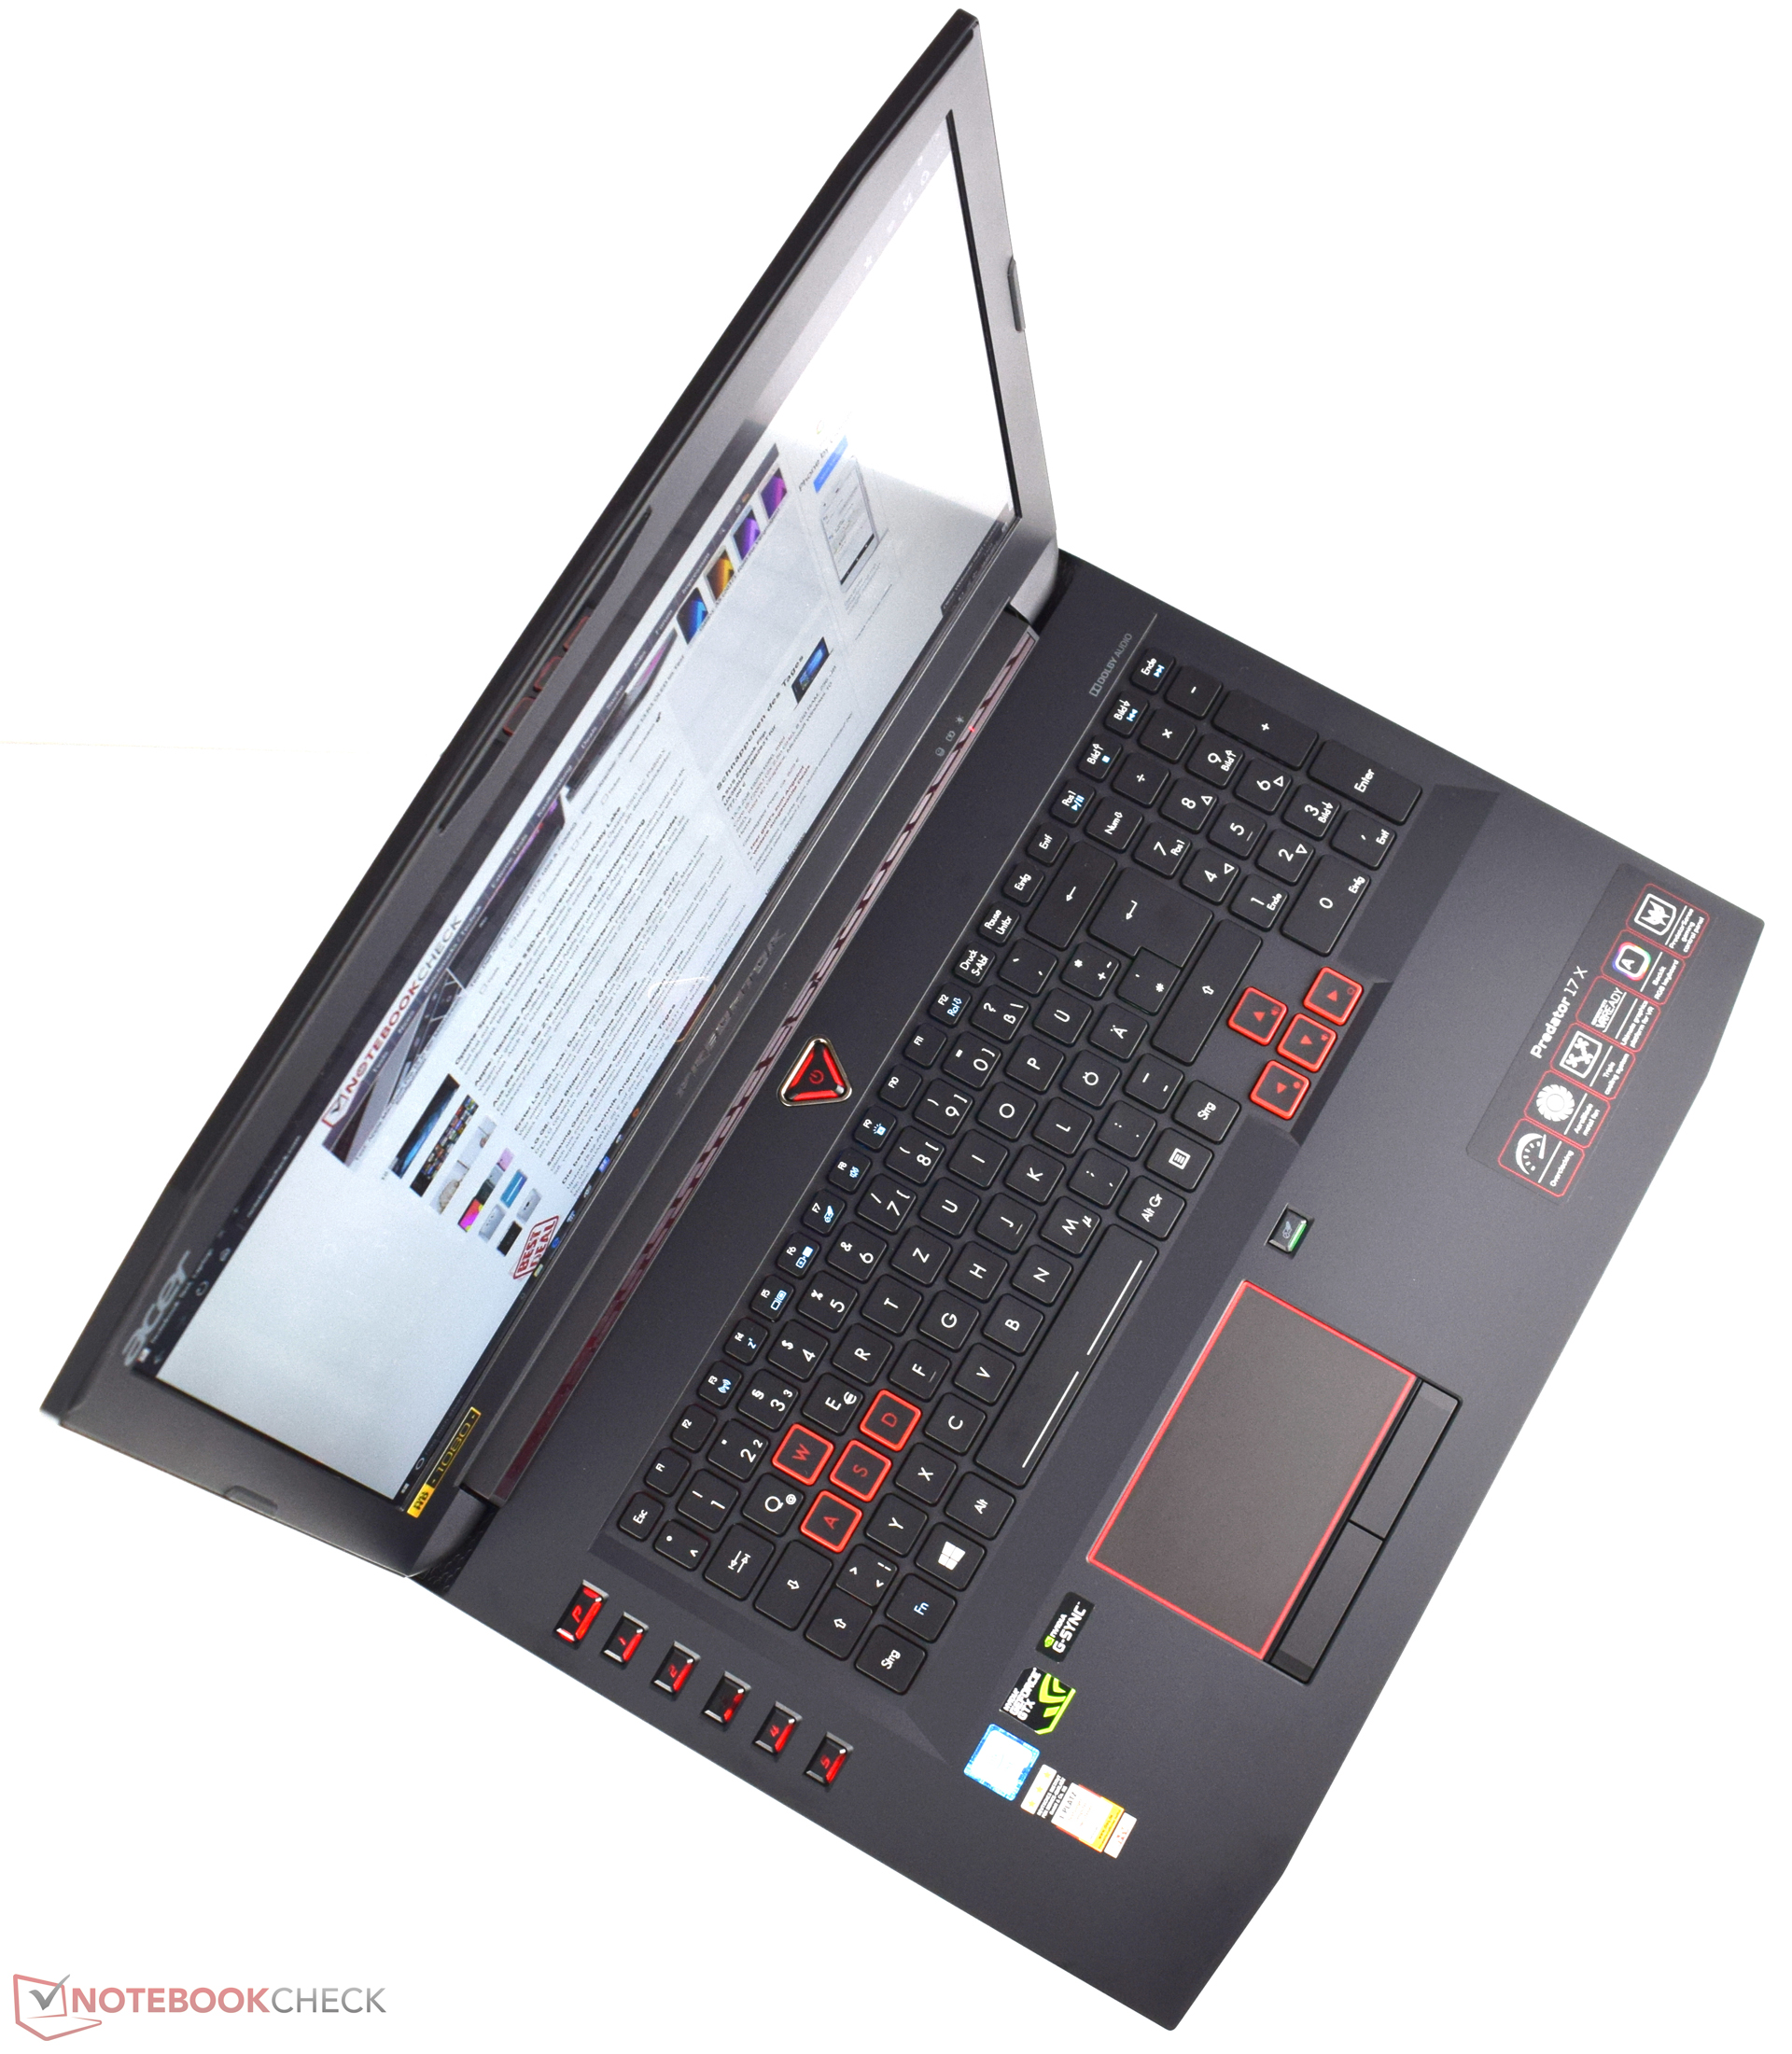
El Predator 17 X es una buena alternativa al Predator 17 "normal", aunque Acer no haya arreglado todos los defectos. El rendimiento queda libre de toda queja: La Intel Core i7-7820HK es una buena pareja para la Nvidia GeForce GTX 1080. Podemos ver récords en algunas pruebas, por lo que ciertamente es una máquina gaming potente. El diseño es similar al de otros modelos Predator.
Acer tiene un nuevo contendiente para el segmento gaming de gama alta. El Predator 17 X es una potente máquina gaming y un serio rival para los sistemas familiares.
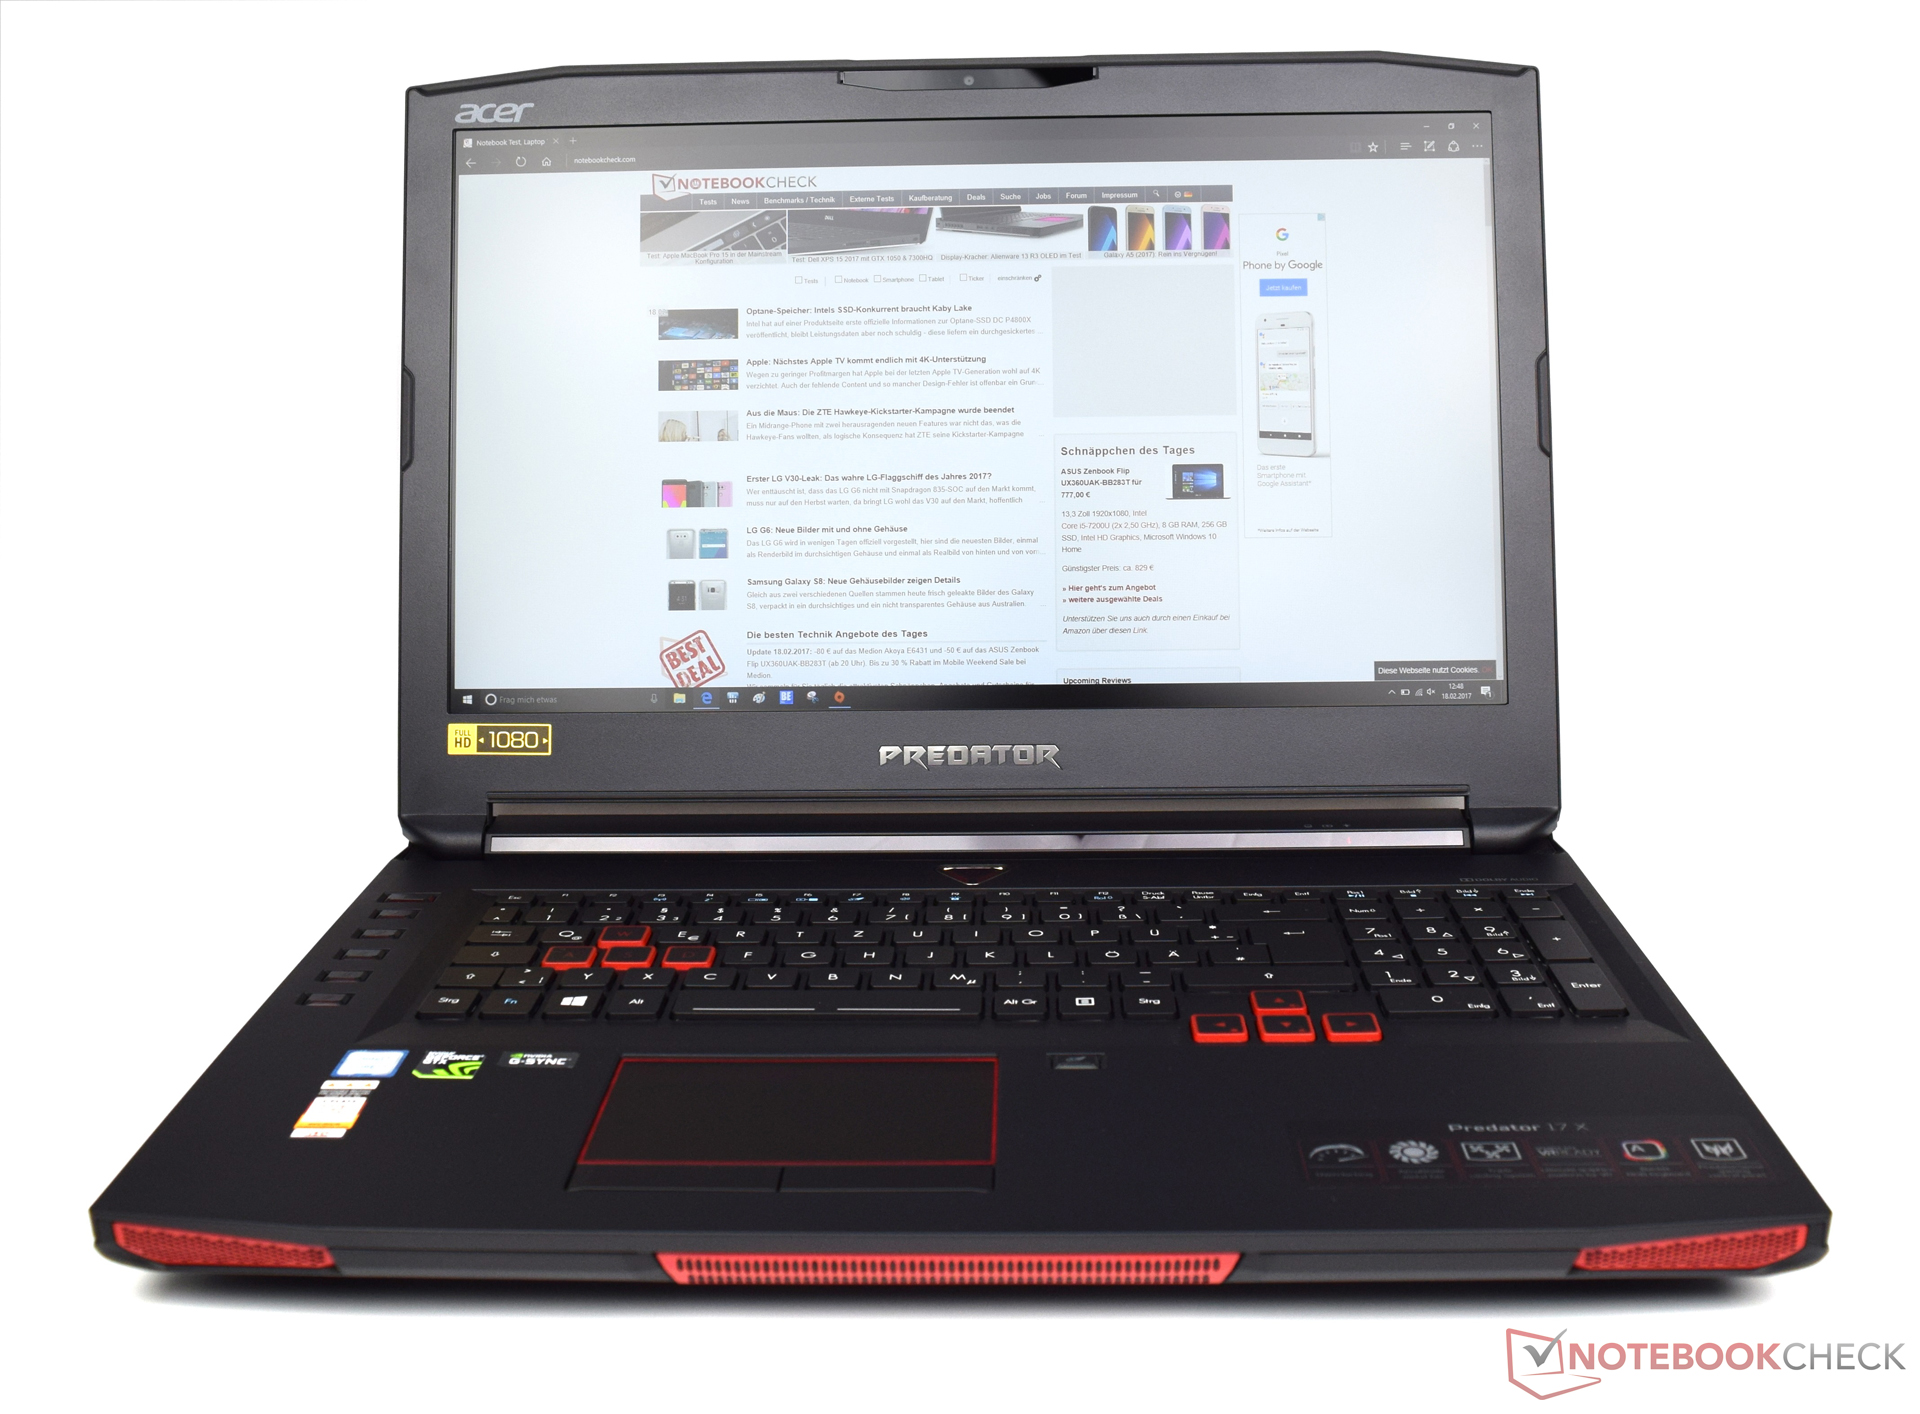
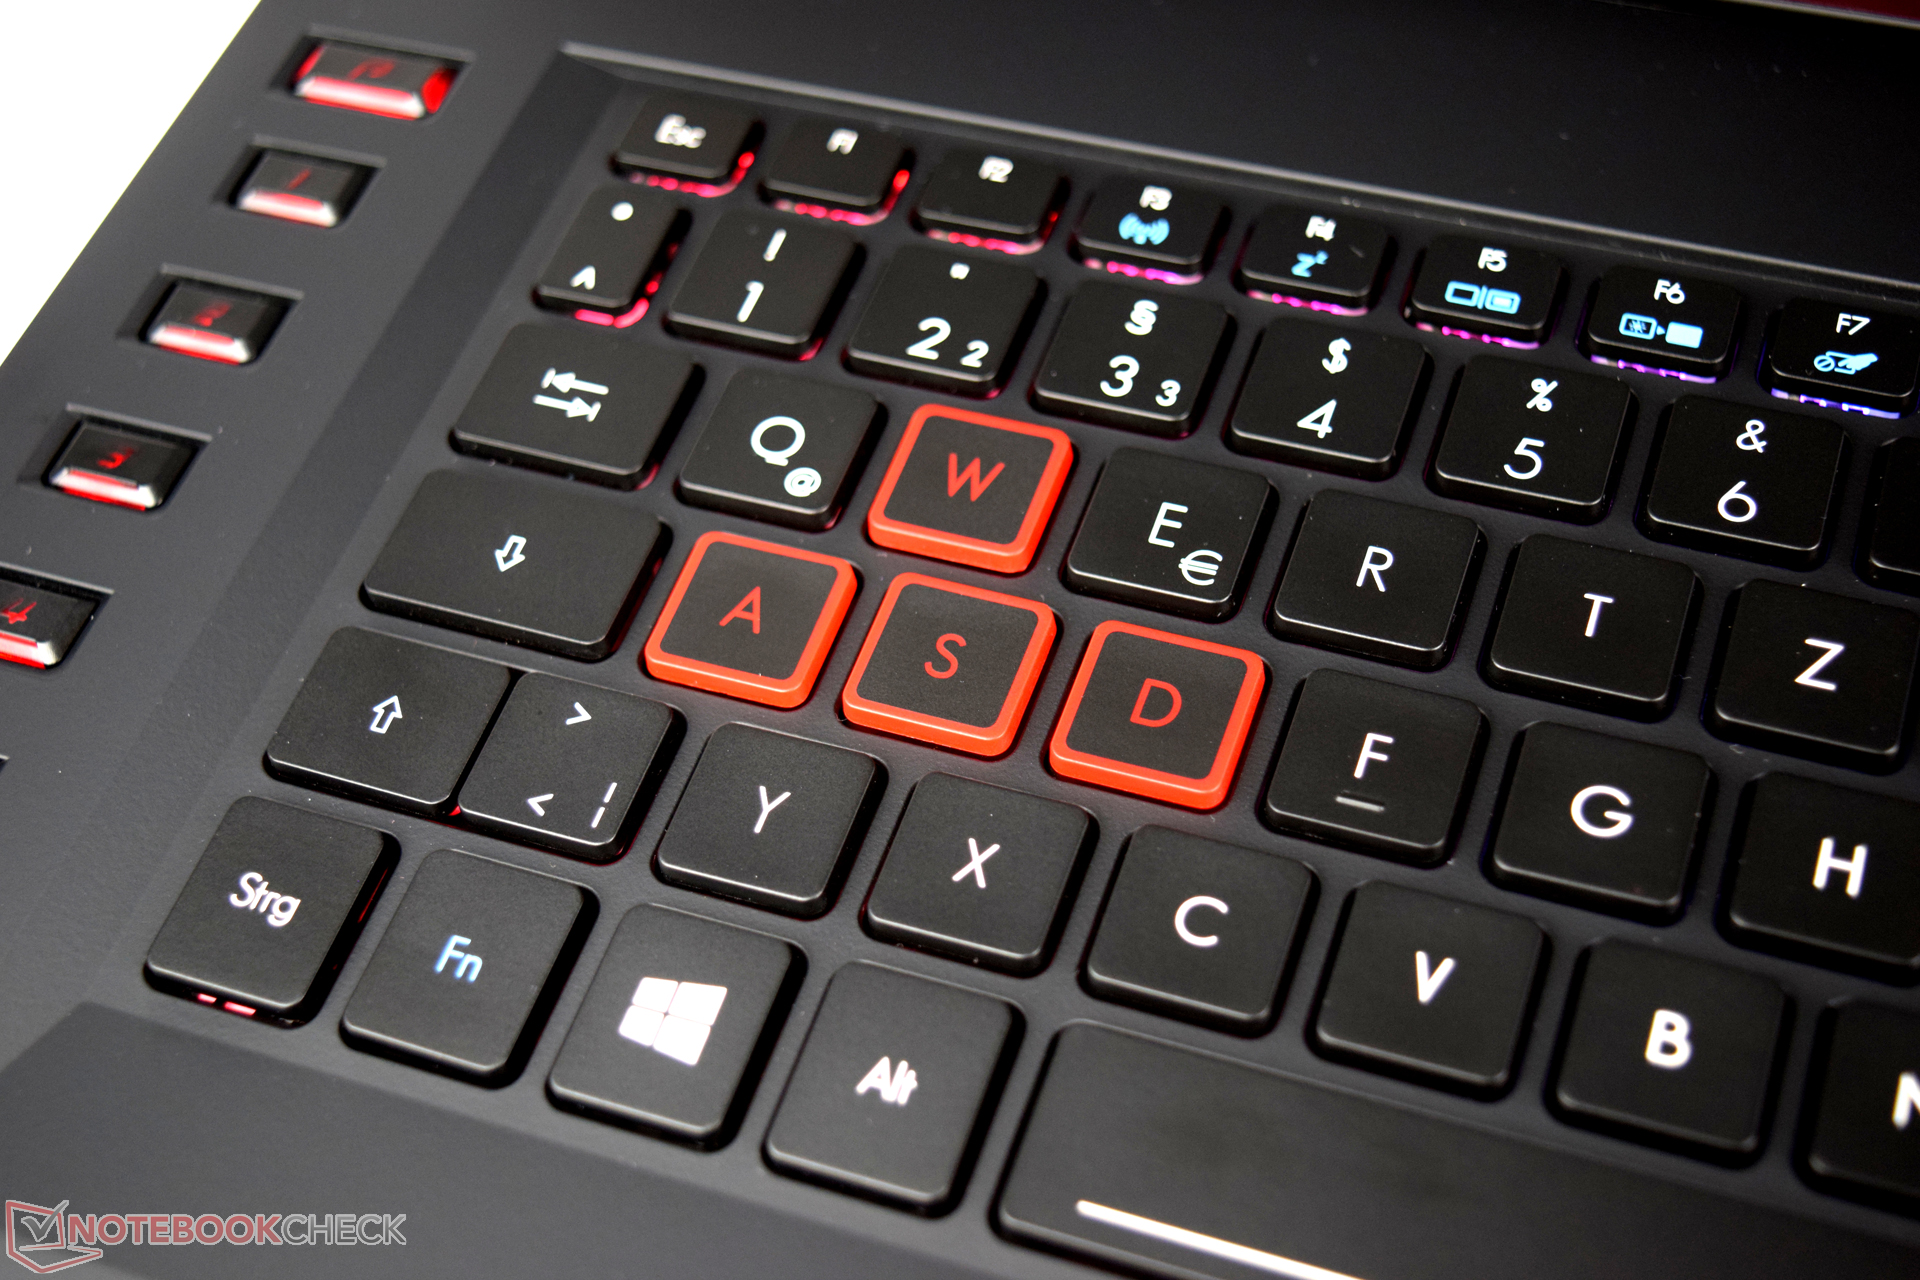
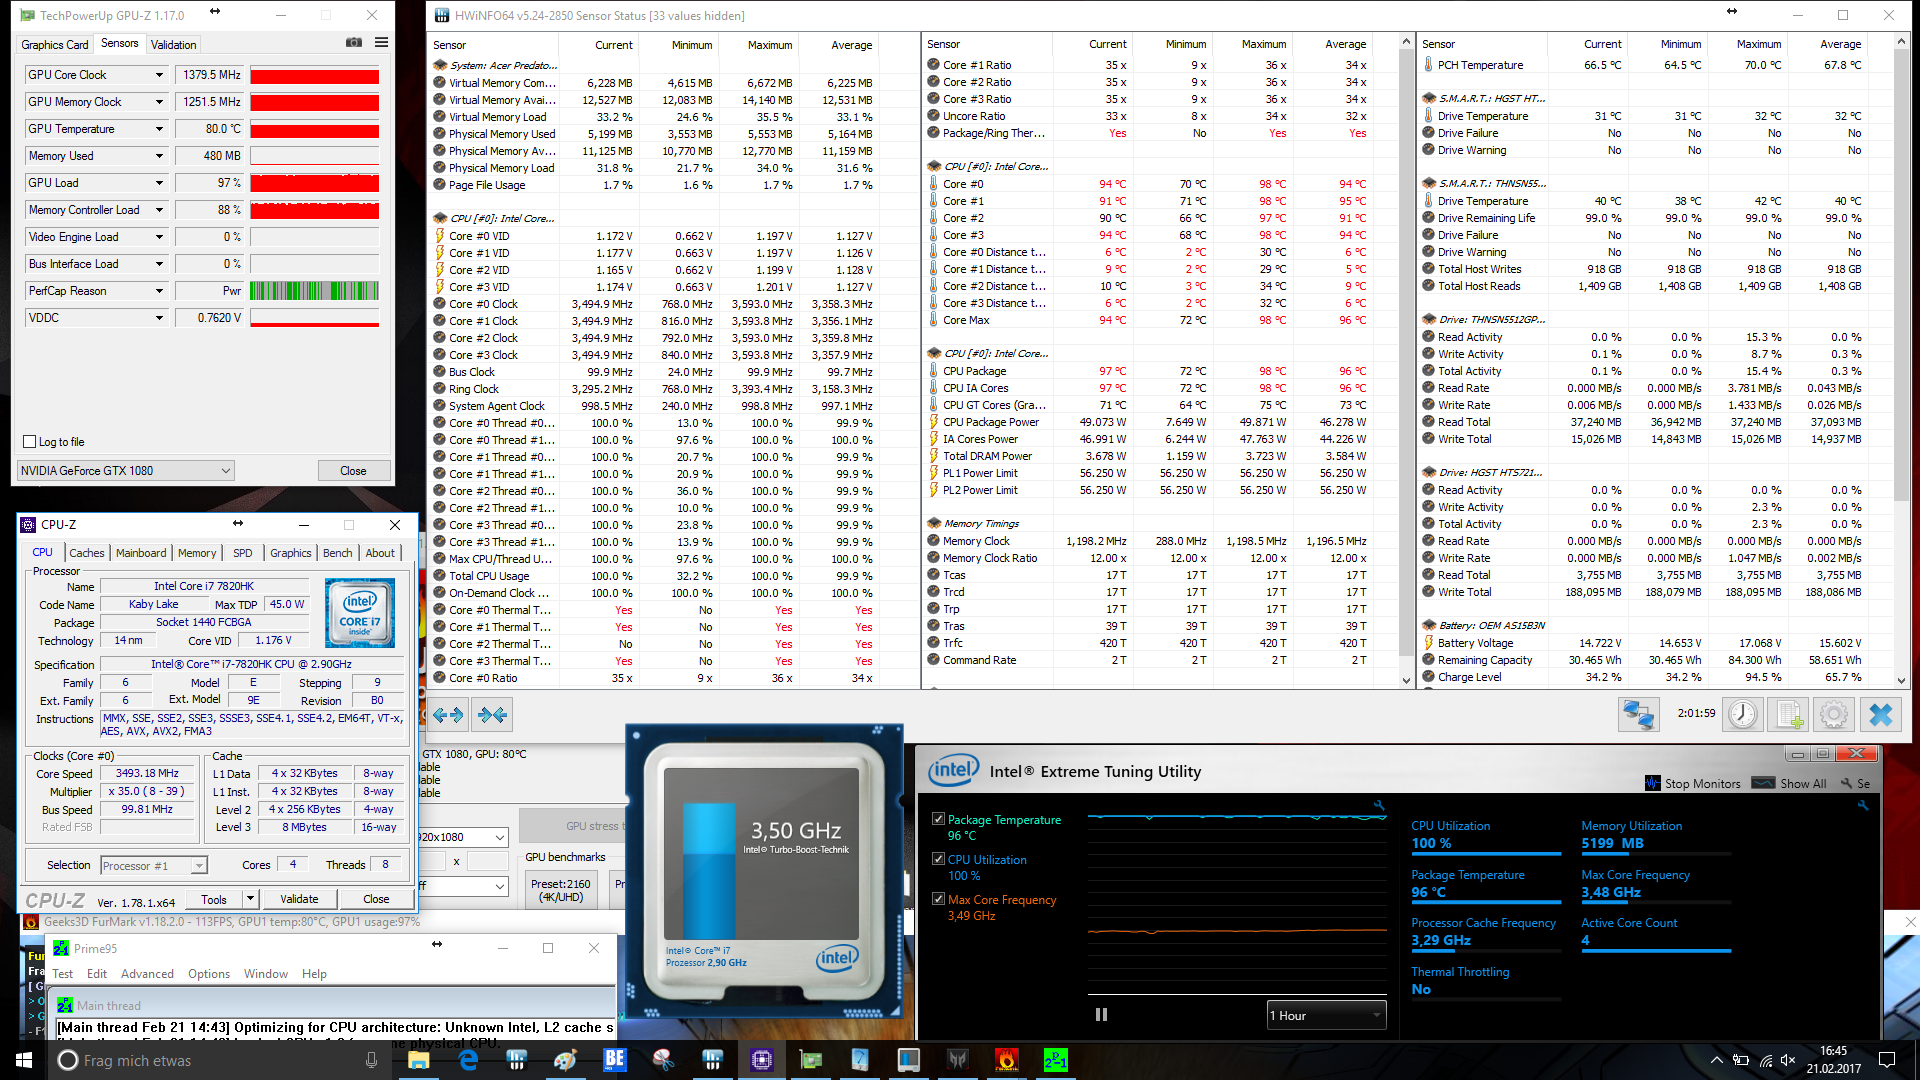
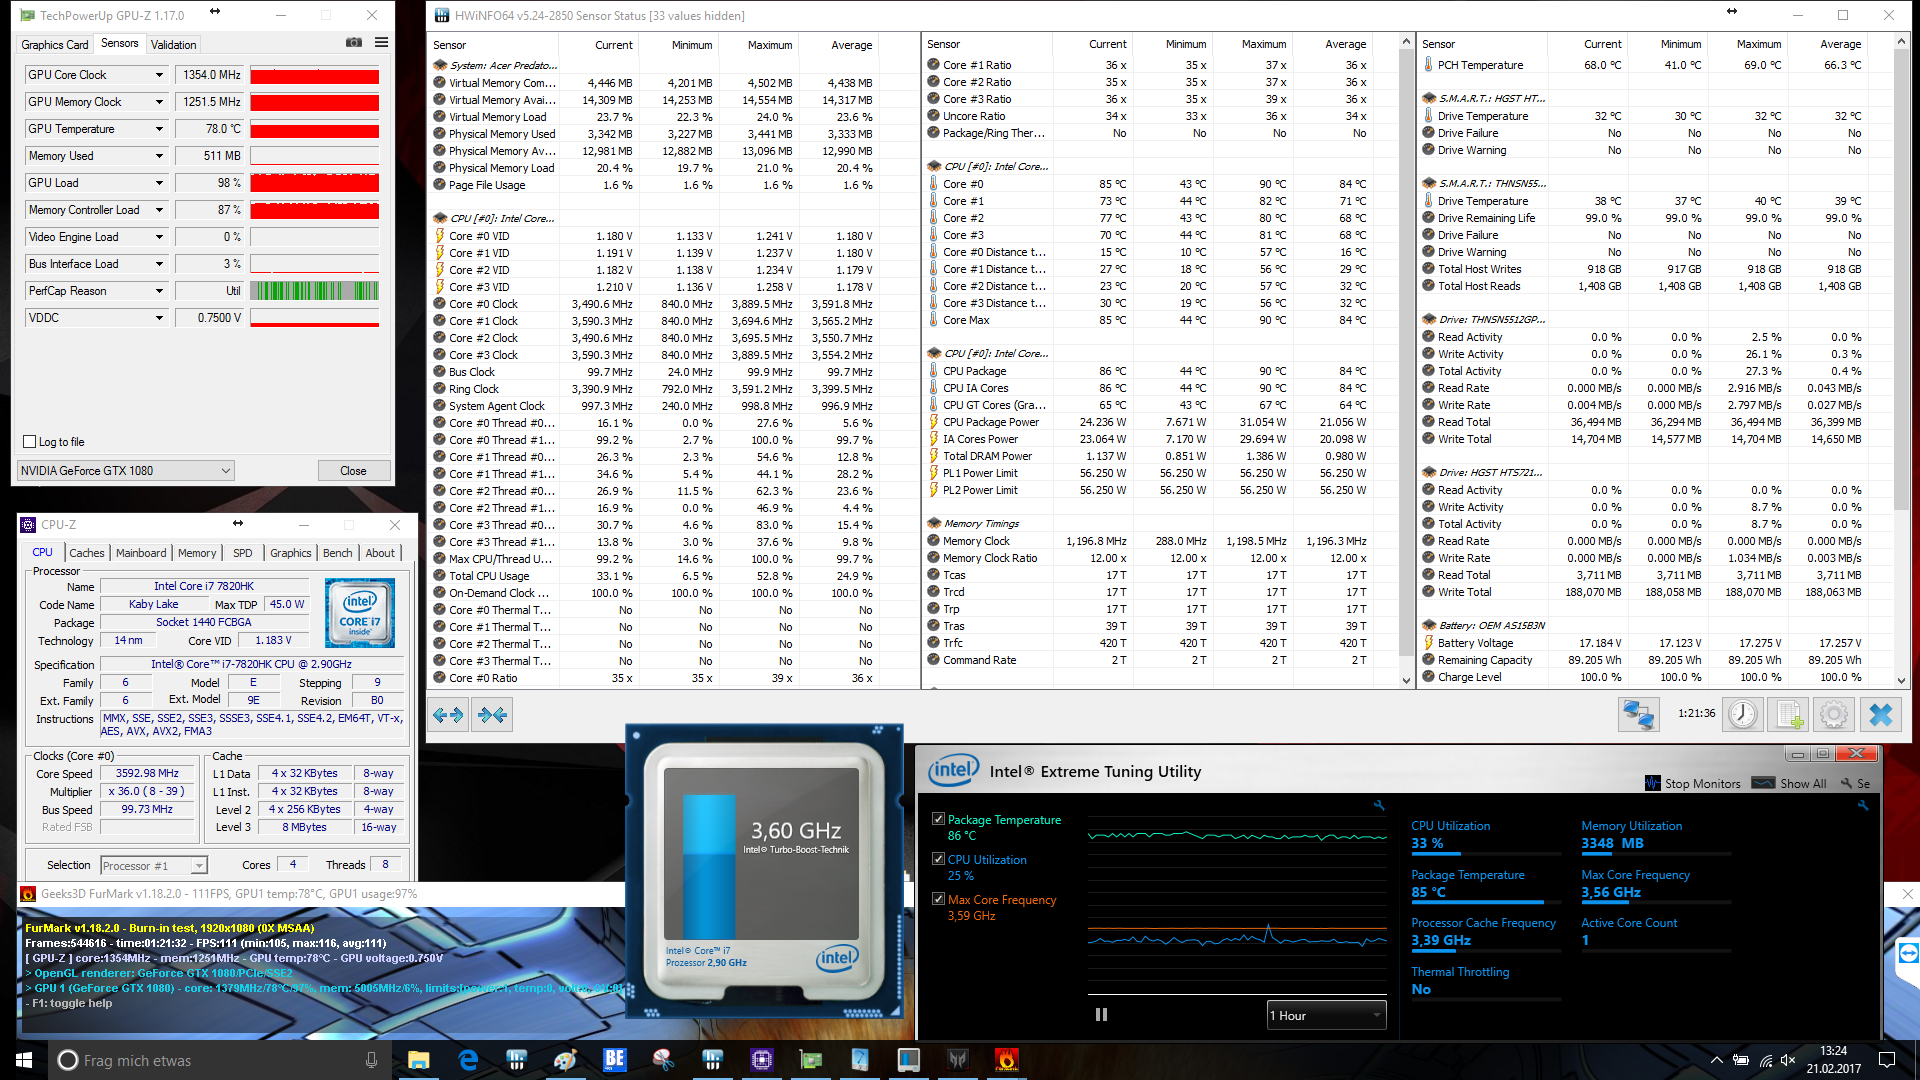
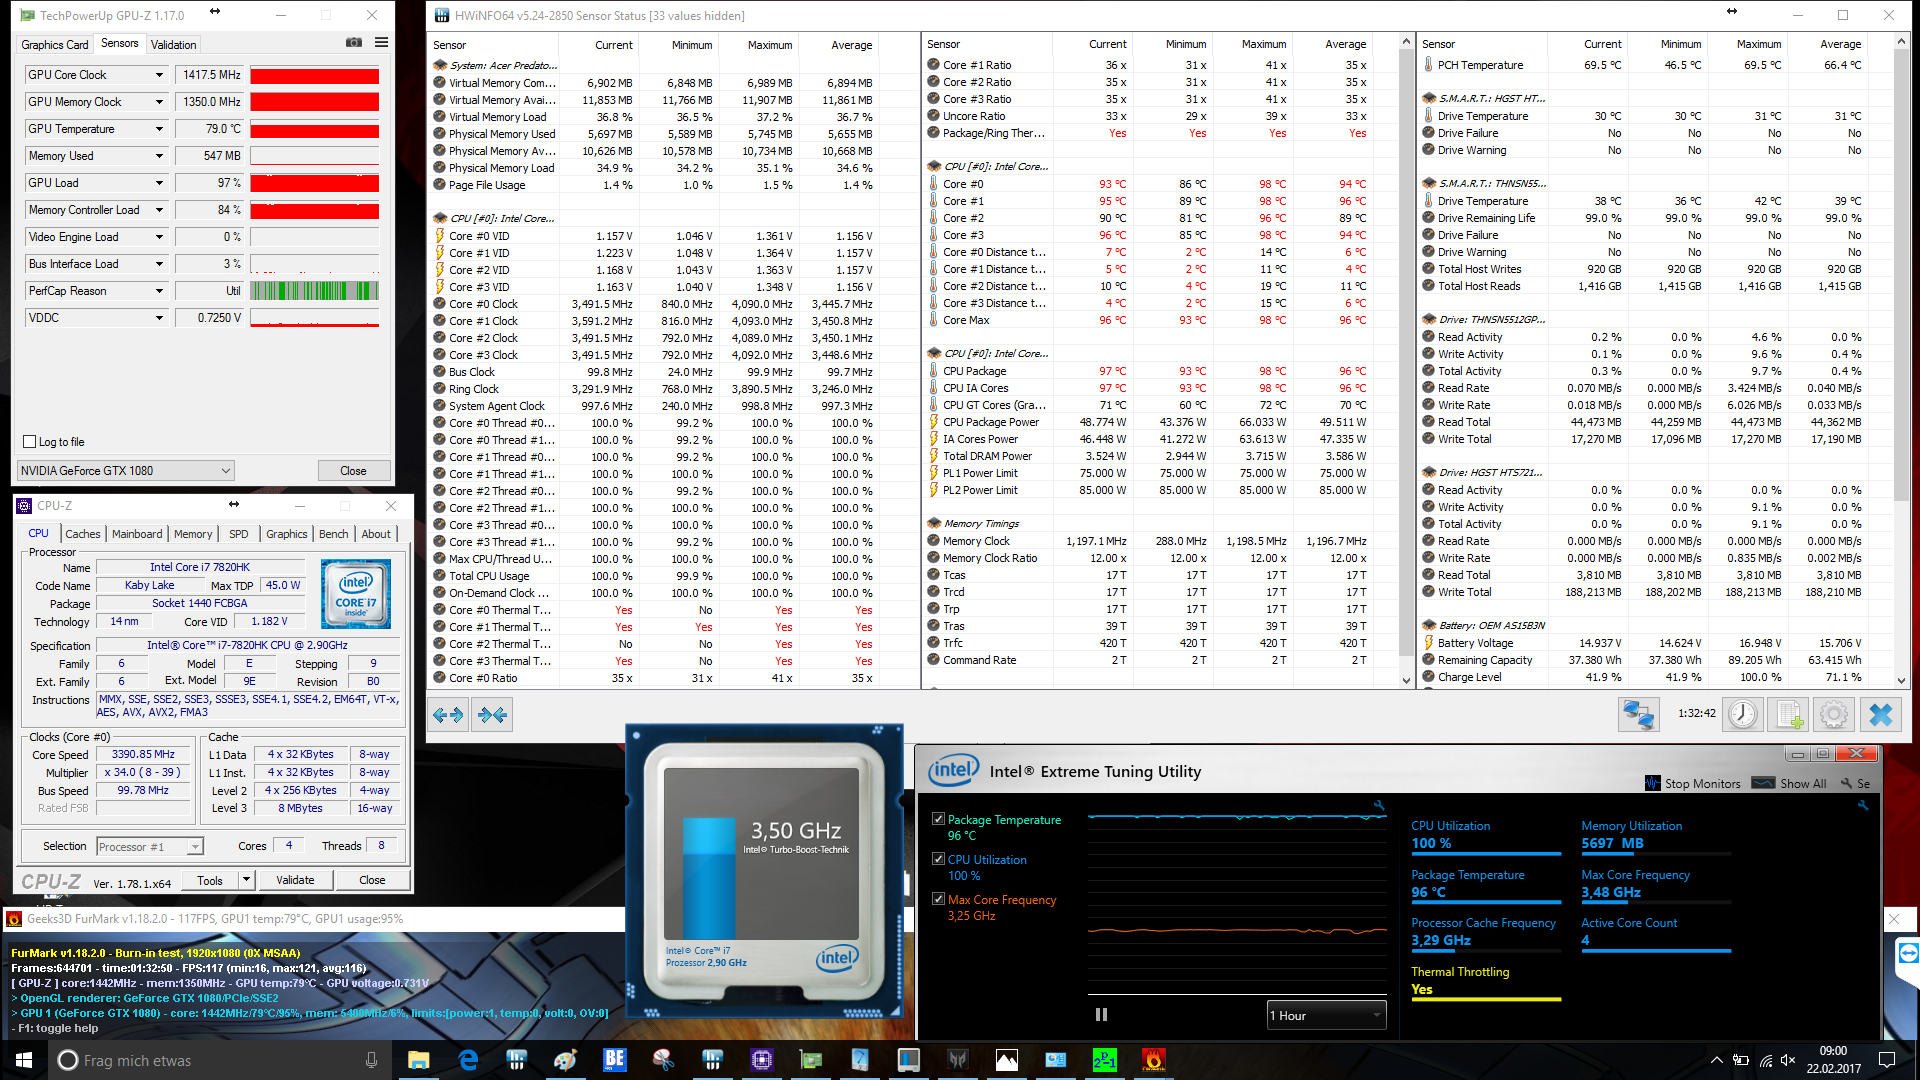
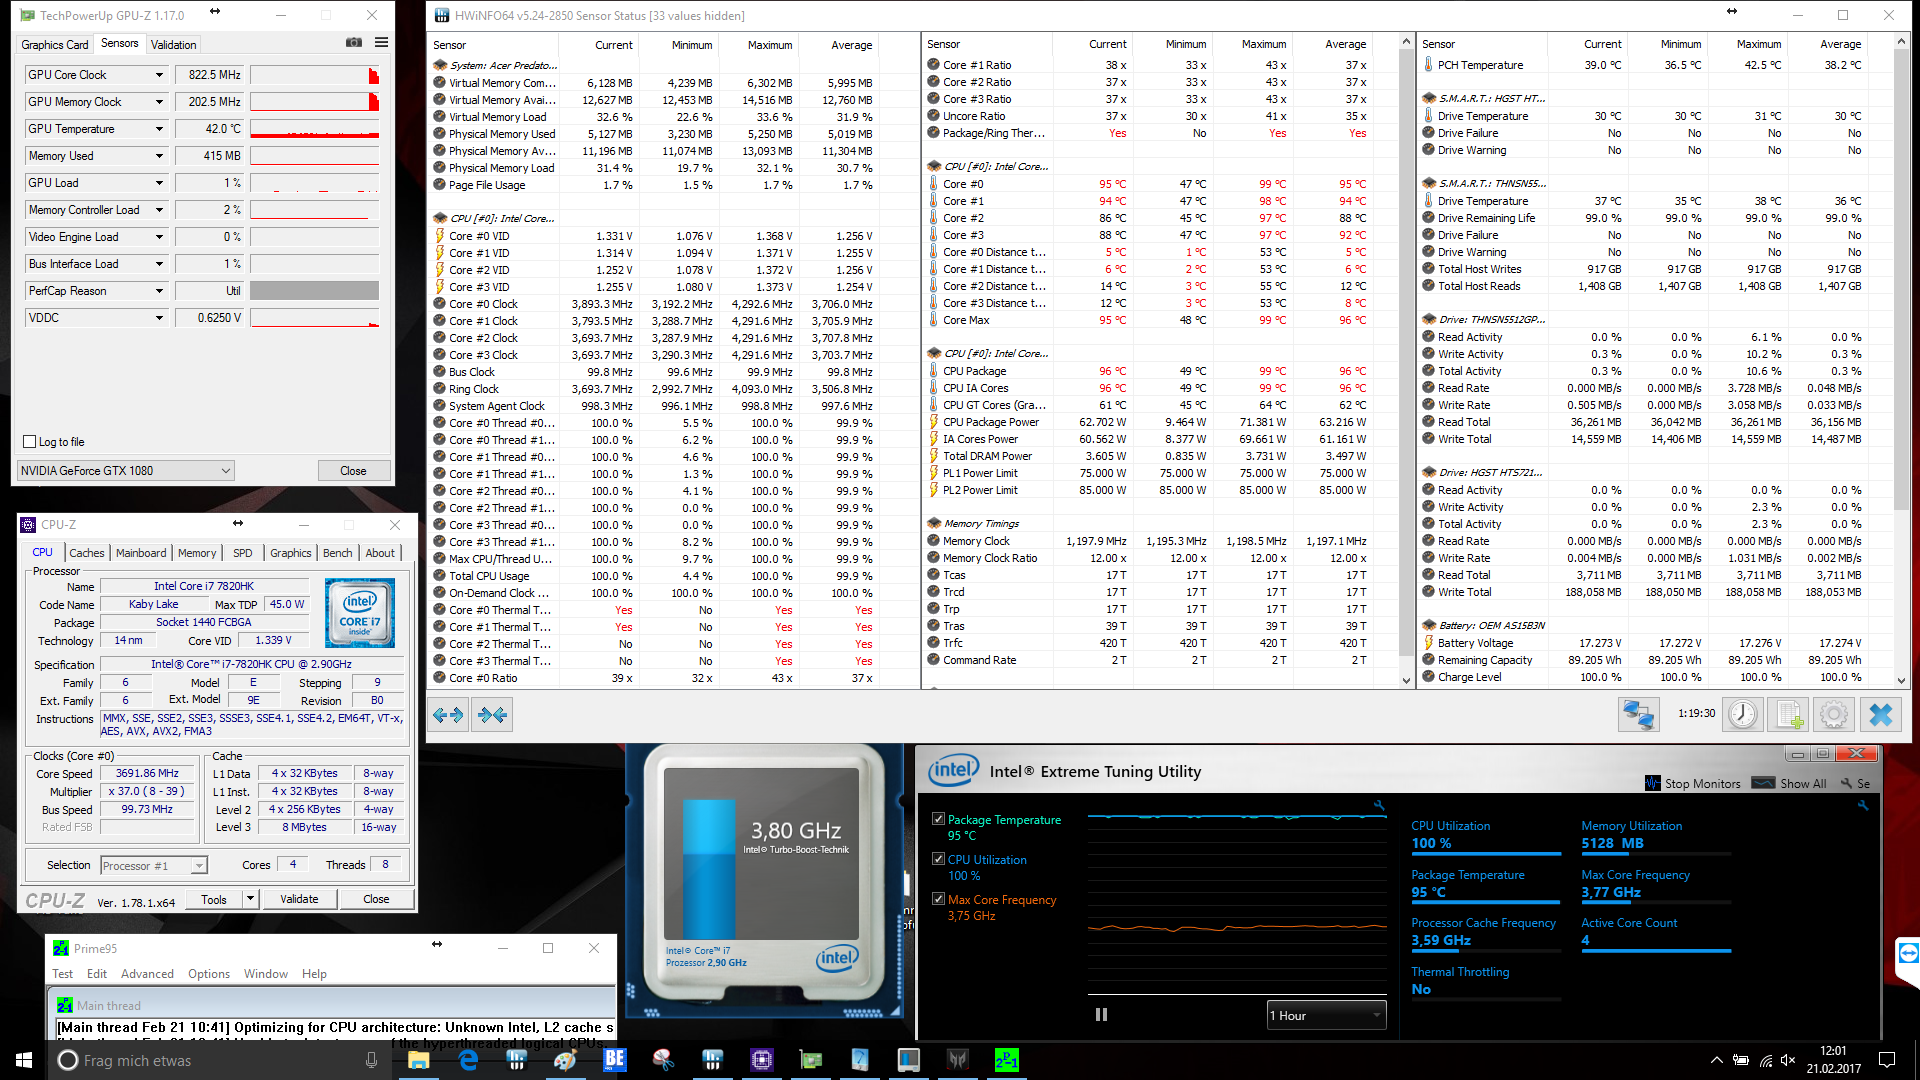
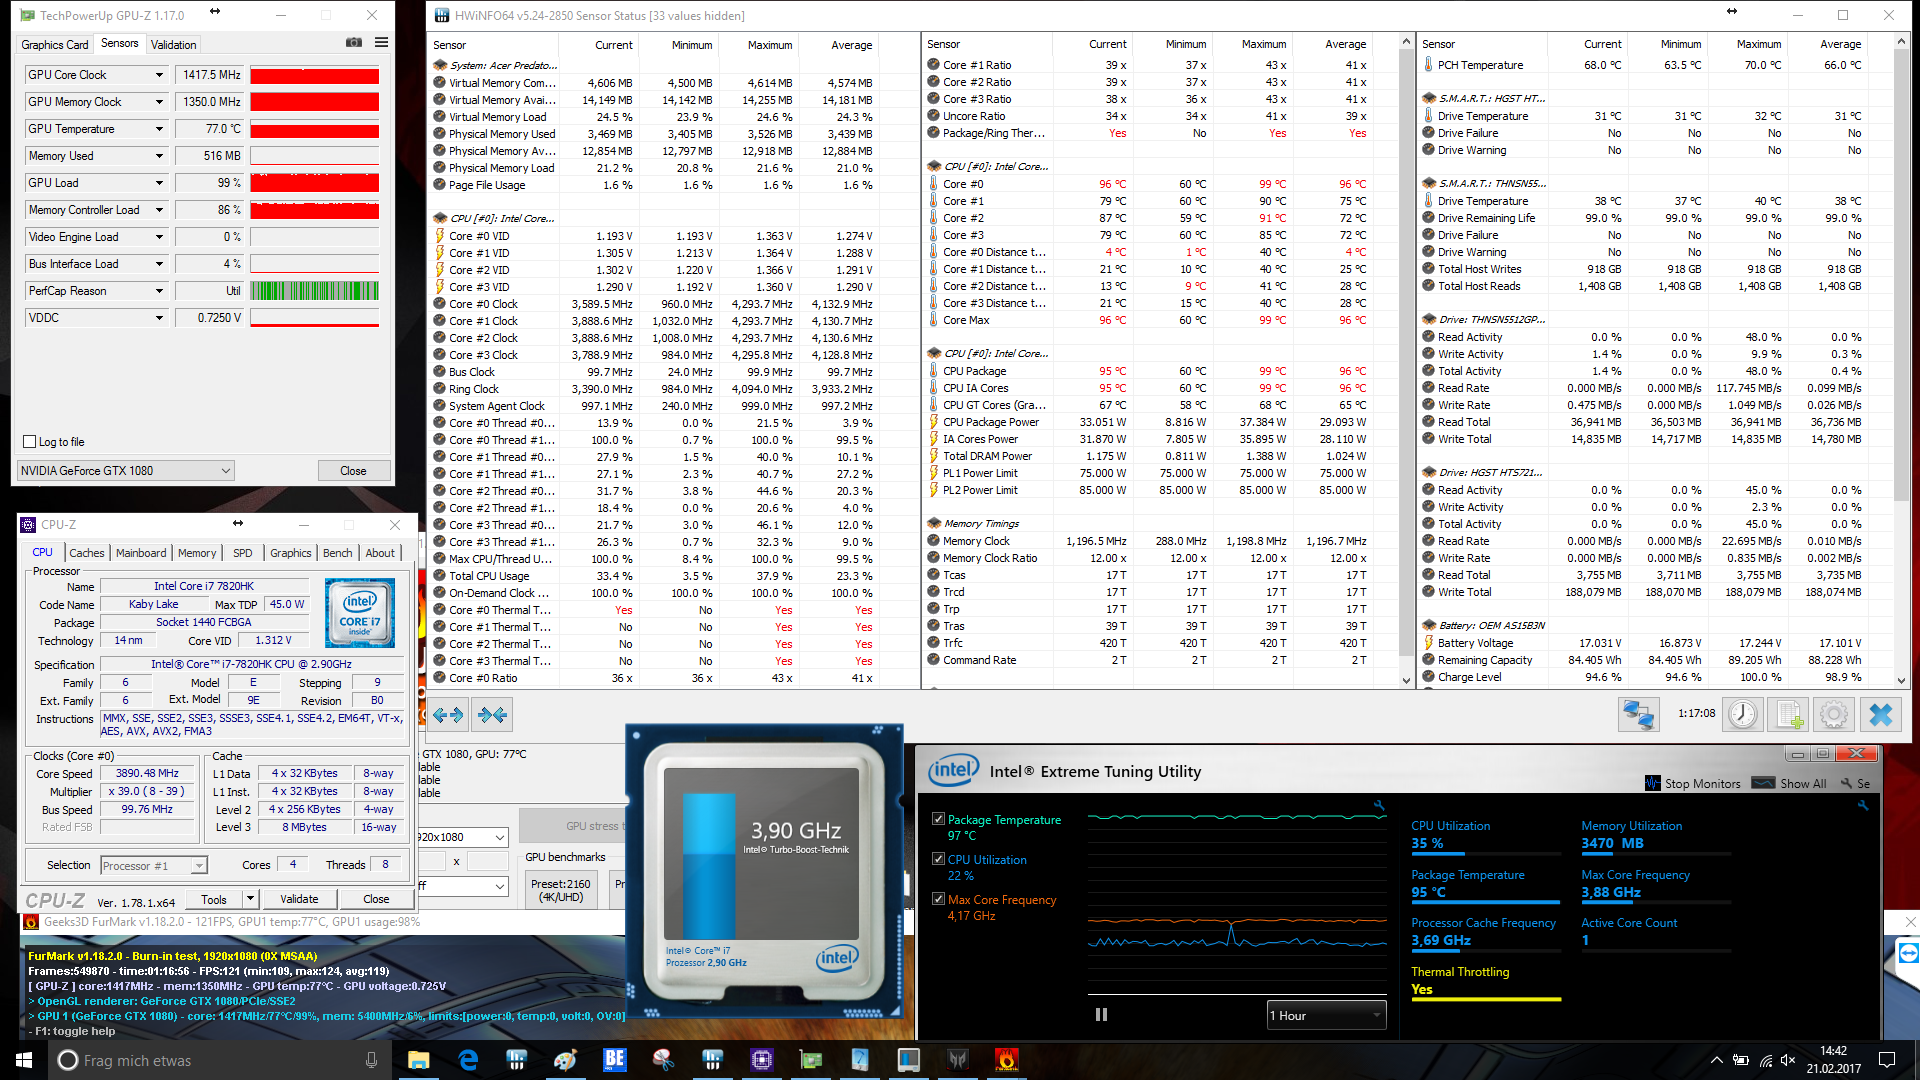
Nos gustaron los buenos dispositivos de entrada así como la calidad de construcción del chasis, pero el display nos deja con sentimientos encontrados. La iluminación es buena, pero los tiempos de respuesta son elevados. Otro aspecto positivo es el overclocking, que mejora mucho el rendimiento. El procesador alcanza su límite térmico un poco pronto, pero elr endimiento sigue siendo superior al valor por defecto.
Ésta es una versión acortada del análisis original. Puedes leer el análisis completo en inglés aquí.
Acer Predator 17 X GX-792-76DL
- 03/01/2017 v6 (old)
Sebastian Bade
Price comparison
