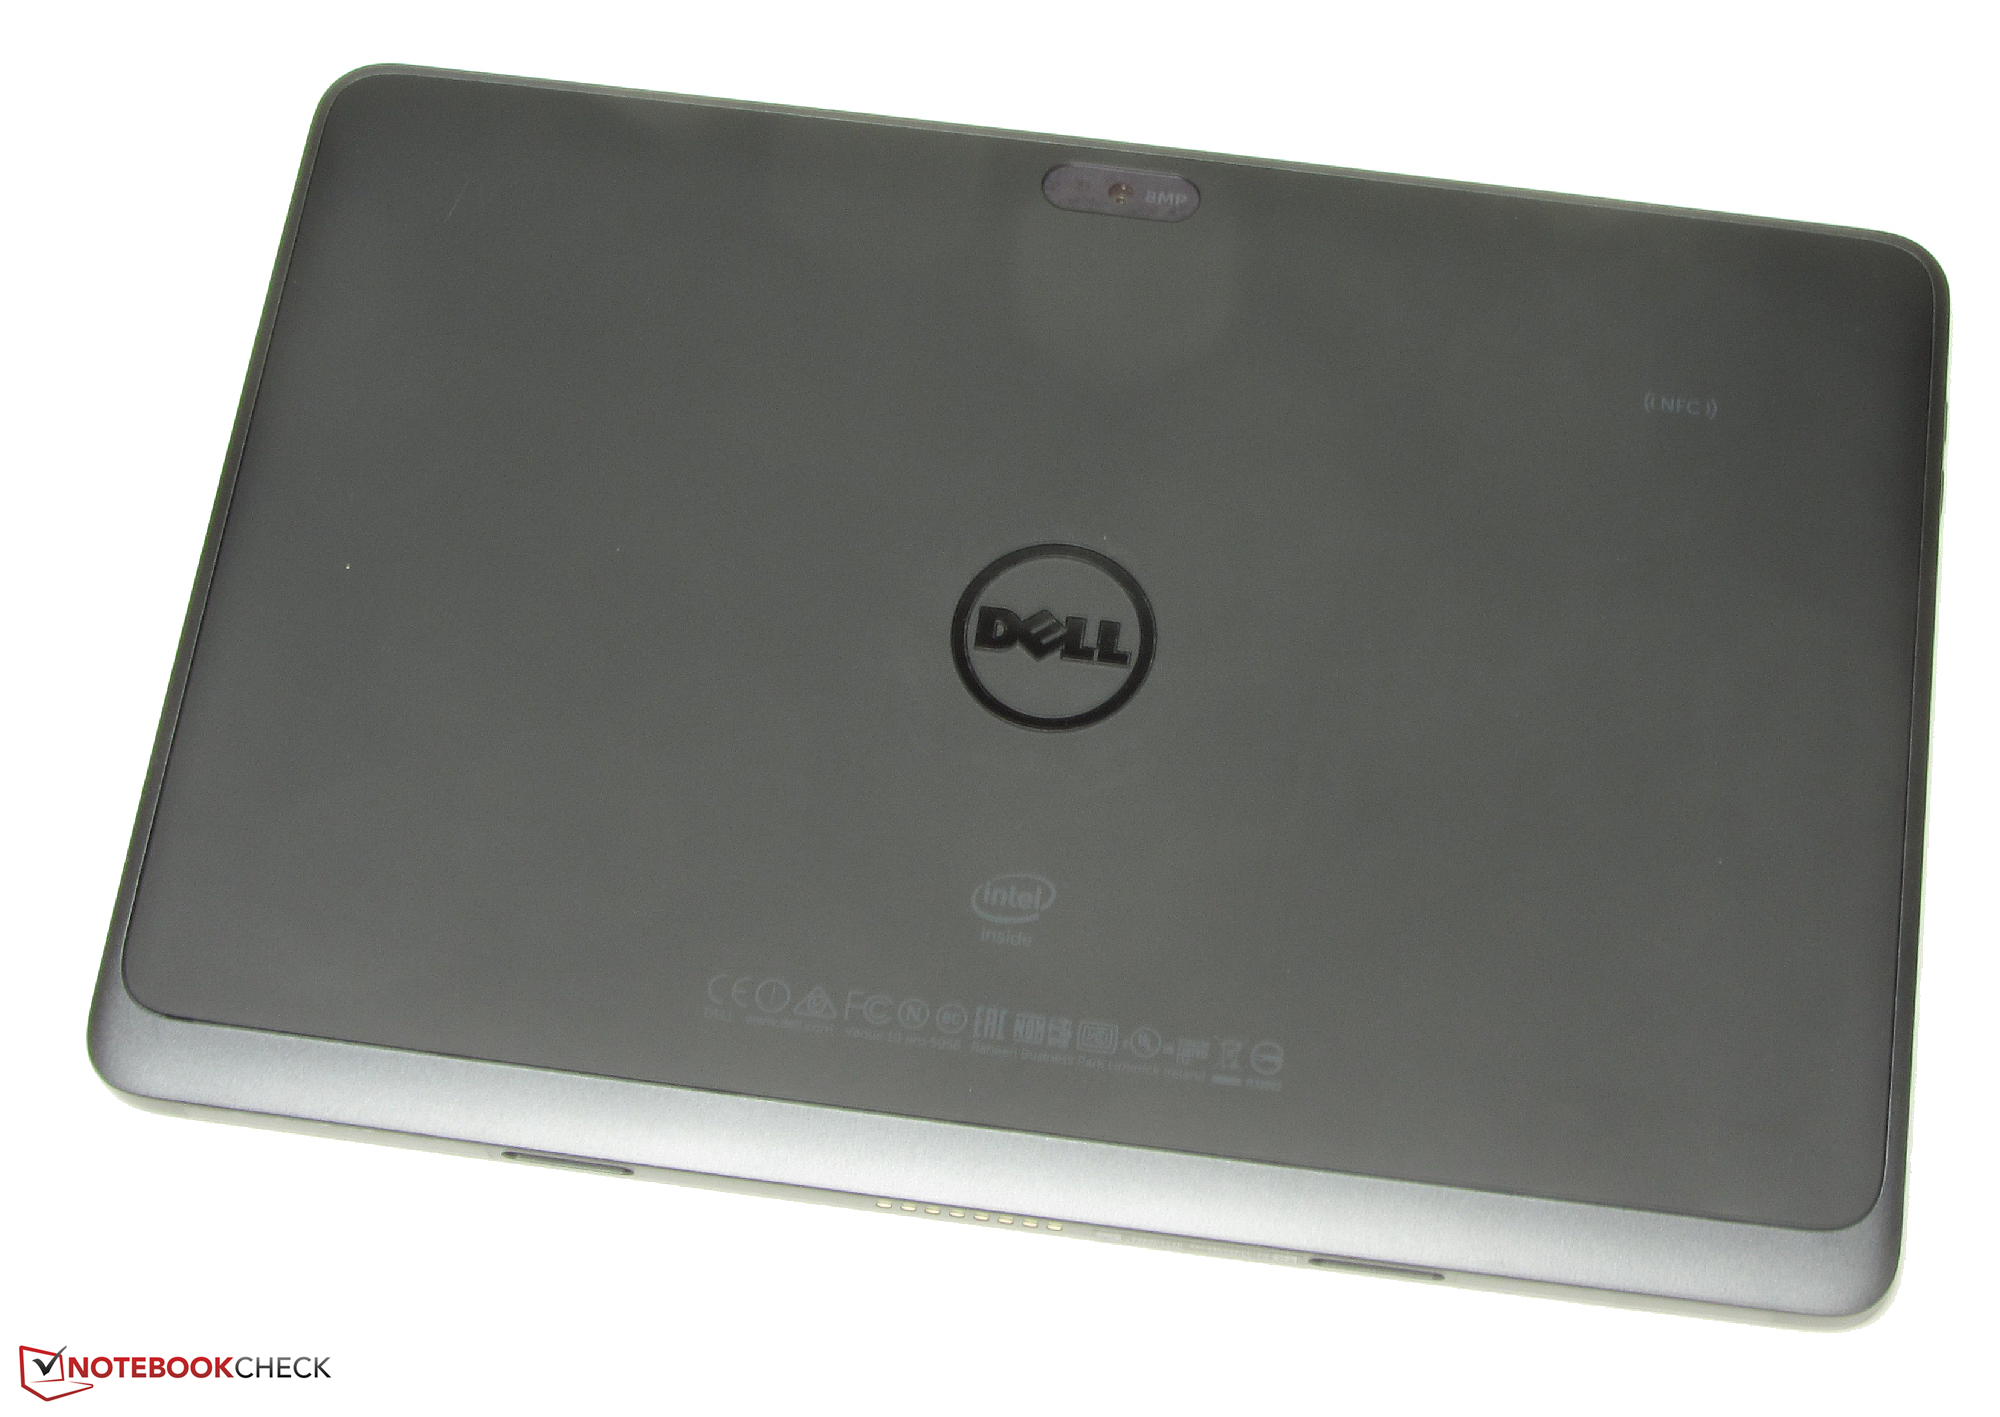
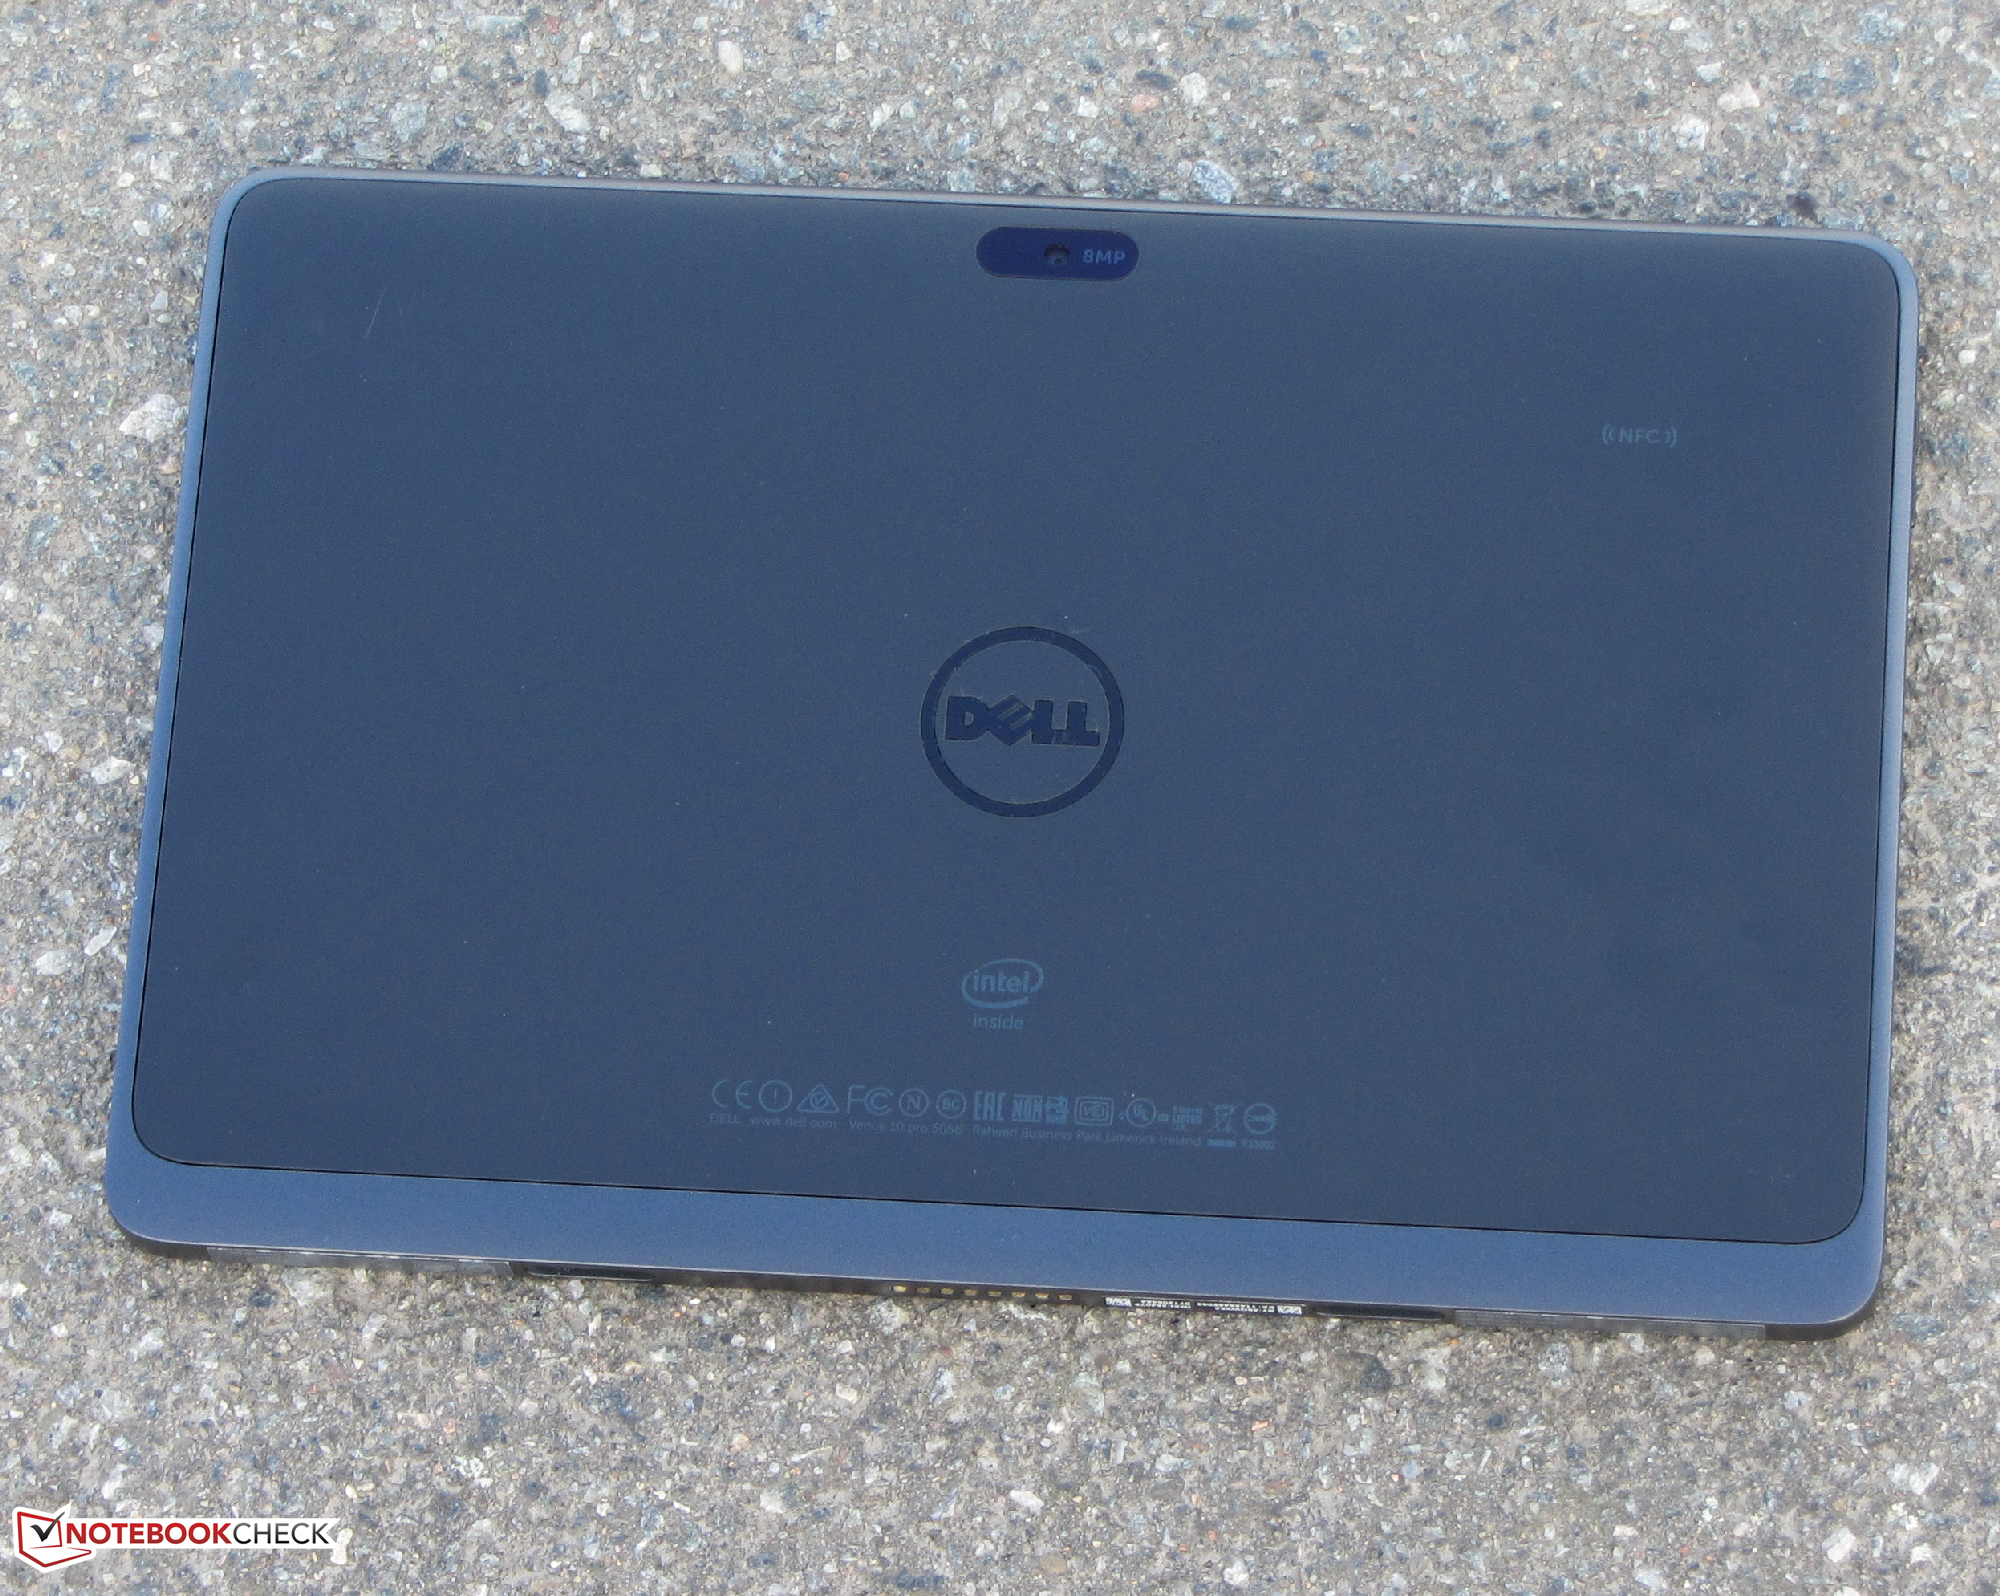
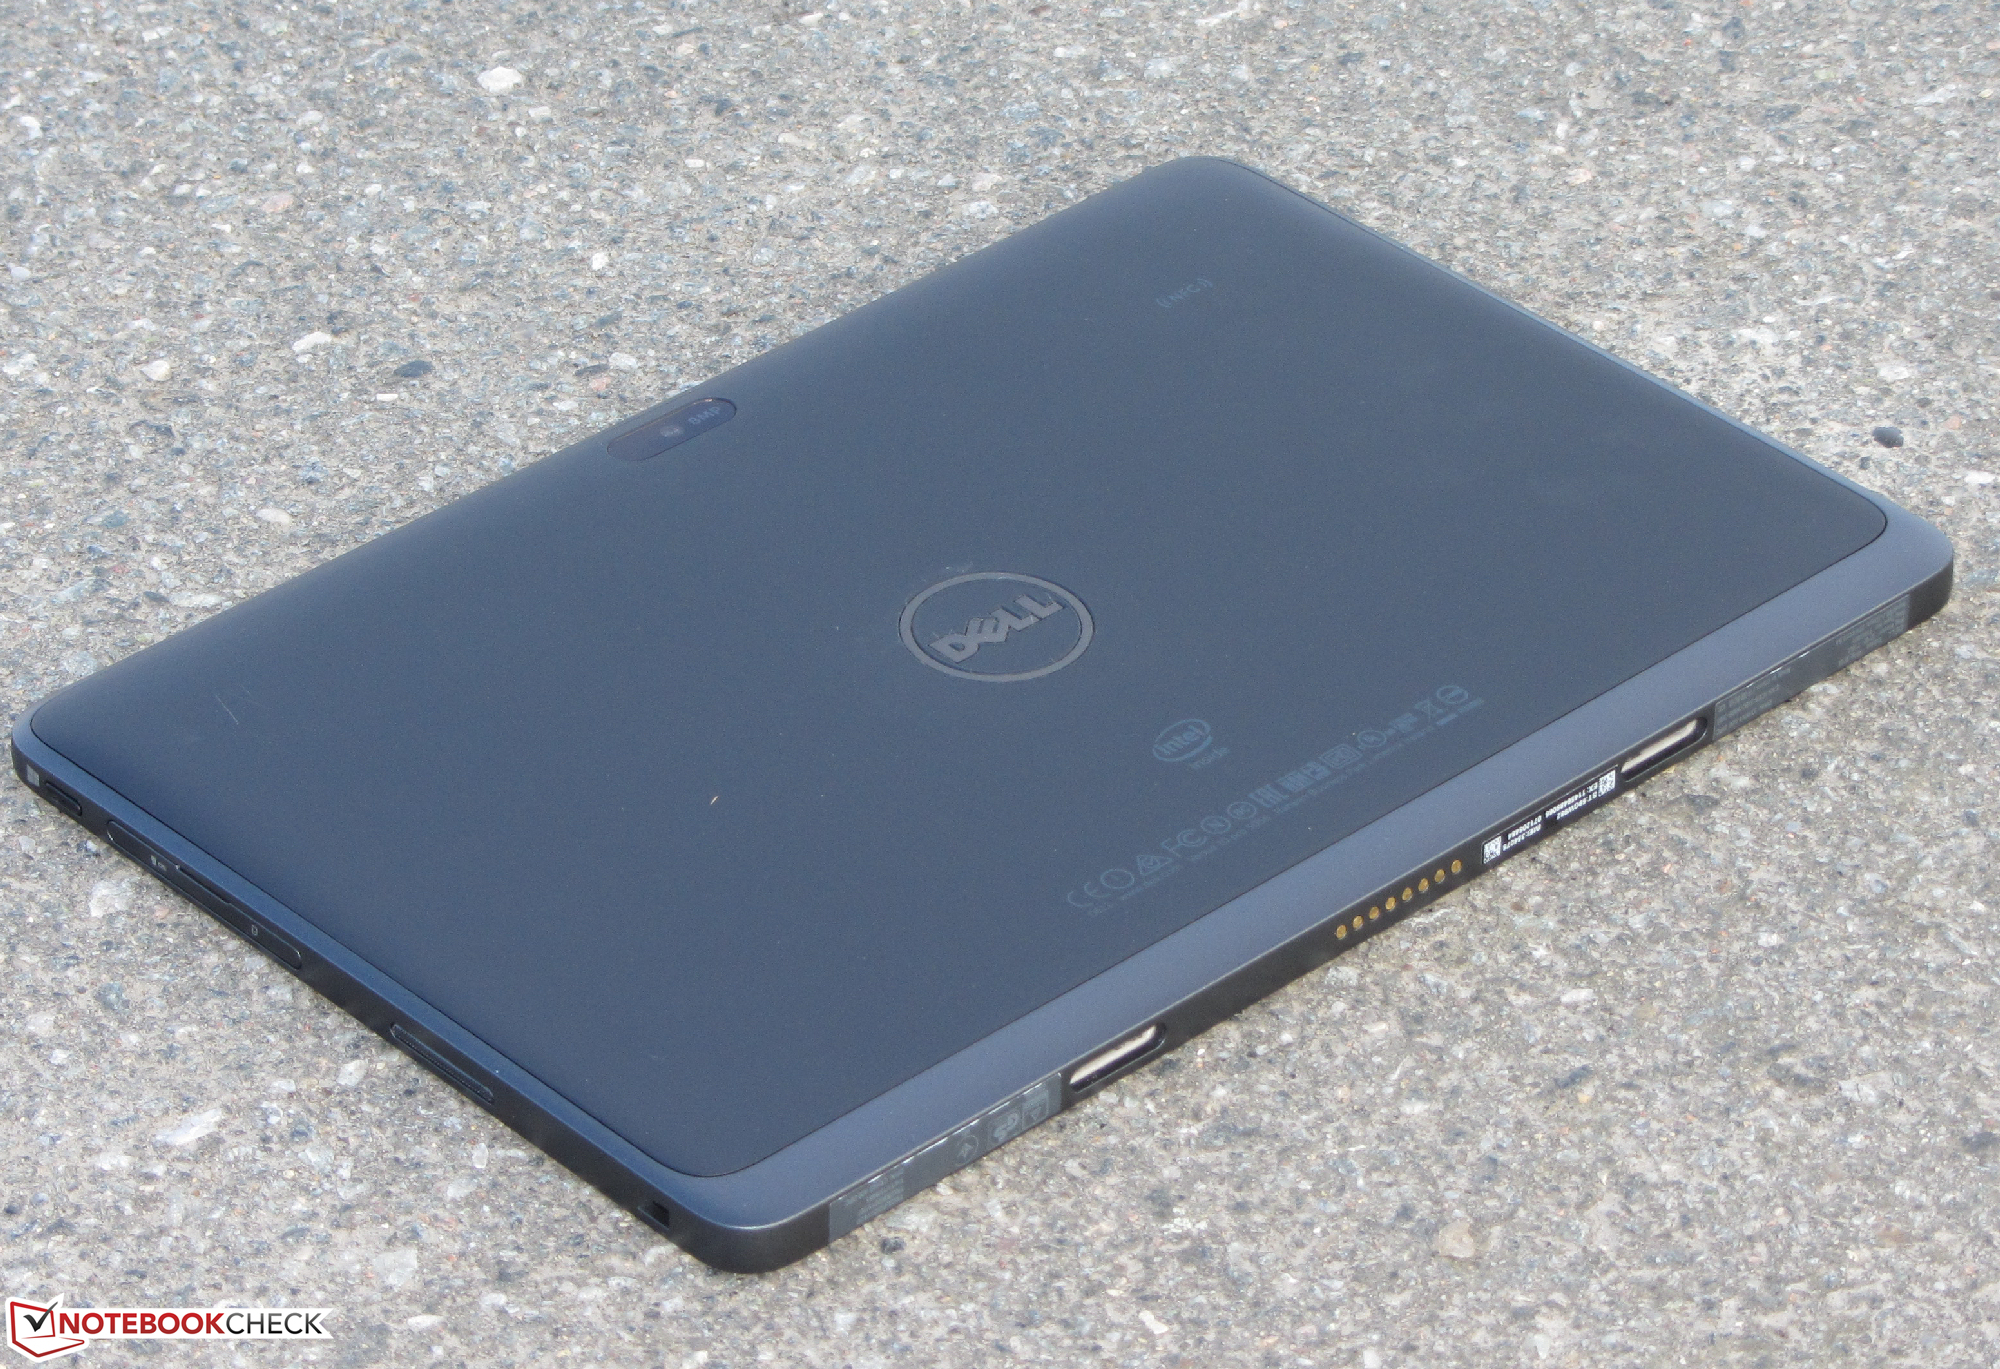
Breve análisis del Tablet Dell Venue 10 Pro (5056)
Comparación de Imágenes
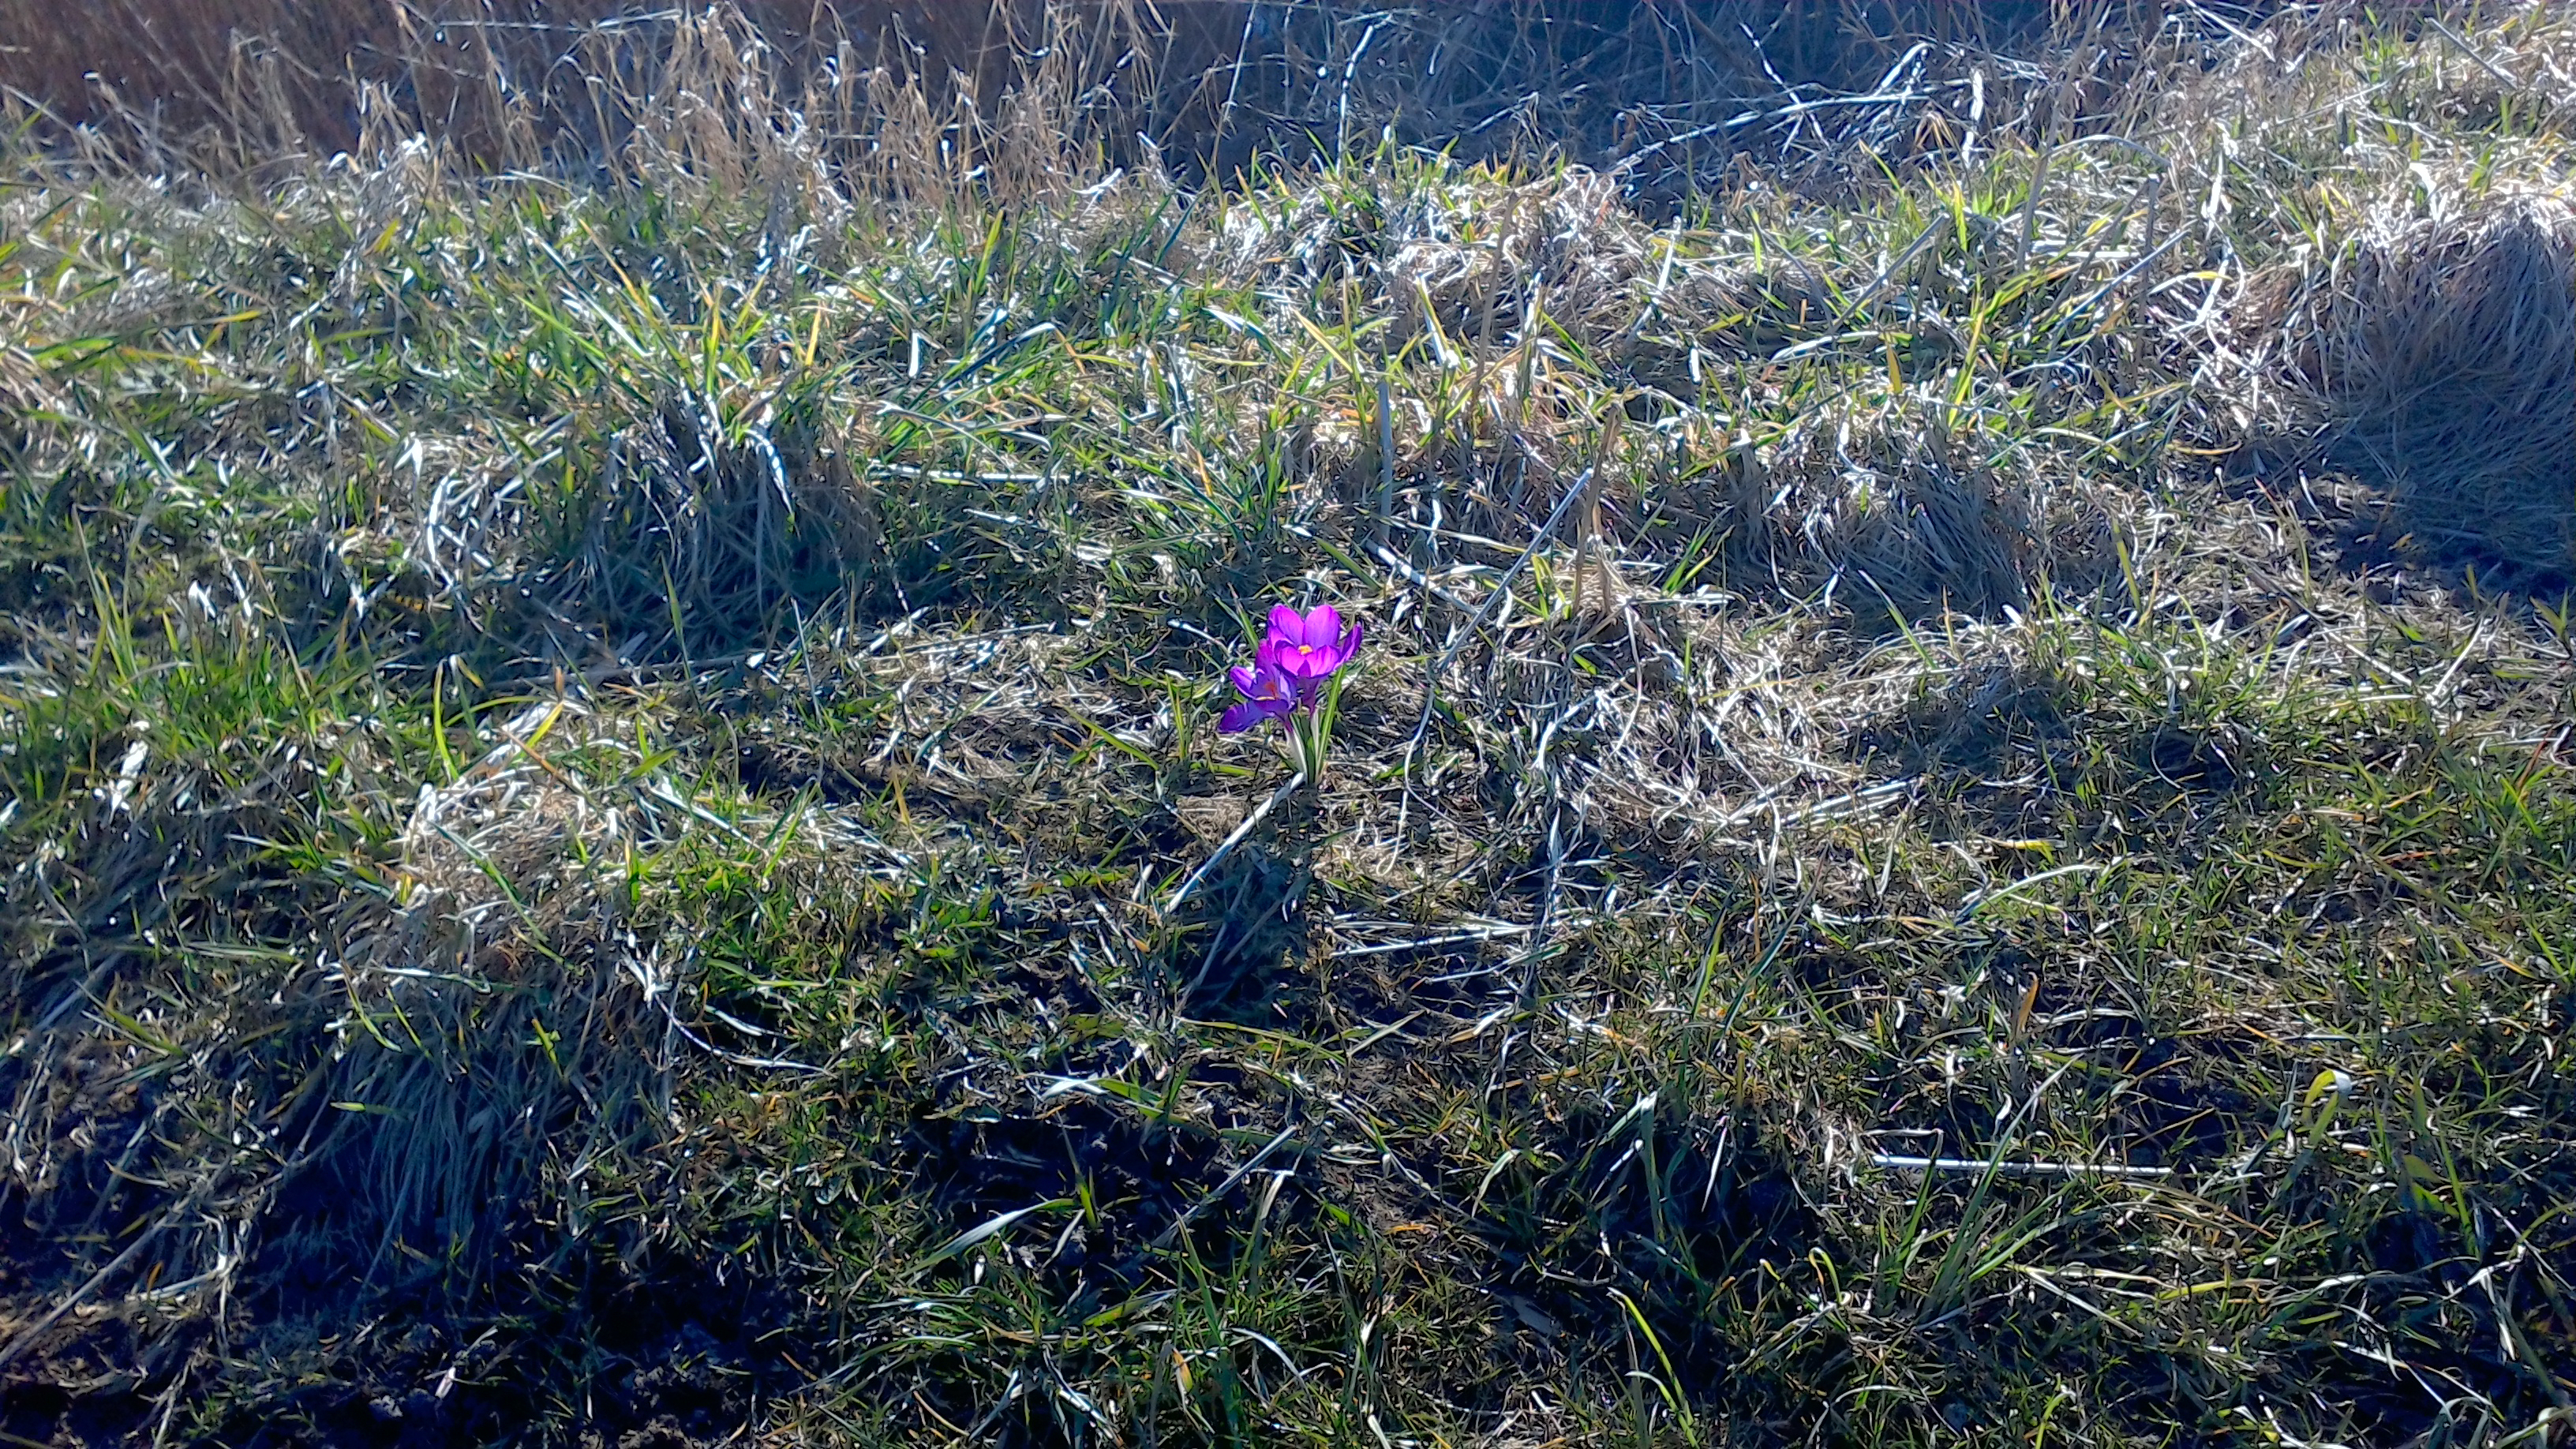
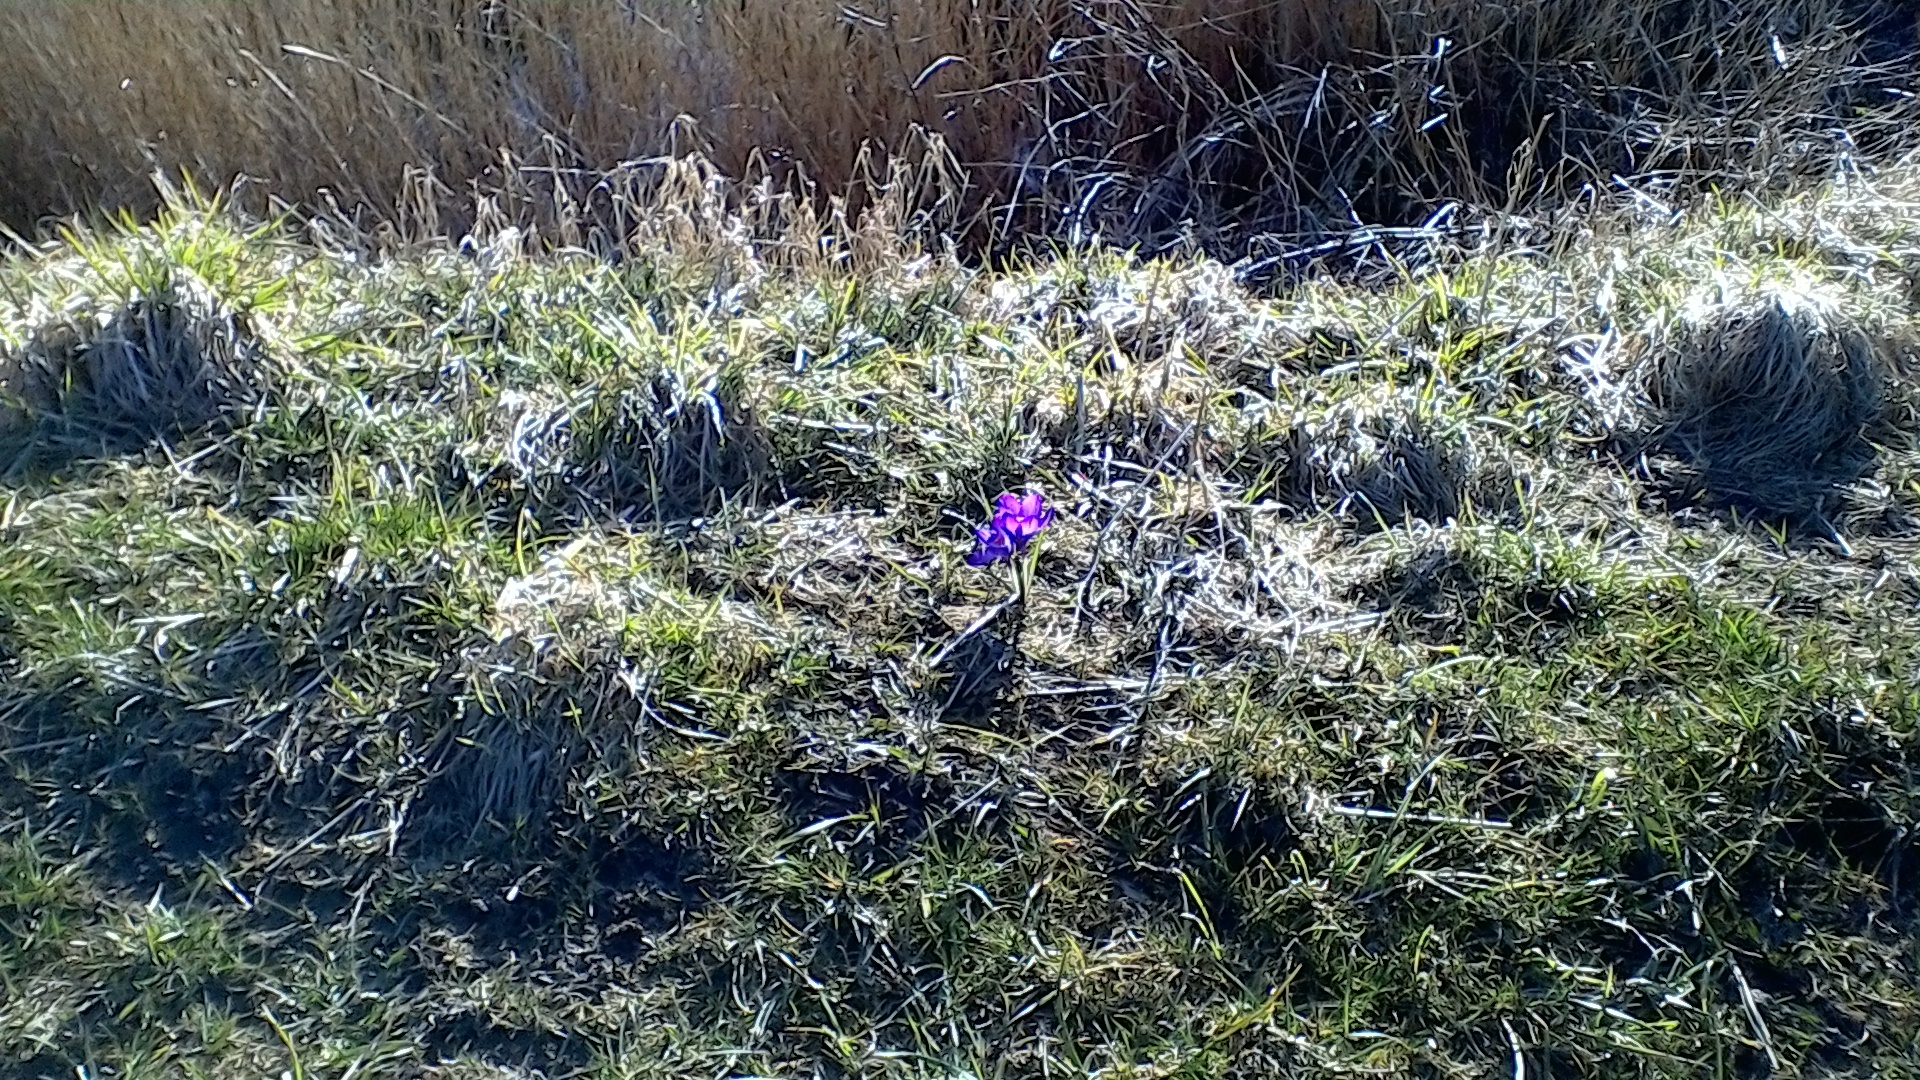
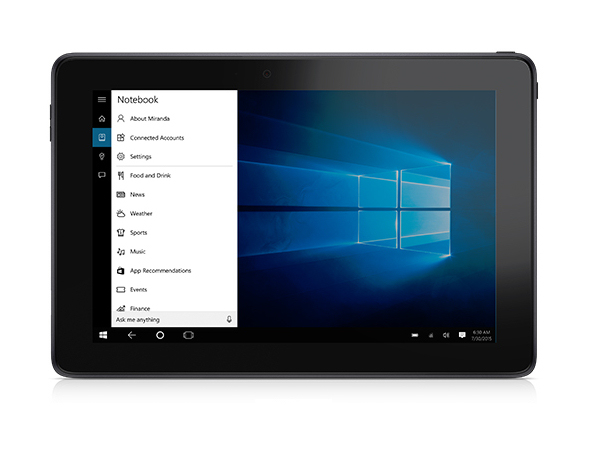
Elige una escena y navega dentro de la primera imagen. Un click cambia el nivel de zoom. Un click en la imagen aumentada abre la original en una ventana nueva. La primera imagen muestra la fotografía escalada del dispositivo de pruebas.

| |||||||||||||||||||||||||
iluminación: 91 %
Brillo con batería: 365 cd/m²
Contraste: 1521:1 (Negro: 0.24 cd/m²)
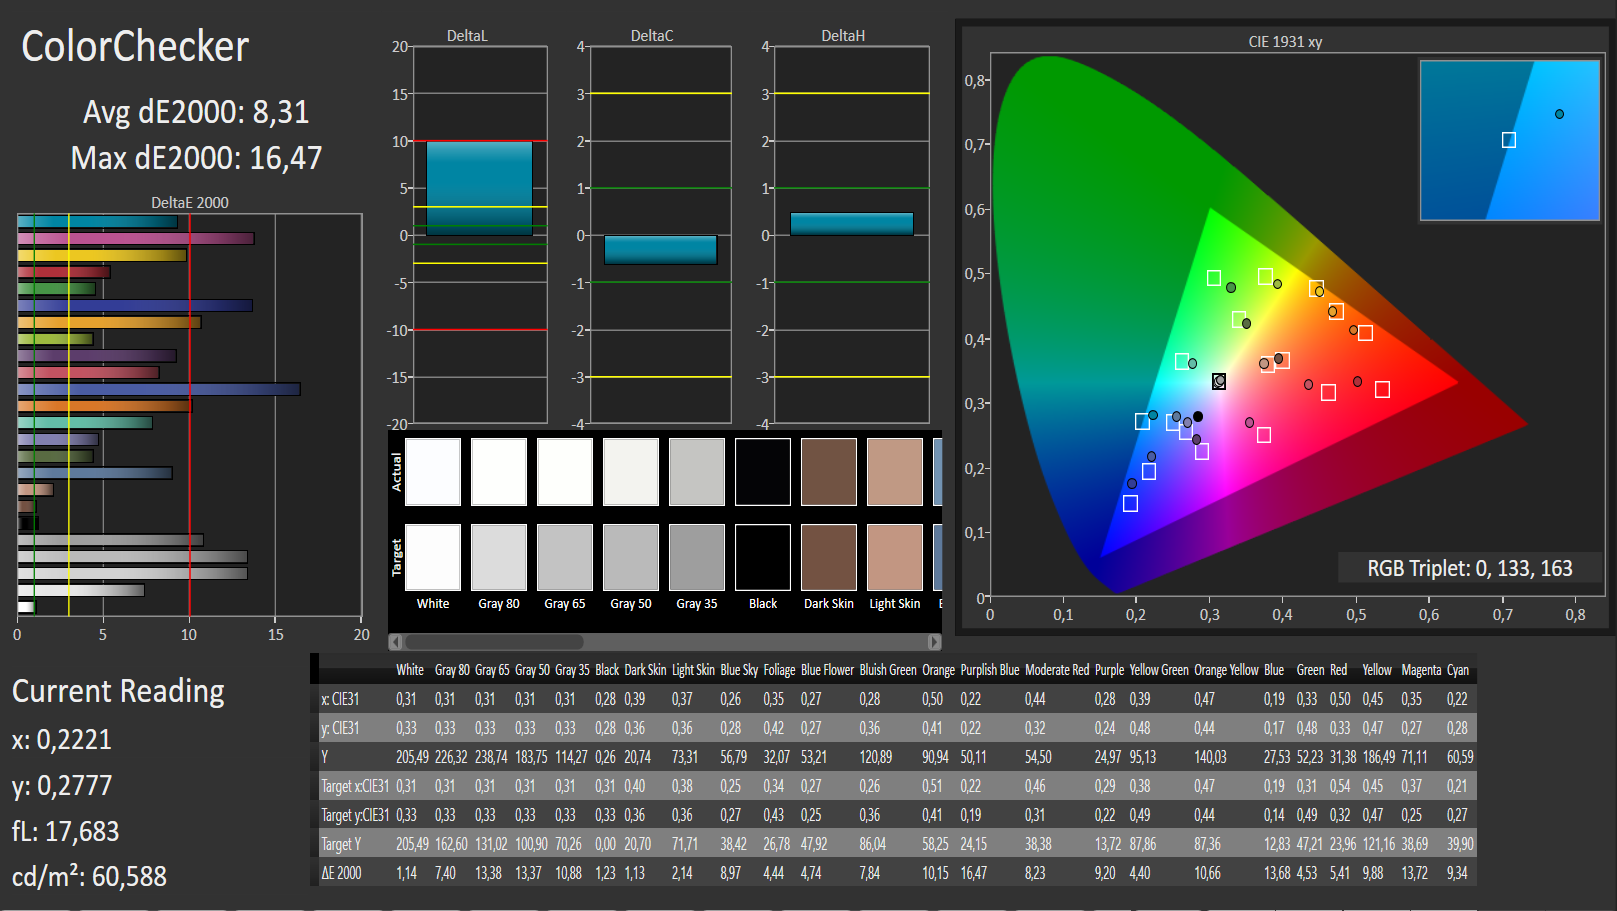
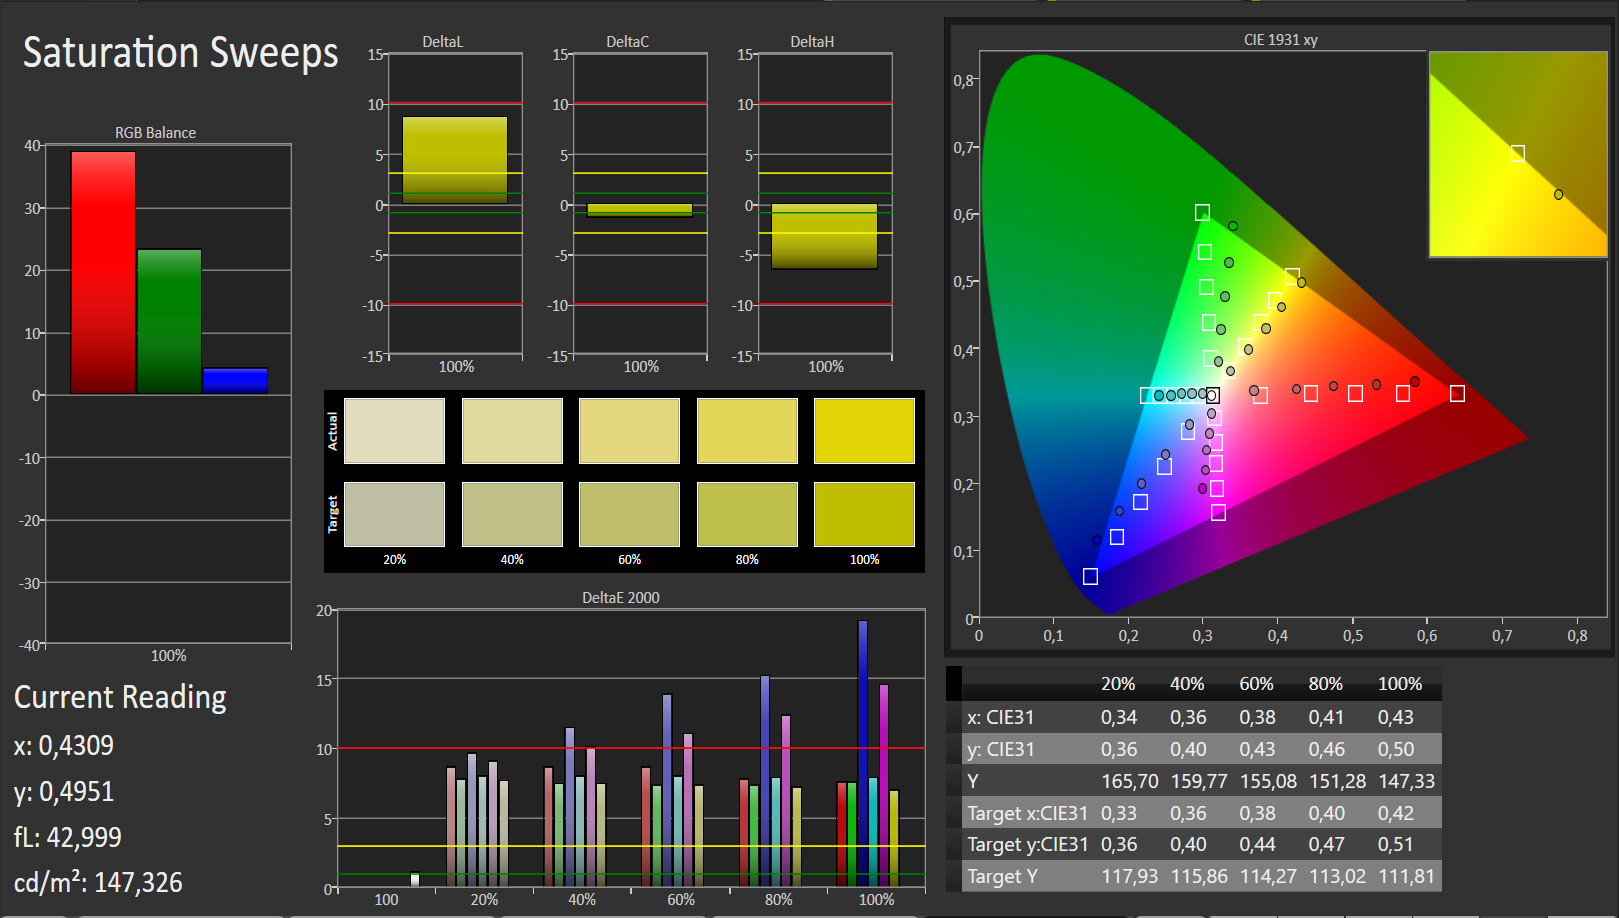
ΔE ColorChecker Calman: 8.31 | ∀{0.5-29.43 Ø4.72}
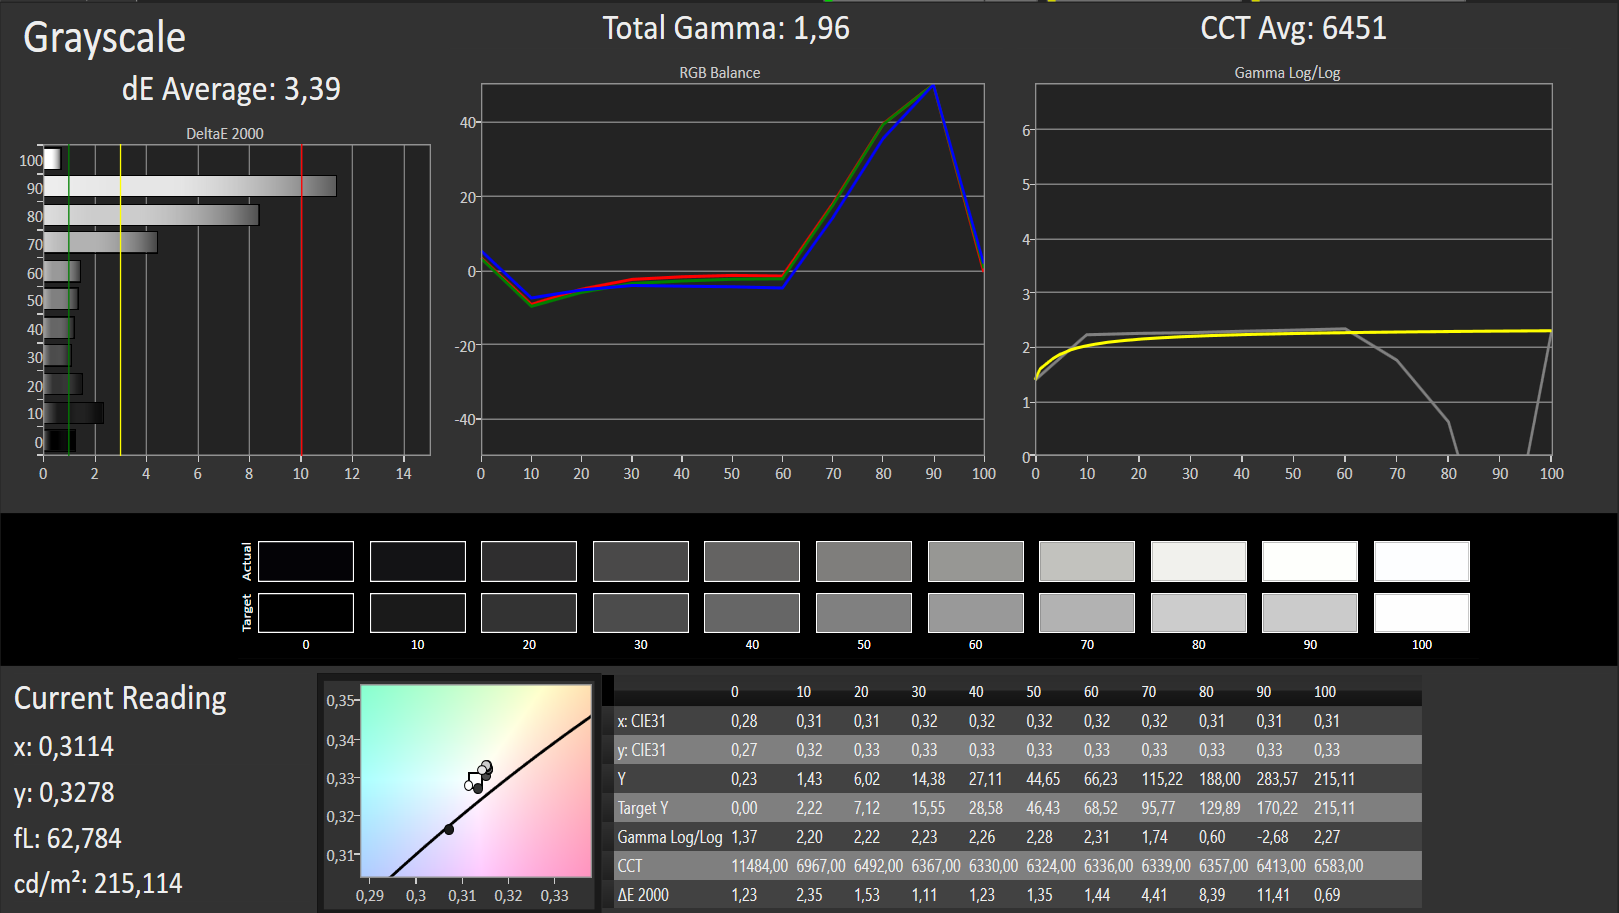
ΔE Greyscale Calman: 3.39 | ∀{0.09-98 Ø4.97}
60% sRGB (Argyll 1.6.3 3D)
38% AdobeRGB 1998 (Argyll 1.6.3 3D)
41.72% AdobeRGB 1998 (Argyll 3D)
60.7% sRGB (Argyll 3D)
40.38% Display P3 (Argyll 3D)
Gamma: 1.96
CCT: 6451 K
Parpadeo de Pantalla / PWM (Pulse-Width Modulation)
| Parpadeo de Pantalla / PWM no detectado | 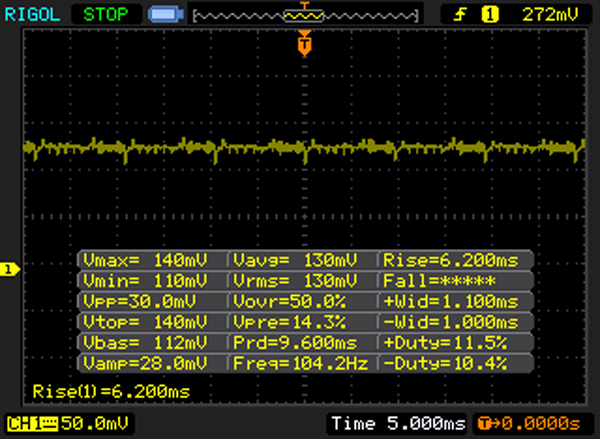 | ||
Comparación: 52 % de todos los dispositivos testados no usaron PWM para atenuar el display. Si se usó, medimos una media de 7781 (mínimo: 5 - máxmo: 343500) Hz. | |||
Tiempos de respuesta del display
| ↔ Tiempo de respuesta de Negro a Blanco | ||
|---|---|---|
| 26 ms ... subida ↗ y bajada ↘ combinada | ↗ 7 ms subida | 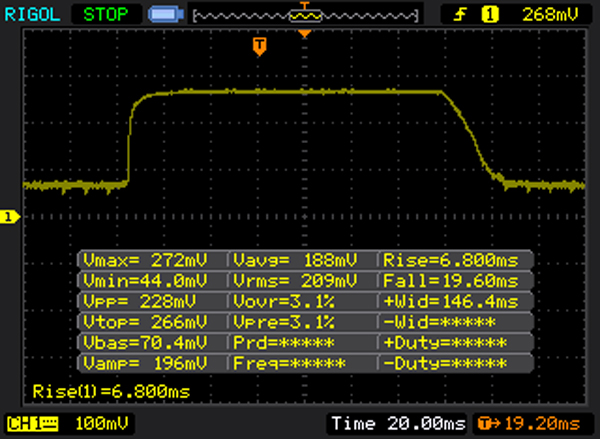 |
| ↘ 19 ms bajada | ||
| La pantalla mostró tiempos de respuesta relativamente lentos en nuestros tests pero podría ser demasiado lenta para los jugones. En comparación, todos los dispositivos de prueba van de ##min### (mínimo) a 240 (máximo) ms. » 62 % de todos los dispositivos son mejores. Eso quiere decir que el tiempo de respuesta es peor que la media (19.8 ms) de todos los dispositivos testados. | ||
| ↔ Tiempo de respuesta 50% Gris a 80% Gris | ||
| 30 ms ... subida ↗ y bajada ↘ combinada | ↗ 14 ms subida | 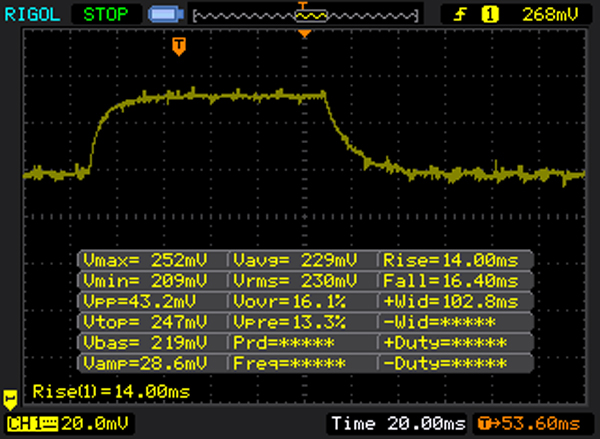 |
| ↘ 16 ms bajada | ||
| La pantalla mostró tiempos de respuesta lentos en nuestros tests y podría ser demasiado lenta para los jugones. En comparación, todos los dispositivos de prueba van de ##min### (mínimo) a 636 (máximo) ms. » 40 % de todos los dispositivos son mejores. Eso quiere decir que el tiempo de respuesta es similar al dispositivo testado medio (31 ms). | ||
| Dell Venue 10 Pro 5056 IPS, 1920x1200 | Dell Venue 10 Pro 5055 IPS, 1920x1200 | Apple iPad Air 2 2014 IPS, 2048x1536 | Google Pixel C LTPS, 2560x1800 | Lenovo Thinkpad Tablet 10 2nd Gen IPS, 1920x1200 | Amazon Fire HD 10 inch 2015 IPS, 1280x800 | Asus Transformer Book T100HA-C4-GR IPS, 1280x800 | Samsung Galaxy Tab S2 9.7 LTE Super AMOLED, 2048x1536 | Samsung Galaxy Tab A 9.7 SM-T555 TFT, 1024x768 | |
|---|---|---|---|---|---|---|---|---|---|
| Display | 18% | 26% | |||||||
| Display P3 Coverage (%) | 40.38 | 48.01 19% | 52.8 31% | ||||||
| sRGB Coverage (%) | 60.7 | 70.6 16% | 73 20% | ||||||
| AdobeRGB 1998 Coverage (%) | 41.72 | 49.79 19% | 53.3 28% | ||||||
| Response Times | -39% | ||||||||
| Response Time Grey 50% / Grey 80% * (ms) | 30 ? | 42 ? -40% | |||||||
| Response Time Black / White * (ms) | 26 ? | 36 ? -38% | |||||||
| PWM Frequency (Hz) | |||||||||
| Screen | -22% | 8% | -14% | -15% | -7% | 18% | 27% | -17% | |
| Brightness middle (cd/m²) | 365 | 436 19% | 423 16% | 487 33% | 345 -5% | 458 25% | 480.2 32% | 358 -2% | 394 8% |
| Brightness (cd/m²) | 348 | 418 20% | 427 23% | 510 47% | 337 -3% | 434 25% | 455 31% | 357 3% | 392 13% |
| Brightness Distribution (%) | 91 | 92 1% | 92 1% | 91 0% | 94 3% | 86 -5% | 85 -7% | 86 -5% | 80 -12% |
| Black Level * (cd/m²) | 0.24 | 0.58 -142% | 0.61 -154% | 0.39 -63% | 0.43 -79% | 0.43 -79% | 0.324 -35% | 0.51 -113% | |
| Contrast (:1) | 1521 | 752 -51% | 693 -54% | 1249 -18% | 802 -47% | 1065 -30% | 1482 -3% | 773 -49% | |
| Colorchecker dE 2000 * | 8.31 | 5.17 38% | 2.86 66% | 5.24 37% | 5.86 29% | 4.18 50% | 3.45 58% | 1.78 79% | 3.59 57% |
| Colorchecker dE 2000 max. * | 16.47 | ||||||||
| Greyscale dE 2000 * | 3.39 | 4.68 -38% | 2.37 30% | 7.95 -135% | 5.63 -66% | 4.54 -34% | 2.67 21% | 1.38 59% | 4.25 -25% |
| Gamma | 1.96 112% | 2.31 95% | 2.43 91% | 2.16 102% | 2.33 94% | 2.15 102% | 2.34 94% | 2.24 98% | 2.56 86% |
| CCT | 6451 101% | 6652 98% | 6941 94% | 6565 99% | 6533 99% | 7083 92% | 6164 105% | 6366 102% | 7148 91% |
| Color Space (Percent of AdobeRGB 1998) (%) | 38 | 88 132% | 45.7 20% | 47.28 24% | |||||
| Color Space (Percent of sRGB) (%) | 60 | 70.1 17% | 84.38 41% | ||||||
| Media total (Programa/Opciones) | -22% /
-22% | 8% /
8% | -27% /
-20% | 2% /
-6% | -7% /
-7% | 22% /
20% | 27% /
27% | -17% /
-17% |
* ... más pequeño es mejor
| JetStream 1.1 - 1.1 Total (ordenar por valor) | |
| Dell Venue 10 Pro 5056 | |
| HP Pro Tablet 10 EE G1 | |
| Google Pixel C | |
| Lenovo Yoga Tab 3 Pro 10 YT3-X90L | |
| Samsung Galaxy Tab S2 9.7 LTE | |
| Peacekeeper - --- (ordenar por valor) | |
| Dell Venue 10 Pro 5056 | |
| Dell Venue 10 Pro 5055 | |
| HP Pro Tablet 10 EE G1 | |
| Apple iPad Air 2 2014 | |
| Browsermark - 2.1 (ordenar por valor) | |
| Dell Venue 10 Pro 5056 | |
| Apple iPad Air 2 2014 | |
| Google Pixel C | |
* ... más pequeño es mejor
| 3DMark 11 - 1280x720 Performance (ordenar por valor) | |
| Dell Venue 10 Pro 5056 | |
| Dell Venue 10 Pro 5055 | |
| HP Pro Tablet 10 EE G1 | |
| Lenovo Thinkpad Tablet 10 2nd Gen | |
| Asus Transformer Book T100HA-C4-GR | |
| 3DMark - 1280x720 Ice Storm Standard Score (ordenar por valor) | |
| Dell Venue 10 Pro 5056 | |
| HP Pro Tablet 10 EE G1 | |
| Google Pixel C | |
| Lenovo Thinkpad Tablet 10 2nd Gen | |
| Asus Transformer Book T100HA-C4-GR | |
| 3DMark 06 - 1280x1024 Standard Score AA:0x AF:0x (ordenar por valor) | |
| Dell Venue 10 Pro 5056 | |
| Asus Transformer Book T100HA-C4-GR | |
| GFXBench | |
| on screen Car Chase Onscreen (ordenar por valor) | |
| Dell Venue 10 Pro 5056 | |
| Google Pixel C | |
| Lenovo Yoga Tab 3 Pro 10 YT3-X90L | |
| 1920x1080 Car Chase Offscreen (ordenar por valor) | |
| Dell Venue 10 Pro 5056 | |
| Google Pixel C | |
| Lenovo Yoga Tab 3 Pro 10 YT3-X90L | |
| GFXBench 3.1 | |
| on screen Manhattan ES 3.1 Onscreen (ordenar por valor) | |
| Dell Venue 10 Pro 5056 | |
| Apple iPad Air 2 2014 | |
| Google Pixel C | |
| Amazon Fire HD 10 inch 2015 | |
| Lenovo Yoga Tab 3 Pro 10 YT3-X90L | |
| 1920x1080 Manhattan ES 3.1 Offscreen (ordenar por valor) | |
| Dell Venue 10 Pro 5056 | |
| Apple iPad Air 2 2014 | |
| Google Pixel C | |
| Amazon Fire HD 10 inch 2015 | |
| Lenovo Yoga Tab 3 Pro 10 YT3-X90L | |
| GFXBench 3.0 | |
| on screen Manhattan Onscreen OGL (ordenar por valor) | |
| Dell Venue 10 Pro 5056 | |
| Apple iPad Air 2 2014 | |
| Google Pixel C | |
| LG G Pad II 10.1 | |
| Amazon Fire HD 10 inch 2015 | |
| Lenovo Yoga Tab 3 Pro 10 YT3-X90L | |
| 1920x1080 1080p Manhattan Offscreen (ordenar por valor) | |
| Dell Venue 10 Pro 5056 | |
| Apple iPad Air 2 2014 | |
| Google Pixel C | |
| LG G Pad II 10.1 | |
| Amazon Fire HD 10 inch 2015 | |
| Lenovo Yoga Tab 3 Pro 10 YT3-X90L | |
| bajo | medio | alto | ultra | |
|---|---|---|---|---|
| Trackmania Nations Forever (2008) | 128 | 29.2 | 16.8 | |
| Tomb Raider (2013) | 25.7 | 12 | 8.3 | 3.7 |
| BioShock Infinite (2013) | 20.1 | 9.3 | 7.6 | 2.4 |
| Dragon Age: Inquisition (2014) | 9.5 | 5.7 | ||
| Dirt Rally (2015) | 20.1 | 12.5 | ||
| Metal Gear Solid V (2015) | 15.1 | 9.8 | ||
| Anno 2205 (2015) | 8.1 | 3.9 | ||
| Star Wars Battlefront (2015) | 8.8 | 4.8 | ||
| Rainbow Six Siege (2015) | 11.5 | 7 |
(±) La temperatura máxima en la parte superior es de 42.2 °C / 108 F, frente a la media de 33.6 °C / 92 F, que oscila entre 20.7 y 53.2 °C para la clase Tablet.
(-) El fondo se calienta hasta un máximo de 50.2 °C / 122 F, frente a la media de 33.2 °C / 92 F
(+) En reposo, la temperatura media de la parte superior es de 28.6 °C / 83# F, frente a la media del dispositivo de 30 °C / 86 F.
| Dell Venue 10 Pro 5056 Z8500, HD Graphics (Cherry Trail) | Dell Venue 10 Pro 5055 Z3735F, HD Graphics (Bay Trail) | HP Pro Tablet 10 EE G1 Z3735F, HD Graphics (Bay Trail) | Apple iPad Air 2 2014 A8X, PowerVR GXA6850 | Google Pixel C X1, Tegra X1 Maxwell GPU | Lenovo Thinkpad Tablet 10 2nd Gen Z8700, HD Graphics (Cherry Trail) | Amazon Fire HD 10 inch 2015 MT8135, PowerVR G6200 | Asus Transformer Book T100HA-C4-GR Z8500, HD Graphics (Cherry Trail) | Samsung Galaxy Tab S2 9.7 LTE Exynos 5433, Mali-T760 MP6 | Samsung Galaxy Tab A 9.7 SM-T555 410 APQ8016, Adreno 306 | |
|---|---|---|---|---|---|---|---|---|---|---|
| Heat | -8% | 6% | 9% | 11% | -1% | 23% | 22% | 12% | 11% | |
| Maximum Upper Side * (°C) | 42.2 | 43.6 -3% | 39 8% | 36.2 14% | 42.3 -0% | 51 -21% | 30.4 28% | 35.2 17% | 40.8 3% | 37 12% |
| Maximum Bottom * (°C) | 50.2 | 47.6 5% | 44.9 11% | 42.8 15% | 36 28% | 55 -10% | 30.2 40% | 33.4 33% | 35.7 29% | 36.9 26% |
| Idle Upper Side * (°C) | 34.1 | 38 -11% | 31.1 9% | 31 9% | 31.8 7% | 27.1 21% | 29.8 13% | 27.6 19% | 31.2 9% | 33.7 1% |
| Idle Bottom * (°C) | 31.2 | 37.8 -21% | 33 -6% | 32 -3% | 28 10% | 29 7% | 28 10% | 25.8 17% | 29.1 7% | 29.8 4% |
* ... más pequeño es mejor
| Off / Standby | |
| Ocioso | |
| Carga |
|
Clave:
min: | |
| Dell Venue 10 Pro 5056 Z8500, HD Graphics (Cherry Trail) | Dell Venue 10 Pro 5055 Z3735F, HD Graphics (Bay Trail) | HP Pro Tablet 10 EE G1 Z3735F, HD Graphics (Bay Trail) | Apple iPad Air 2 2014 A8X, PowerVR GXA6850 | Google Pixel C X1, Tegra X1 Maxwell GPU | Lenovo Thinkpad Tablet 10 2nd Gen Z8700, HD Graphics (Cherry Trail) | Amazon Fire HD 10 inch 2015 MT8135, PowerVR G6200 | Samsung Galaxy Tab S2 9.7 LTE Exynos 5433, Mali-T760 MP6 | Samsung Galaxy Tab A 9.7 SM-T555 410 APQ8016, Adreno 306 | |
|---|---|---|---|---|---|---|---|---|---|
| Power Consumption | 12% | 5% | 28% | 22% | 11% | 48% | 23% | 44% | |
| Idle Minimum * (Watt) | 3.2 | 2.8 13% | 3.5 -9% | 1.2 63% | 1.82 43% | 2.4 25% | 1.24 61% | 2.3 28% | 1.1 66% |
| Idle Average * (Watt) | 6 | 5.4 10% | 5.5 8% | 5.1 15% | 4.26 29% | 5.1 15% | 3.81 36% | 4.5 25% | 3.6 40% |
| Idle Maximum * (Watt) | 6.2 | 5.5 11% | 5.7 8% | 5.4 13% | 4.33 30% | 6 3% | 3.92 37% | 5 19% | 3.9 37% |
| Load Average * (Watt) | 14.5 | 10.9 25% | 10.7 26% | 7.9 46% | 9.82 32% | 14.7 -1% | 5.94 59% | 9.4 35% | 6.8 53% |
| Load Maximum * (Watt) | 11.2 | 11.1 1% | 12.2 -9% | 11.1 1% | 13.99 -25% | 5.94 47% | 10.4 7% | 8.4 25% |
* ... más pequeño es mejor
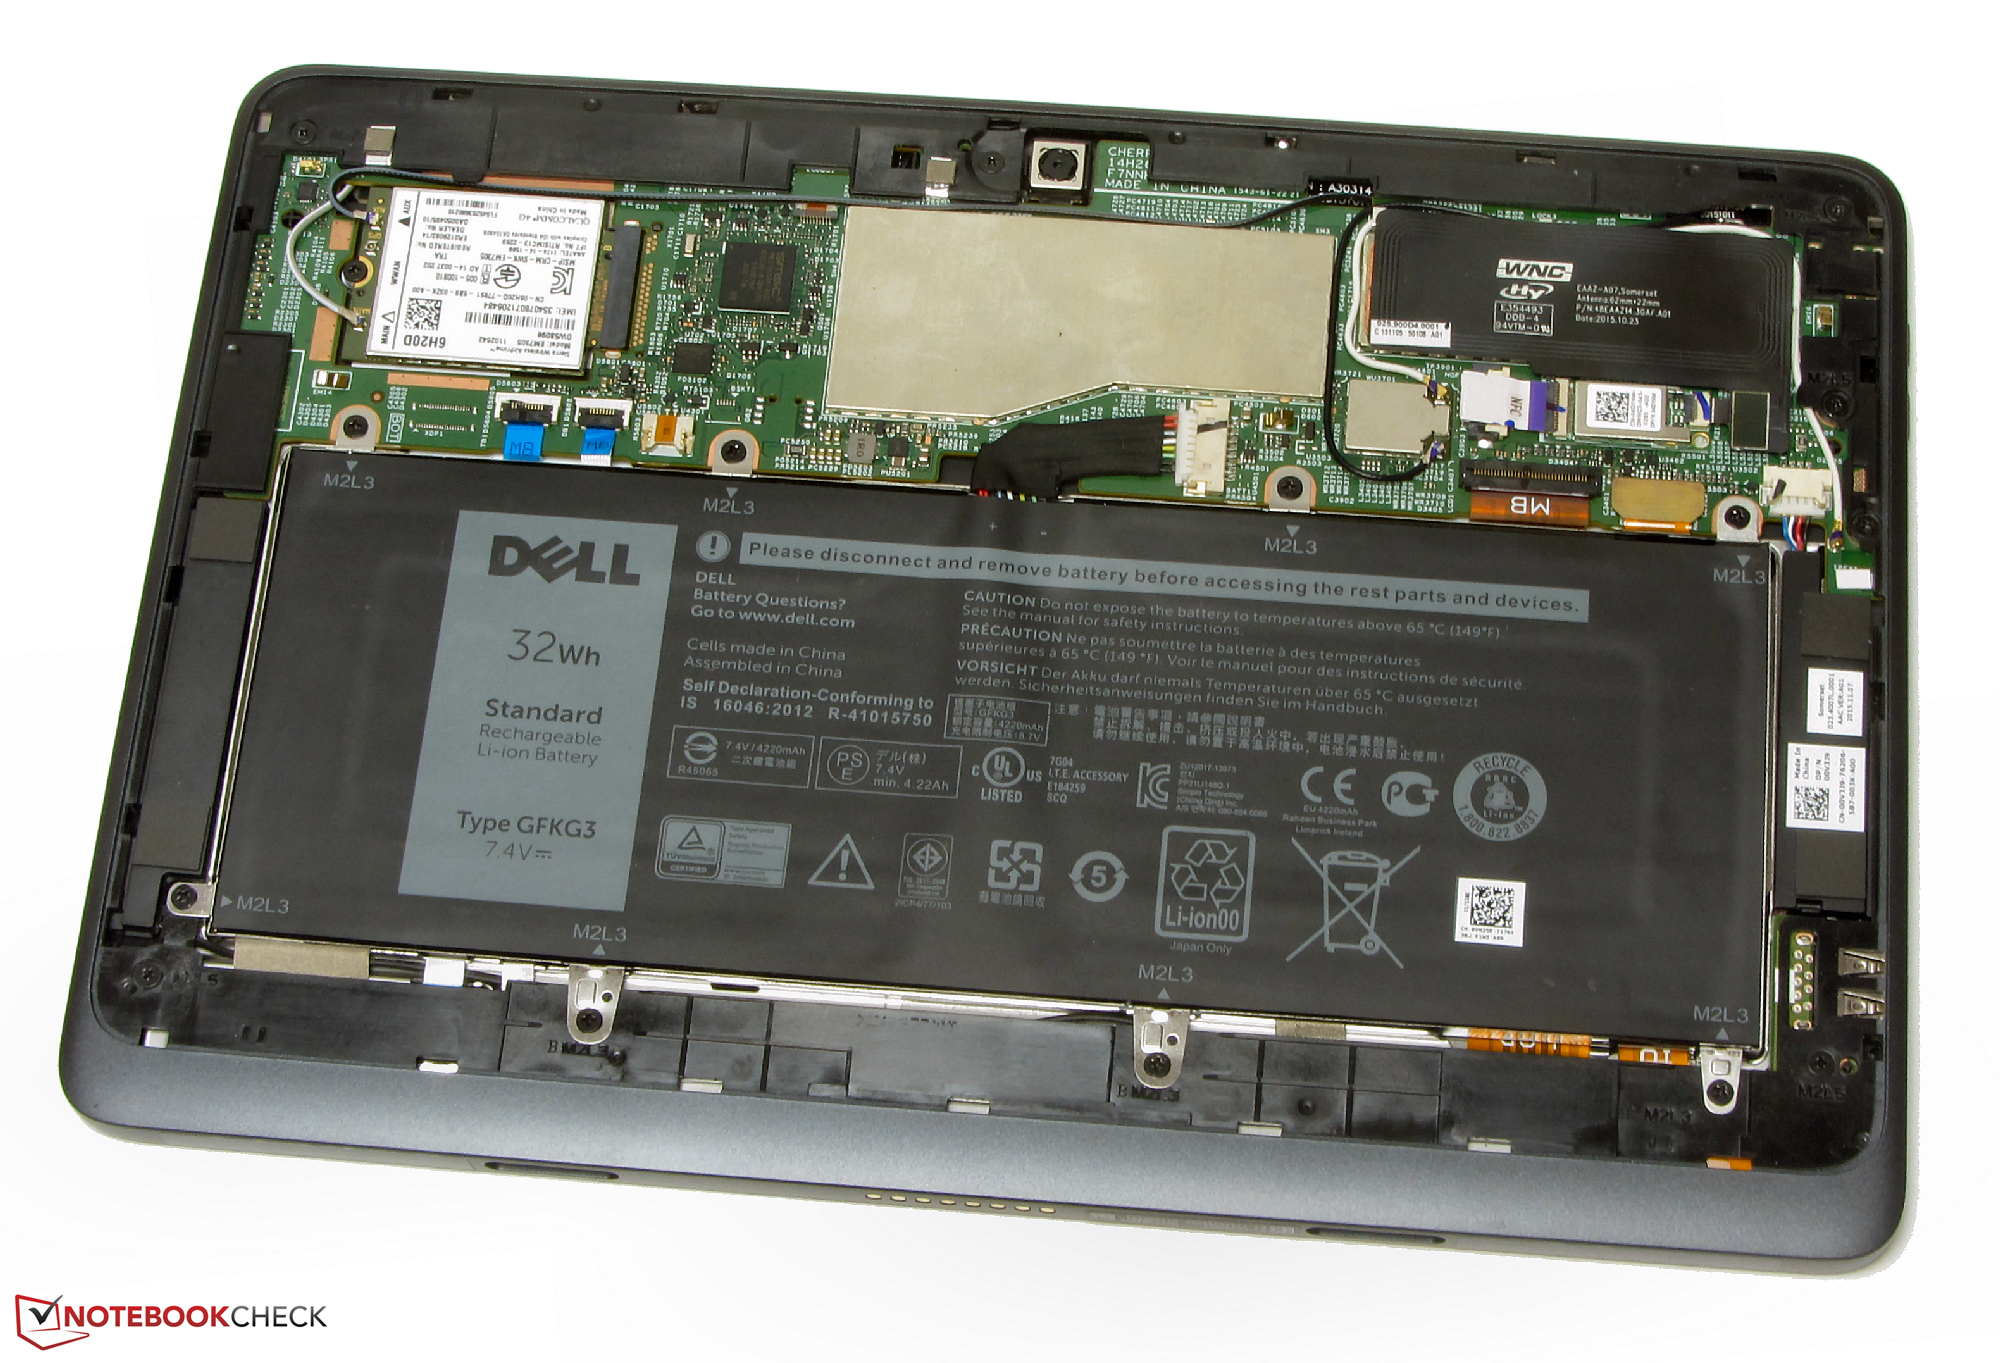
| Dell Venue 10 Pro 5056 32 Wh | Dell Venue 10 Pro 5055 32 Wh | Apple iPad Air 2 2014 28 Wh | Google Pixel C 34 Wh | Lenovo Thinkpad Tablet 10 2nd Gen 32 Wh | Amazon Fire HD 10 inch 2015 Wh | Lenovo Yoga Tab 3 Pro 10 YT3-X90L 23 Wh | Asus Transformer Book T100HA-C4-GR 30 Wh | Samsung Galaxy Tab S2 9.7 LTE 22 Wh | Samsung Galaxy Tab A 9.7 SM-T555 Wh | |
|---|---|---|---|---|---|---|---|---|---|---|
| Duración de Batería | -24% | 29% | 73% | 17% | 16% | 43% | 36% | 21% | 126% | |
| Reader / Idle (h) | 14.5 | 11.3 -22% | 22.7 57% | 34.8 140% | 14.4 -1% | 19 31% | 21 45% | 24.3 68% | 15.3 6% | 49.2 239% |
| H.264 (h) | 7.4 | 9.4 27% | 12.3 66% | 9.1 23% | 10.4 41% | 10.7 45% | 10.9 47% | |||
| WiFi v1.3 (h) | 7.5 | 10.6 41% | 7.5 0% | 7.5 0% | 9.3 24% | 9 20% | 6.6 -12% | 14.4 92% | ||
| Load (h) | 3.4 | 2.5 -26% | 3.5 3% | 4.9 44% | 5 47% | 3.1 -9% | 5.4 59% | 4.1 21% | 4.9 44% | 5 47% |
| WiFi (h) | 4.2 | 10.5 |
Pro
Contra
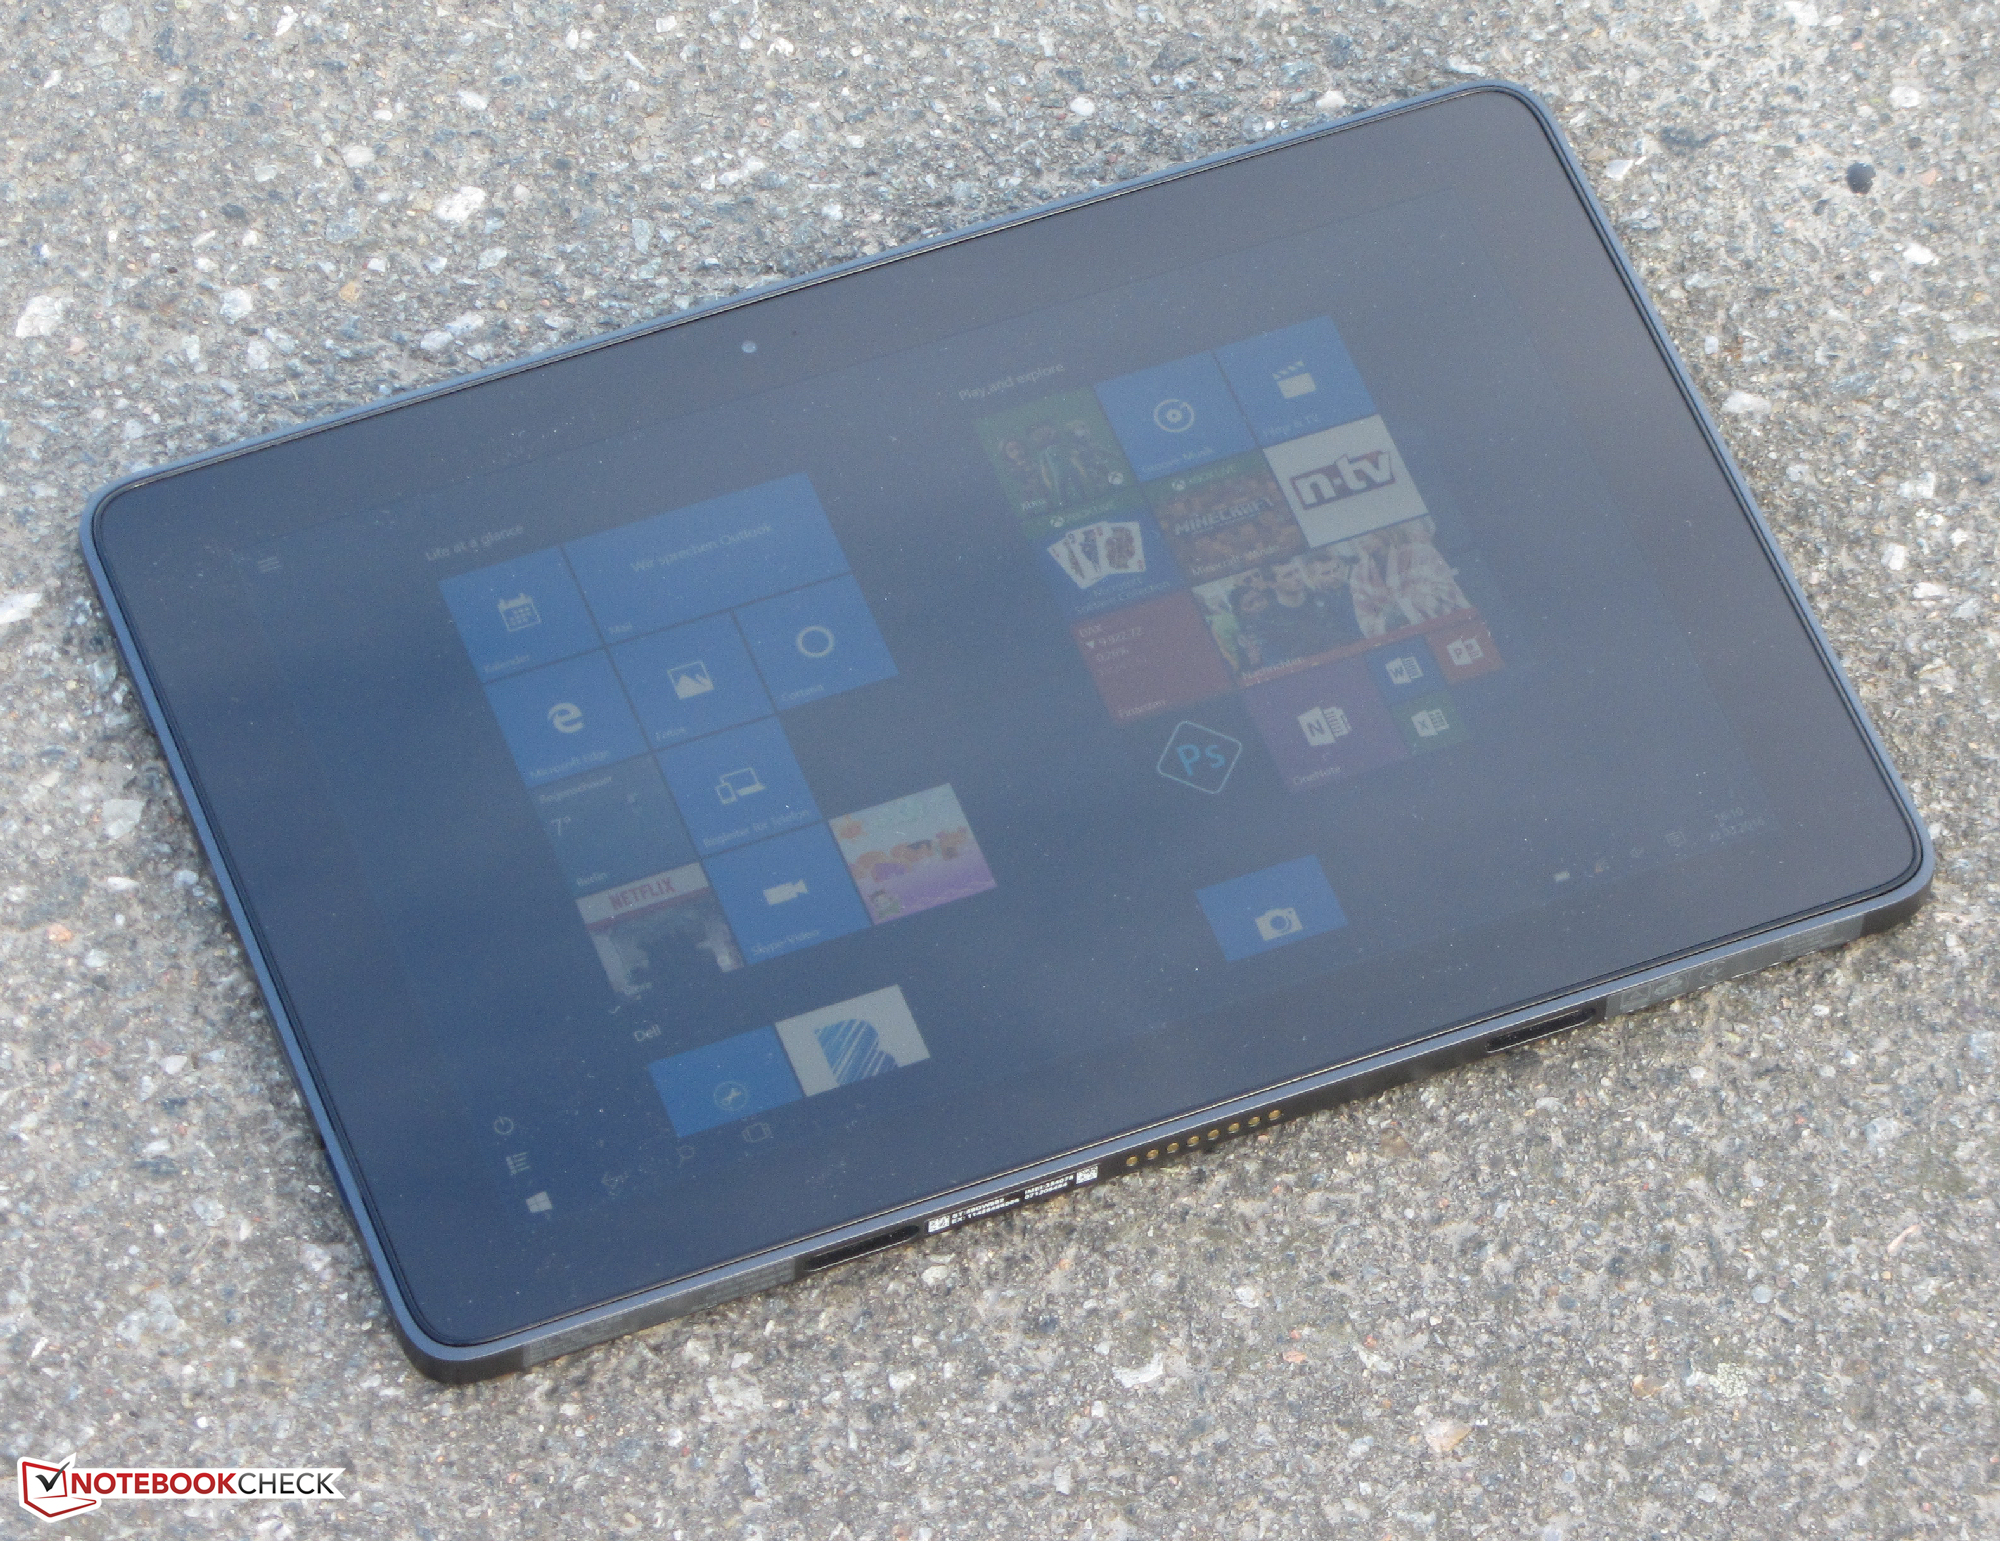
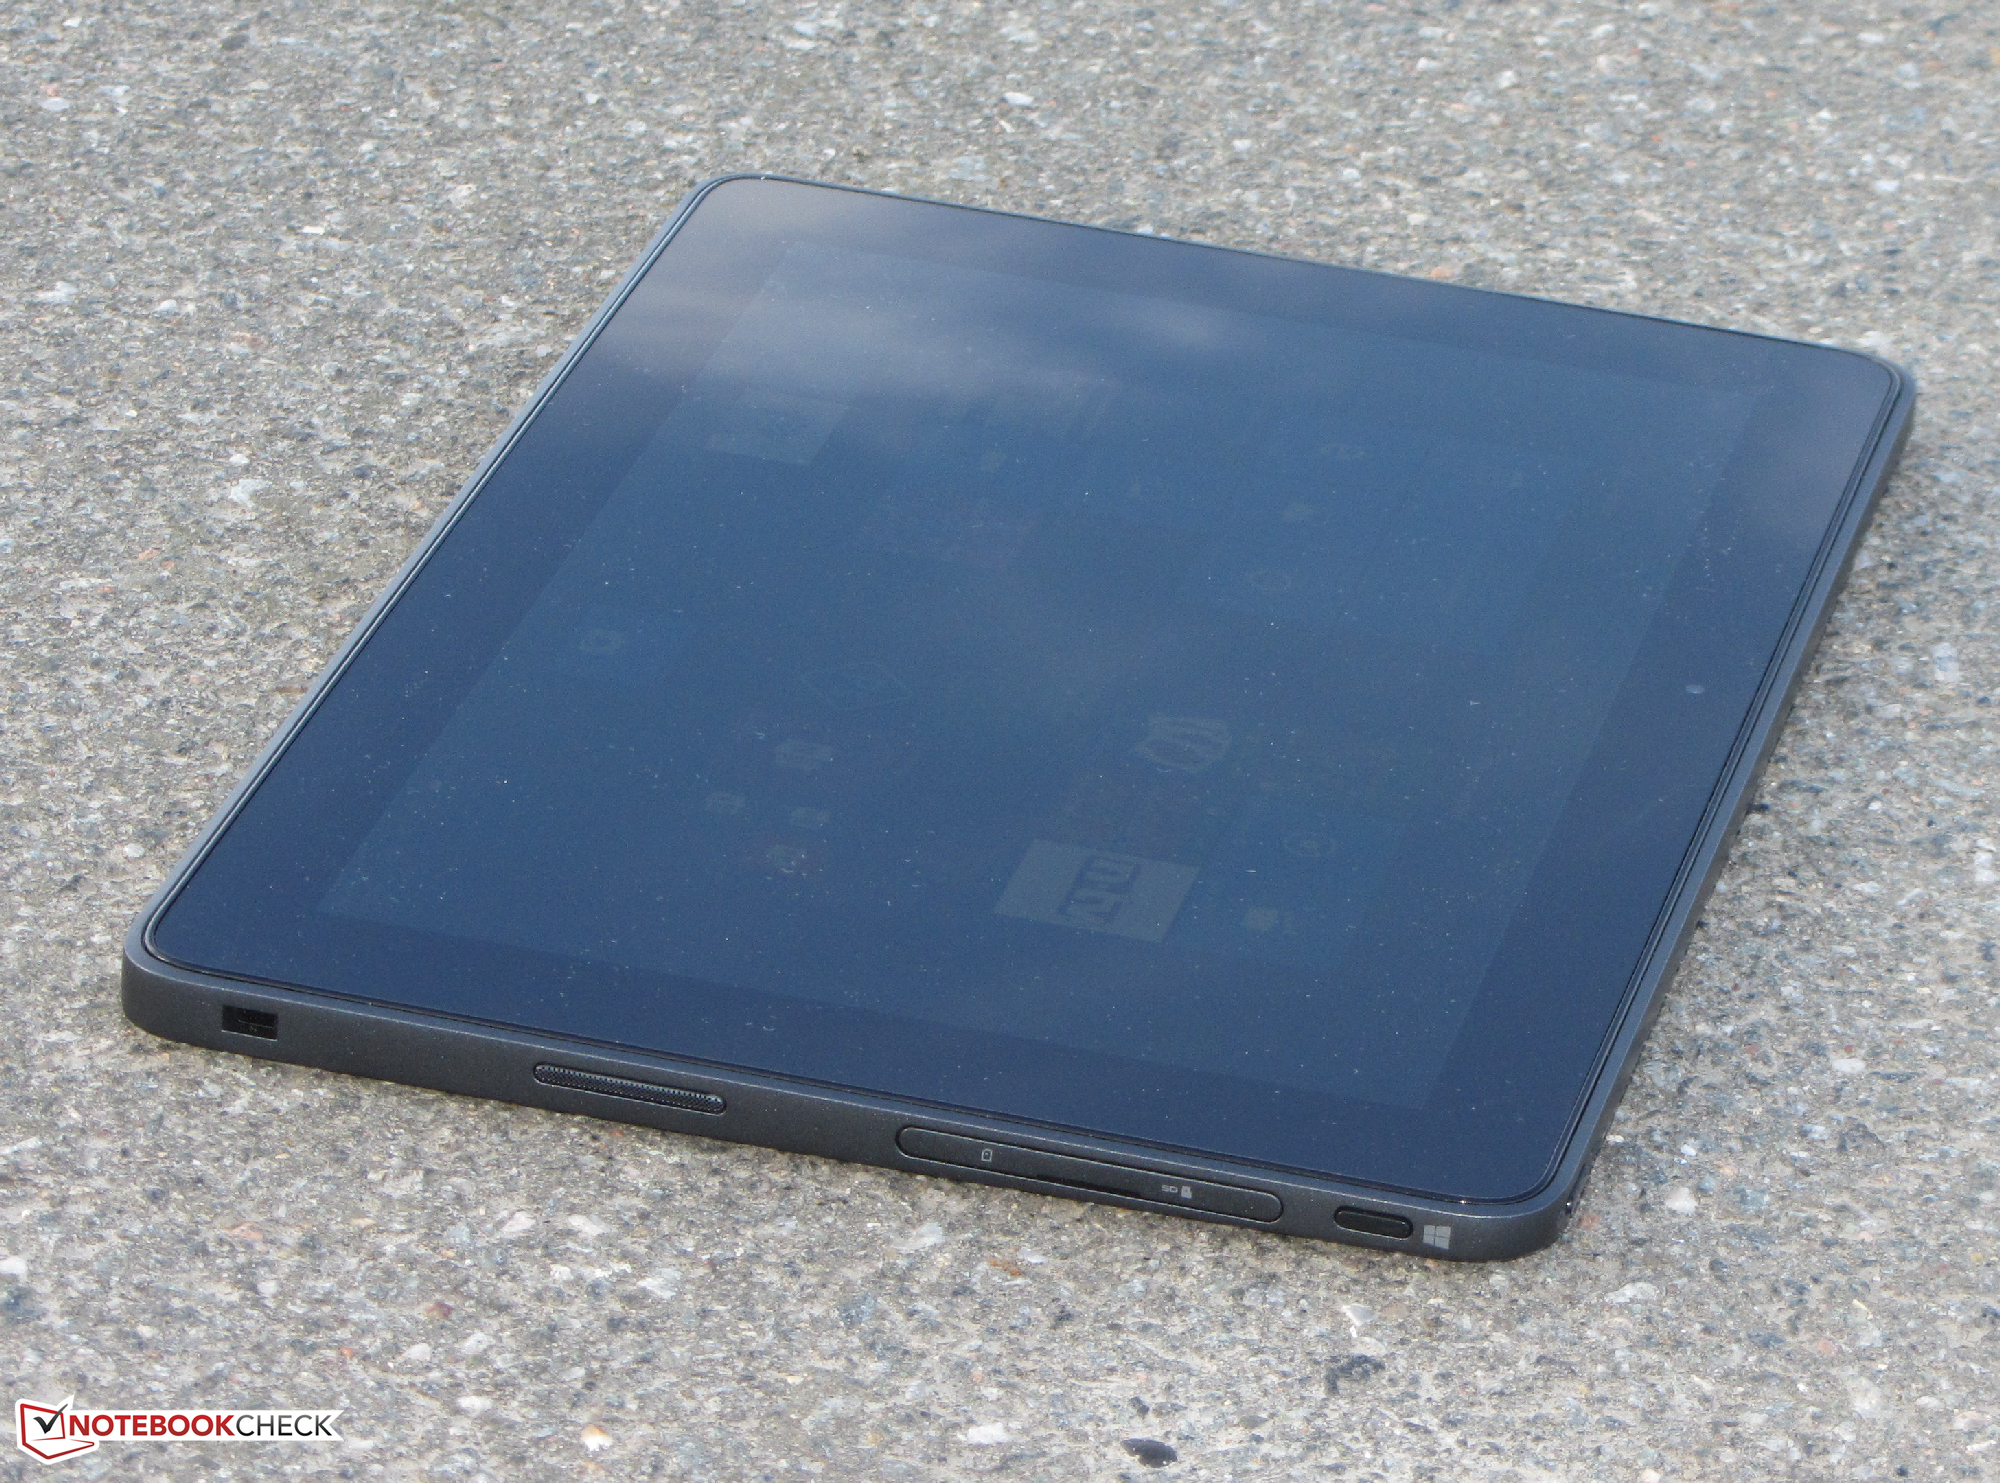
El Dell Venue 10 Pro es un sólido tablet Windows de 10.1". Como todos los tablets Windows, el Venue permite que el usuario instale use aplicaciones normales de escritorio. La CPU sólo puede manejar tareas sencillas como el procesado de textos y la navegación web. El disco flash eMMC de 128 GB ofrece amplio almacenamiento. También nos gusta el brillante display IPS con montones de contraste - aunque el display del Venue 10 Pro 5055 fue bastante más brillante. El aguante de la batería es muy decente.
La apariencia rigurosa no deja dudas de que es principalmente un dispositivo de clase business. El peso de 662 g es relativamente pesado. Con el teclado anclable opcional, el Venue pesa casi 1300 g - lo mismo que netbooks y subportátiles comparables.
A un precio de 800 Euros, el Venue 10 Pro no es precisamente una ganga.
Para el usuario doméstico el Venue no es una opción muy interesante. Eso es así hasta para la versión básica de 530 Euros. Los netbooks o tablets domésticas son una alternativa más efectiva respecto al coste.
Ésta es una versión acortada del análisis original. Puedes leer el análisis completo en inglés aquí.
Dell Venue 10 Pro 5056
- 04/18/2016 v5.1 (old)
Sascha Mölck
Price comparison
