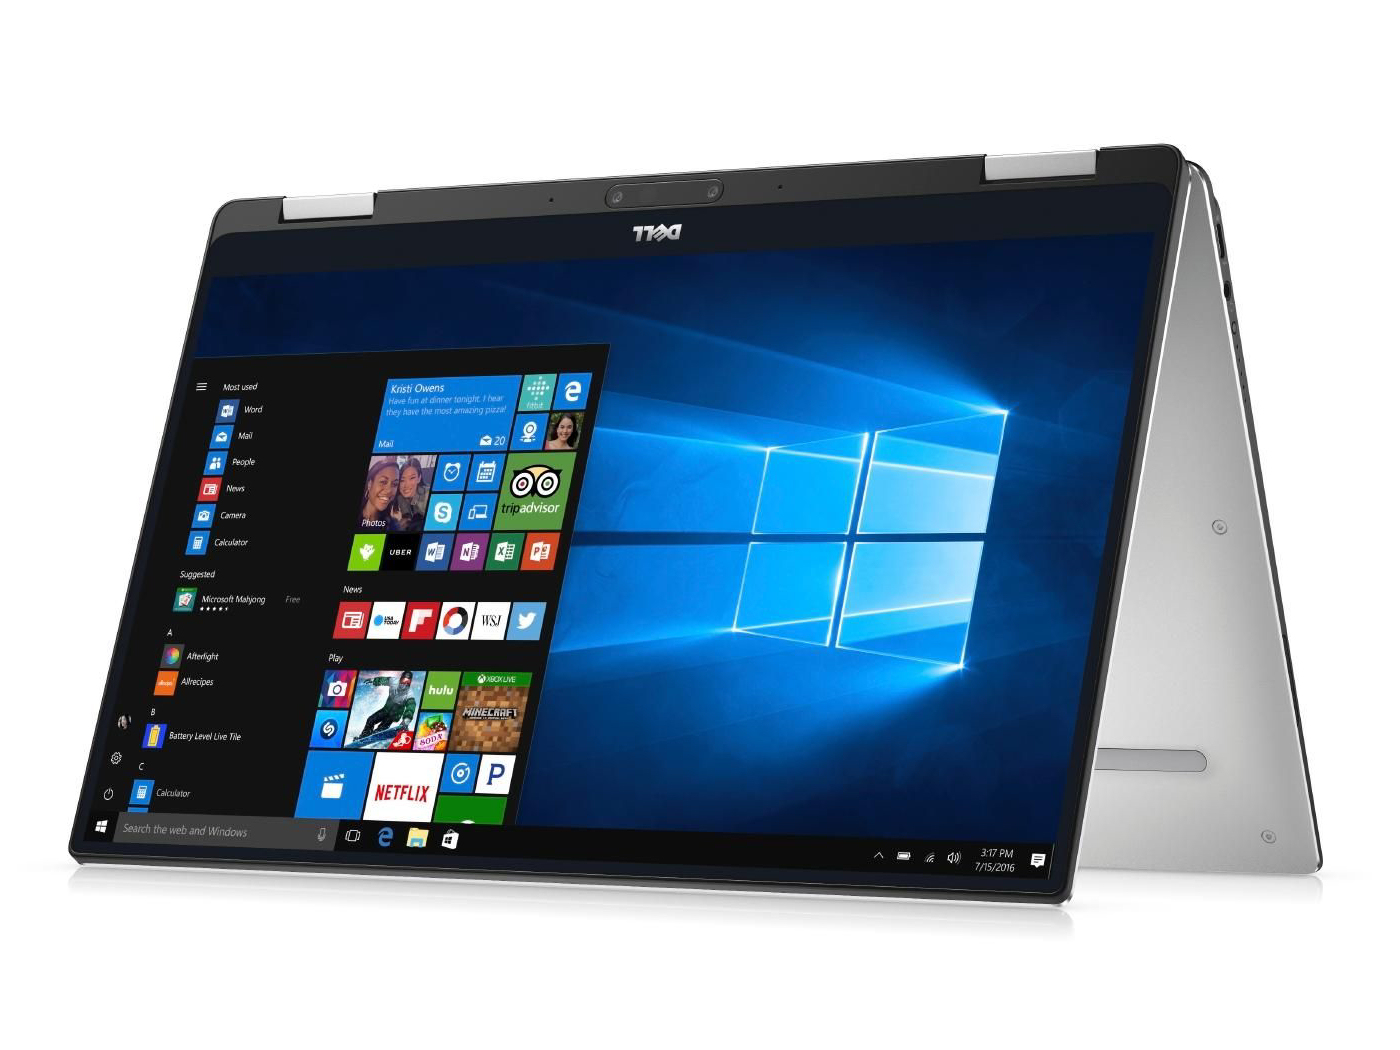
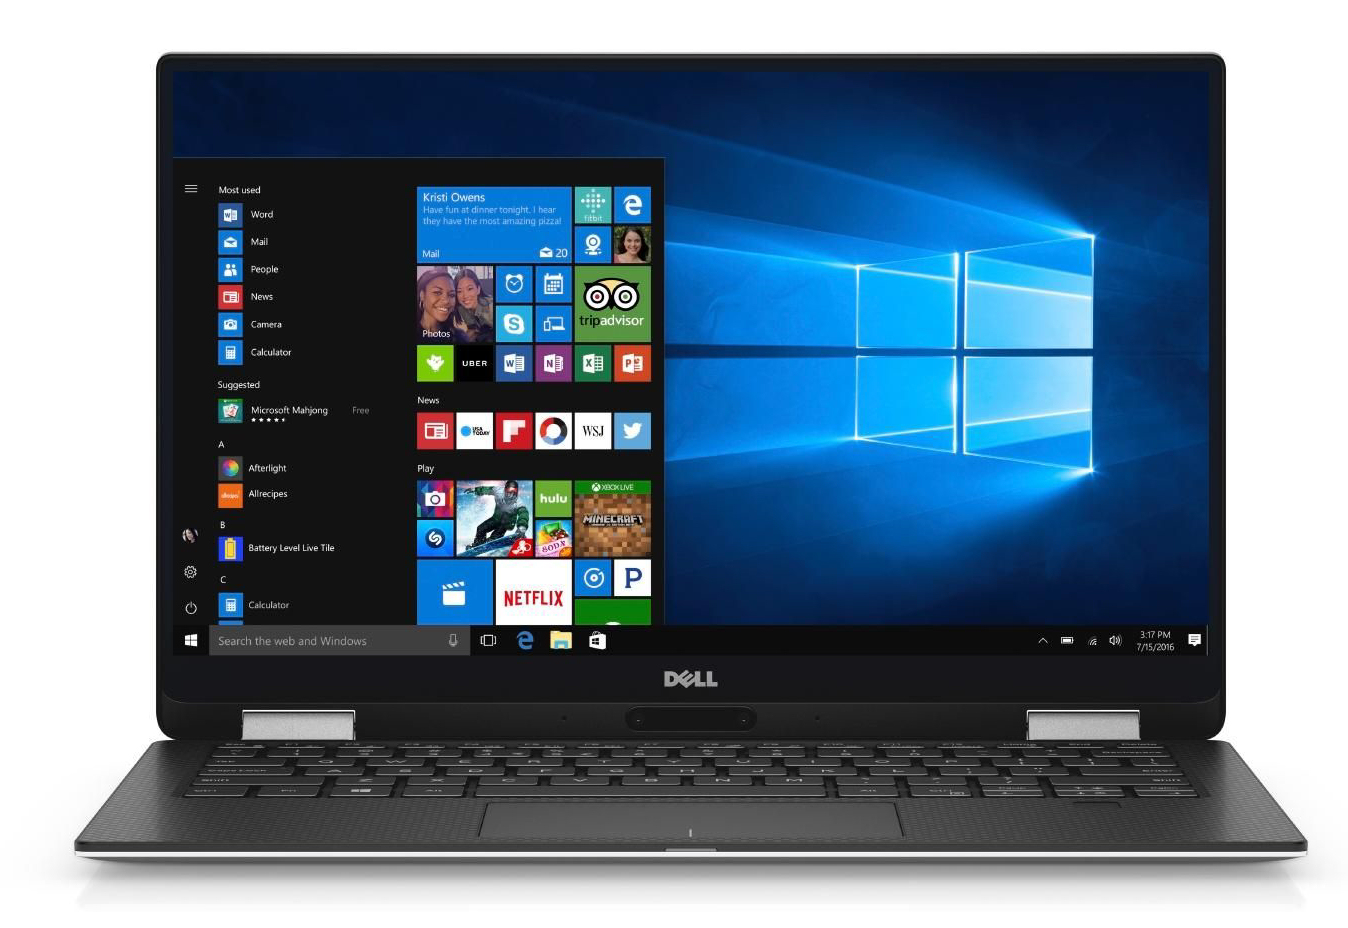
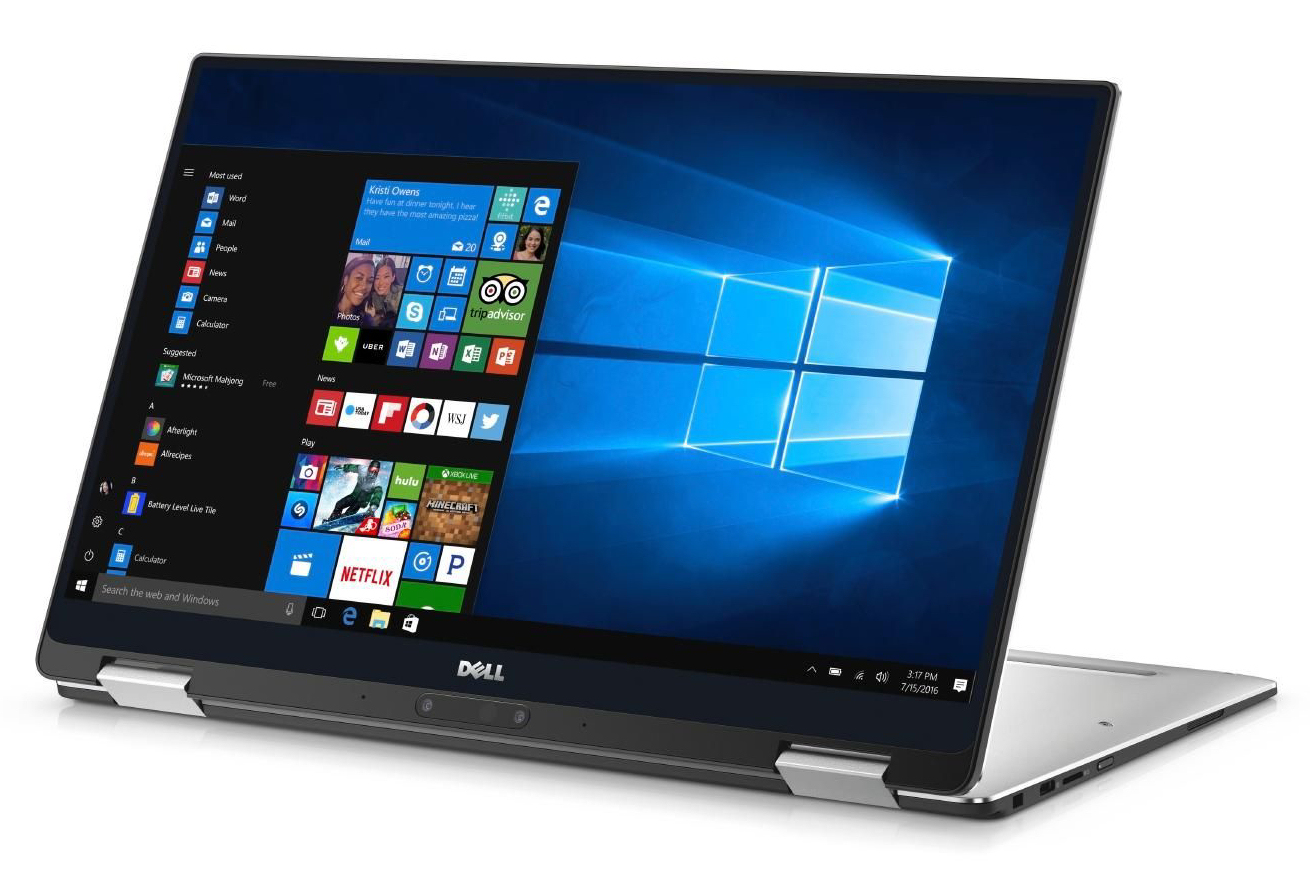
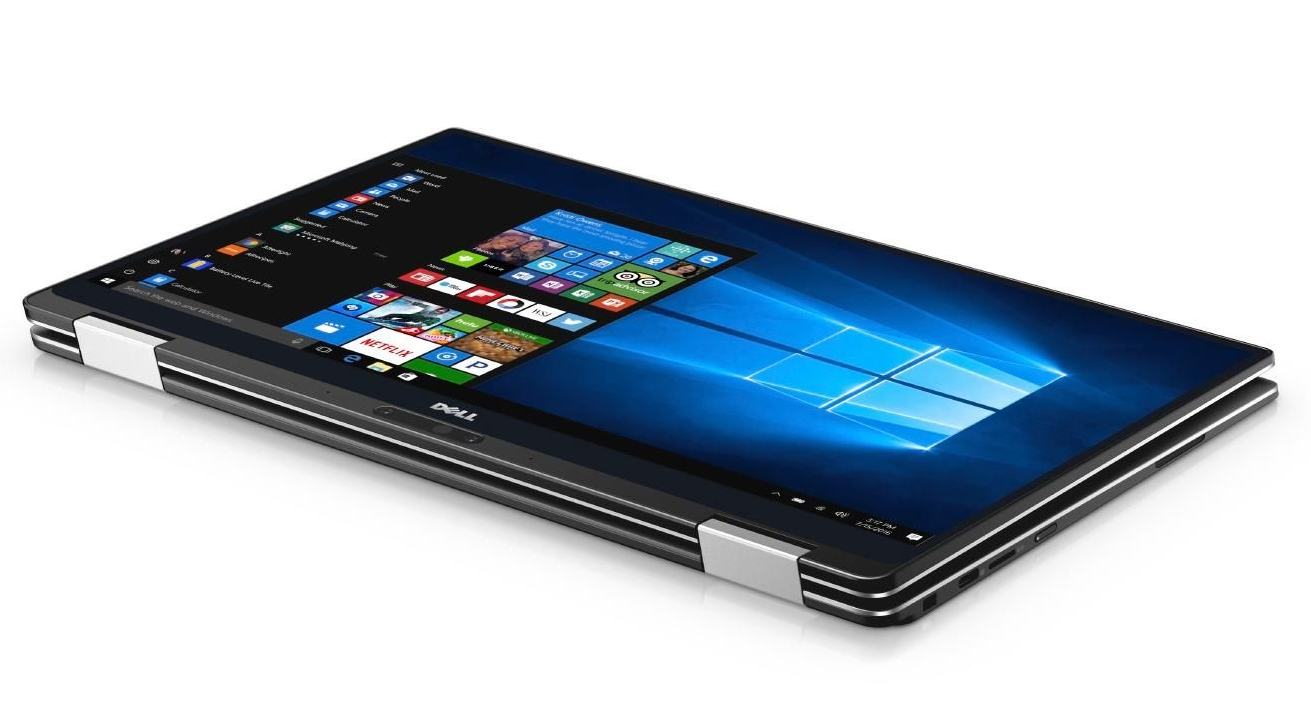
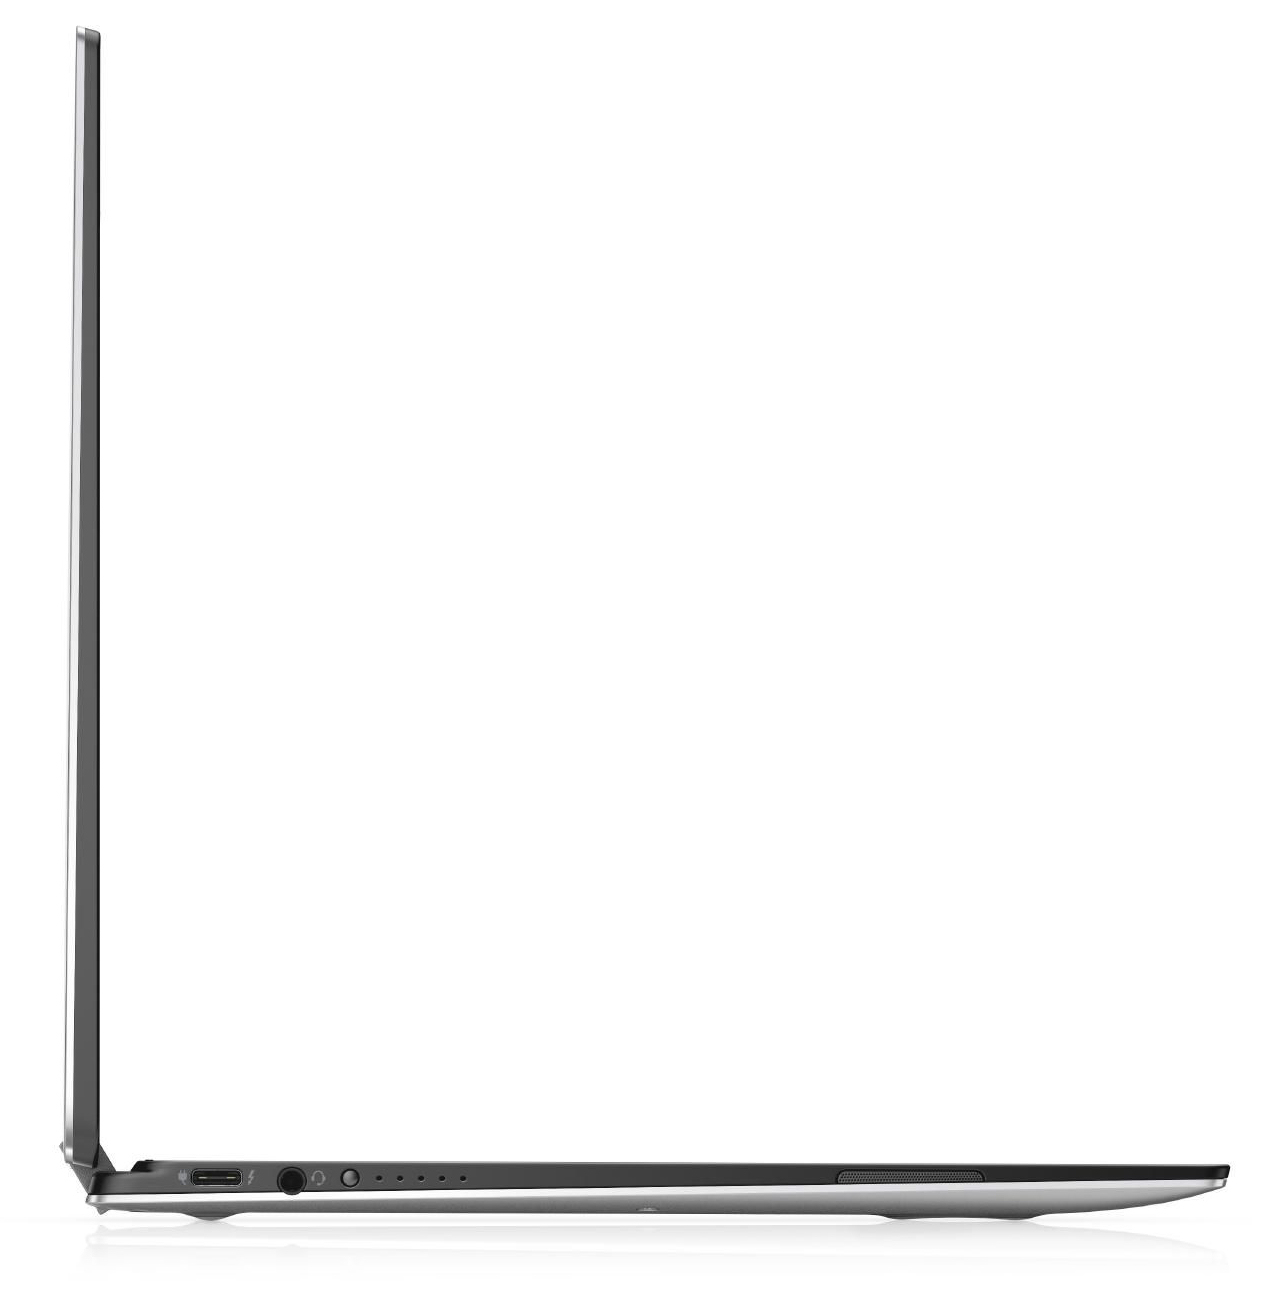
Breve análisis del convertible Dell XPS 13 9365 (7Y54, QHD+)
| Networking | |
| iperf3 transmit AX12 | |
| Dell XPS 13-9365 2-in-1 | |
| HP Spectre x360 13-ac033dx | |
| Dell XPS 13 9365-4537 2-in-1 | |
| iperf3 receive AX12 | |
| HP Spectre x360 13-ac033dx | |
| Dell XPS 13-9365 2-in-1 | |
| Dell XPS 13 9365-4537 2-in-1 | |
| |||||||||||||||||||||||||
iluminación: 78 %
Brillo con batería: 348 cd/m²
Contraste: 1740:1 (Negro: 0.2 cd/m²)
ΔE ColorChecker Calman: 2.79 | ∀{0.5-29.43 Ø4.72}
ΔE Greyscale Calman: 3.47 | ∀{0.09-98 Ø4.97}
93% sRGB (Argyll 1.6.3 3D)
60% AdobeRGB 1998 (Argyll 1.6.3 3D)
66.1% AdobeRGB 1998 (Argyll 3D)
92.9% sRGB (Argyll 3D)
64.4% Display P3 (Argyll 3D)
Gamma: 2.54
CCT: 6564 K
| Dell XPS 13 9365-4537 2-in-1 IPS, 3200x1800, 13.3" | Dell XPS 13-9365 2-in-1 IPS, 1920x1080, 13.3" | HP Spectre x360 13-ac033dx IPS, 3840x2160, 13.3" | Lenovo Yoga 910-13IKB-80VF004CGE IPS, 3840x2160, 13.9" | |
|---|---|---|---|---|
| Display | -25% | 7% | -3% | |
| Display P3 Coverage (%) | 64.4 | 47.32 -27% | 69.4 8% | 62.2 -3% |
| sRGB Coverage (%) | 92.9 | 71.1 -23% | 96.8 4% | 90.1 -3% |
| AdobeRGB 1998 Coverage (%) | 66.1 | 48.83 -26% | 71.1 8% | 63.5 -4% |
| Response Times | -9% | -1% | 9% | |
| Response Time Grey 50% / Grey 80% * (ms) | 48 ? | 48 ? -0% | 42 ? 12% | 46 ? 4% |
| Response Time Black / White * (ms) | 28 ? | 32.8 ? -17% | 32 ? -14% | 24 ? 14% |
| PWM Frequency (Hz) | 1042 ? | |||
| Screen | -44% | -1% | -51% | |
| Brightness middle (cd/m²) | 348 | 322.6 -7% | 302.6 -13% | 348 0% |
| Brightness (cd/m²) | 306 | 306 0% | 282 -8% | 310 1% |
| Brightness Distribution (%) | 78 | 91 17% | 83 6% | 80 3% |
| Black Level * (cd/m²) | 0.2 | 0.19 5% | 0.25 -25% | 0.25 -25% |
| Contrast (:1) | 1740 | 1698 -2% | 1210 -30% | 1392 -20% |
| Colorchecker dE 2000 * | 2.79 | 7.7 -176% | 2.4 14% | 7.86 -182% |
| Colorchecker dE 2000 max. * | 5.53 | 11.1 -101% | 4.9 11% | 13.43 -143% |
| Greyscale dE 2000 * | 3.47 | 7.9 -128% | 2.8 19% | 8.25 -138% |
| Gamma | 2.54 87% | 2.88 76% | 2.2 100% | 2.05 107% |
| CCT | 6564 99% | 7044 92% | 6333 103% | 6834 95% |
| Color Space (Percent of AdobeRGB 1998) (%) | 60 | 44.1 -26% | 65.5 9% | 58 -3% |
| Color Space (Percent of sRGB) (%) | 93 | 69.9 -25% | 97.1 4% | 90 -3% |
| Media total (Programa/Opciones) | -26% /
-36% | 2% /
0% | -15% /
-33% |
* ... más pequeño es mejor
Parpadeo de Pantalla / PWM (Pulse-Width Modulation)
| Parpadeo de Pantalla / PWM no detectado | ||
Comparación: 52 % de todos los dispositivos testados no usaron PWM para atenuar el display. Si se usó, medimos una media de 7763 (mínimo: 5 - máxmo: 343500) Hz. | ||
Tiempos de respuesta del display
| ↔ Tiempo de respuesta de Negro a Blanco | ||
|---|---|---|
| 28 ms ... subida ↗ y bajada ↘ combinada | ↗ 16 ms subida | 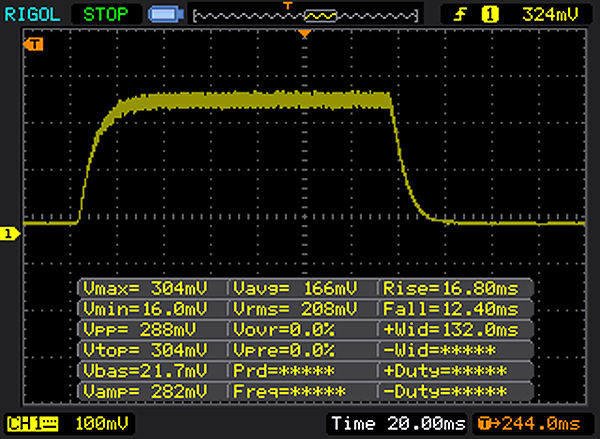 |
| ↘ 12 ms bajada | ||
| La pantalla mostró tiempos de respuesta relativamente lentos en nuestros tests pero podría ser demasiado lenta para los jugones. En comparación, todos los dispositivos de prueba van de ##min### (mínimo) a 240 (máximo) ms. » 71 % de todos los dispositivos son mejores. Eso quiere decir que el tiempo de respuesta es peor que la media (19.8 ms) de todos los dispositivos testados. | ||
| ↔ Tiempo de respuesta 50% Gris a 80% Gris | ||
| 48 ms ... subida ↗ y bajada ↘ combinada | ↗ 26 ms subida | 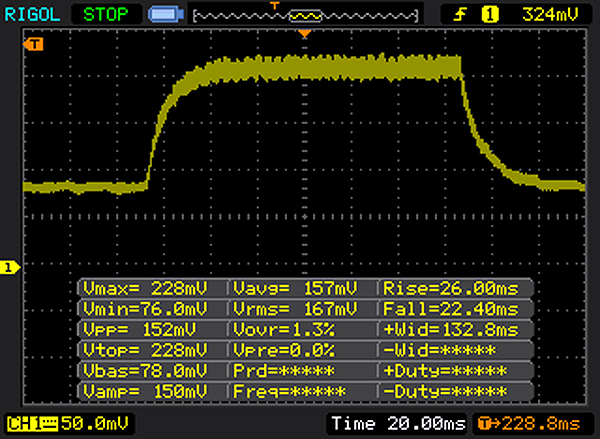 |
| ↘ 22 ms bajada | ||
| La pantalla mostró tiempos de respuesta lentos en nuestros tests y podría ser demasiado lenta para los jugones. En comparación, todos los dispositivos de prueba van de ##min### (mínimo) a 636 (máximo) ms. » 82 % de todos los dispositivos son mejores. Eso quiere decir que el tiempo de respuesta es peor que la media (31 ms) de todos los dispositivos testados. | ||
| Cinebench R10 | |
| Rendering Multiple CPUs 32Bit | |
| HP Spectre x360 13-ac033dx | |
| Dell XPS 13-9365 2-in-1 | |
| Dell XPS 13 9365-4537 2-in-1 | |
| Rendering Single 32Bit | |
| HP Spectre x360 13-ac033dx | |
| Dell XPS 13-9365 2-in-1 | |
| Dell XPS 13 9365-4537 2-in-1 | |
| Geekbench 3 | |
| 32 Bit Multi-Core Score | |
| Dell XPS 13 9365-4537 2-in-1 | |
| 32 Bit Single-Core Score | |
| Dell XPS 13 9365-4537 2-in-1 | |
| Geekbench 4.0 | |
| 64 Bit Multi-Core Score | |
| Dell XPS 13 9365-4537 2-in-1 | |
| 64 Bit Single-Core Score | |
| Dell XPS 13 9365-4537 2-in-1 | |
| Geekbench 4.4 | |
| 64 Bit Multi-Core Score | |
| Dell XPS 13 9365-4537 2-in-1 | |
| 64 Bit Single-Core Score | |
| Dell XPS 13 9365-4537 2-in-1 | |
| JetStream 1.1 - 1.1 Total | |
| Lenovo Yoga 910-13IKB-80VF004CGE | |
| HP Spectre x360 13-ac033dx | |
| Dell XPS 13 9365-4537 2-in-1 | |
| Dell XPS 13-9365 2-in-1 | |
| PCMark 8 Home Score Accelerated v2 | 2706 puntos | |
ayuda | ||
| PCMark 8 - Home Score Accelerated v2 | |
| Lenovo Yoga 910-13IKB-80VF004CGE | |
| Dell XPS 13-9365 2-in-1 | |
| HP Spectre x360 13-ac033dx | |
| Dell XPS 13 9365-4537 2-in-1 | |

| Dell XPS 13 9365-4537 2-in-1 Toshiba NVMe THNSN5256GPUK | Dell XPS 13-9365 2-in-1 Toshiba NVMe THNSN5256GPUK | HP Spectre x360 13-ac033dx Samsung PM961 NVMe MZVLW512HMJP | Lenovo Yoga 910-13IKB-80VF004CGE Samsung PM951 NVMe MZVLV512 | |
|---|---|---|---|---|
| CrystalDiskMark 3.0 | 31% | 114% | 58% | |
| Read Seq (MB/s) | 1159 | 1206 4% | 2065 78% | 1412 22% |
| Write Seq (MB/s) | 324.1 | 629 94% | 1550 378% | 578 78% |
| Read 512 (MB/s) | 528 | 966 83% | 865 64% | 701 33% |
| Write 512 (MB/s) | 373.7 | 410.7 10% | 1229 229% | 580 55% |
| Read 4k (MB/s) | 29.26 | 32.93 13% | 54.7 87% | 43.5 49% |
| Write 4k (MB/s) | 108.3 | 121.2 12% | 139.4 29% | 159.7 47% |
| Read 4k QD32 (MB/s) | 335.9 | 411 22% | 518 54% | 570 70% |
| Write 4k QD32 (MB/s) | 234.1 | 250.2 7% | 225.6 -4% | 488.7 109% |
| 3DMark 11 Performance | 1272 puntos | |
ayuda | ||
| 3DMark 11 - 1280x720 Performance GPU | |
| Lenovo Yoga 910-13IKB-80VF004CGE | |
| HP Spectre x360 13-ac033dx | |
| Dell XPS 13-9365 2-in-1 | |
| Dell XPS 13 9365-4537 2-in-1 | |
| bajo | medio | alto | ultra | |
|---|---|---|---|---|
| Diablo III (2012) | 55.8 | 36.3 | 30.1 | 17.8 |
| Counter-Strike: GO (2012) | 99.9 | 57.3 | 39.5 | 21.9 |
| BioShock Infinite (2013) | 31.4 | 20.4 | 19.3 | 6.1 |
| GRID: Autosport (2014) | 74.9 | 24.6 | ||
| F1 2014 (2014) | 55 | 34 | ||
| GTA V (2015) | 19.9 | 16.7 | ||
| World of Warships (2015) | 49.9 | 30.2 | ||
| Anno 2205 (2015) | 15.9 | 10.2 | ||
| Rainbow Six Siege (2015) | 24.6 | 16.2 | ||
| Far Cry Primal (2016) | 12 | 5 | ||
| Mirror's Edge Catalyst (2016) | 15.5 | 9 | ||
| Civilization 6 (2016) | 20.6 | 9.2 | ||
| Farming Simulator 17 (2016) | 70.2 | 45.1 | ||
| Titanfall 2 (2016) | 19.9 | 15.9 | ||
| Resident Evil 7 (2017) | 22.2 | 9.5 | ||
| For Honor (2017) | 16.8 | 6.2 | ||
| Ghost Recon Wildlands (2017) | 9.8 | 4 | ||
| Warhammer 40.000: Dawn of War III (2017) | 11.6 | 4 | ||
| Prey (2017) | 14.3 | 6.6 |
(±) La temperatura máxima en la parte superior es de 43.1 °C / 110 F, frente a la media de 35.4 °C / 96 F, que oscila entre 19.6 y 60 °C para la clase Convertible.
(±) El fondo se calienta hasta un máximo de 41.7 °C / 107 F, frente a la media de 36.9 °C / 98 F
(+) En reposo, la temperatura media de la parte superior es de 22.7 °C / 73# F, frente a la media del dispositivo de 30.3 °C / 87 F.
(+) El reposamanos y el panel táctil están a una temperatura inferior a la de la piel, con un máximo de 26.8 °C / 80.2 F y, por tanto, son fríos al tacto.
(±) La temperatura media de la zona del reposamanos de dispositivos similares fue de 28 °C / 82.4 F (+1.2 °C / 2.2 F).
Dell XPS 13 9365-4537 2-in-1 análisis de audio
(±) | la sonoridad del altavoz es media pero buena (73 dB)
Graves 100 - 315 Hz
(±) | lubina reducida - en promedio 14.8% inferior a la mediana
(+) | el bajo es lineal (4.5% delta a la frecuencia anterior)
Medios 400 - 2000 Hz
(±) | medias más altas - de media 5.2% más altas que la mediana
(+) | los medios son lineales (5.1% delta a la frecuencia anterior)
Altos 2 - 16 kHz
(+) | máximos equilibrados - a sólo 3.4% de la mediana
(±) | la linealidad de los máximos es media (7.4% delta a frecuencia anterior)
Total 100 - 16.000 Hz
(±) | la linealidad del sonido global es media (17.4% de diferencia con la mediana)
En comparación con la misma clase
» 33% de todos los dispositivos probados de esta clase eran mejores, 8% similares, 59% peores
» El mejor tuvo un delta de 6%, la media fue 20%, el peor fue ###max##%
En comparación con todos los dispositivos probados
» 33% de todos los dispositivos probados eran mejores, 8% similares, 59% peores
» El mejor tuvo un delta de 4%, la media fue 24%, el peor fue ###max##%
Apple MacBook 12 (Early 2016) 1.1 GHz análisis de audio
(+) | los altavoces pueden reproducir a un volumen relativamente alto (#83.6 dB)
Graves 100 - 315 Hz
(±) | lubina reducida - en promedio 11.3% inferior a la mediana
(±) | la linealidad de los graves es media (14.2% delta a frecuencia anterior)
Medios 400 - 2000 Hz
(+) | medios equilibrados - a sólo 2.4% de la mediana
(+) | los medios son lineales (5.5% delta a la frecuencia anterior)
Altos 2 - 16 kHz
(+) | máximos equilibrados - a sólo 2% de la mediana
(+) | los máximos son lineales (4.5% delta a la frecuencia anterior)
Total 100 - 16.000 Hz
(+) | el sonido global es lineal (10.2% de diferencia con la mediana)
En comparación con la misma clase
» 7% de todos los dispositivos probados de esta clase eran mejores, 2% similares, 91% peores
» El mejor tuvo un delta de 5%, la media fue 18%, el peor fue ###max##%
En comparación con todos los dispositivos probados
» 5% de todos los dispositivos probados eran mejores, 1% similares, 94% peores
» El mejor tuvo un delta de 4%, la media fue 24%, el peor fue ###max##%
| Off / Standby | |
| Ocioso | |
| Carga |
|
Clave:
min: | |
| Battery Runtime - WiFi Websurfing | |
| Dell XPS 13-9365 2-in-1 | |
| Lenovo Yoga 910-13IKB-80VF004CGE | |
| HP Spectre x360 13-ac033dx | |
| Dell XPS 13 9365-4537 2-in-1 | |
Pro
Contra
El Dell XPS 13 que estamos probando tiene un procesador Core i5-7Y54. No es de ninguna manera inferior al nominalmente superior Core i7 incluido en su modelo gemelo probado con anterioridad. Como ambas CPUs apenas alcanzan la máxima velocidad posible debido a la refrigeración pasiva, los resultados en los tests de CPU son bastante similares. Apenas puede apreciarse una ligera ventaja en el modelo con Core i7 en las tareas cotidianas. El coste extra del procesador Core i7 no merece realmente la pena.
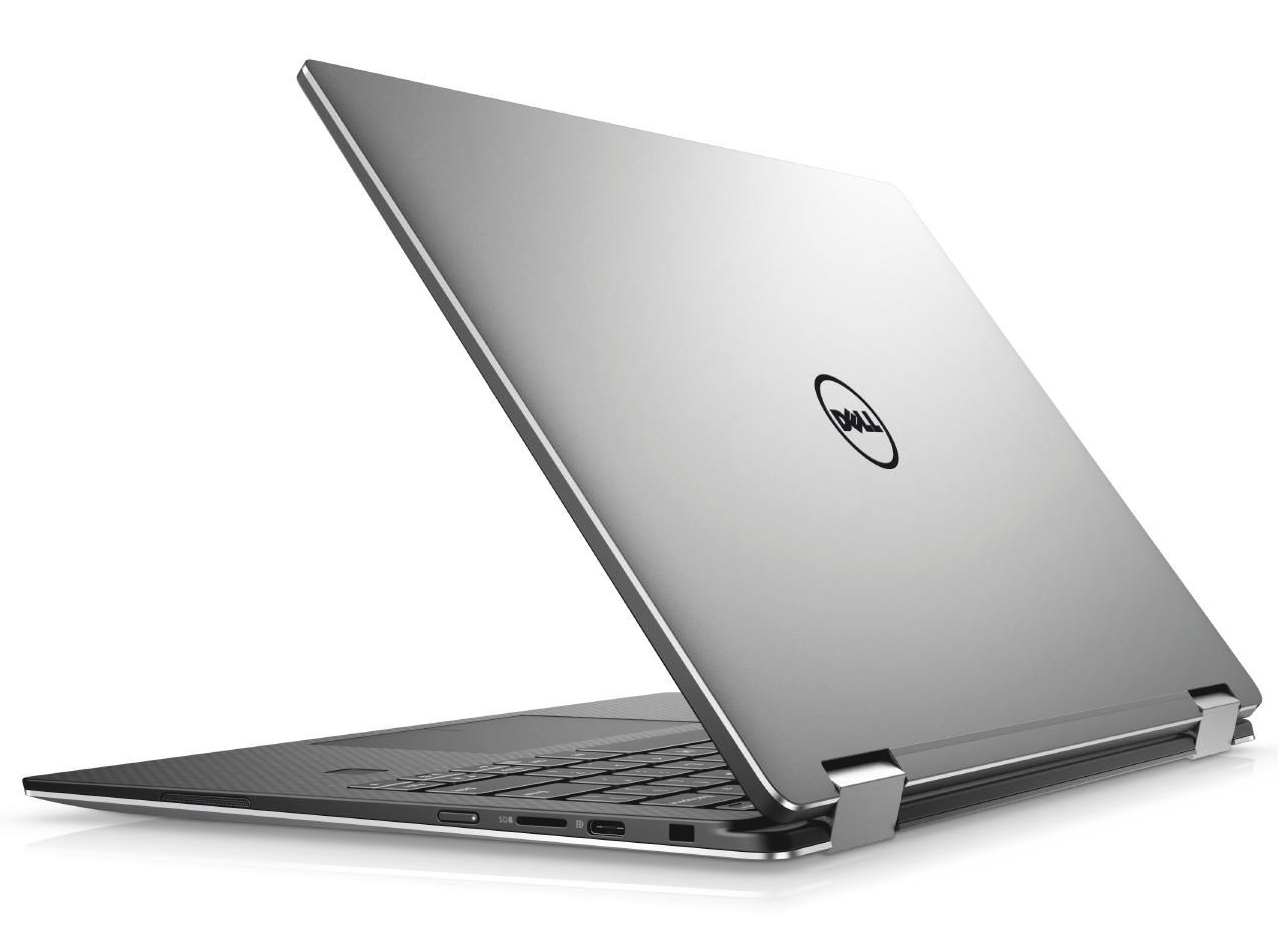
Al no haber ventilador, el dispositivo se mantiene silencioso. Además no se calienta demasiado. Un SSD NVMe asegura un sistema rápido. Cambiar el SSD debería ser posible. Para hacerlo necesitarías extraer la parte inferior de la carcasa. El teclado nos ha dejado una impresión positiva.
La pantalla IPS tiene buenos ángulos de visualización y ofrece muy buen contraste. El brillo es también muy bueno, a pesar de que podría ser mayor y que el dispositivo está pensado para ser usado bajo condiciones de luz muy variadas.
La pantalla QHD+ super nítida tiene un efecto negativo en la duración de batería.
En nuestro test WLAN la duración de batería descendió alrededor de 5 horas en comparación con el modelo Full HD del XPS 13. Los usuarios que necesiten una duración de batería lo más extensa posible deberían elegir el modelo Full HD.
Ésta es una versión acortada del análisis original. Puedes leer el análisis completo en inglés aquí.
Dell XPS 13 9365-4537 2-in-1
- 05/26/2017 v6 (old)
Sascha Mölck