Breve análisis del convertible HP Spectre x360 13 (7500U, 4K UHD)
| Networking | |
| iperf3 transmit AX12 | |
| Dell XPS 15 9560 (i7-7700HQ, UHD) | |
| Dell XPS 13-9365 2-in-1 | |
| HP Spectre x360 13-ac033dx | |
| iperf3 receive AX12 | |
| Dell XPS 15 9560 (i7-7700HQ, UHD) | |
| HP Spectre x360 13-ac033dx | |
| Dell XPS 13-9365 2-in-1 | |
| |||||||||||||||||||||||||
iluminación: 83 %
Brillo con batería: 302.6 cd/m²
Contraste: 1210:1 (Negro: 0.25 cd/m²)
ΔE ColorChecker Calman: 2.4 | ∀{0.5-29.43 Ø4.72}
ΔE Greyscale Calman: 2.8 | ∀{0.09-98 Ø4.97}
97.1% sRGB (Argyll 1.6.3 3D)
65.5% AdobeRGB 1998 (Argyll 1.6.3 3D)
71.1% AdobeRGB 1998 (Argyll 3D)
96.8% sRGB (Argyll 3D)
69.4% Display P3 (Argyll 3D)
Gamma: 2.2
CCT: 6333 K
| HP Spectre x360 13-ac033dx LG Philips LGD054D, IPS, 13.3", 3840x2160 | Apple MacBook Pro 13 2016 (2.9 GHz) APPA033, , 13.3", 2560x1600 | Dell XPS 13-9365 2-in-1 IPS, 13.3", 1920x1080 | Lenovo Yoga 910-13IKB-80VF004CGE AU Optronics AUO323D / B139HAN03.2, IPS, 13.9", 3840x2160 | HP Spectre 13-v131ng CMN1374, IPS UWVA, 13.3", 1920x1080 | HP Spectre x360 13-w023dx Chi Mei CMN1367, IPS, 13.3", 1920x1080 | |
|---|---|---|---|---|---|---|
| Display | 23% | -30% | -9% | -8% | -7% | |
| Display P3 Coverage (%) | 69.4 | 99.2 43% | 47.32 -32% | 62.2 -10% | 64.6 -7% | 65.4 -6% |
| sRGB Coverage (%) | 96.8 | 99.9 3% | 71.1 -27% | 90.1 -7% | 88.8 -8% | 90.4 -7% |
| AdobeRGB 1998 Coverage (%) | 71.1 | 87.6 23% | 48.83 -31% | 63.5 -11% | 64.8 -9% | 65.8 -7% |
| Response Times | -39% | -8% | 8% | -7% | 17% | |
| Response Time Grey 50% / Grey 80% * (ms) | 42 ? | 47.2 ? -12% | 48 ? -14% | 46 ? -10% | 46 ? -10% | 33.2 ? 21% |
| Response Time Black / White * (ms) | 32 ? | 53 ? -66% | 32.8 ? -2% | 24 ? 25% | 33 ? -3% | 28 ? 12% |
| PWM Frequency (Hz) | 1042 ? | |||||
| Screen | 19% | -50% | -58% | -33% | -52% | |
| Brightness middle (cd/m²) | 302.6 | 569 88% | 322.6 7% | 348 15% | 404 34% | 334.6 11% |
| Brightness (cd/m²) | 282 | 542 92% | 306 9% | 310 10% | 382 35% | 319 13% |
| Brightness Distribution (%) | 83 | 90 8% | 91 10% | 80 -4% | 91 10% | 90 8% |
| Black Level * (cd/m²) | 0.25 | 0.56 -124% | 0.19 24% | 0.25 -0% | 0.35 -40% | 0.336 -34% |
| Contrast (:1) | 1210 | 1016 -16% | 1698 40% | 1392 15% | 1154 -5% | 996 -18% |
| Colorchecker dE 2000 * | 2.4 | 1.4 42% | 7.7 -221% | 7.86 -228% | 5.37 -124% | 6.21 -159% |
| Colorchecker dE 2000 max. * | 4.9 | 2.9 41% | 11.1 -127% | 13.43 -174% | 9.46 -93% | 12 -145% |
| Greyscale dE 2000 * | 2.8 | 1.8 36% | 7.9 -182% | 8.25 -195% | 6.44 -130% | 7.71 -175% |
| Gamma | 2.2 100% | 2.16 102% | 2.88 76% | 2.05 107% | 2.52 87% | 2.36 93% |
| CCT | 6333 103% | 6877 95% | 7044 92% | 6834 95% | 6738 96% | 6458 101% |
| Color Space (Percent of AdobeRGB 1998) (%) | 65.5 | 78.4 20% | 44.1 -33% | 58 -11% | 58 -11% | 58.6 -11% |
| Color Space (Percent of sRGB) (%) | 97.1 | 99.3 2% | 69.9 -28% | 90 -7% | 89 -8% | 90 -7% |
| Media total (Programa/Opciones) | 1% /
12% | -29% /
-40% | -20% /
-39% | -16% /
-25% | -14% /
-34% |
* ... más pequeño es mejor
Tiempos de respuesta del display
| ↔ Tiempo de respuesta de Negro a Blanco | ||
|---|---|---|
| 32 ms ... subida ↗ y bajada ↘ combinada | ↗ 18 ms subida | 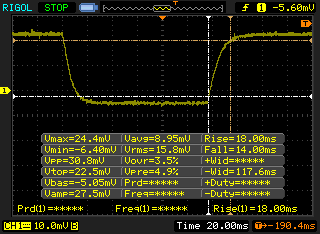 |
| ↘ 14 ms bajada | ||
| La pantalla mostró tiempos de respuesta lentos en nuestros tests y podría ser demasiado lenta para los jugones. En comparación, todos los dispositivos de prueba van de ##min### (mínimo) a 240 (máximo) ms. » 86 % de todos los dispositivos son mejores. Eso quiere decir que el tiempo de respuesta es peor que la media (19.9 ms) de todos los dispositivos testados. | ||
| ↔ Tiempo de respuesta 50% Gris a 80% Gris | ||
| 42 ms ... subida ↗ y bajada ↘ combinada | ↗ 20.8 ms subida | 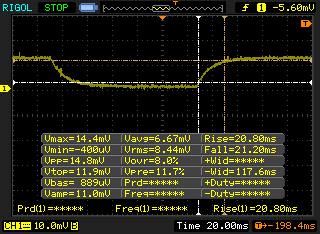 |
| ↘ 21.2 ms bajada | ||
| La pantalla mostró tiempos de respuesta lentos en nuestros tests y podría ser demasiado lenta para los jugones. En comparación, todos los dispositivos de prueba van de ##min### (mínimo) a 636 (máximo) ms. » 67 % de todos los dispositivos son mejores. Eso quiere decir que el tiempo de respuesta es peor que la media (31.1 ms) de todos los dispositivos testados. | ||
Parpadeo de Pantalla / PWM (Pulse-Width Modulation)
| Parpadeo de Pantalla / PWM no detectado | 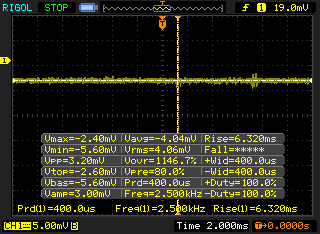 | ||
Comparación: 52 % de todos los dispositivos testados no usaron PWM para atenuar el display. Si se usó, medimos una media de 7784 (mínimo: 5 - máxmo: 343500) Hz. | |||
| wPrime 2.10 - 1024m | |
| Dell XPS 13-9365 2-in-1 | |
| Dell XPS 13 9360-4764 | |
| Dell Latitude 7280 | |
| HP Spectre x360 13-ac033dx | |
* ... más pequeño es mejor
| PCMark 8 | |
| Home Score Accelerated v2 | |
| HP Spectre 13-v131ng | |
| Apple MacBook Air 13 inch 2015-03 | |
| Lenovo Yoga 910-13IKB-80VF004CGE | |
| Dell XPS 13-9365 2-in-1 | |
| HP Spectre x360 13-ac033dx | |
| Work Score Accelerated v2 | |
| HP Spectre 13-v131ng | |
| Dell XPS 13-9365 2-in-1 | |
| Apple MacBook Air 13 inch 2015-03 | |
| HP Spectre x360 13-ac033dx | |
| Creative Score Accelerated v2 | |
| HP Spectre 13-v131ng | |
| Apple MacBook Air 13 inch 2015-03 | |
| HP Spectre x360 13-ac033dx | |
| Dell XPS 13-9365 2-in-1 | |
| PCMark 8 Home Score Accelerated v2 | 3023 puntos | |
| PCMark 8 Creative Score Accelerated v2 | 4432 puntos | |
| PCMark 8 Work Score Accelerated v2 | 3706 puntos | |
ayuda | ||
| HP Spectre x360 13-ac033dx Samsung PM961 NVMe MZVLW512HMJP | Apple MacBook Air 13 inch 2015-03 Apple SSD SD0256F | Dell XPS 13-9365 2-in-1 Toshiba NVMe THNSN5256GPUK | Lenovo Yoga 910-13IKB-80VF004CGE Samsung PM951 NVMe MZVLV512 | HP Spectre 13-v131ng Samsung PM961 NVMe MZVLW512HMJP | |
|---|---|---|---|---|---|
| CrystalDiskMark 3.0 | -25% | -27% | -6% | -4% | |
| Read Seq (MB/s) | 2065 | 1352 -35% | 1206 -42% | 1412 -32% | 1090 -47% |
| Write Seq (MB/s) | 1550 | 1111 -28% | 629 -59% | 578 -63% | 1088 -30% |
| Read 512 (MB/s) | 865 | 880 2% | 966 12% | 701 -19% | 753 -13% |
| Write 512 (MB/s) | 1229 | 1023 -17% | 410.7 -67% | 580 -53% | 911 -26% |
| Read 4k (MB/s) | 54.7 | 21.93 -60% | 32.93 -40% | 43.5 -20% | 57.5 5% |
| Write 4k (MB/s) | 139.4 | 30.94 -78% | 121.2 -13% | 159.7 15% | 140.2 1% |
| Read 4k QD32 (MB/s) | 518 | 339.5 -34% | 411 -21% | 570 10% | 497.1 -4% |
| Write 4k QD32 (MB/s) | 225.6 | 342.9 52% | 250.2 11% | 488.7 117% | 416 84% |

| 3DMark 11 Performance | 1735 puntos | |
| 3DMark Ice Storm Standard Score | 51912 puntos | |
| 3DMark Cloud Gate Standard Score | 6054 puntos | |
| 3DMark Fire Strike Score | 940 puntos | |
| 3DMark Fire Strike Extreme Score | 434 puntos | |
ayuda | ||
Ruido
| Ocioso |
| 28.7 / 34.2 / 35.8 dB(A) |
| Carga |
| 35.8 / 39.6 dB(A) |
 | ||
30 dB silencioso 40 dB(A) audible 50 dB(A) ruidosamente alto |
||
min: | ||
| HP Spectre x360 13-ac033dx HD Graphics 620, i7-7500U, Samsung PM961 NVMe MZVLW512HMJP | Apple MacBook Pro 13 2016 (2.9 GHz) Iris Graphics 550, 6267U, Apple SSD AP0256 | Dell XPS 13-9365 2-in-1 HD Graphics 615, i7-7Y75, Toshiba NVMe THNSN5256GPUK | Lenovo Yoga 910-13IKB-80VF004CGE HD Graphics 620, i7-7500U, Samsung PM951 NVMe MZVLV512 | HP Spectre 13-v131ng HD Graphics 620, i7-7500U, Samsung PM961 NVMe MZVLW512HMJP | |
|---|---|---|---|---|---|
| Noise | 6% | 1% | 0% | ||
| apagado / medio ambiente * (dB) | 28.7 | 30.2 -5% | 31.7 -10% | 30.4 -6% | |
| Idle Minimum * (dB) | 28.7 | 30.2 -5% | 31.7 -10% | 30.4 -6% | |
| Idle Average * (dB) | 34.2 | 30.2 12% | 31.7 7% | 30.4 11% | |
| Idle Maximum * (dB) | 35.8 | 30.2 16% | 31.7 11% | 30.4 15% | |
| Load Average * (dB) | 35.8 | 33 8% | 38.4 -7% | 40 -12% | |
| Load Maximum * (dB) | 39.6 | 36.2 9% | 34.7 12% | 40 -1% |
* ... más pequeño es mejor
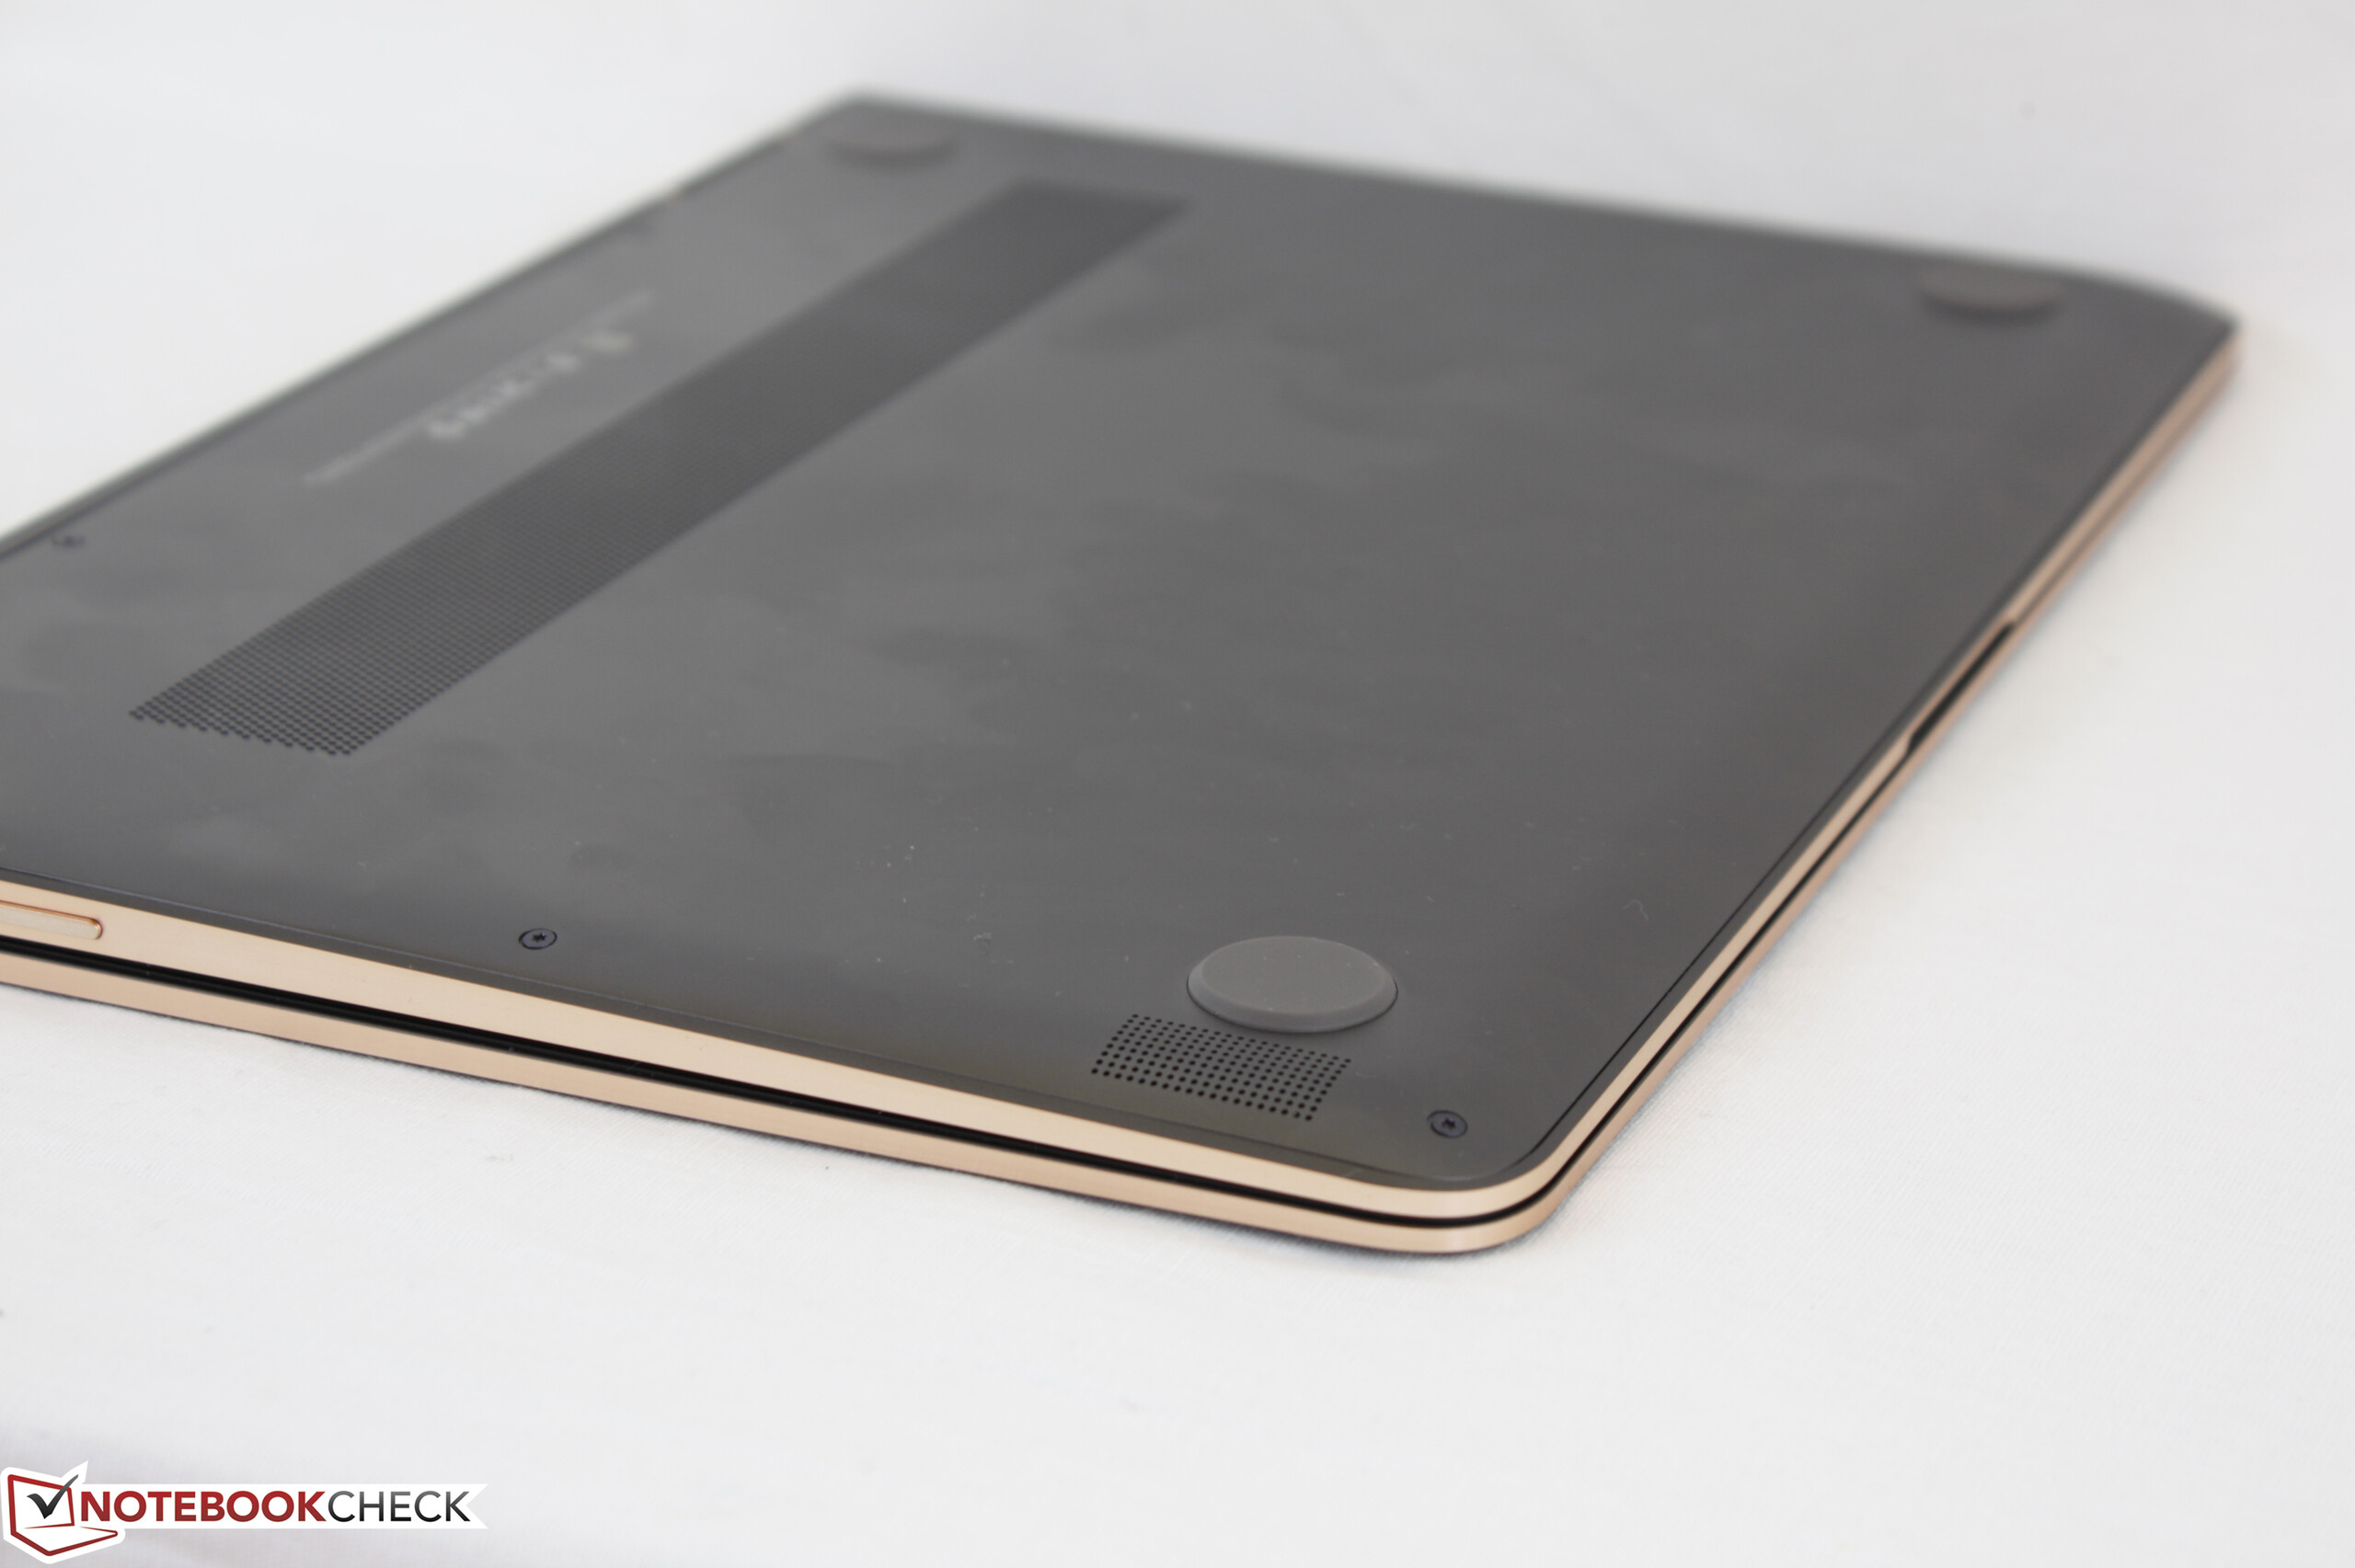
(-) La temperatura máxima en la parte superior es de 48 °C / 118 F, frente a la media de 35.4 °C / 96 F, que oscila entre 19.6 y 60 °C para la clase Convertible.
(-) El fondo se calienta hasta un máximo de 45.4 °C / 114 F, frente a la media de 36.9 °C / 98 F
(+) En reposo, la temperatura media de la parte superior es de 23.7 °C / 75# F, frente a la media del dispositivo de 30.3 °C / 87 F.
(+) El reposamanos y el panel táctil están a una temperatura inferior a la de la piel, con un máximo de 31.6 °C / 88.9 F y, por tanto, son fríos al tacto.
(-) La temperatura media de la zona del reposamanos de dispositivos similares fue de 28 °C / 82.4 F (-3.6 °C / -6.5 F).
HP Spectre x360 13-ac033dx análisis de audio
(-) | altavoces no muy altos (#67.1 dB)
Graves 100 - 315 Hz
(-) | casi sin bajos - de media 16.9% inferior a la mediana
(-) | los graves no son lineales (15.8% delta a la frecuencia anterior)
Medios 400 - 2000 Hz
(+) | medios equilibrados - a sólo 3% de la mediana
(+) | los medios son lineales (6.9% delta a la frecuencia anterior)
Altos 2 - 16 kHz
(+) | máximos equilibrados - a sólo 3% de la mediana
(±) | la linealidad de los máximos es media (9.5% delta a frecuencia anterior)
Total 100 - 16.000 Hz
(±) | la linealidad del sonido global es media (23.4% de diferencia con la mediana)
En comparación con la misma clase
» 70% de todos los dispositivos probados de esta clase eran mejores, 5% similares, 25% peores
» El mejor tuvo un delta de 6%, la media fue 20%, el peor fue ###max##%
En comparación con todos los dispositivos probados
» 70% de todos los dispositivos probados eran mejores, 6% similares, 24% peores
» El mejor tuvo un delta de 4%, la media fue 24%, el peor fue ###max##%
Apple MacBook 12 (Early 2016) 1.1 GHz análisis de audio
(+) | los altavoces pueden reproducir a un volumen relativamente alto (#83.6 dB)
Graves 100 - 315 Hz
(±) | lubina reducida - en promedio 11.3% inferior a la mediana
(±) | la linealidad de los graves es media (14.2% delta a frecuencia anterior)
Medios 400 - 2000 Hz
(+) | medios equilibrados - a sólo 2.4% de la mediana
(+) | los medios son lineales (5.5% delta a la frecuencia anterior)
Altos 2 - 16 kHz
(+) | máximos equilibrados - a sólo 2% de la mediana
(+) | los máximos son lineales (4.5% delta a la frecuencia anterior)
Total 100 - 16.000 Hz
(+) | el sonido global es lineal (10.2% de diferencia con la mediana)
En comparación con la misma clase
» 7% de todos los dispositivos probados de esta clase eran mejores, 2% similares, 91% peores
» El mejor tuvo un delta de 5%, la media fue 18%, el peor fue ###max##%
En comparación con todos los dispositivos probados
» 5% de todos los dispositivos probados eran mejores, 1% similares, 94% peores
» El mejor tuvo un delta de 4%, la media fue 24%, el peor fue ###max##%
| Off / Standby | |
| Ocioso | |
| Carga |
|
Clave:
min: | |
| HP Spectre x360 13-ac033dx i7-7500U, HD Graphics 620, Samsung PM961 NVMe MZVLW512HMJP, IPS, 3840x2160, 13.3" | Apple MacBook Pro 13 2016 (2.9 GHz) 6267U, Iris Graphics 550, Apple SSD AP0256, , 2560x1600, 13.3" | Dell XPS 13-9365 2-in-1 i7-7Y75, HD Graphics 615, Toshiba NVMe THNSN5256GPUK, IPS, 1920x1080, 13.3" | Lenovo Yoga 910-13IKB-80VF004CGE i7-7500U, HD Graphics 620, Samsung PM951 NVMe MZVLV512, IPS, 3840x2160, 13.9" | HP Spectre 13-v131ng i7-7500U, HD Graphics 620, Samsung PM961 NVMe MZVLW512HMJP, IPS UWVA, 1920x1080, 13.3" | HP Spectre x360 13-w023dx i7-7500U, HD Graphics 620, Samsung PM951 NVMe MZVLV512, IPS, 1920x1080, 13.3" | |
|---|---|---|---|---|---|---|
| Power Consumption | -7% | 42% | 17% | 15% | 12% | |
| Idle Minimum * (Watt) | 5.3 | 2.1 60% | 3.1 42% | 4.3 19% | 3.6 32% | 5.5 -4% |
| Idle Average * (Watt) | 9.6 | 7.6 21% | 4.3 55% | 6.3 34% | 6.4 33% | 6.7 30% |
| Idle Maximum * (Watt) | 10.1 | 8.2 19% | 4.9 51% | 9 11% | 9.2 9% | 7.1 30% |
| Load Average * (Watt) | 34.4 | 56.4 -64% | 24.3 29% | 32.7 5% | 34 1% | 33.1 4% |
| Load Maximum * (Watt) | 34.8 | 59.8 -72% | 22.8 34% | 28.8 17% | 34.4 1% | 35.2 -1% |
* ... más pequeño es mejor
| HP Spectre x360 13-ac033dx i7-7500U, HD Graphics 620, 57.8 Wh | Apple MacBook Pro 13 2016 (2.9 GHz) 6267U, Iris Graphics 550, 49.2 Wh | Dell XPS 13-9365 2-in-1 i7-7Y75, HD Graphics 615, 46 Wh | Lenovo Yoga 910-13IKB-80VF004CGE i7-7500U, HD Graphics 620, 78 Wh | HP Spectre 13-v131ng i7-7500U, HD Graphics 620, 38 Wh | HP Spectre x360 13-w023dx i7-7500U, HD Graphics 620, 57.8 Wh | |
|---|---|---|---|---|---|---|
| Duración de Batería | -19% | 34% | 36% | -23% | 21% | |
| Reader / Idle (h) | 13.2 | 16.2 23% | 17.8 35% | 12 -9% | 20.6 56% | |
| WiFi v1.3 (h) | 9 | 9.4 4% | 11.4 27% | 10.7 19% | 6.6 -27% | 9.3 3% |
| Load (h) | 1.9 | 1.1 -42% | 2.9 53% | 2.9 53% | 1.3 -32% | 2 5% |
Pro
Contra
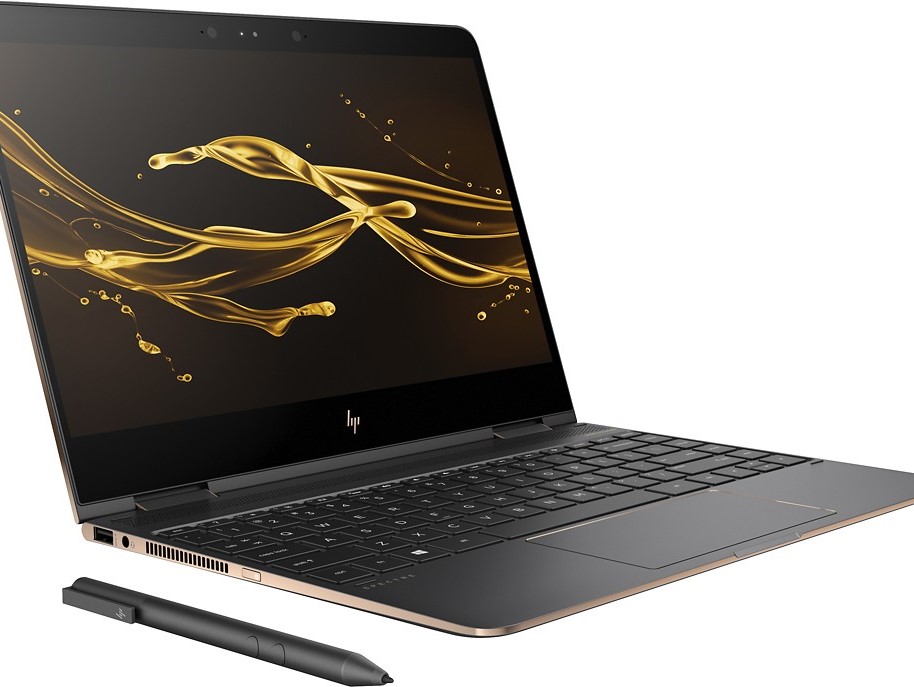
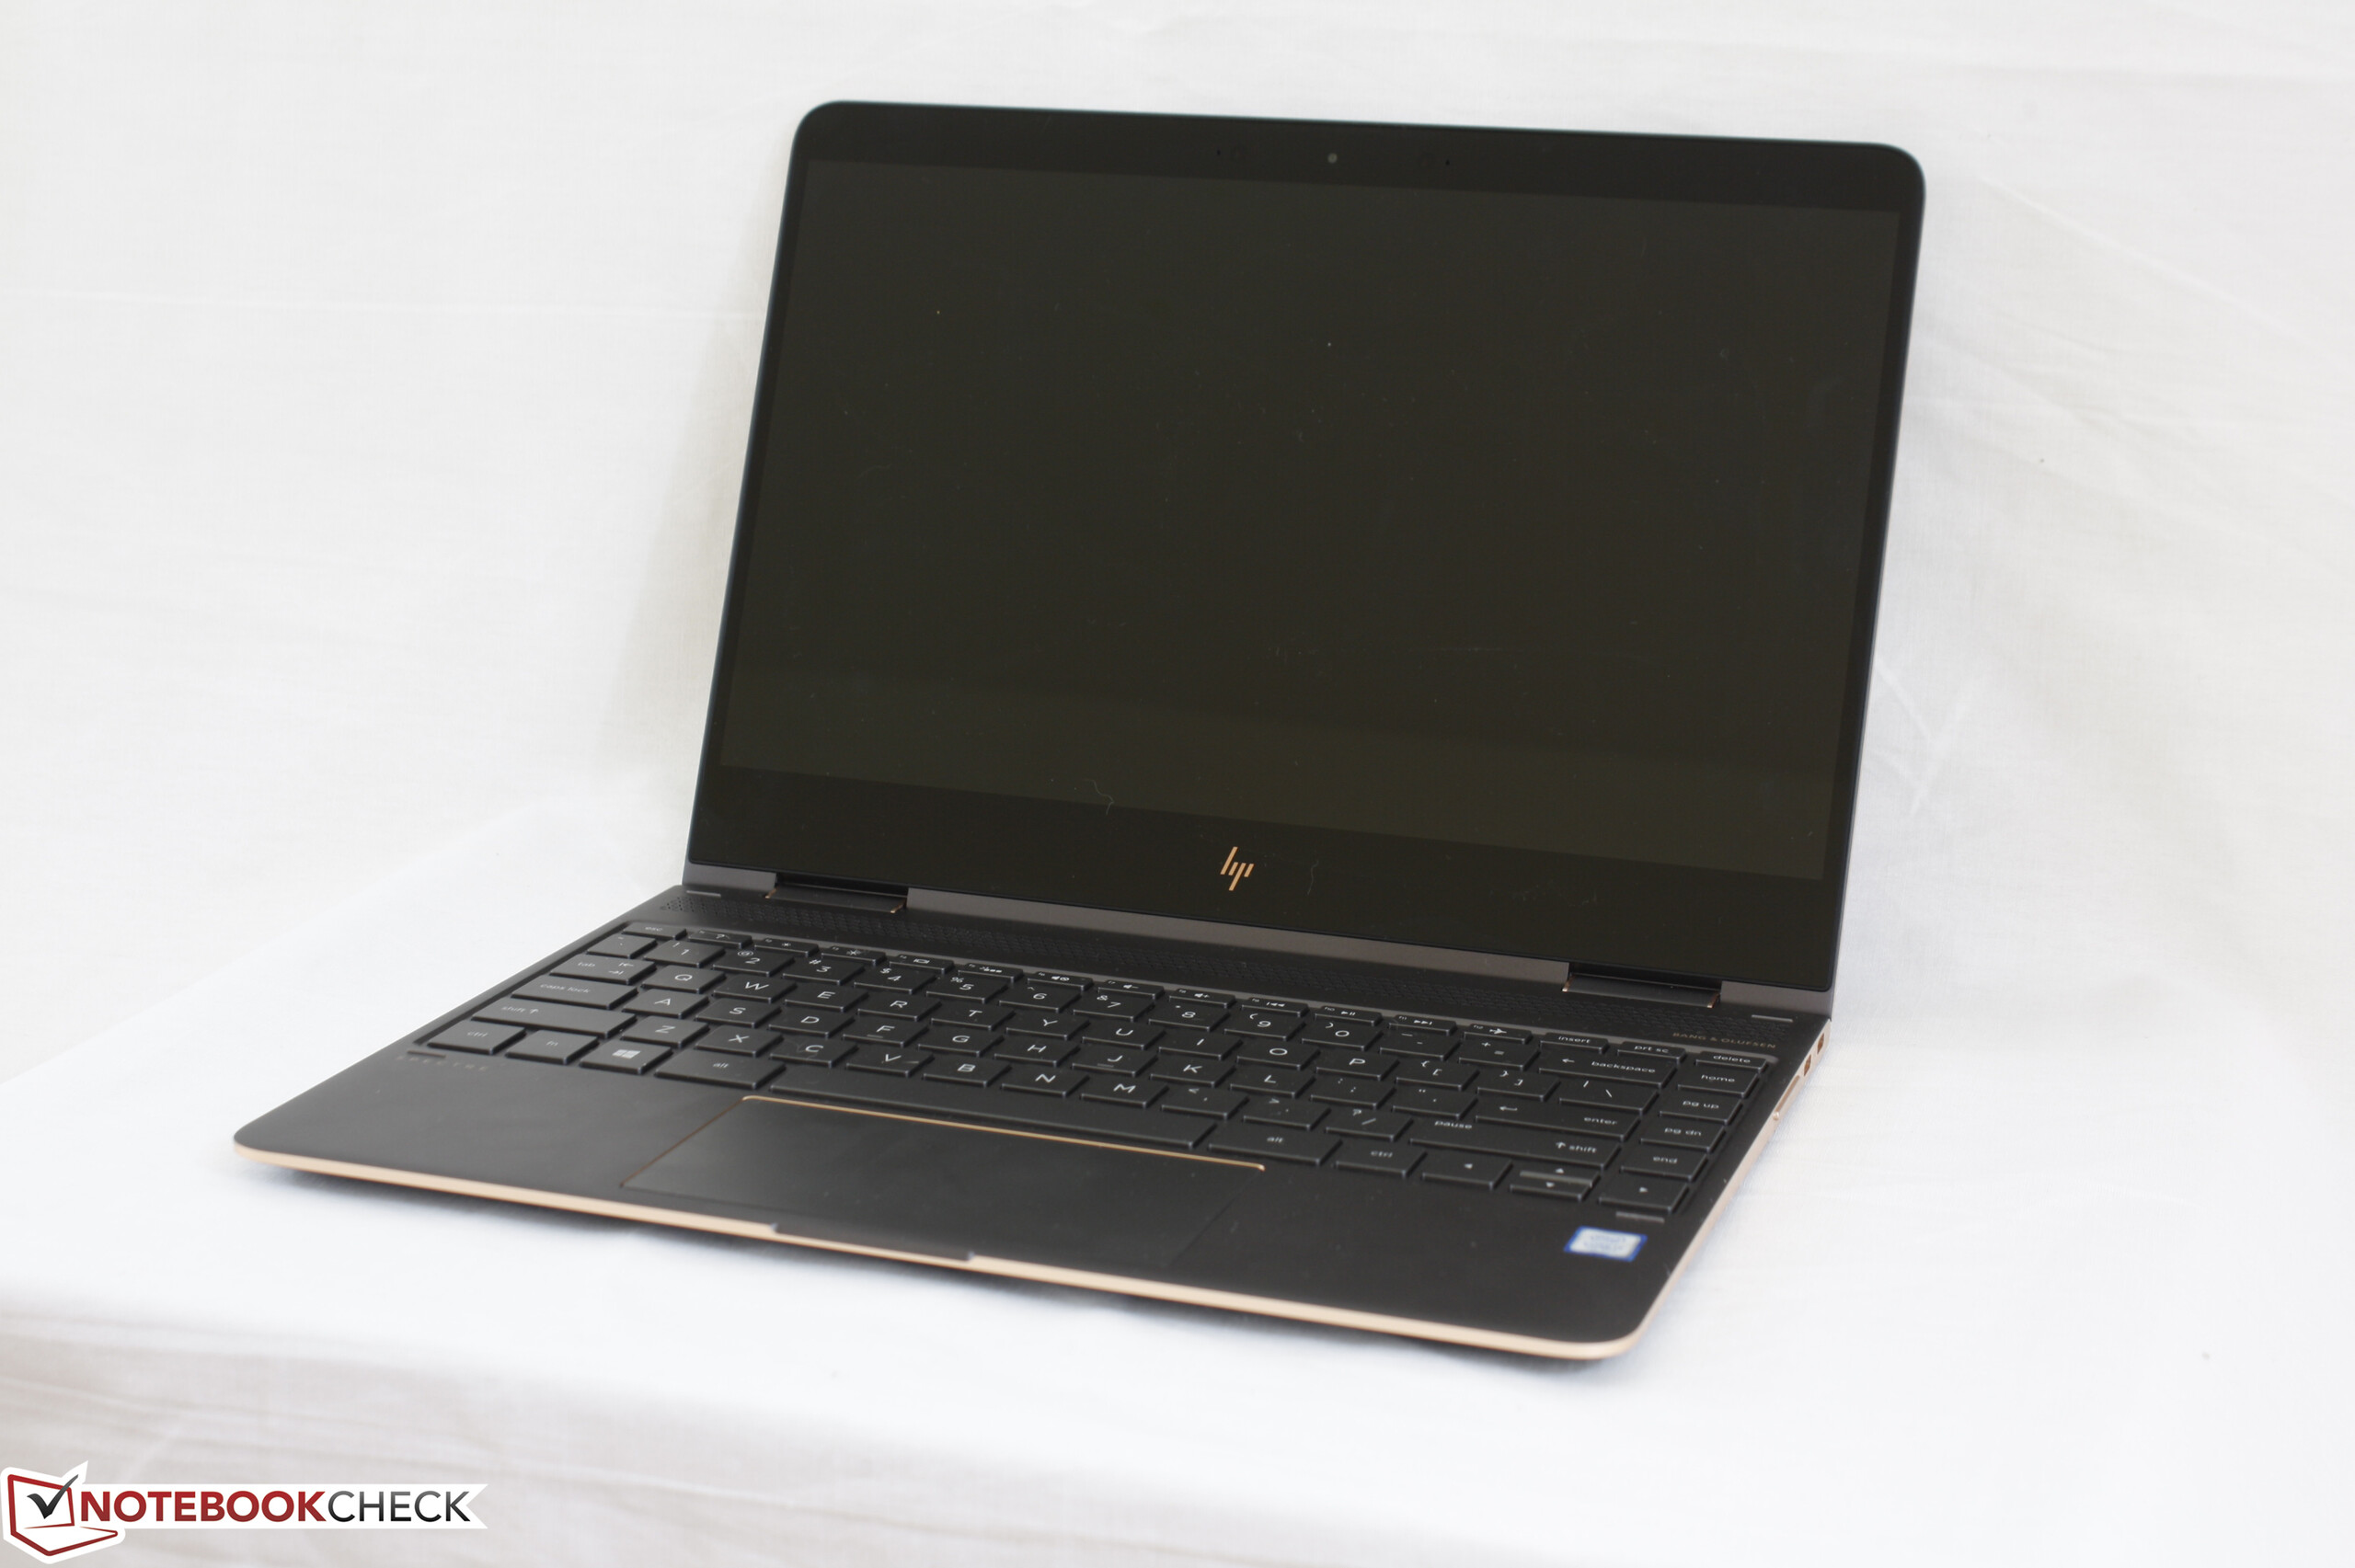
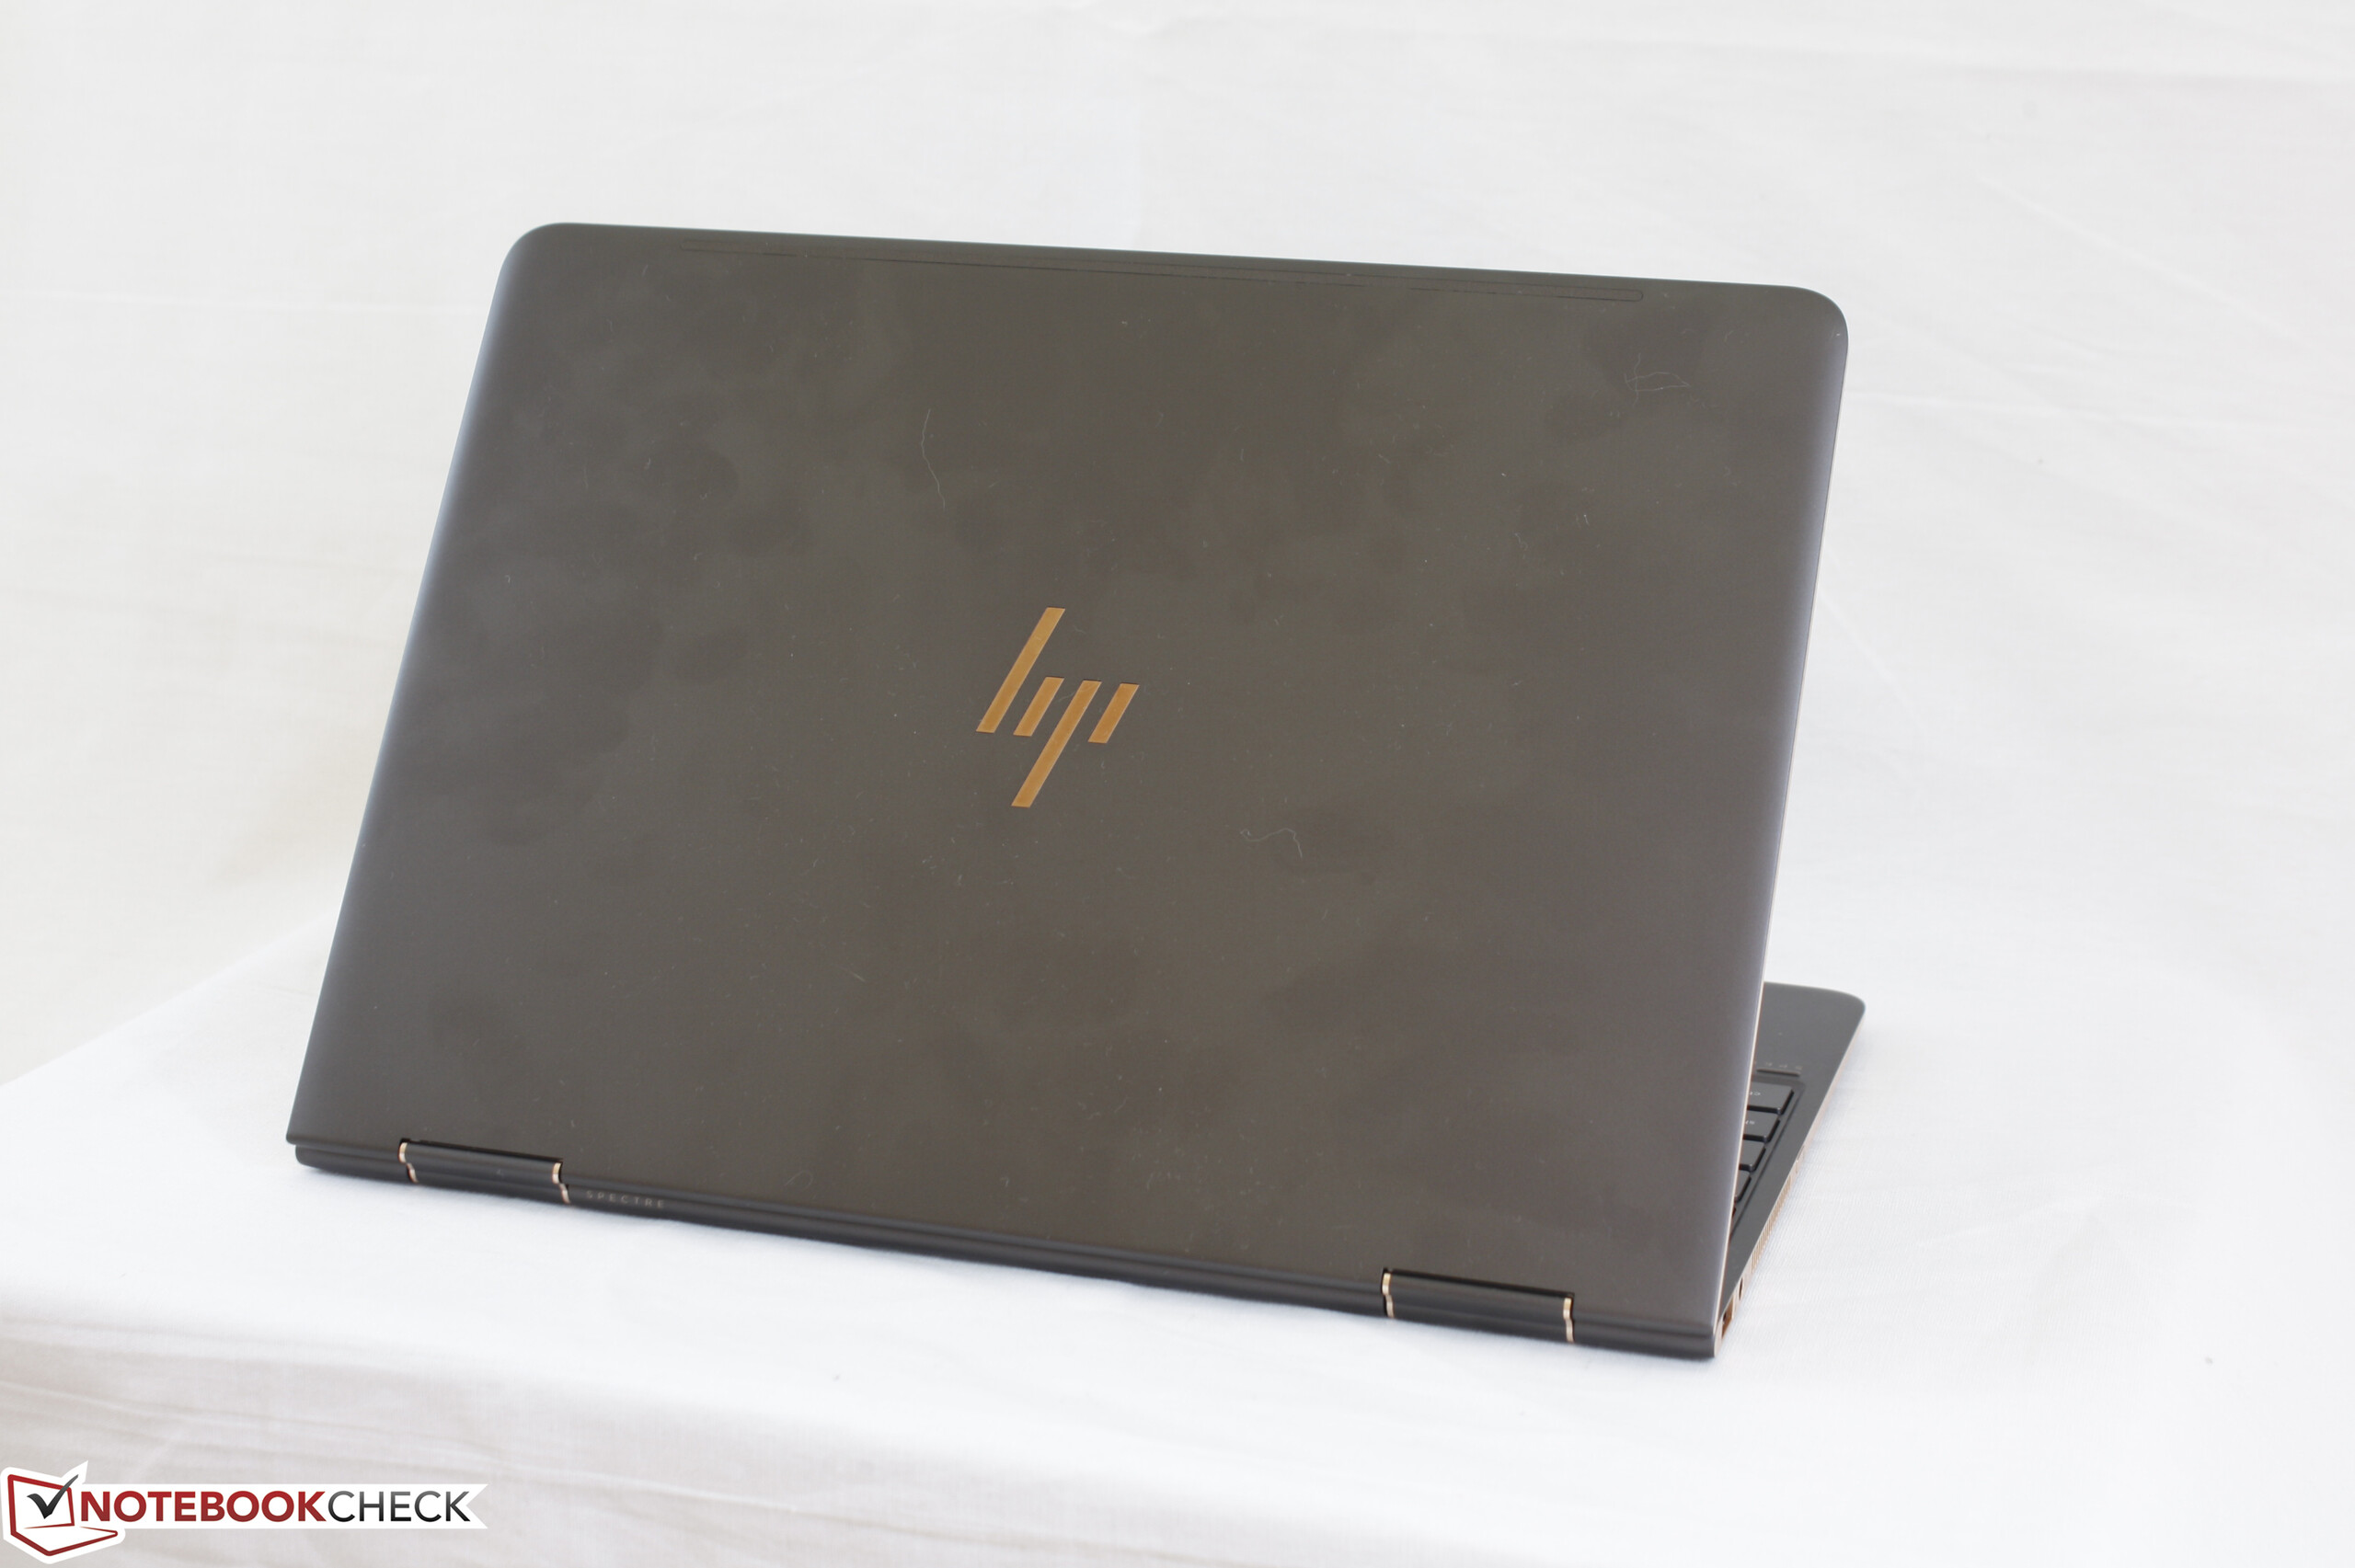
HP ha mejorado su ya estupendo Spectre x360 13 incorporando una pantalla UHD 4k y soporte para stylus active para mejorar la experiencia tablet. Sigue siendo el ligero y manejable 2-en-1 que hizo que el modelo de 2016 destacara como uno de los convertibles más prácticos de su categoría.
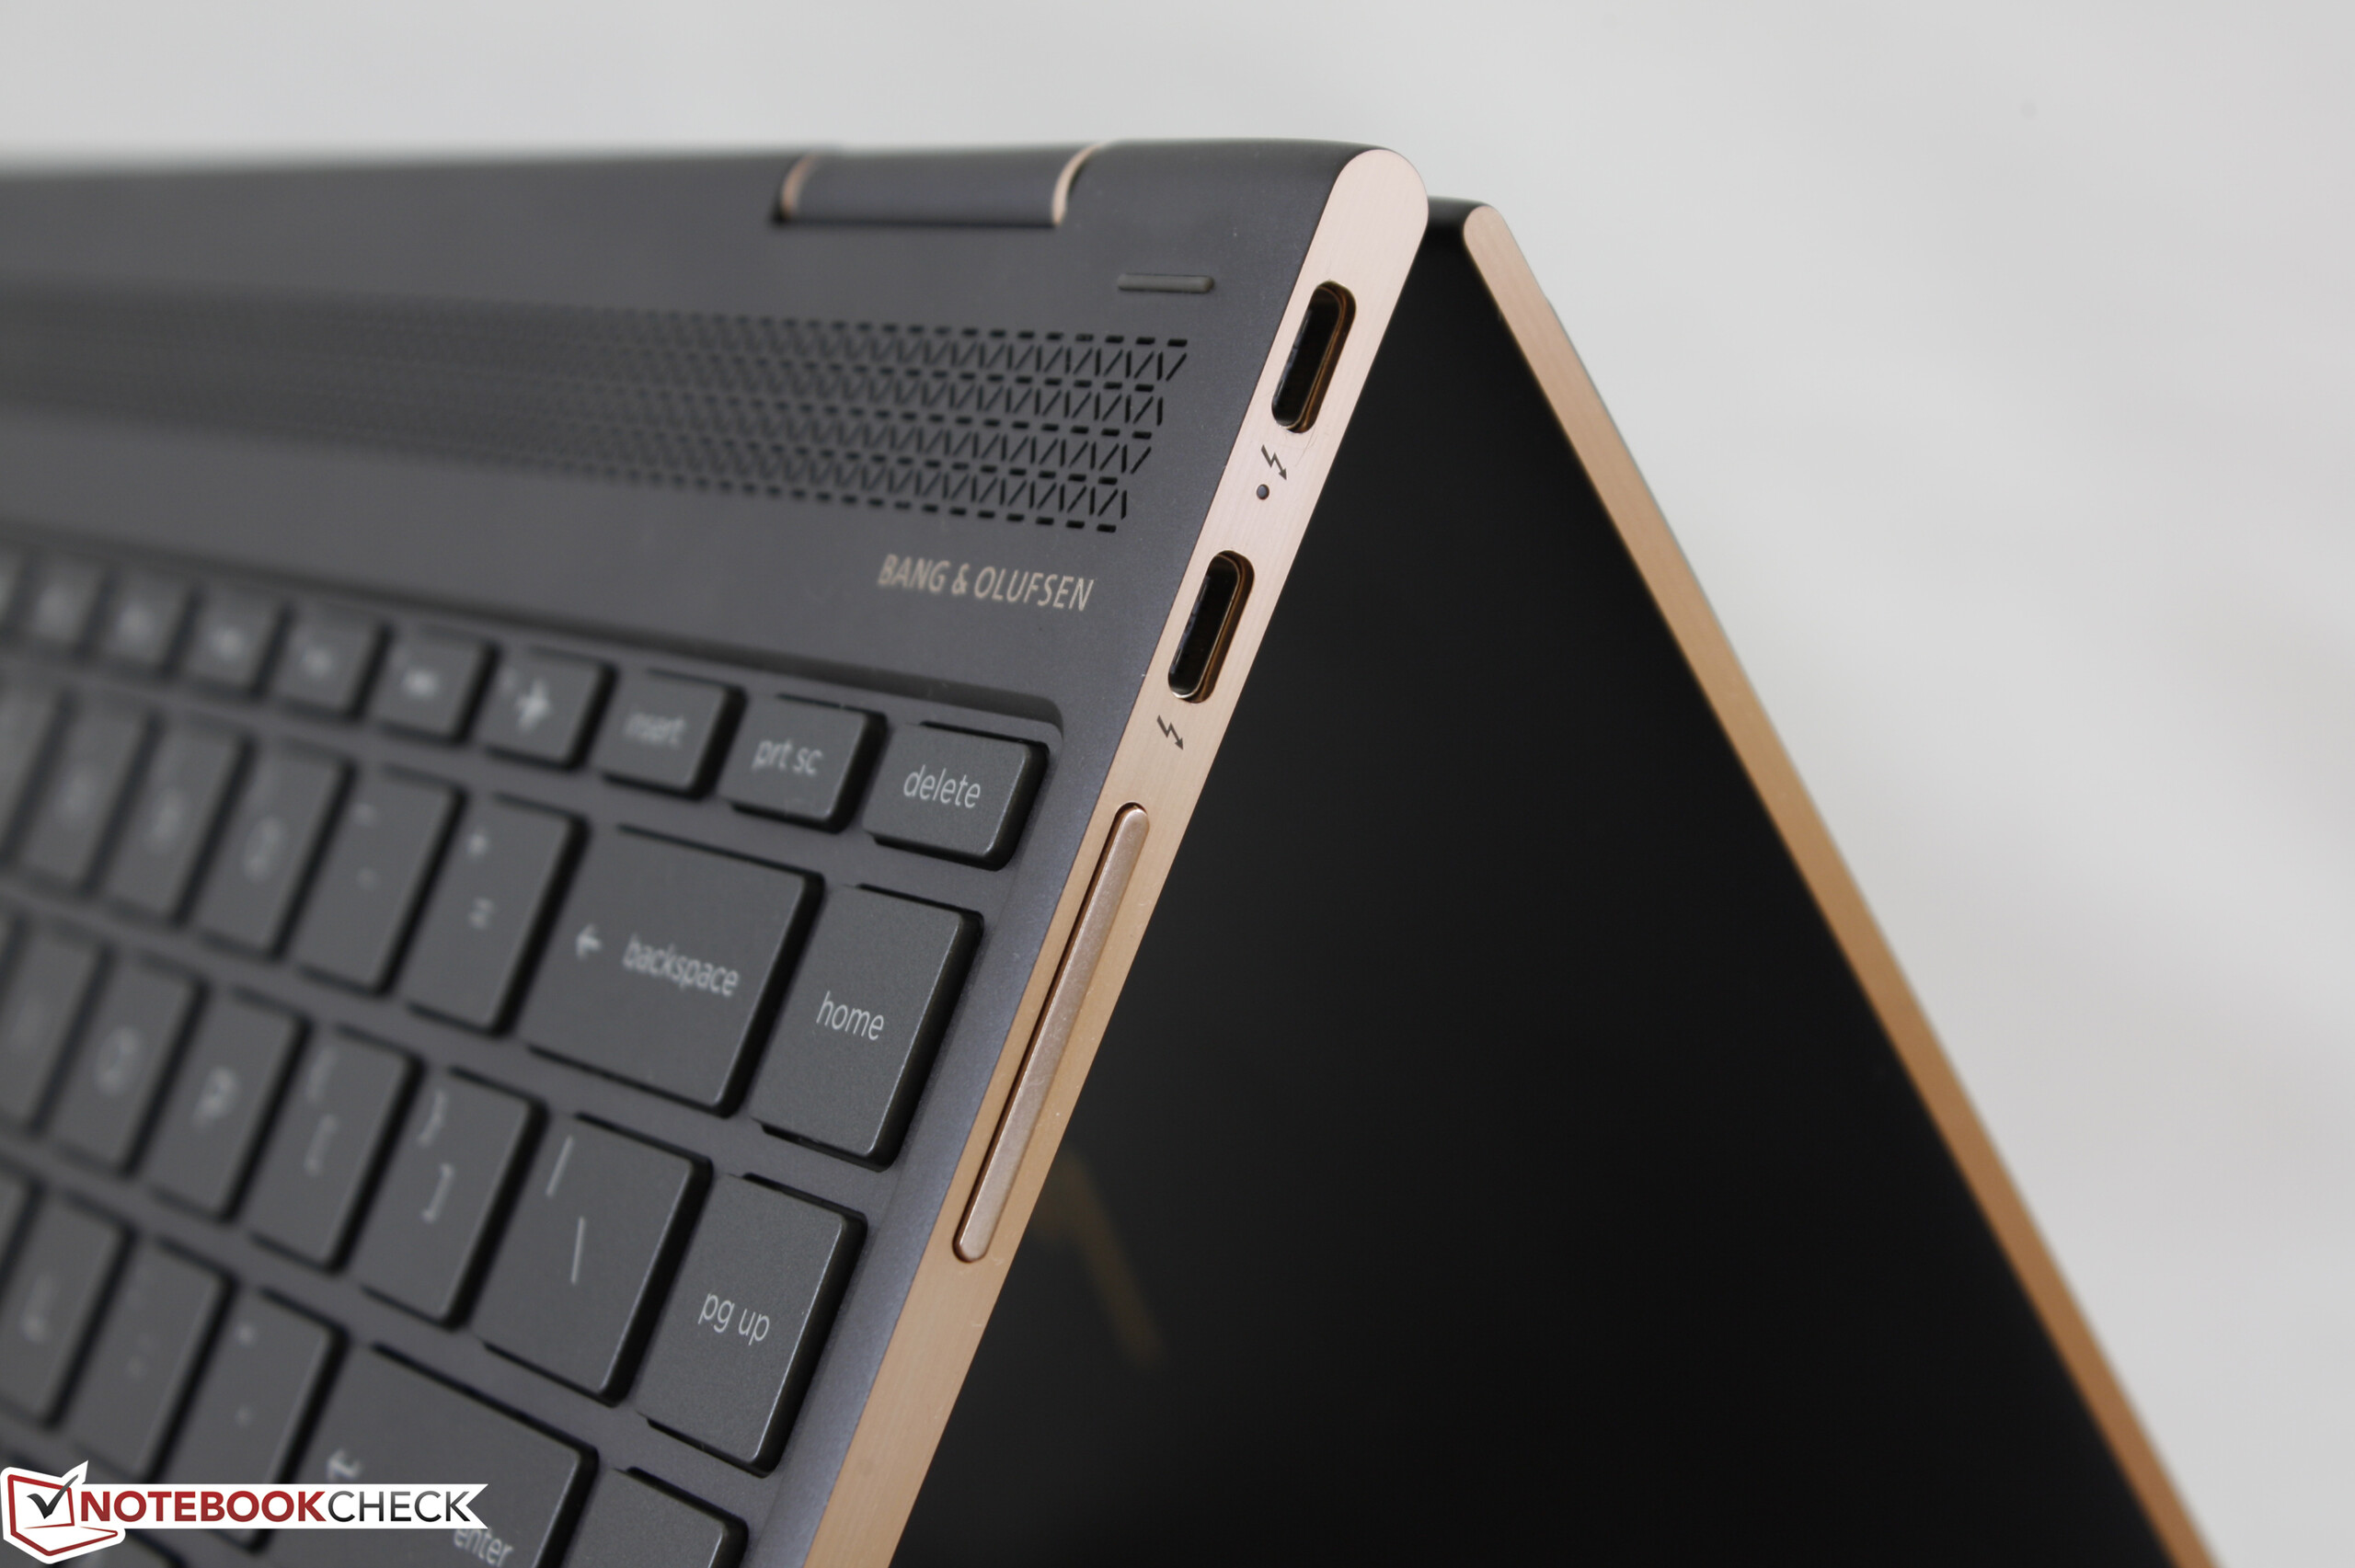
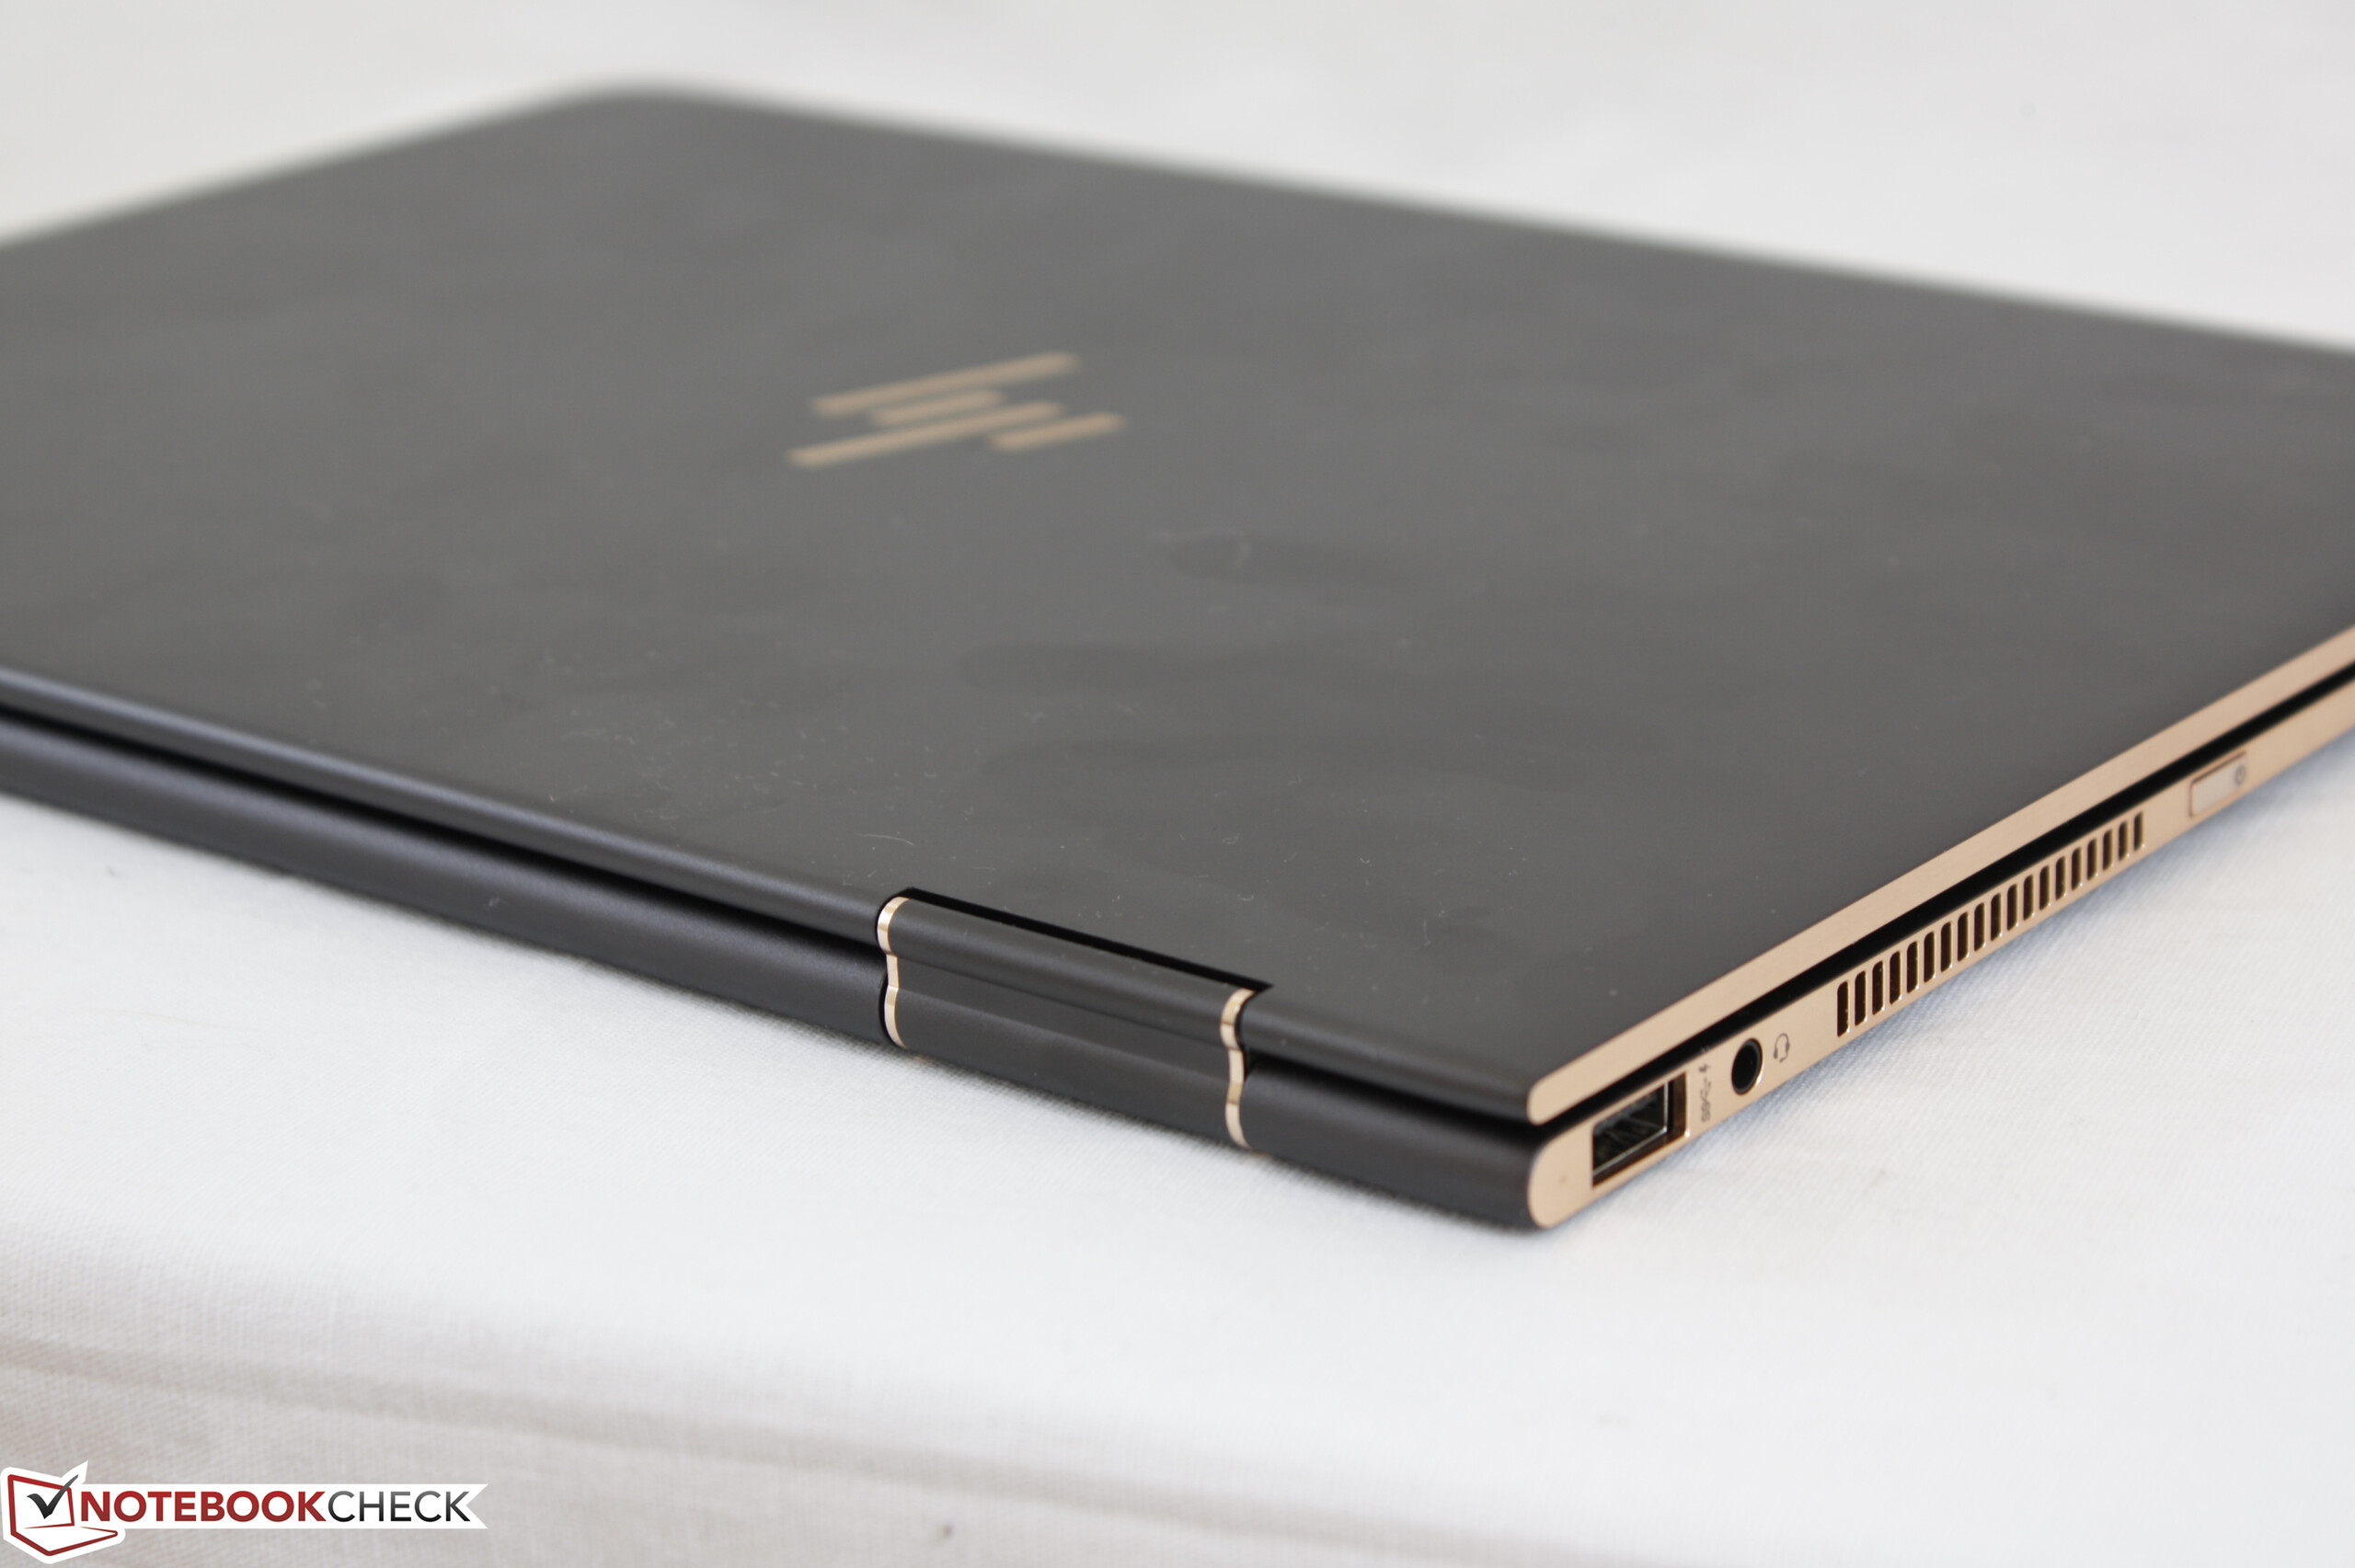
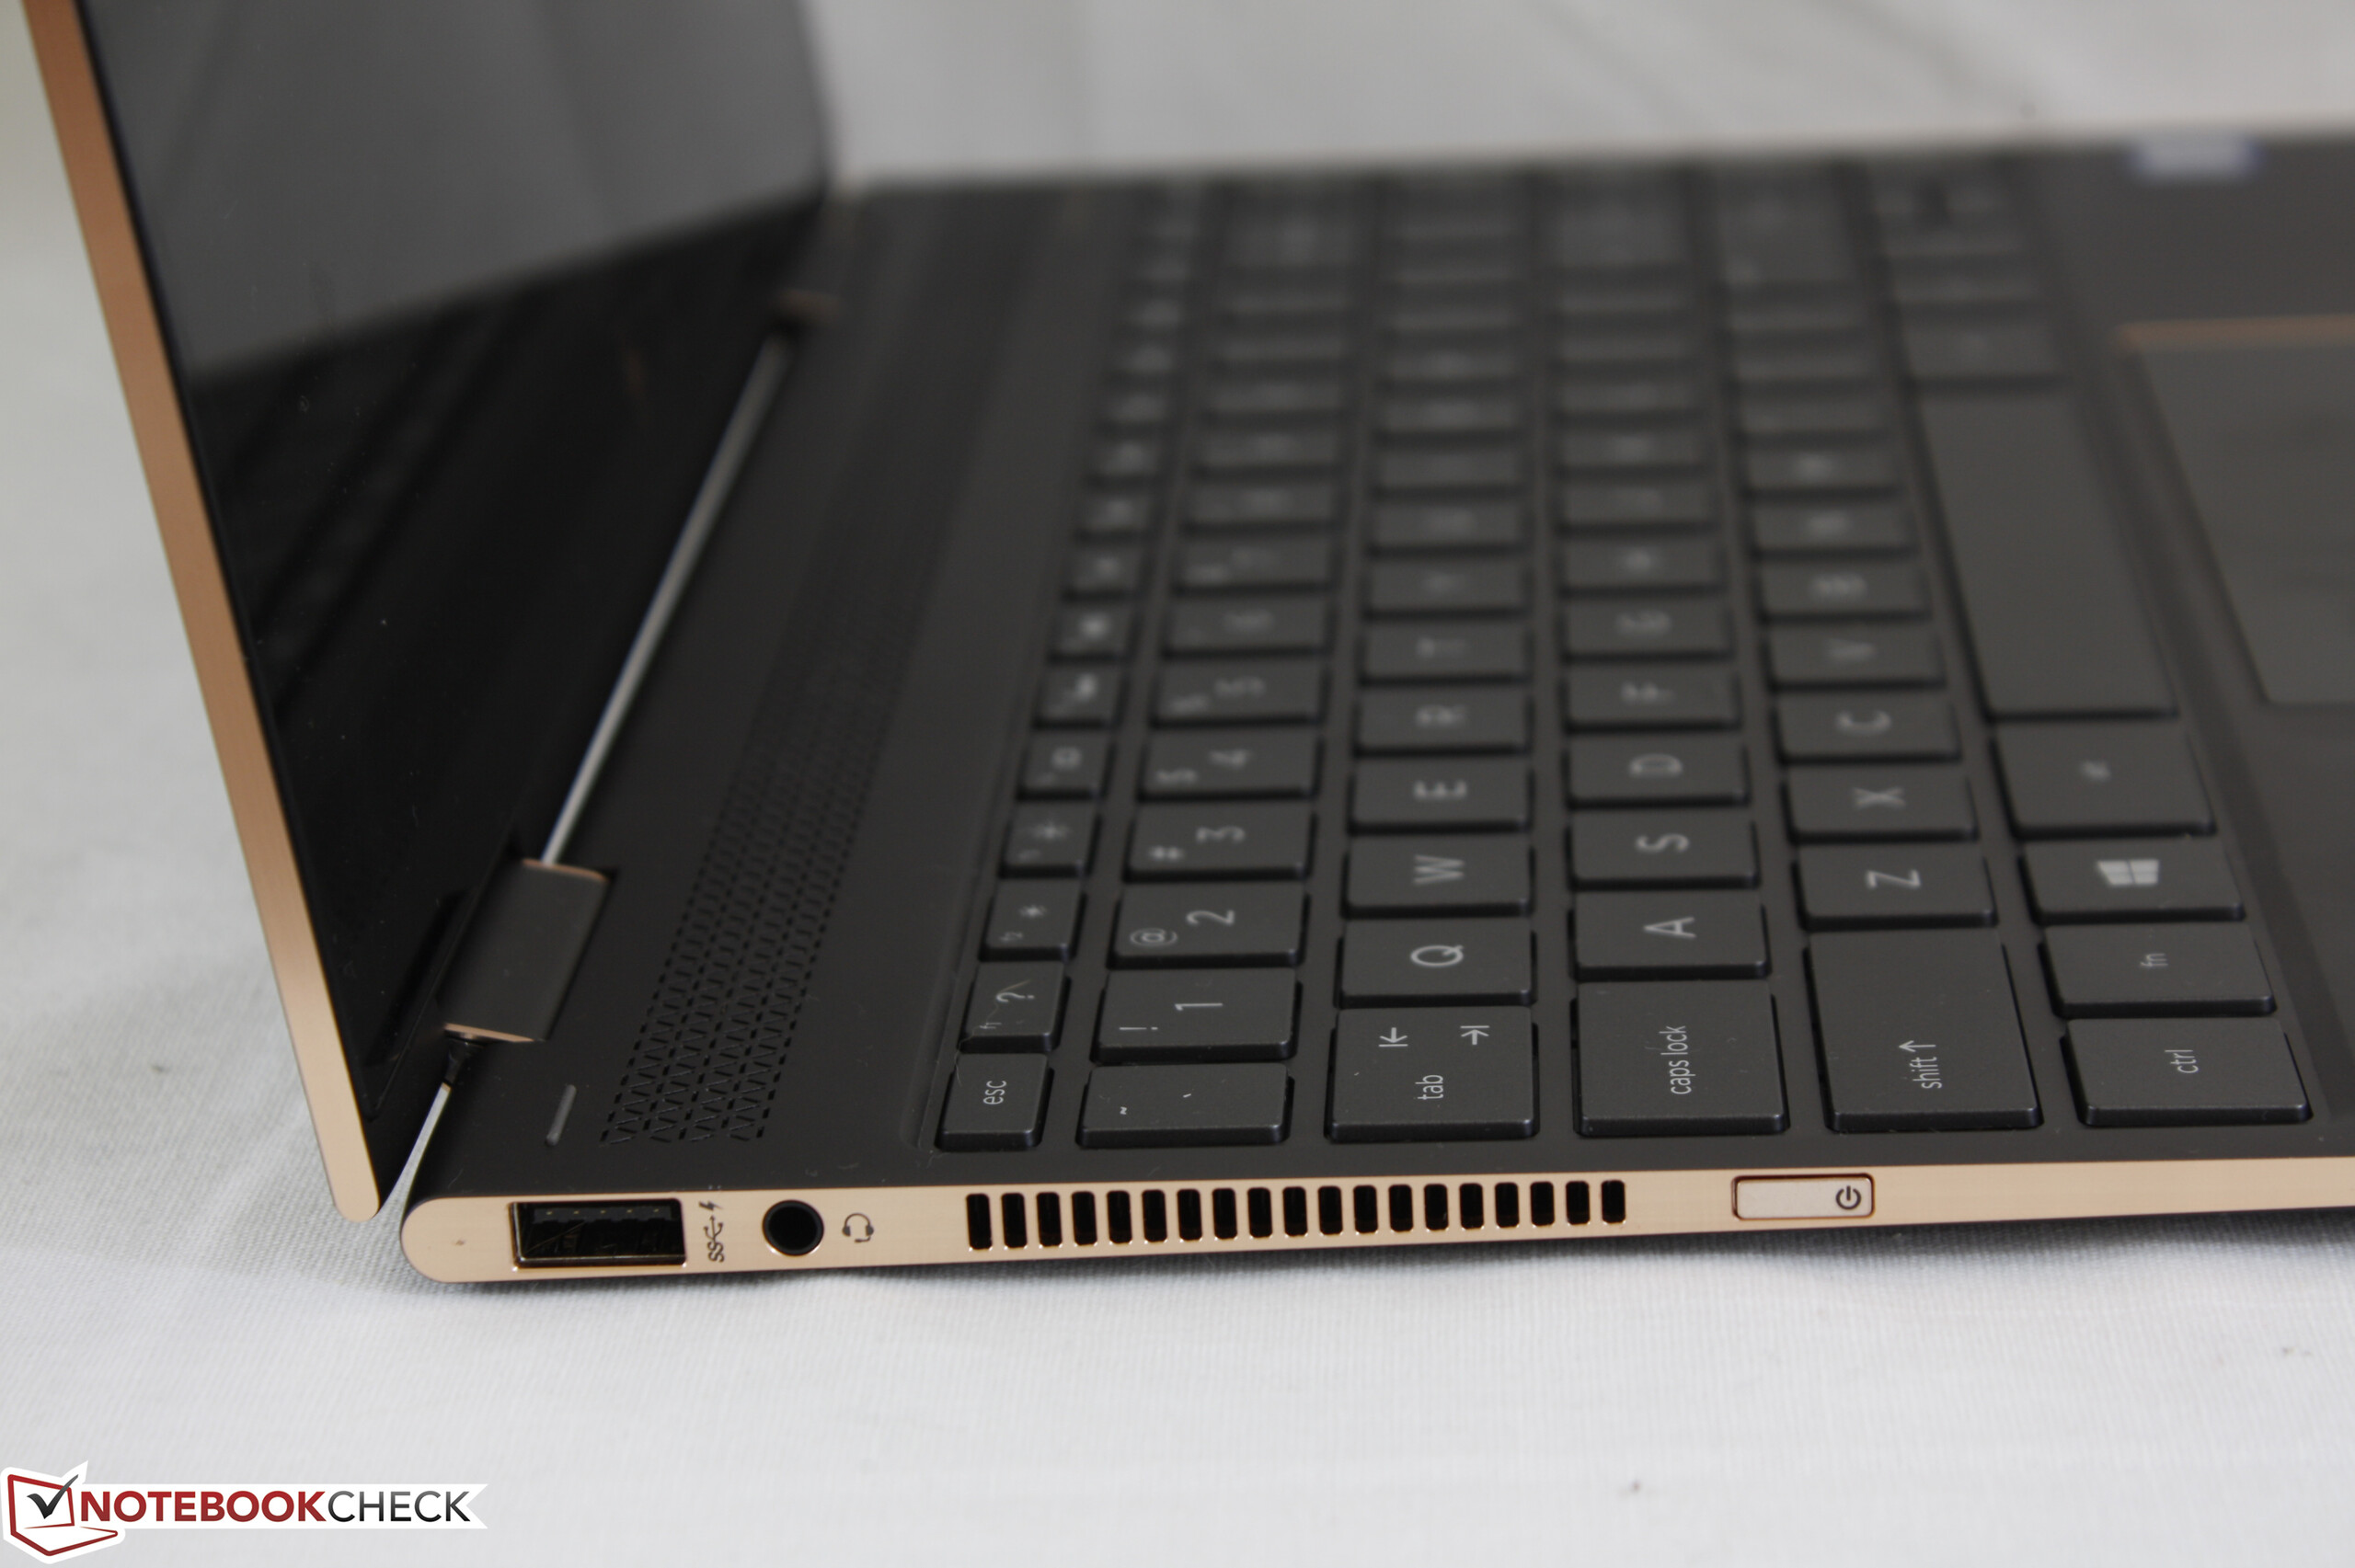
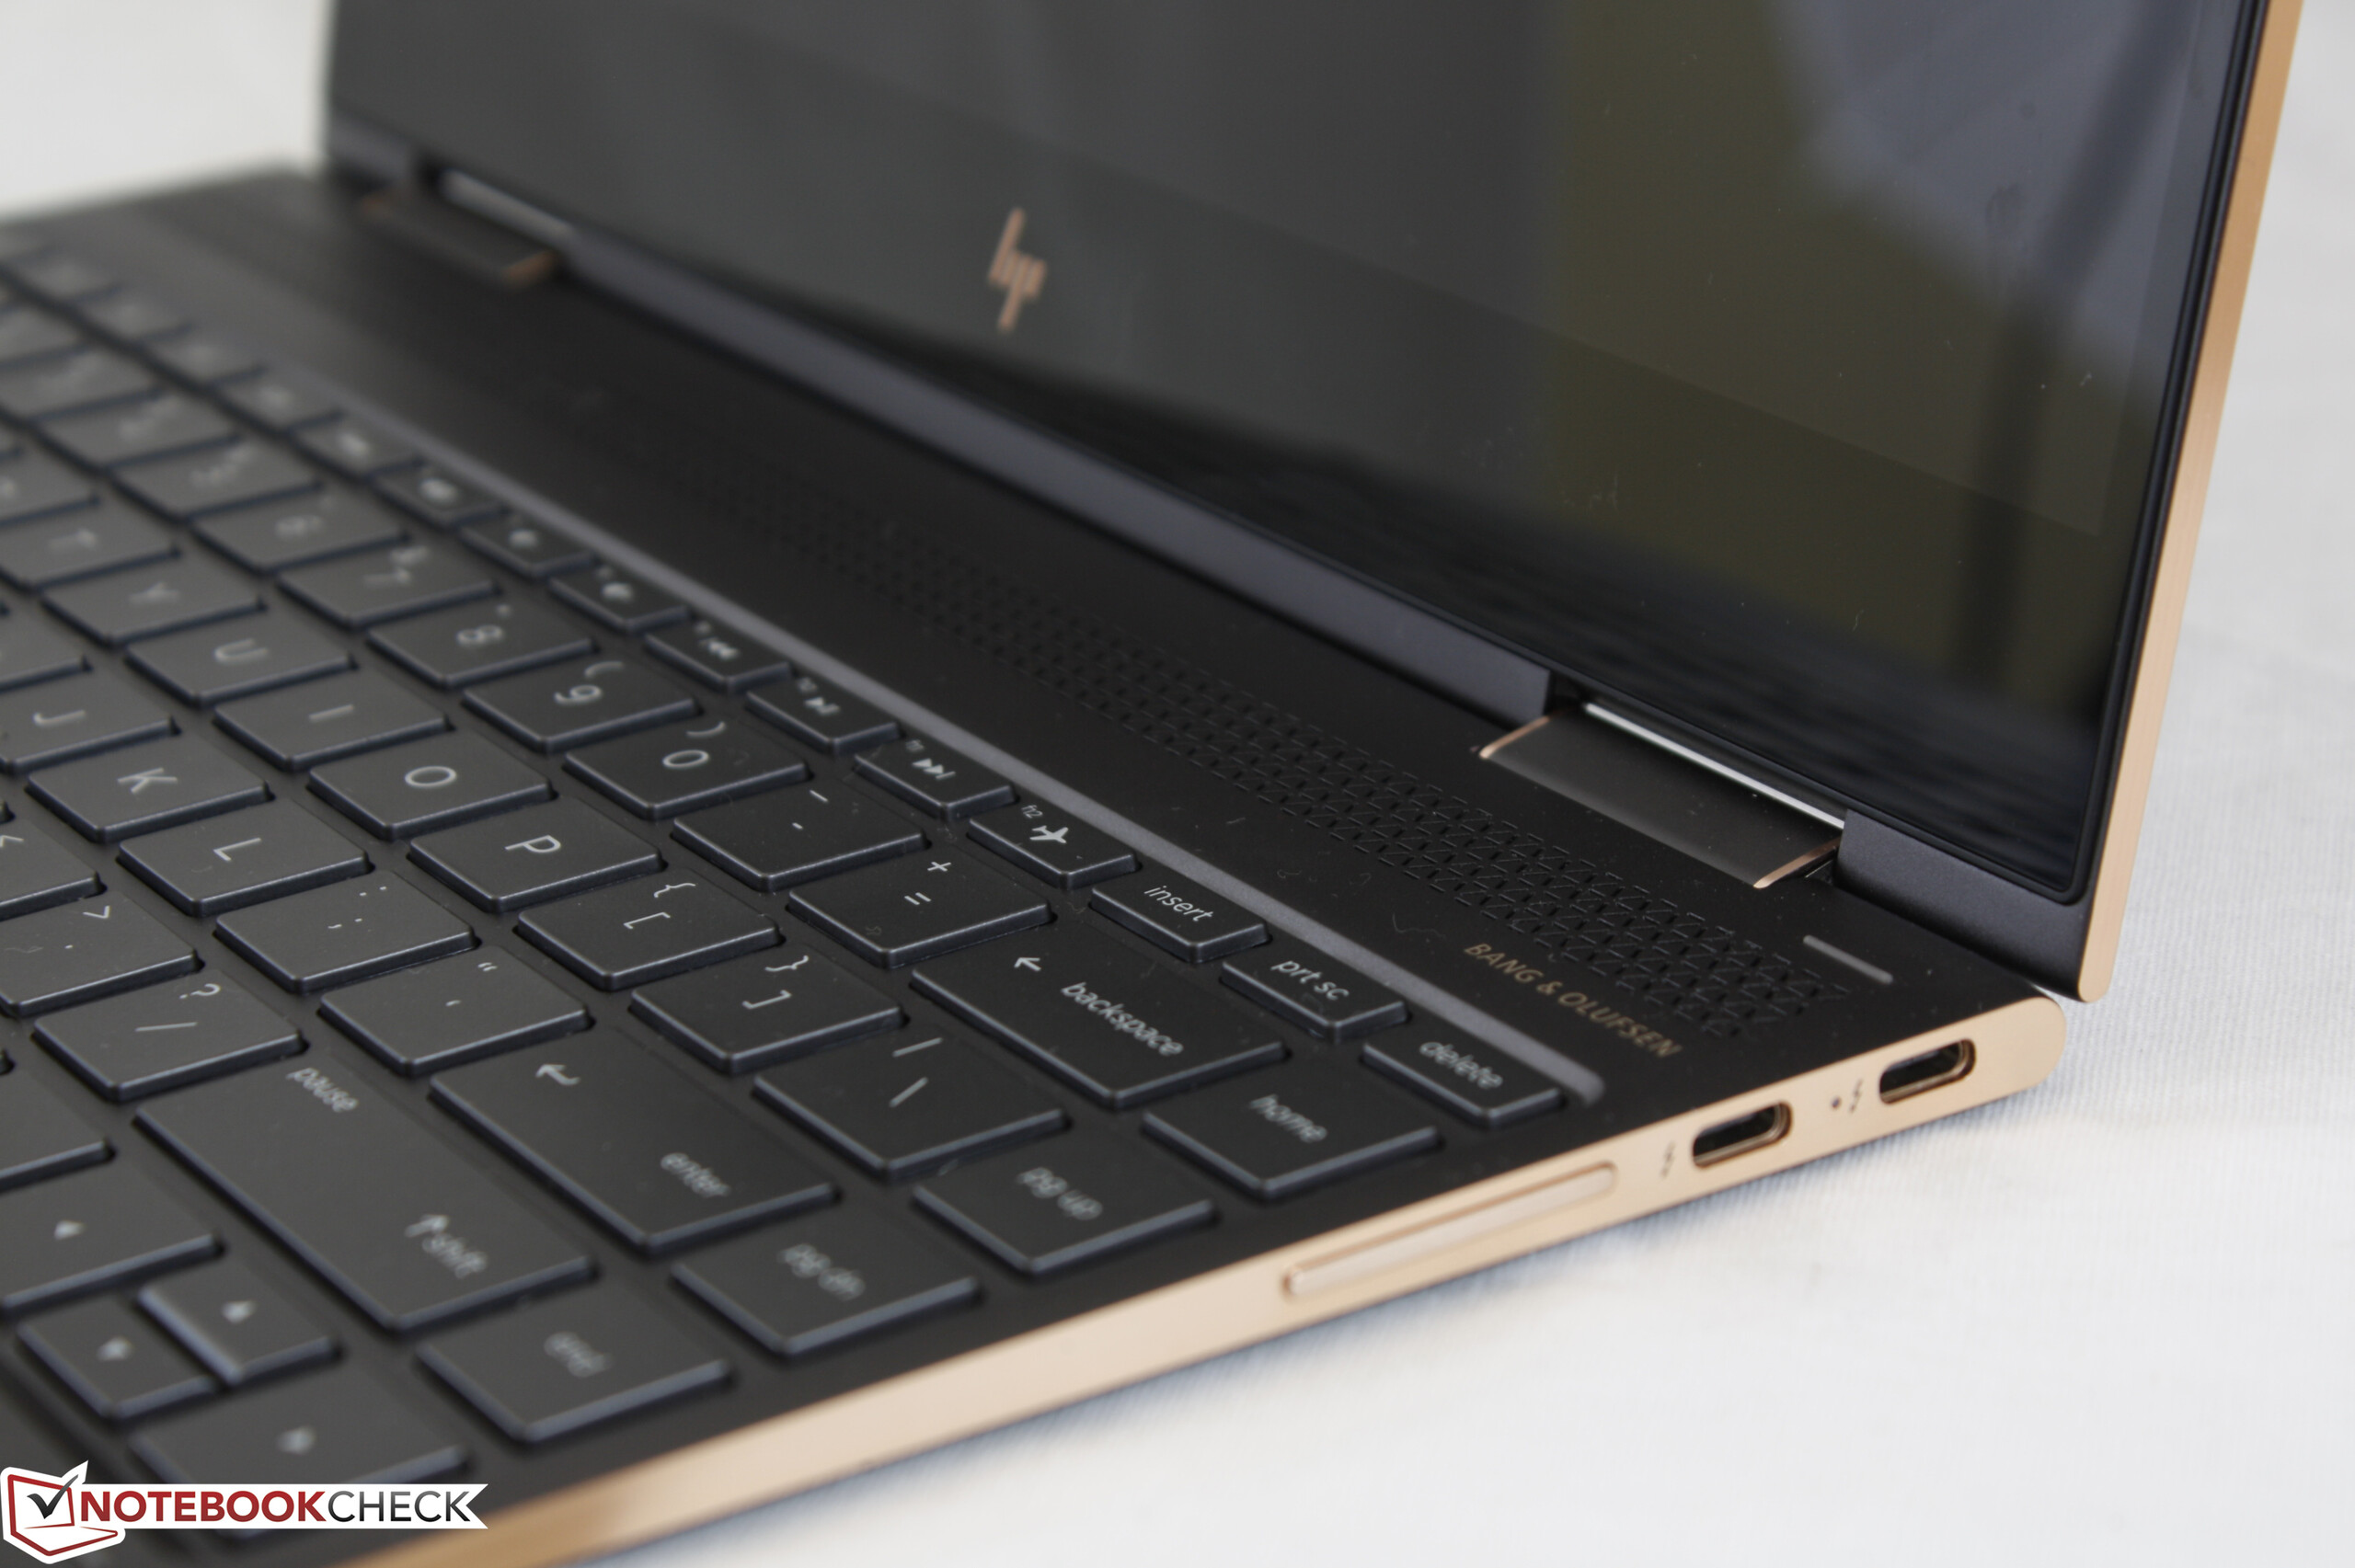
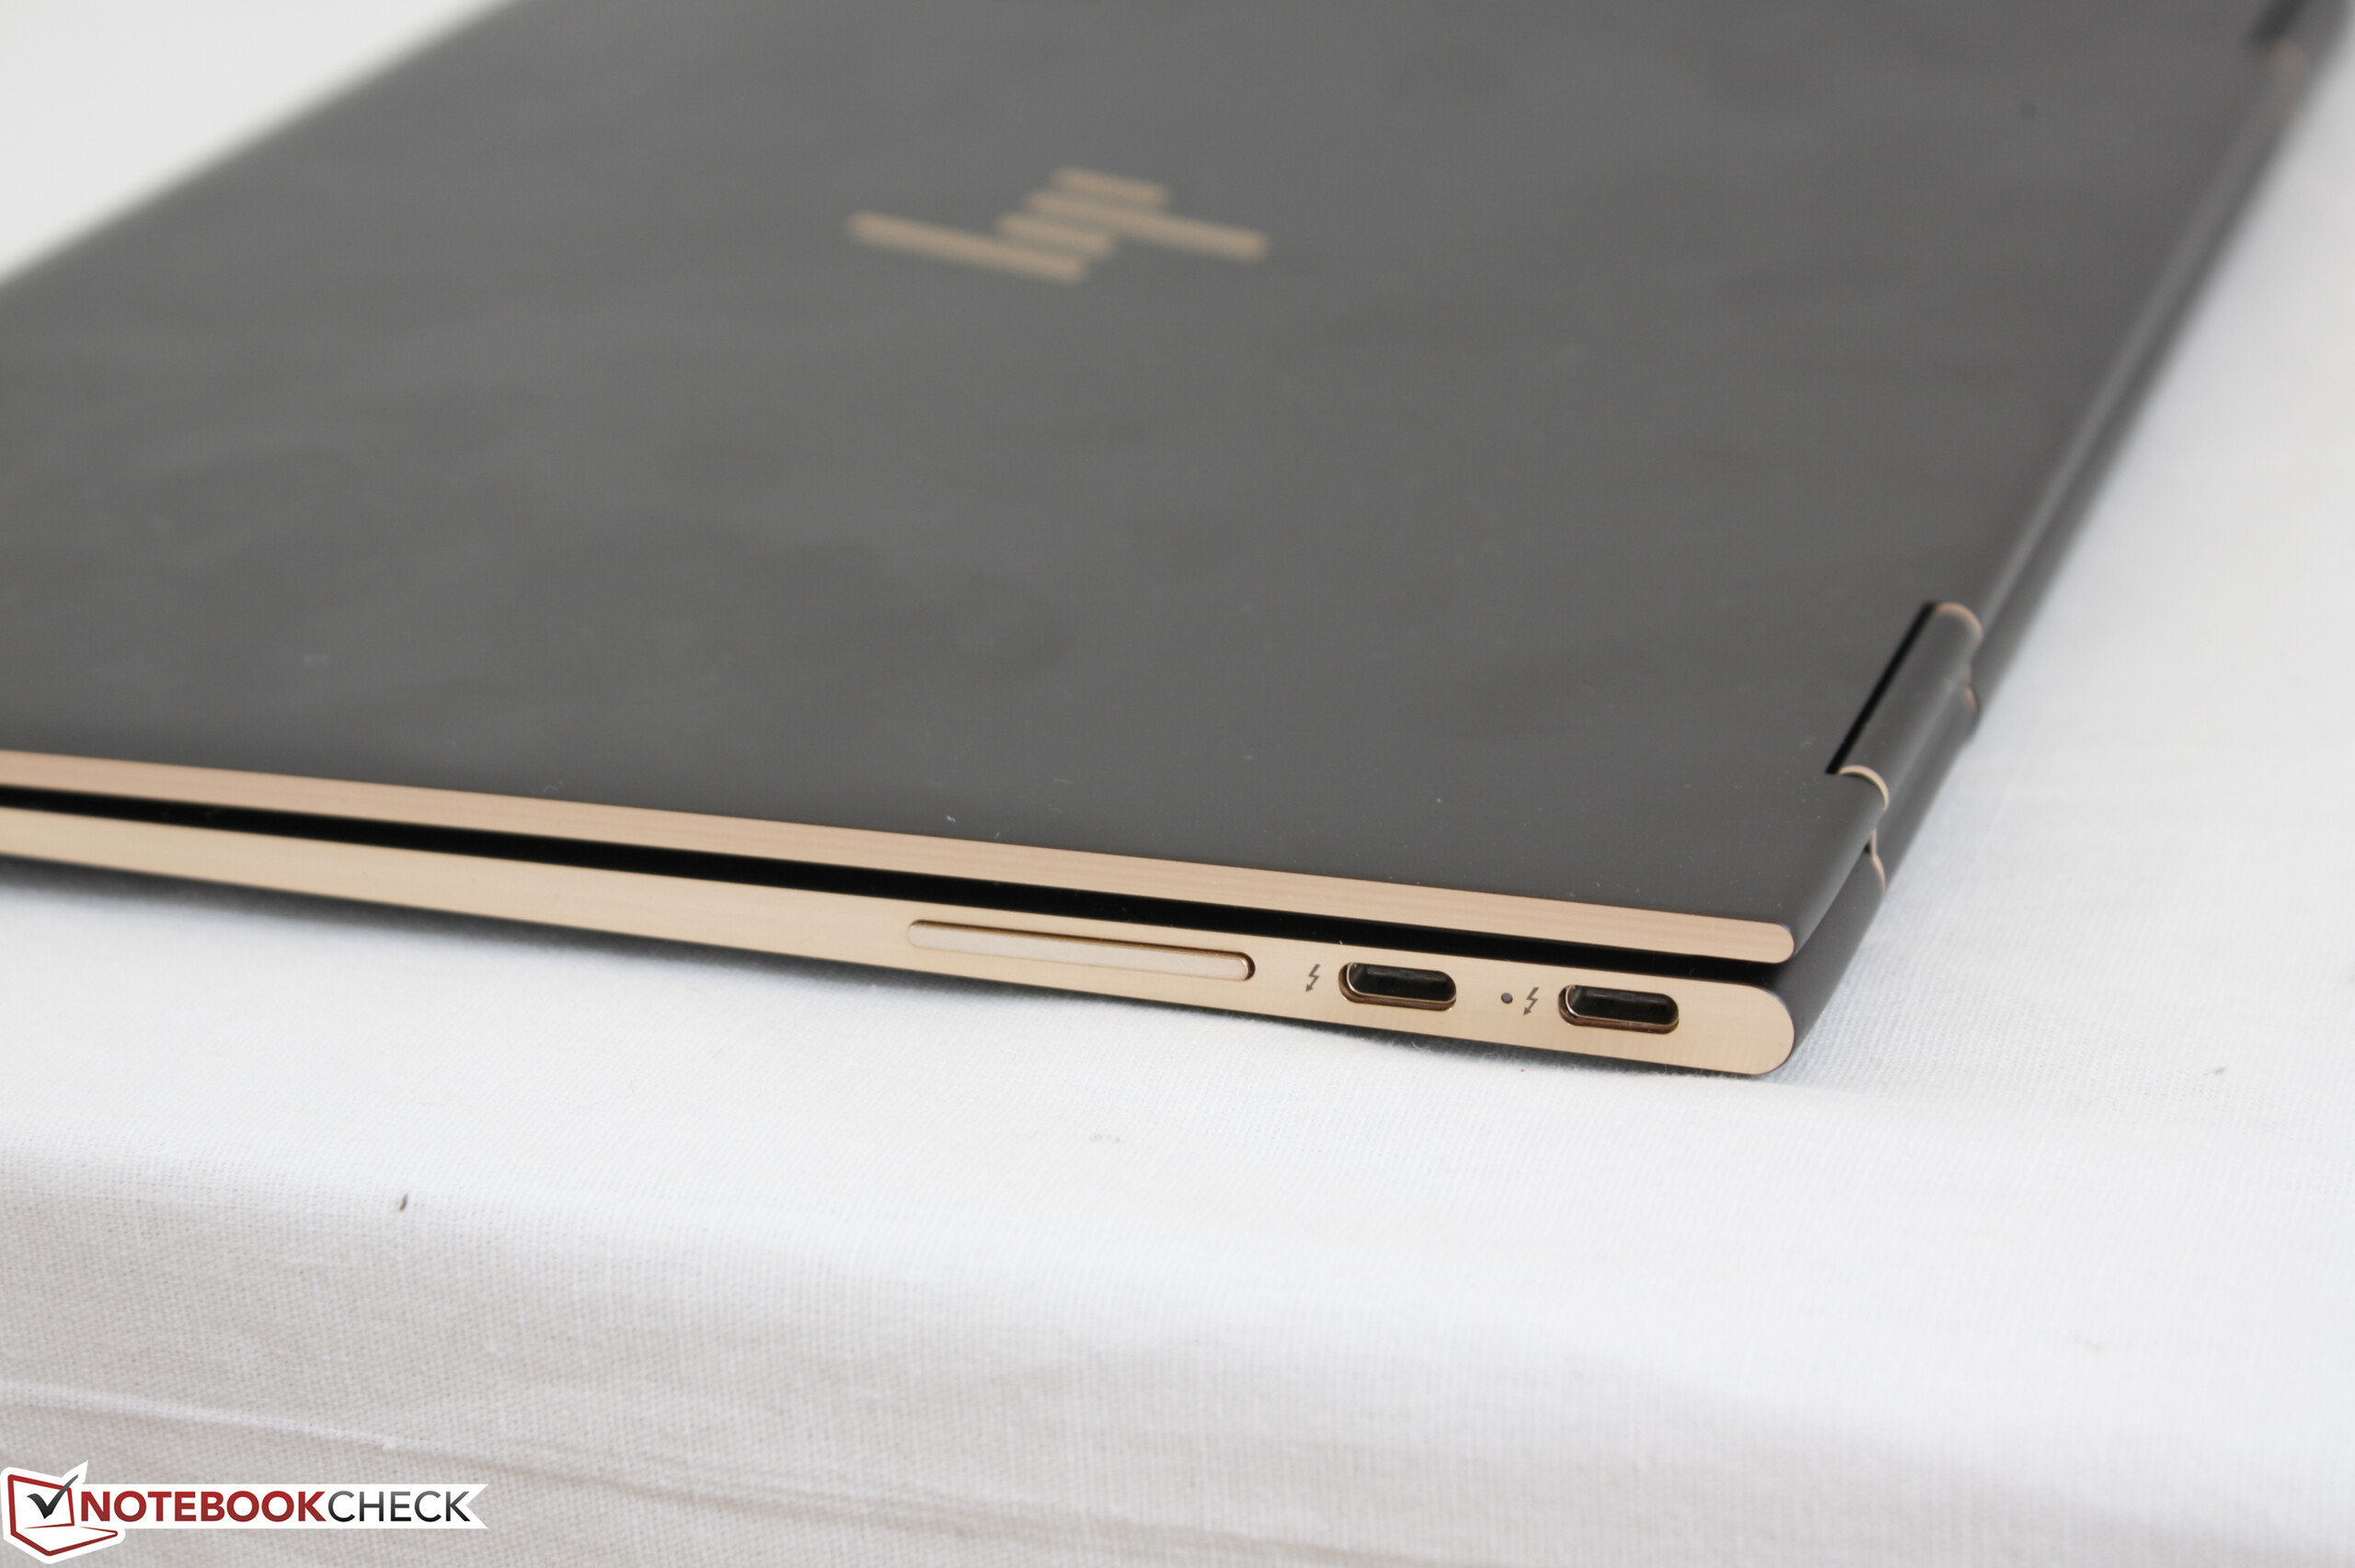
Aparte de las actualizaciones ya mencionadas, sin embargo, estamos un poco decepcionados con HP por no haber podido mejorar la experiencia aún más. Por ejemplo, añadiendo un lector SD, software pare el control manual de los ventiladores y una retroiluminación más brillante que habrían diferenciado esta actualización de la versión de 2016. Es tentador usar el Spectre x360 en exteriores especialmente ahora que se incluye un active stylus, pero la iluminación de la pantalla no es tan buena como podría haber sido.
Tanto el XPS 13 9365 como el Yoga 910 estaban disponibles meses antes que nuestro análisis inicial del Spectre x360 13 de 2016 cada uno con sus ventajas e inconvenientes. El Dell es más ligero y pequeño sin sacrificar tamaño de pantalla, pero no tiene opción de panel 4K y la CPU con refrigeración pasiva es mucho más lenta. Por otro lado el Yoga 910 tiene una pantalla ligeramente más grande con configuración 4K y i7-7500U, pero carece de soporte para stylus y es más ancho y pesado que el HP. El nuevo Spectre x360 13 está en tierra de nadie entre rendimiento y portabilidad, combinando lo mejor de ambos mundos.
Esta temprana actualización finalmente proporciona pantalla 4K UHD y soporte para stylus en el ya admirado Spectre x360 de 2016. No ha cambiado mucho más, pero tampoco hacía falta - el convertible impresiona por su excelente equilibrio entre tamaño y rendimiento.
Ésta es una versión acortada del análisis original. Puedes leer el análisis completo en inglés aquí.
HP Spectre x360 13-ac033dx
- 04/05/2017 v6 (old)
Allen Ngo
Price comparison
