Breve análisis del portátil Asus VivoBook S X510UA (7100U, HD)
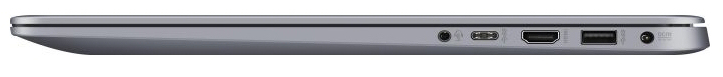
Connectivity
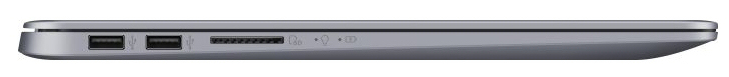
| SD Card Reader | |
| average JPG Copy Test (av. of 3 runs) | |
| Fujitsu Lifebook A557 (Toshiba Exceria Pro SDXC 64 GB UHS-II) | |
| Acer Aspire 3 A315-51-55E4 (Toshiba Exceria Pro SDXC 64 GB UHS-II) | |
| HP 15-ba077ng (Toshiba Exceria Pro SDXC 64 GB UHS-II) | |
| Asus X510UA-BR305T (Toshiba Exceria Pro SDXC 64 GB UHS-II) | |
| Lenovo Ideapad 310-15IKB (Toshiba Exceria Pro SDXC 64 GB UHS-II) | |
| HP 15-ay116ng (Toshiba Exceria Pro SDXC 64 GB UHS-II) | |
| maximum AS SSD Seq Read Test (1GB) | |
| Fujitsu Lifebook A557 (Toshiba Exceria Pro SDXC 64 GB UHS-II) | |
| Acer Aspire 3 A315-51-55E4 (Toshiba Exceria Pro SDXC 64 GB UHS-II) | |
| Asus X510UA-BR305T (Toshiba Exceria Pro SDXC 64 GB UHS-II) | |
| HP 15-ba077ng (Toshiba Exceria Pro SDXC 64 GB UHS-II) | |
| HP 15-ay116ng (Toshiba Exceria Pro SDXC 64 GB UHS-II) | |
| Lenovo Ideapad 310-15IKB (Toshiba Exceria Pro SDXC 64 GB UHS-II) | |
| Networking | |
| iperf3 transmit AX12 | |
| Asus X510UA-BR305T | |
| Fujitsu Lifebook A557 | |
| Acer Aspire 3 A315-51-55E4 | |
| HP 15-ba077ng | |
| iperf3 receive AX12 | |
| Fujitsu Lifebook A557 | |
| Asus X510UA-BR305T | |
| Acer Aspire 3 A315-51-55E4 | |
| HP 15-ba077ng | |
| |||||||||||||||||||||||||
iluminación: 90 %
Brillo con batería: 229 cd/m²
Contraste: 443:1 (Negro: 0.51 cd/m²)
ΔE ColorChecker Calman: 6.21 | ∀{0.5-29.43 Ø4.71}
ΔE Greyscale Calman: 7.06 | ∀{0.09-98 Ø4.96}
Gamma: 2.35
CCT: 8321 K
| Asus X510UA-BR305T TN LED, 1366x768, 15.6" | Acer Aspire 3 A315-51-55E4 TN LED, 1920x1080, 15.6" | Fujitsu Lifebook A557 a-Si TFT-LCD , LCM, 1920x1080, 15.6" | Lenovo Ideapad 310-15IKB TN LED, 1920x1080, 15.6" | HP 15-ay116ng TN LED, 1920x1080, 15.6" | |
|---|---|---|---|---|---|
| Display | |||||
| Display P3 Coverage (%) | 35.97 | 41.85 | 38.07 | 37.34 | |
| sRGB Coverage (%) | 54.1 | 62.9 | 57.3 | 56.2 | |
| AdobeRGB 1998 Coverage (%) | 37.17 | 43.24 | 39.34 | 38.58 | |
| Response Times | 12% | -81% | -19% | -23% | |
| Response Time Grey 50% / Grey 80% * (ms) | 49 ? | 44 ? 10% | 55 ? -12% | 43 ? 12% | 40 ? 18% |
| Response Time Black / White * (ms) | 14 ? | 12 ? 14% | 35 ? -150% | 21 ? -50% | 23 ? -64% |
| PWM Frequency (Hz) | 25000 ? | 200 ? | |||
| Screen | 22% | 48% | -7% | -29% | |
| Brightness middle (cd/m²) | 226 | 241 7% | 287 27% | 185 -18% | 249 10% |
| Brightness (cd/m²) | 215 | 229 7% | 260 21% | 184 -14% | 234 9% |
| Brightness Distribution (%) | 90 | 87 -3% | 83 -8% | 95 6% | 89 -1% |
| Black Level * (cd/m²) | 0.51 | 0.46 10% | 0.22 57% | 0.28 45% | 0.44 14% |
| Contrast (:1) | 443 | 524 18% | 1305 195% | 661 49% | 566 28% |
| Colorchecker dE 2000 * | 6.21 | 3.4 45% | 4.21 32% | 8.07 -30% | 11.71 -89% |
| Colorchecker dE 2000 max. * | 8.9 | 7.61 14% | 8.81 1% | 14.83 -67% | 19.51 -119% |
| Greyscale dE 2000 * | 7.06 | 1.7 76% | 2.68 62% | 8.83 -25% | 13.13 -86% |
| Gamma | 2.35 94% | 2.36 93% | 2.5 88% | 2.47 89% | 2.57 86% |
| CCT | 8321 78% | 6750 96% | 6066 107% | 10628 61% | 15273 43% |
| Color Space (Percent of AdobeRGB 1998) (%) | 34 | 40 | 36.2 | 36 | |
| Color Space (Percent of sRGB) (%) | 54 | 63 | 57 | 56 | |
| Media total (Programa/Opciones) | 17% /
20% | -17% /
23% | -13% /
-9% | -26% /
-28% |
* ... más pequeño es mejor
Parpadeo de Pantalla / PWM (Pulse-Width Modulation)
| Parpadeo de Pantalla / PWM detectado | 25000 Hz | ≤ 20 % de brillo | 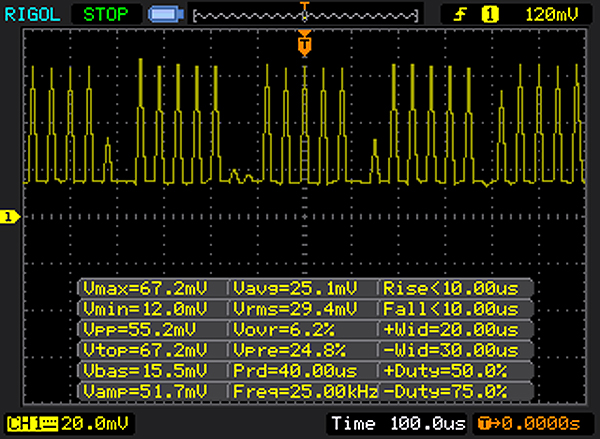 |
La retroiluminación del display parpadea a 25000 Hz (seguramente usa PWM - Pulse-Width Modulation) a un brillo del 20 % e inferior. Sobre este nivel de brillo no debería darse parpadeo / PWM. La frecuencia de 25000 Hz es bastante alta, por lo que la mayoría de gente sensible al parpadeo no debería ver parpadeo o tener fatiga visual. Comparación: 52 % de todos los dispositivos testados no usaron PWM para atenuar el display. Si se usó, medimos una media de 7741 (mínimo: 5 - máxmo: 343500) Hz. | |||
Tiempos de respuesta del display
| ↔ Tiempo de respuesta de Negro a Blanco | ||
|---|---|---|
| 14 ms ... subida ↗ y bajada ↘ combinada | ↗ 12 ms subida | 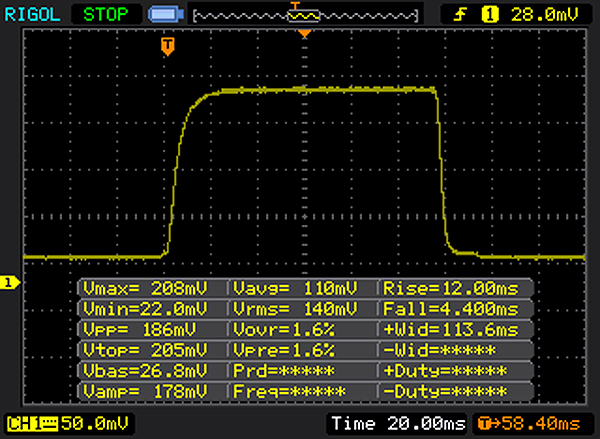 |
| ↘ 4 ms bajada | ||
| La pantalla mostró buenos tiempos de respuesta en nuestros tests pero podría ser demasiado lenta para los jugones competitivos. En comparación, todos los dispositivos de prueba van de ##min### (mínimo) a 240 (máximo) ms. » 34 % de todos los dispositivos son mejores. Esto quiere decir que el tiempo de respuesta medido es mejor que la media (19.8 ms) de todos los dispositivos testados. | ||
| ↔ Tiempo de respuesta 50% Gris a 80% Gris | ||
| 49 ms ... subida ↗ y bajada ↘ combinada | ↗ 28 ms subida | 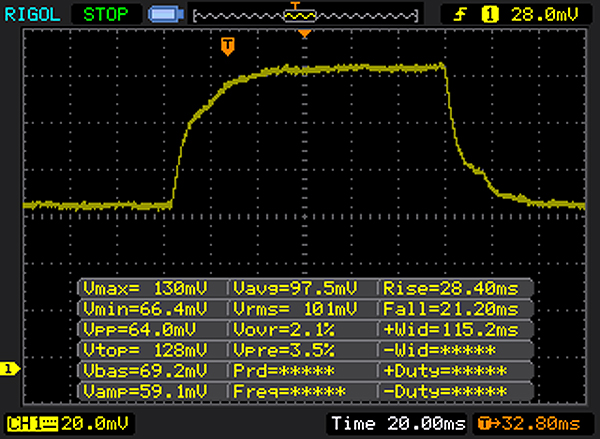 |
| ↘ 21 ms bajada | ||
| La pantalla mostró tiempos de respuesta lentos en nuestros tests y podría ser demasiado lenta para los jugones. En comparación, todos los dispositivos de prueba van de ##min### (mínimo) a 636 (máximo) ms. » 85 % de todos los dispositivos son mejores. Eso quiere decir que el tiempo de respuesta es peor que la media (30.9 ms) de todos los dispositivos testados. | ||
| Cinebench R15 | |
| CPU Single 64Bit | |
| Dell Vostro 15 5568 | |
| Lenovo Ideapad 310-15IKB | |
| Fujitsu Lifebook A557 | |
| HP 15-ay116ng | |
| Acer Aspire 3 A315-51-55E4 | |
| Toshiba Portege A30-D-139 | |
| Asus X510UA-BR305T | |
| HP 15-ba077ng | |
| CPU Multi 64Bit | |
| Fujitsu Lifebook A557 | |
| HP 15-ay116ng | |
| Dell Vostro 15 5568 | |
| Acer Aspire 3 A315-51-55E4 | |
| Lenovo Ideapad 310-15IKB | |
| Asus X510UA-BR305T | |
| Toshiba Portege A30-D-139 | |
| HP 15-ba077ng | |
| Cinebench R10 | |
| Rendering Single 32Bit | |
| Fujitsu Lifebook A557 | |
| HP 15-ay116ng | |
| Asus X510UA-BR305T | |
| HP 15-ba077ng | |
| Rendering Multiple CPUs 32Bit | |
| HP 15-ay116ng | |
| Fujitsu Lifebook A557 | |
| Asus X510UA-BR305T | |
| HP 15-ba077ng | |
| Geekbench 3 | |
| 32 Bit Multi-Core Score | |
| HP 15-ay116ng | |
| HP 15-ba077ng | |
| Asus X510UA-BR305T | |
| 32 Bit Single-Core Score | |
| HP 15-ay116ng | |
| Asus X510UA-BR305T | |
| HP 15-ba077ng | |
| Geekbench 4.0 | |
| 64 Bit Multi-Core Score | |
| HP 15-ay116ng | |
| Asus X510UA-BR305T | |
| HP 15-ba077ng | |
| 64 Bit Single-Core Score | |
| HP 15-ay116ng | |
| Asus X510UA-BR305T | |
| HP 15-ba077ng | |
| Geekbench 4.4 | |
| 64 Bit Multi-Core Score | |
| Asus X510UA-BR305T | |
| 64 Bit Single-Core Score | |
| Asus X510UA-BR305T | |
| JetStream 1.1 - 1.1 Total | |
| HP 15-ay116ng | |
| Fujitsu Lifebook A557 | |
| Lenovo Ideapad 310-15IKB | |
| Asus X510UA-BR305T | |
| HP 15-ba077ng | |
| PCMark 8 Home Score Accelerated v2 | 3313 puntos | |
ayuda | ||
| PCMark 8 - Home Score Accelerated v2 | |
| Fujitsu Lifebook A557 | |
| Lenovo Ideapad 310-15IKB | |
| HP 15-ay116ng | |
| Asus X510UA-BR305T | |
| Acer Aspire 3 A315-51-55E4 | |
| HP 15-ba077ng | |

| Asus X510UA-BR305T Seagate Mobile HDD 1TB ST1000LM035 | Acer Aspire 3 A315-51-55E4 Micron 1100 MTFDDAV256TBN | Fujitsu Lifebook A557 Samsung MZ7TN512HDHP-00000 | Dell Vostro 15 5568 Transcend MTS400 256 GB M.2 TS256GMTS400 | HP 15-ay116ng Samsung CM871a MZNTY256HDHP | HP 15-ba077ng SanDisk Z400s SD8SNAT-256G | |
|---|---|---|---|---|---|---|
| CrystalDiskMark 3.0 | 10589% | 10895% | 6584% | 11923% | 6284% | |
| Read Seq (MB/s) | 89.4 | 485.8 443% | 504 464% | 535 498% | 501 460% | 447.4 400% |
| Write Seq (MB/s) | 84.2 | 456.1 442% | 503 497% | 391.1 364% | 483.9 475% | 243.3 189% |
| Read 512 (MB/s) | 29.55 | 328 1010% | 393.6 1232% | 376.6 1174% | 413.8 1300% | 333.4 1028% |
| Write 512 (MB/s) | 61.7 | 446.8 624% | 413.6 570% | 255.8 315% | 294.9 378% | 283.1 359% |
| Read 4k (MB/s) | 0.326 | 26.95 8167% | 36.98 11244% | 31.81 9658% | 34.91 10609% | 20.99 6339% |
| Write 4k (MB/s) | 0.438 | 86.7 19695% | 92.1 20927% | 65.2 14786% | 95.7 21749% | 62.7 14215% |
| Read 4k QD32 (MB/s) | 1.047 | 245.9 23386% | 277.6 26414% | 193.9 18420% | 370.9 35325% | 143.1 13568% |
| Write 4k QD32 (MB/s) | 0.967 | 300.2 30944% | 250.6 25815% | 73.1 7459% | 243.6 25091% | 138 14171% |
| 3DMark 11 Performance | 1472 puntos | |
ayuda | ||
| 3DMark 11 - 1280x720 Performance GPU | |
| Dell Vostro 15 5568 | |
| HP 15-ba077ng | |
| Lenovo Ideapad 310-15IKB | |
| Fujitsu Lifebook A557 | |
| HP 15-ay116ng | |
| Asus X510UA-BR305T | |
| Acer Aspire 3 A315-51-55E4 | |
| bajo | medio | alto | ultra | |
|---|---|---|---|---|
| BioShock Infinite (2013) | 41.1 | 24.6 | 20.2 |
Ruido
| Ocioso |
| 31.2 / 31.3 / 31.6 dB(A) |
| Carga |
| 38.2 / 36.2 dB(A) |
 | ||
30 dB silencioso 40 dB(A) audible 50 dB(A) ruidosamente alto |
||
min: | ||
(+) La temperatura máxima en la parte superior es de 31 °C / 88 F, frente a la media de 34.3 °C / 94 F, que oscila entre 21.2 y 62.5 °C para la clase Office.
(+) El fondo se calienta hasta un máximo de 32.6 °C / 91 F, frente a la media de 36.8 °C / 98 F
(+) En reposo, la temperatura media de la parte superior es de 23.5 °C / 74# F, frente a la media del dispositivo de 29.5 °C / 85 F.
(+) El reposamanos y el panel táctil están a una temperatura inferior a la de la piel, con un máximo de 27 °C / 80.6 F y, por tanto, son fríos al tacto.
(±) La temperatura media de la zona del reposamanos de dispositivos similares fue de 27.6 °C / 81.7 F (+0.6 °C / 1.1 F).
Asus X510UA-BR305T análisis de audio
(±) | la sonoridad del altavoz es media pero buena (72.9 dB)
Graves 100 - 315 Hz
(-) | casi sin bajos - de media 21% inferior a la mediana
(±) | la linealidad de los graves es media (10.4% delta a frecuencia anterior)
Medios 400 - 2000 Hz
(+) | medios equilibrados - a sólo 2.7% de la mediana
(+) | los medios son lineales (4% delta a la frecuencia anterior)
Altos 2 - 16 kHz
(+) | máximos equilibrados - a sólo 4.5% de la mediana
(+) | los máximos son lineales (3.1% delta a la frecuencia anterior)
Total 100 - 16.000 Hz
(±) | la linealidad del sonido global es media (18.4% de diferencia con la mediana)
En comparación con la misma clase
» 33% de todos los dispositivos probados de esta clase eran mejores, 7% similares, 60% peores
» El mejor tuvo un delta de 7%, la media fue 21%, el peor fue ###max##%
En comparación con todos los dispositivos probados
» 41% de todos los dispositivos probados eran mejores, 8% similares, 51% peores
» El mejor tuvo un delta de 4%, la media fue 23%, el peor fue ###max##%
Apple MacBook 12 (Early 2016) 1.1 GHz análisis de audio
(+) | los altavoces pueden reproducir a un volumen relativamente alto (#83.6 dB)
Graves 100 - 315 Hz
(±) | lubina reducida - en promedio 11.3% inferior a la mediana
(±) | la linealidad de los graves es media (14.2% delta a frecuencia anterior)
Medios 400 - 2000 Hz
(+) | medios equilibrados - a sólo 2.4% de la mediana
(+) | los medios son lineales (5.5% delta a la frecuencia anterior)
Altos 2 - 16 kHz
(+) | máximos equilibrados - a sólo 2% de la mediana
(+) | los máximos son lineales (4.5% delta a la frecuencia anterior)
Total 100 - 16.000 Hz
(+) | el sonido global es lineal (10.2% de diferencia con la mediana)
En comparación con la misma clase
» 7% de todos los dispositivos probados de esta clase eran mejores, 2% similares, 90% peores
» El mejor tuvo un delta de 5%, la media fue 18%, el peor fue ###max##%
En comparación con todos los dispositivos probados
» 5% de todos los dispositivos probados eran mejores, 1% similares, 94% peores
» El mejor tuvo un delta de 4%, la media fue 23%, el peor fue ###max##%
| Off / Standby | |
| Ocioso | |
| Carga |
|
Clave:
min: | |
| Battery Runtime - WiFi Websurfing | |
| Fujitsu Lifebook A557 | |
| Asus X510UA-BR305T | |
| HP 15-ay116ng | |
| Acer Aspire 3 A315-51-55E4 | |
| HP 15-ba077ng | |
| Lenovo Ideapad 310-15IKB | |
Pro
Contra
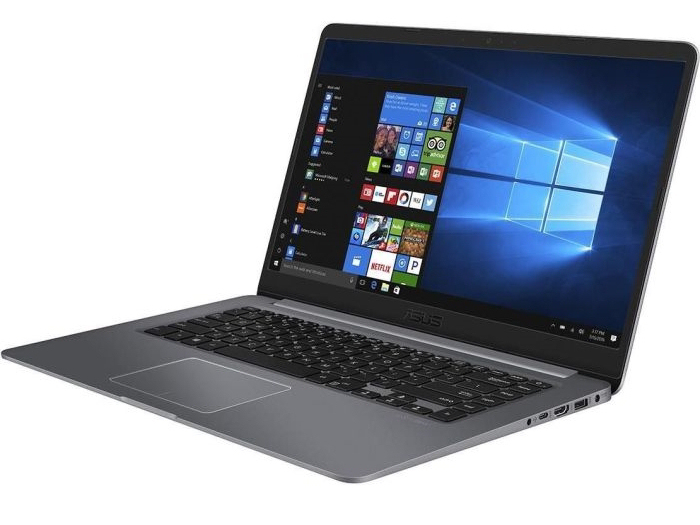
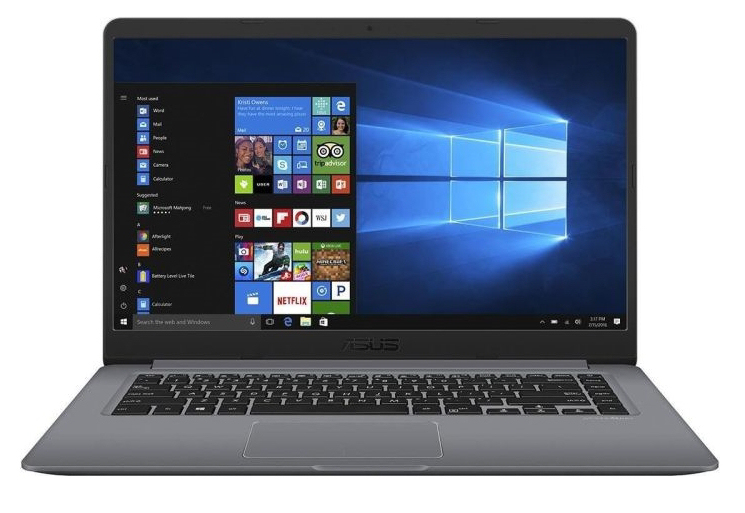
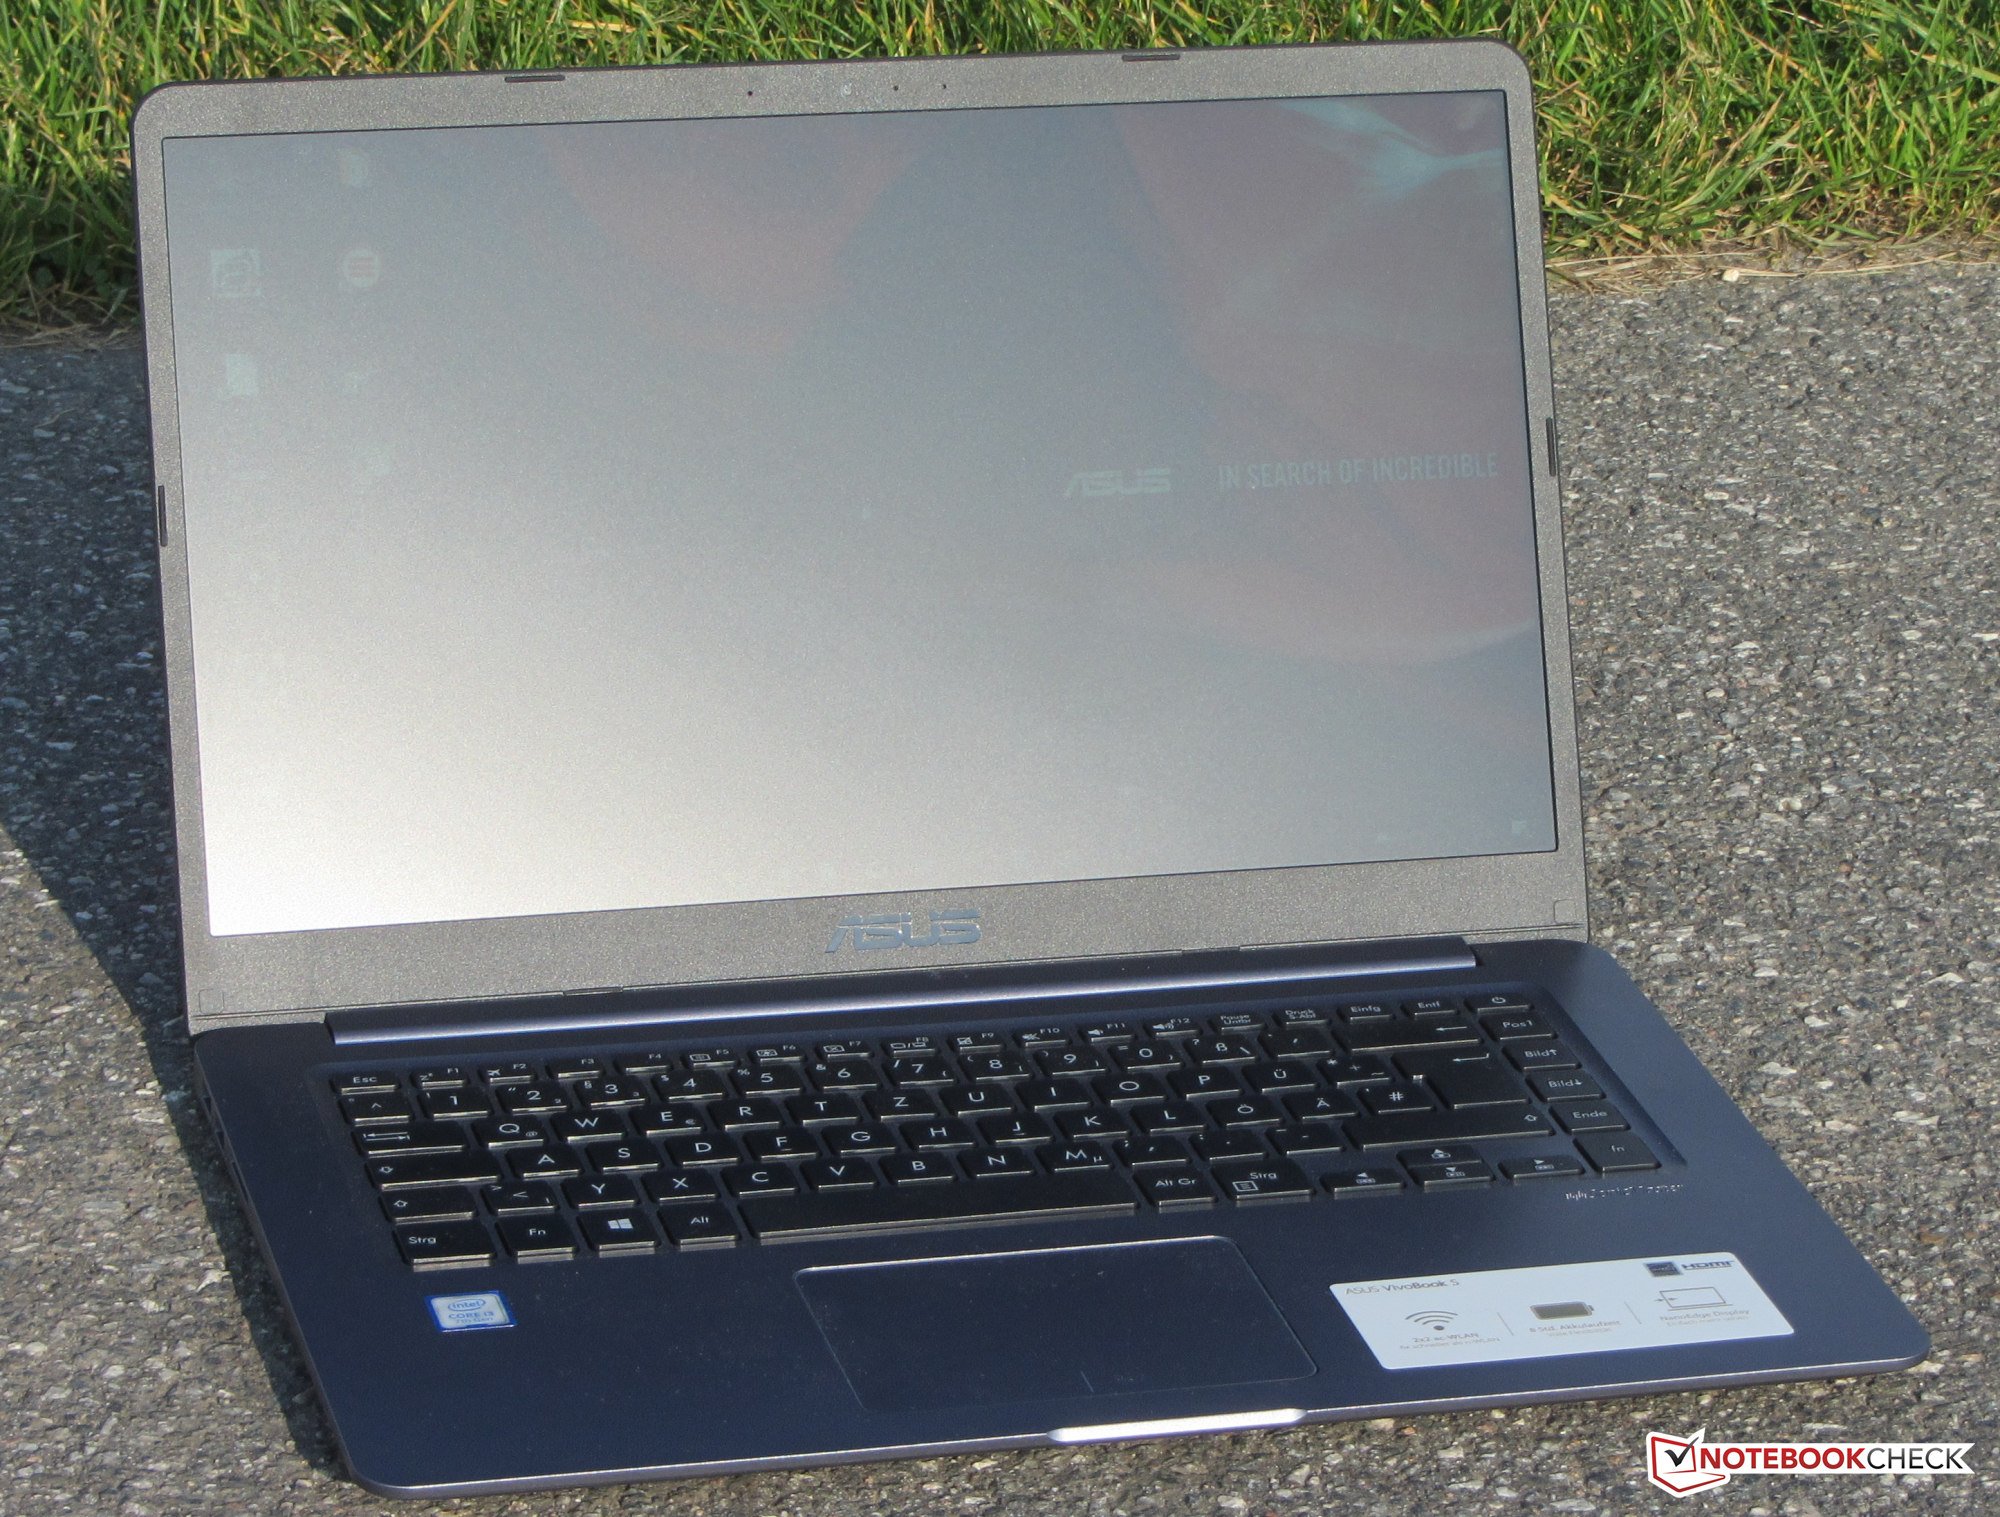
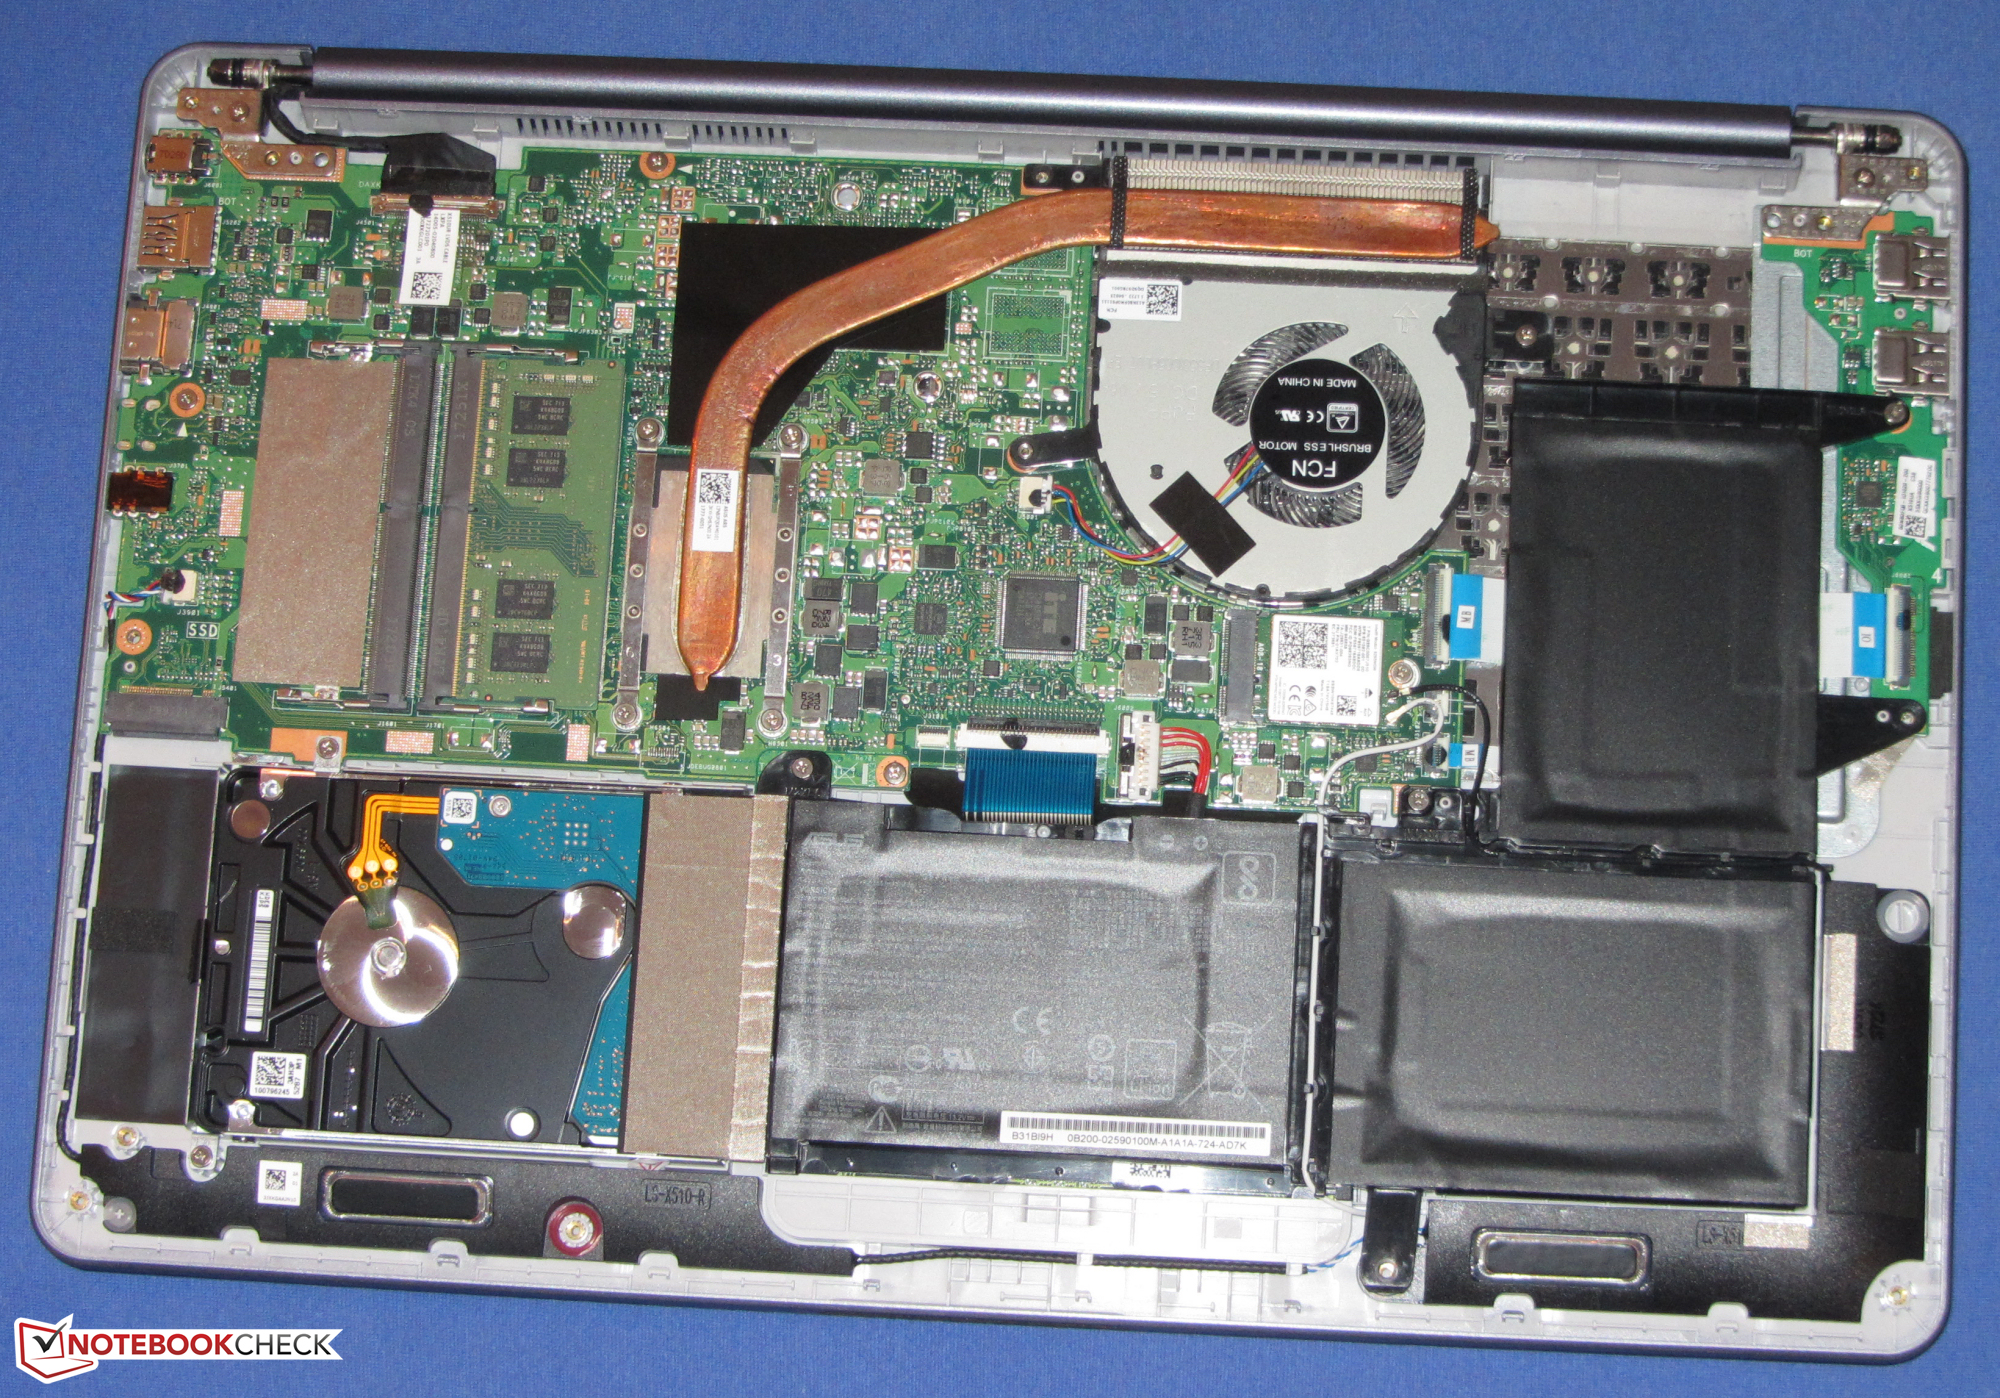
Asus ofrece un portátil de oficina delgado y ligero de 15,6" con el X510UA-BR305T. En el corazón del portátil late un procesador Core i3 de la generación Kaby Lake. La CPU tiene más que suficiente potencia informática para el propósito previsto (oficina, Internet). El ordenador portátil apenas se calienta en toda la carga y se ejecuta en silencio al menos en pausa.
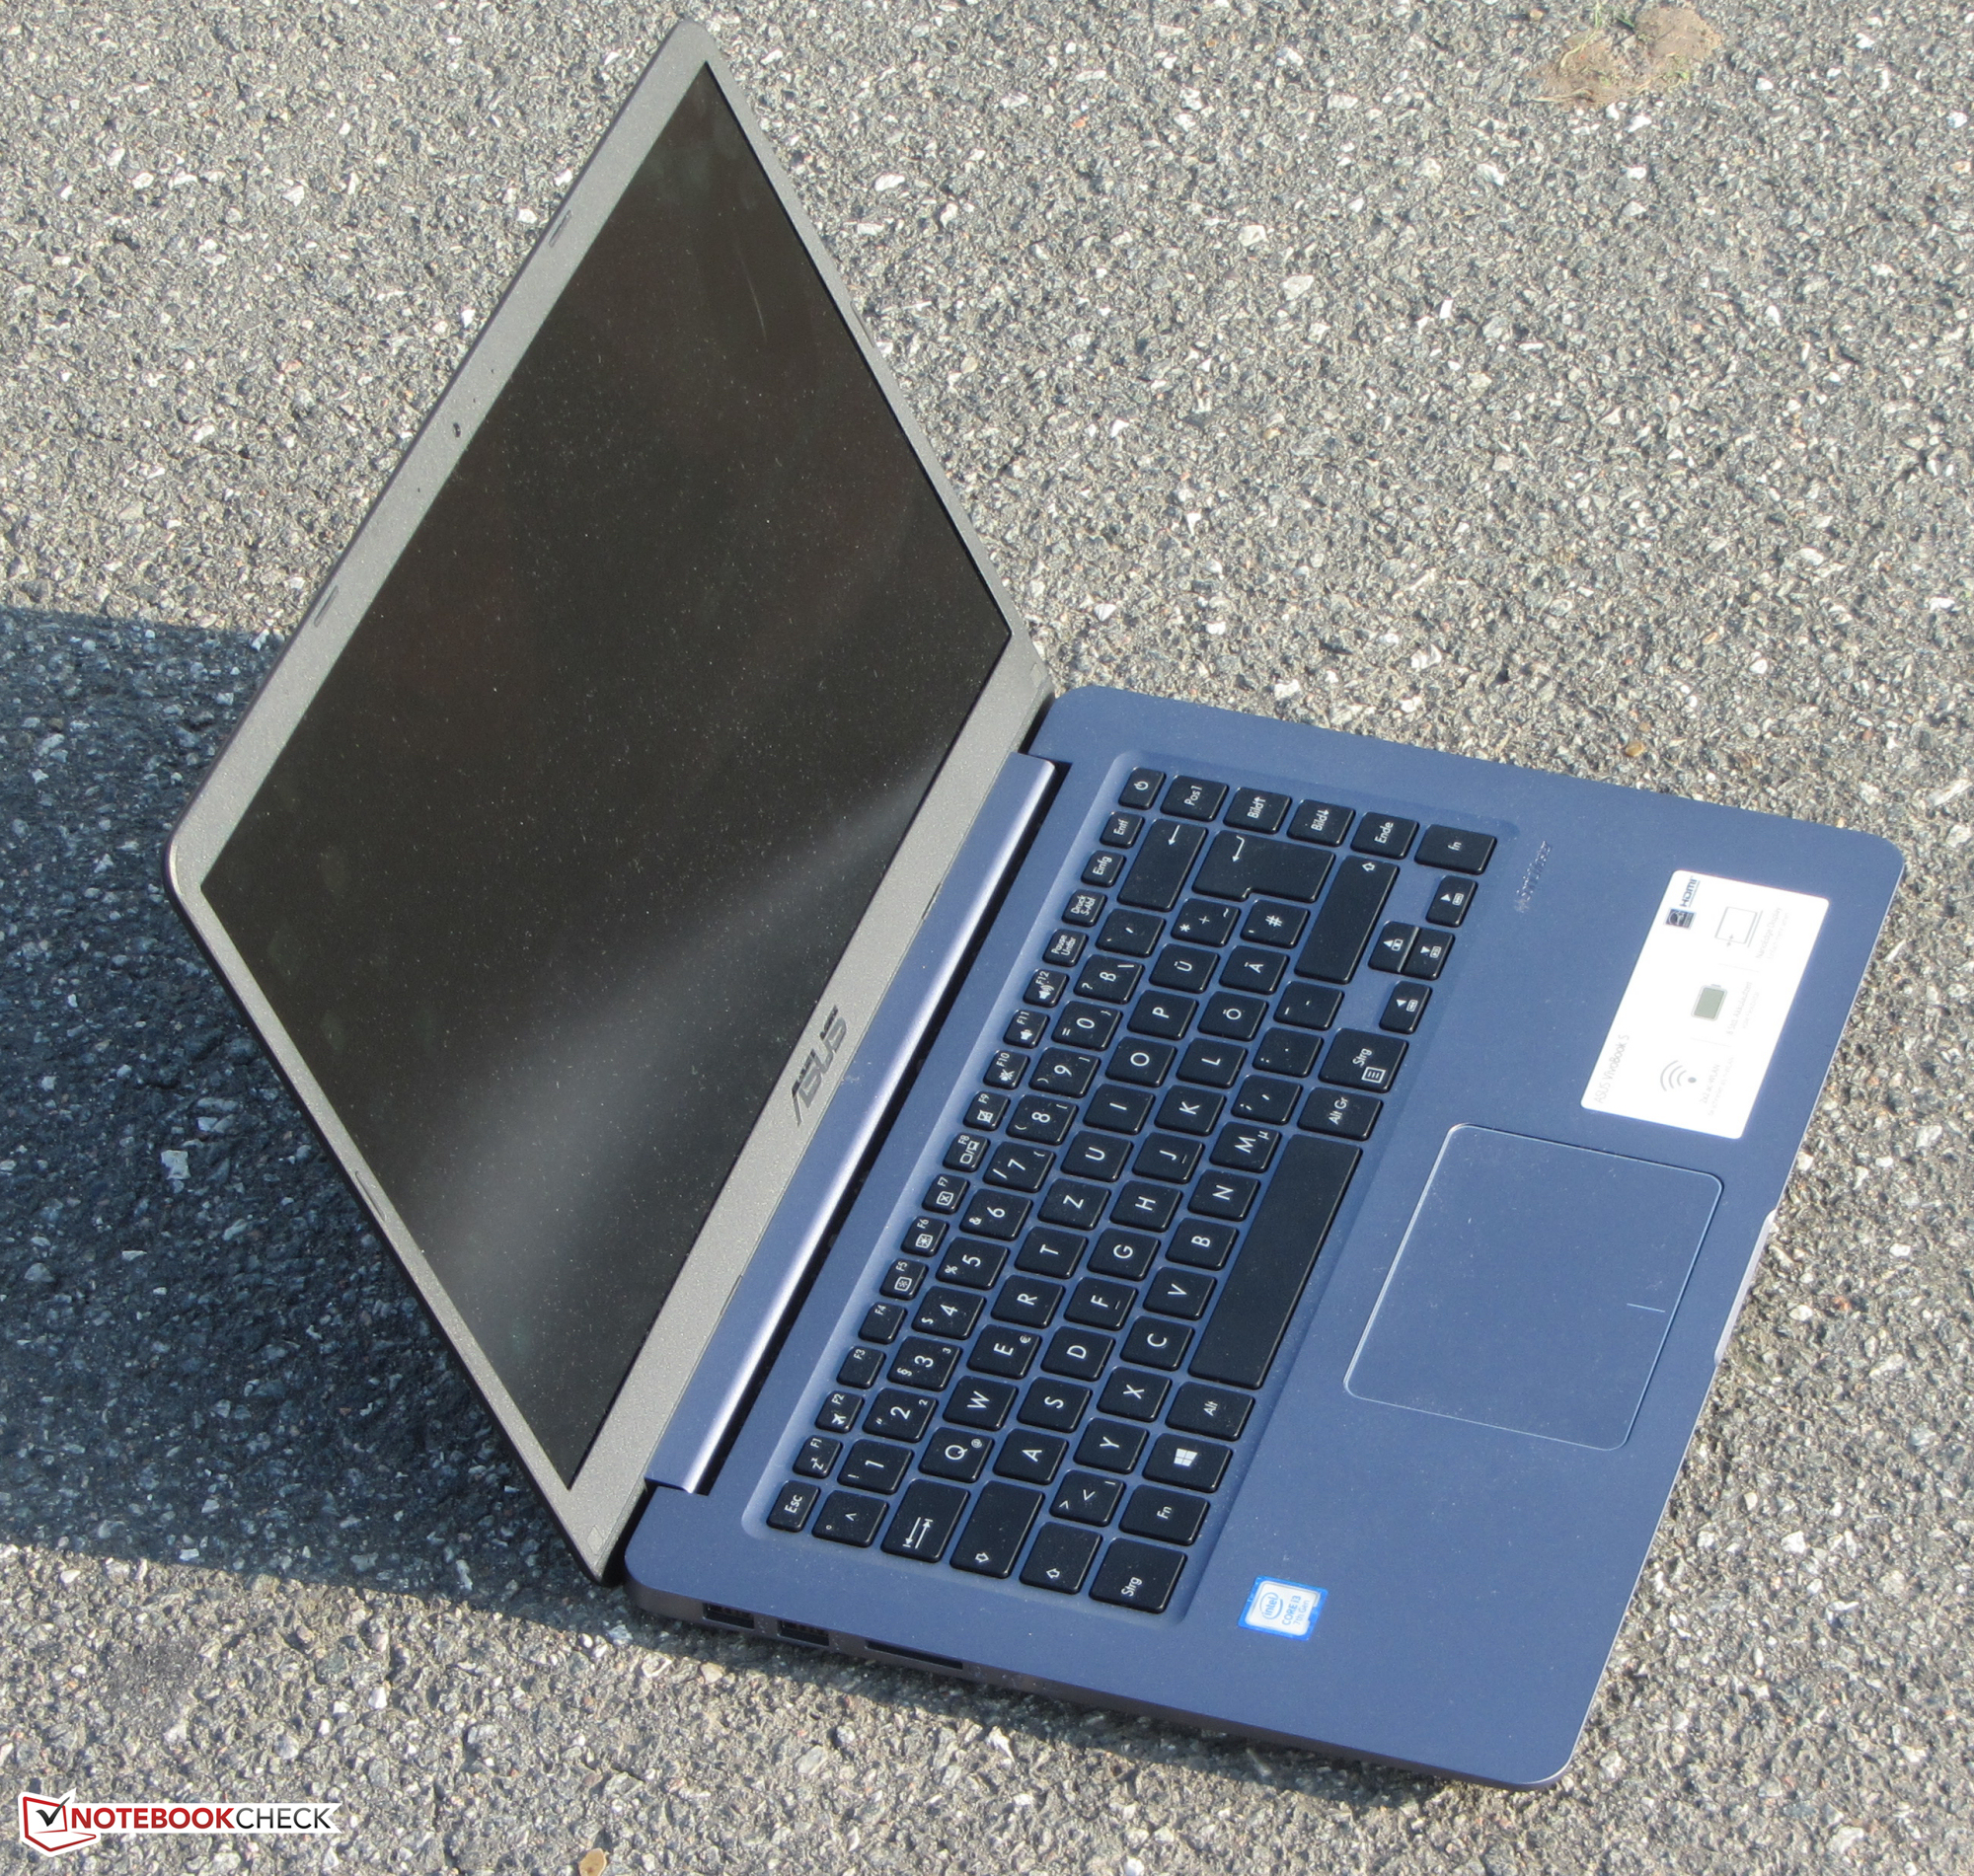
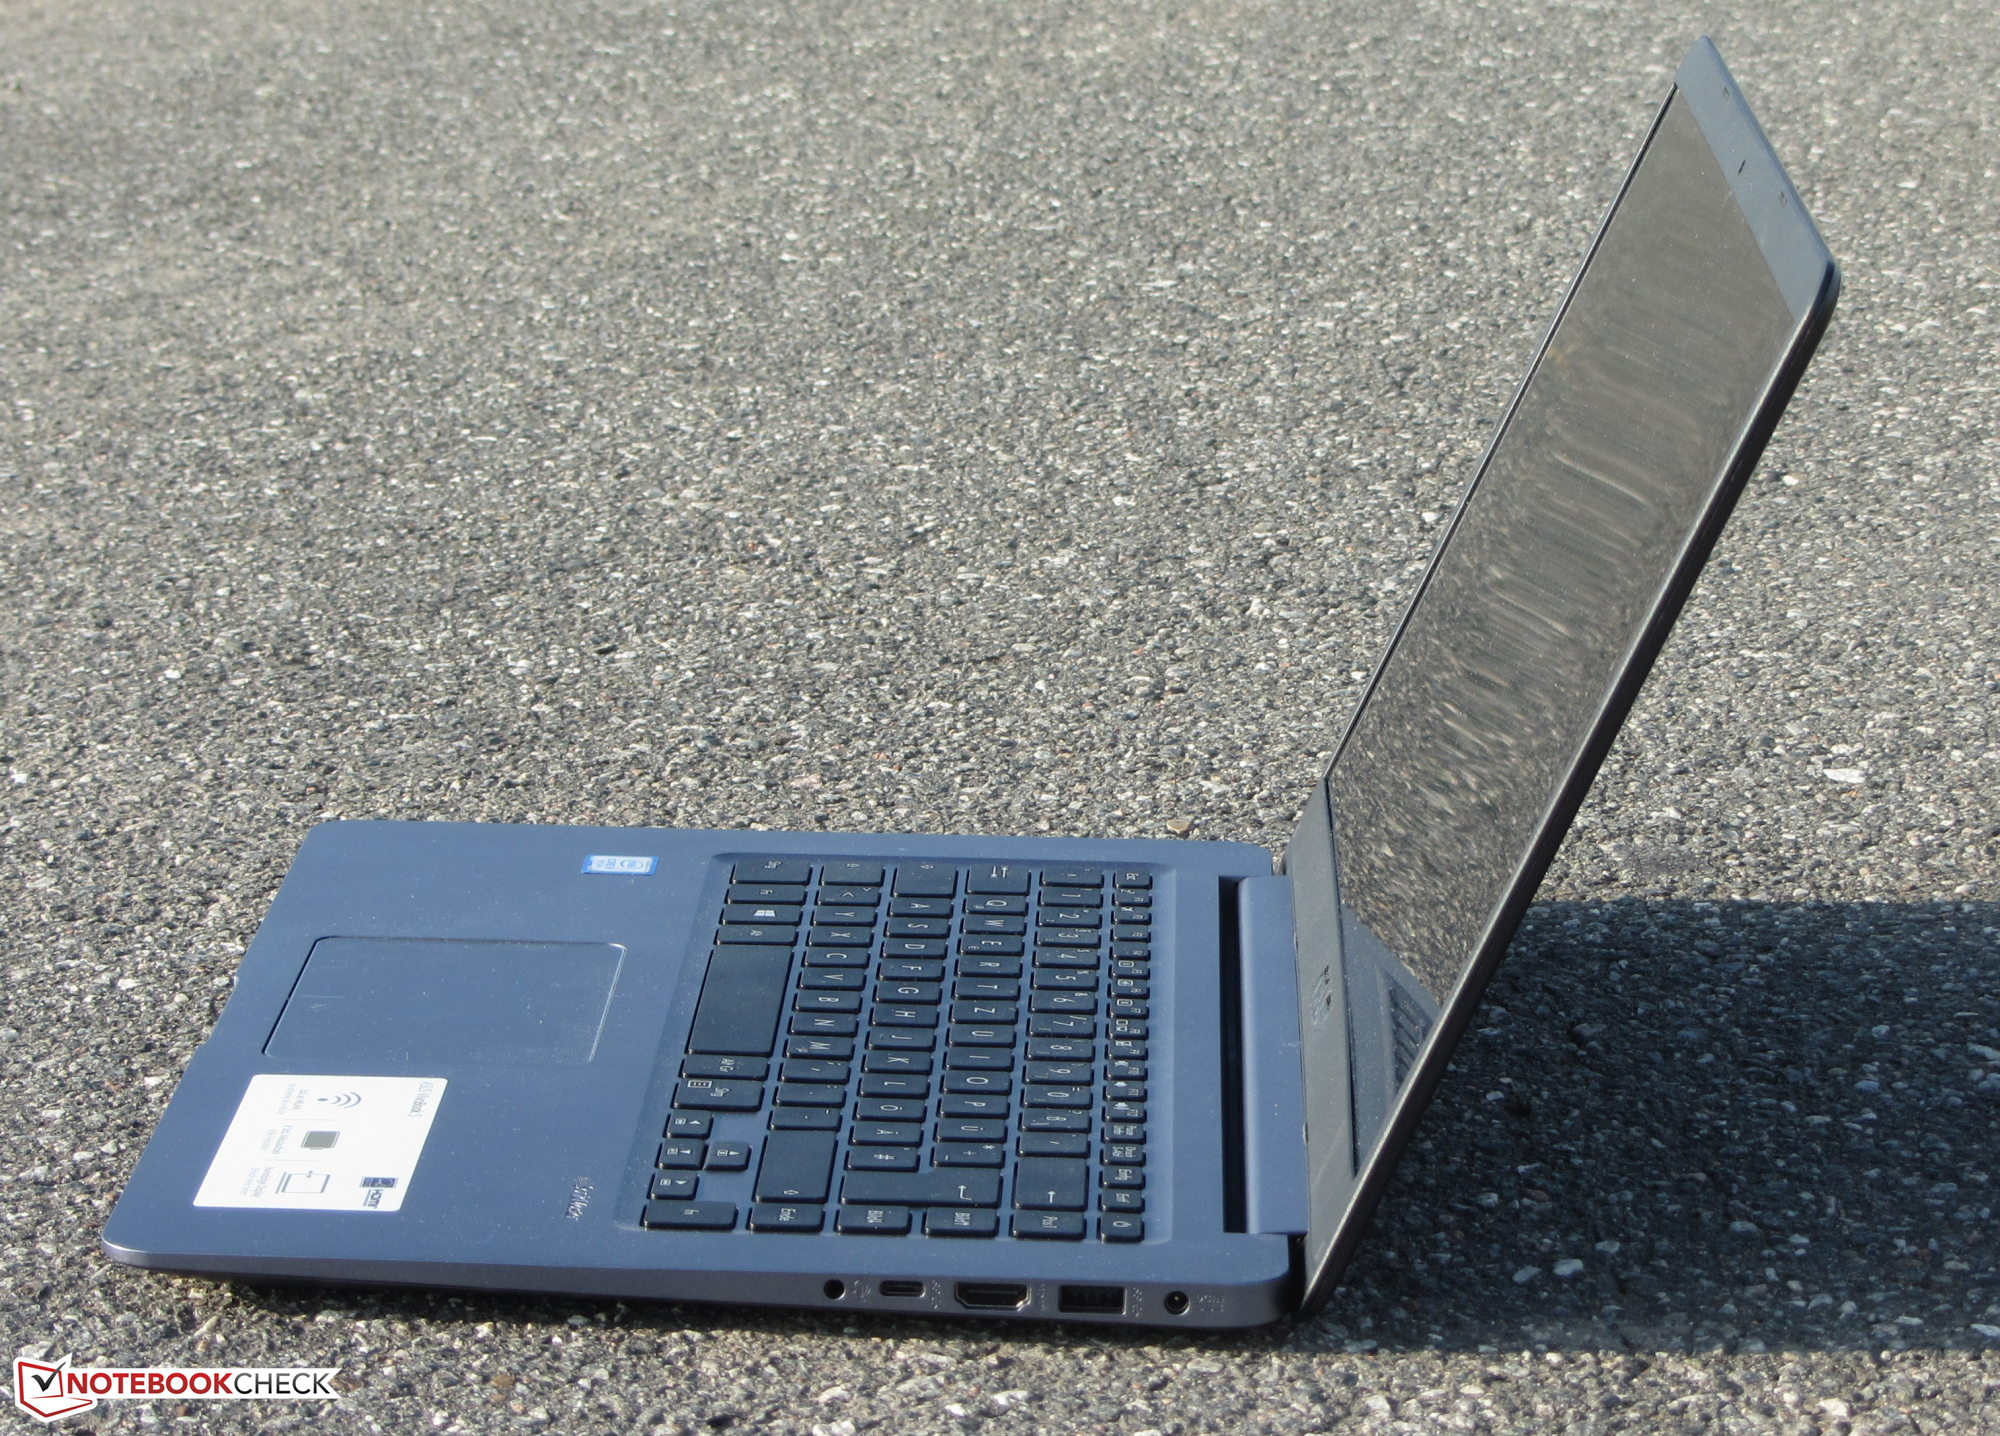
Las ventajas de la X510UA sobre sus rivales son su exterior delgado y su bajo peso.
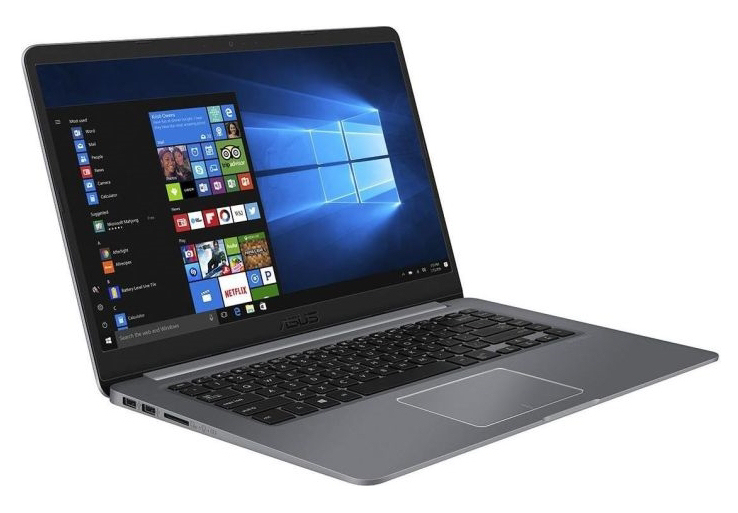
Asus ha creado un buén compañero móvil aquí con buen aguante de batería. Sin embargo, el portátil no es totalmente adecuado para su uso como una máquina de escribir ya que el teclado que no está hecho para los escritores prolíficos.
La pantalla tampoco ganará premios. Asus instala un modelo oscuro, de bajo contraste y dependiente del ángulo de visión. Más allá de eso, una unidad de estado sólido, no un disco duro, pertenece a una computadora portátil ligera y móvil. Esto reduciría el peso en unos pocos gramos y el sistema funcionaría mucho más rápido.
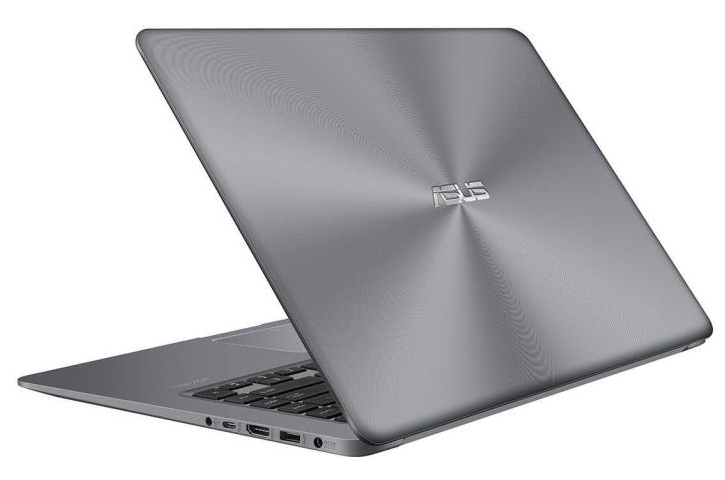
Desarrollar un portátil delgado y ligero de 15,6" para el sector de bajo costo es una gran idea. Sin embargo, Asus tiene que reconsiderar su implementación. Los defectos que se han hecho en la configuración (teclado, pantalla, no SSD) deben ser reelaborados en potenciales sucesores. La carcasa también debe ser más rígida. Después de todo, estamos tratando con un portátil de 600 euros y no con un modelo de 400 euros.
Ésta es una versión acortada del análisis original. Puedes leer el análisis completo en inglés aquí.
Asus X510UA-BR305T
- 09/25/2017 v6 (old)
Sascha Mölck