Breve análisis del portátil Acer Aspire 3 (7200U, HD 620)
| SD Card Reader | |
| average JPG Copy Test (av. of 3 runs) | |
| Fujitsu Lifebook A557 (Toshiba Exceria Pro SDXC 64 GB UHS-II) | |
| Dell Latitude 5580 (Toshiba Exceria Pro SDXC 64 GB UHS-II) | |
| Acer Aspire 3 A315-51-55E4 (Toshiba Exceria Pro SDXC 64 GB UHS-II) | |
| Lenovo ThinkPad E570-20H6S00000 (Toshiba Exceria Pro SDXC 64 GB UHS-II) | |
| HP Pavilion 14-al103ng (Toshiba Exceria Pro SDXC 64 GB UHS-II) | |
| maximum AS SSD Seq Read Test (1GB) | |
| Dell Latitude 5580 (Toshiba Exceria Pro SDXC 64 GB UHS-II) | |
| Fujitsu Lifebook A557 (Toshiba Exceria Pro SDXC 64 GB UHS-II) | |
| HP Pavilion 14-al103ng (Toshiba Exceria Pro SDXC 64 GB UHS-II) | |
| Acer Aspire 3 A315-51-55E4 (Toshiba Exceria Pro SDXC 64 GB UHS-II) | |
| Lenovo ThinkPad E570-20H6S00000 (Toshiba Exceria Pro SDXC 64 GB UHS-II) | |
| |||||||||||||||||||||||||
iluminación: 87 %
Brillo con batería: 241 cd/m²
Contraste: 524:1 (Negro: 0.46 cd/m²)
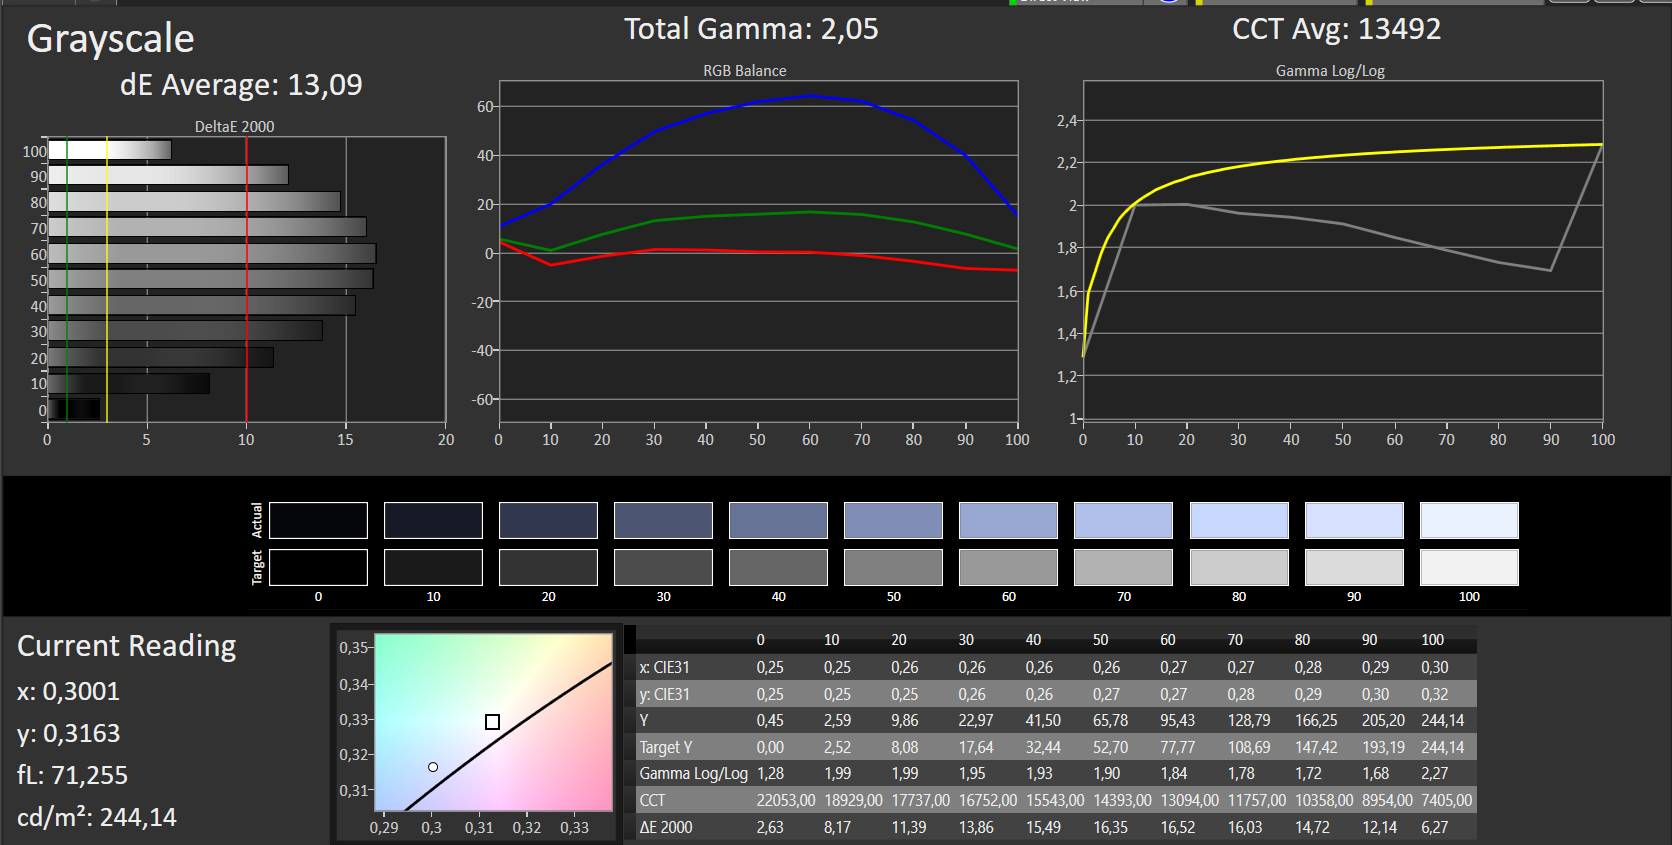
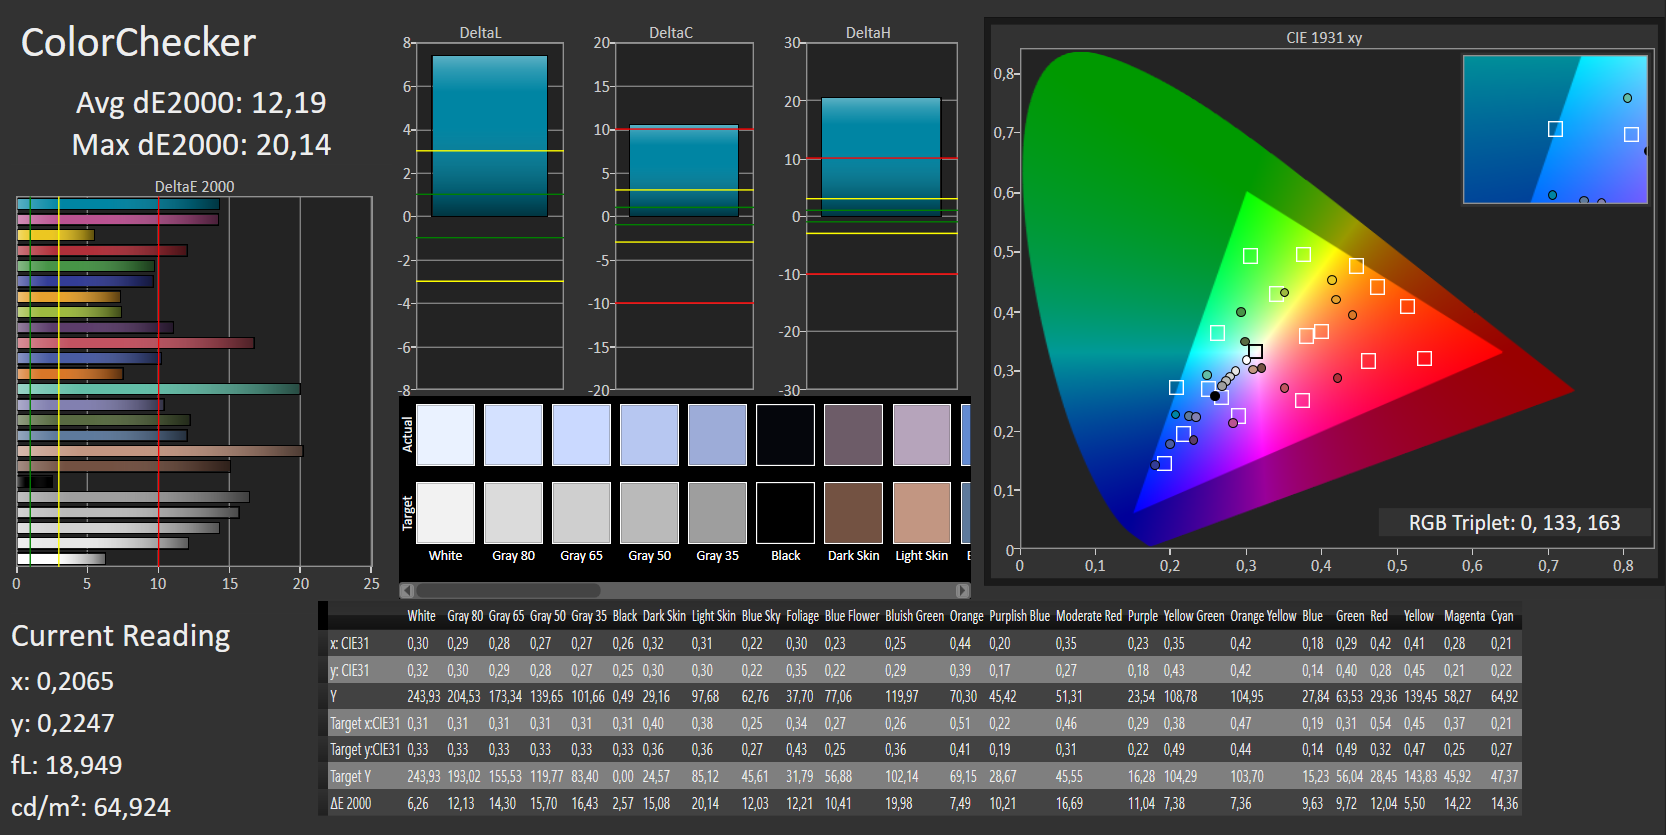
ΔE ColorChecker Calman: 3.4 | ∀{0.5-29.43 Ø4.73}
ΔE Greyscale Calman: 1.7 | ∀{0.09-98 Ø4.97}
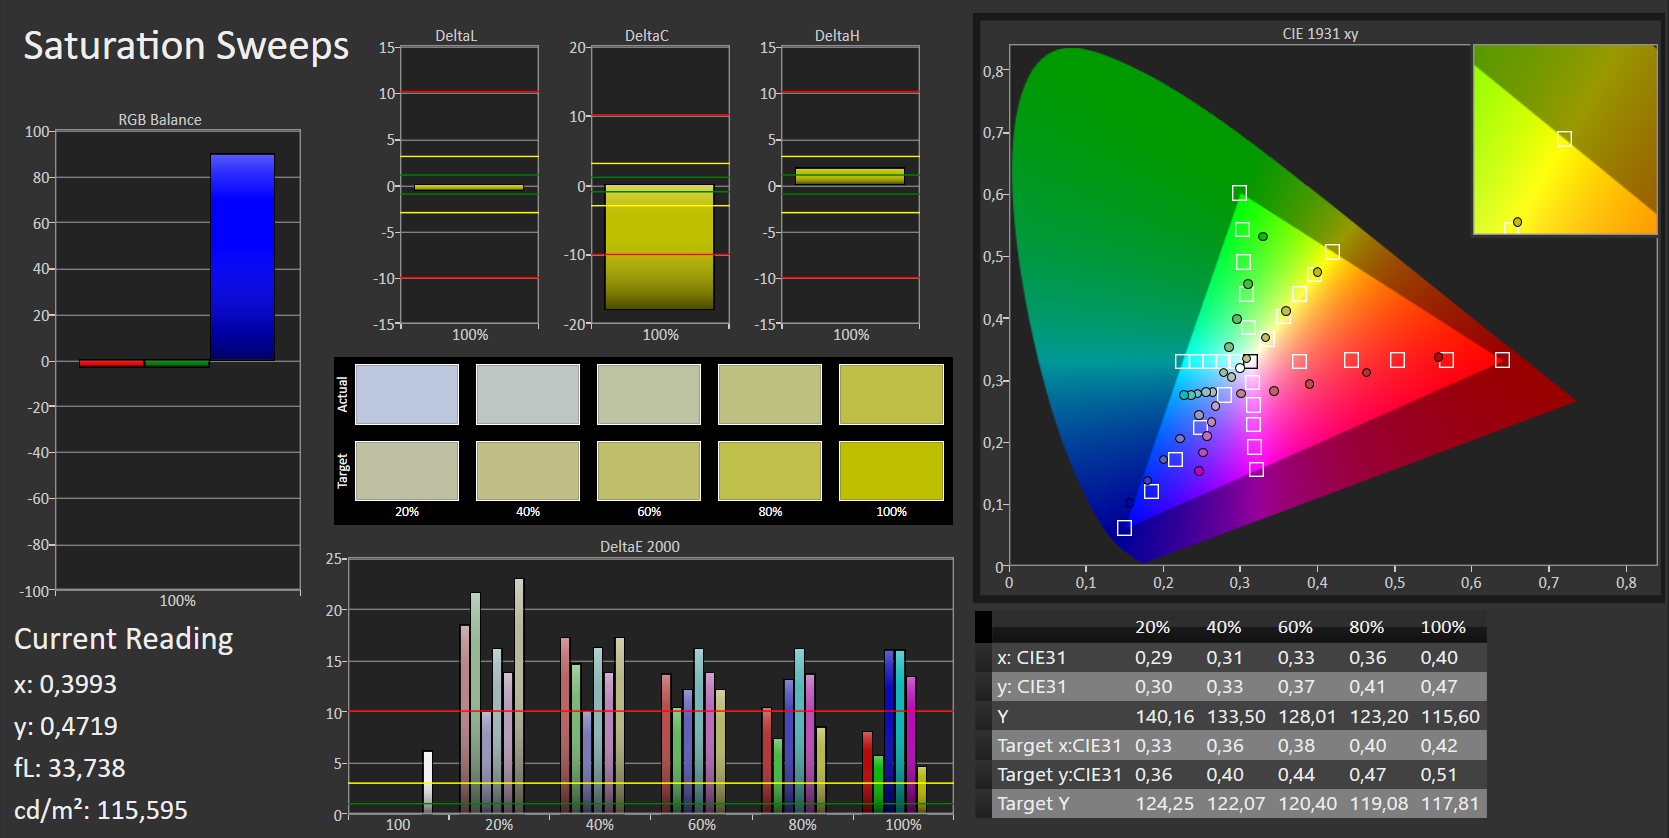
54% sRGB (Argyll 1.6.3 3D)
34% AdobeRGB 1998 (Argyll 1.6.3 3D)
37.17% AdobeRGB 1998 (Argyll 3D)
54.1% sRGB (Argyll 3D)
35.97% Display P3 (Argyll 3D)
Gamma: 2.36
CCT: 6750 K
| Acer Aspire 3 A315-51-55E4 AU Optronics AUO38ED, , 1920x1080, 15.6" | Dell Latitude 5580 1366x768, 15.6" | Fujitsu Lifebook A557 BOE NV156FHM-N42, , 1920x1080, 15.6" | Lenovo ThinkPad E570-20H6S00000 AUO B156HAN04.4, , 1920x1080, 15.6" | HP Pavilion 14-al103ng AU Optronics, , 1920x1080, 14" | |
|---|---|---|---|---|---|
| Display | 12% | 16% | 7% | 2% | |
| Display P3 Coverage (%) | 35.97 | 40.13 12% | 41.85 16% | 38.65 7% | 36.58 2% |
| sRGB Coverage (%) | 54.1 | 60 11% | 62.9 16% | 58 7% | 54.9 1% |
| AdobeRGB 1998 Coverage (%) | 37.17 | 41.5 12% | 43.24 16% | 39.94 7% | 37.79 2% |
| Response Times | -58% | -109% | -58% | -73% | |
| Response Time Grey 50% / Grey 80% * (ms) | 44 ? | 30 ? 32% | 55 ? -25% | 44.8 ? -2% | 53 ? -20% |
| Response Time Black / White * (ms) | 12 ? | 29.6 ? -147% | 35 ? -192% | 25.6 ? -113% | 27 ? -125% |
| PWM Frequency (Hz) | 201.6 ? | 200 ? | |||
| Screen | -113% | 17% | -2% | -1% | |
| Brightness middle (cd/m²) | 241 | 238 -1% | 287 19% | 242 0% | 200 -17% |
| Brightness (cd/m²) | 229 | 216 -6% | 260 14% | 243 6% | 191 -17% |
| Brightness Distribution (%) | 87 | 83 -5% | 83 -5% | 75 -14% | 90 3% |
| Black Level * (cd/m²) | 0.46 | 0.53 -15% | 0.22 52% | 0.24 48% | 0.14 70% |
| Contrast (:1) | 524 | 449 -14% | 1305 149% | 1008 92% | 1429 173% |
| Colorchecker dE 2000 * | 3.4 | 10.8 -218% | 4.21 -24% | 4.65 -37% | 5.06 -49% |
| Colorchecker dE 2000 max. * | 7.61 | 29.3 -285% | 8.81 -16% | 9.64 -27% | 10.91 -43% |
| Greyscale dE 2000 * | 1.7 | 12.1 -612% | 2.68 -58% | 3.39 -99% | 3.94 -132% |
| Gamma | 2.36 93% | 2.25 98% | 2.5 88% | 2.7 81% | 2.41 91% |
| CCT | 6750 96% | 14344 45% | 6066 107% | 6246 104% | 6159 106% |
| Color Space (Percent of AdobeRGB 1998) (%) | 34 | 38.3 13% | 40 18% | 36.69 8% | 35 3% |
| Color Space (Percent of sRGB) (%) | 54 | 59.9 11% | 63 17% | 57.66 7% | 55 2% |
| Media total (Programa/Opciones) | -53% /
-81% | -25% /
-0% | -18% /
-7% | -24% /
-10% |
* ... más pequeño es mejor
Tiempos de respuesta del display
| ↔ Tiempo de respuesta de Negro a Blanco | ||
|---|---|---|
| 12 ms ... subida ↗ y bajada ↘ combinada | ↗ 8 ms subida | 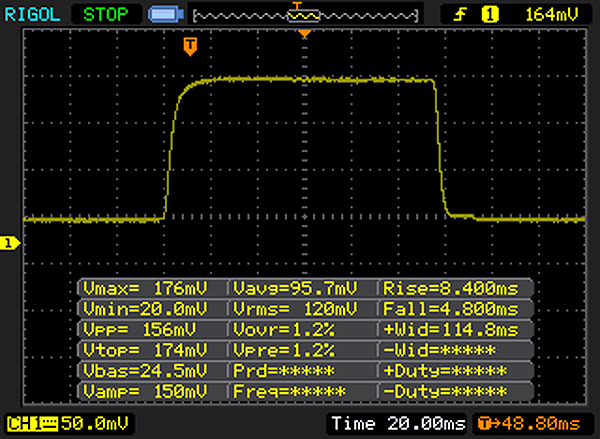 |
| ↘ 4 ms bajada | ||
| La pantalla mostró buenos tiempos de respuesta en nuestros tests pero podría ser demasiado lenta para los jugones competitivos. En comparación, todos los dispositivos de prueba van de ##min### (mínimo) a 240 (máximo) ms. » 31 % de todos los dispositivos son mejores. Esto quiere decir que el tiempo de respuesta medido es mejor que la media (19.9 ms) de todos los dispositivos testados. | ||
| ↔ Tiempo de respuesta 50% Gris a 80% Gris | ||
| 44 ms ... subida ↗ y bajada ↘ combinada | ↗ 22 ms subida | 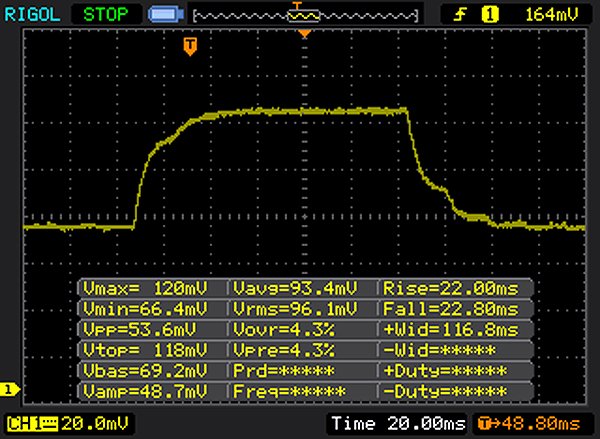 |
| ↘ 22 ms bajada | ||
| La pantalla mostró tiempos de respuesta lentos en nuestros tests y podría ser demasiado lenta para los jugones. En comparación, todos los dispositivos de prueba van de ##min### (mínimo) a 636 (máximo) ms. » 73 % de todos los dispositivos son mejores. Eso quiere decir que el tiempo de respuesta es peor que la media (31.1 ms) de todos los dispositivos testados. | ||
Parpadeo de Pantalla / PWM (Pulse-Width Modulation)
| Parpadeo de Pantalla / PWM no detectado | ||
Comparación: 52 % de todos los dispositivos testados no usaron PWM para atenuar el display. Si se usó, medimos una media de 7791 (mínimo: 5 - máxmo: 343500) Hz. | ||
| PCMark 8 | |
| Home Score Accelerated v2 | |
| Fujitsu Lifebook A557 | |
| Lenovo ThinkPad E570-20H6S00000 | |
| Dell Latitude 5580 | |
| Acer Aspire 3 A315-51-55E4 | |
| HP Pavilion 14-al103ng | |
| Work Score Accelerated v2 | |
| Fujitsu Lifebook A557 | |
| Lenovo ThinkPad E570-20H6S00000 | |
| Acer Aspire 3 A315-51-55E4 | |
| Dell Latitude 5580 | |
| PCMark 8 Home Score Accelerated v2 | 3295 puntos | |
| PCMark 8 Work Score Accelerated v2 | 4541 puntos | |
ayuda | ||
| Acer Aspire 3 A315-51-55E4 Micron 1100 MTFDDAV256TBN | Dell Latitude 5580 Seagate ST500LM021-1KJ15 | Fujitsu Lifebook A557 Samsung MZ7TN512HDHP-00000 | Lenovo ThinkPad E570-20H6S00000 Toshiba THNSF5256GPUK | HP Pavilion 14-al103ng Western Digital Scorpio Blue WD5000LPCX-24C6HT0 | |
|---|---|---|---|---|---|
| CrystalDiskMark 3.0 | -90% | 8% | 57% | -91% | |
| Read Seq (MB/s) | 485.8 | 132.3 -73% | 504 4% | 1140 135% | 113.3 -77% |
| Write Seq (MB/s) | 456.1 | 131.1 -71% | 503 10% | 468.1 3% | 110.2 -76% |
| Read 512 (MB/s) | 328 | 27.04 -92% | 393.6 20% | 759 131% | 30.83 -91% |
| Write 512 (MB/s) | 446.8 | 56.6 -87% | 413.6 -7% | 414 -7% | 47.13 -89% |
| Read 4k (MB/s) | 26.95 | 0.459 -98% | 36.98 37% | 34.3 27% | 0.34 -99% |
| Write 4k (MB/s) | 86.7 | 0.812 -99% | 92.1 6% | 123.4 42% | 0.981 -99% |
| Read 4k QD32 (MB/s) | 245.9 | 1.1 -100% | 277.6 13% | 530 116% | 0.72 -100% |
| Write 4k QD32 (MB/s) | 300.2 | 0.828 -100% | 250.6 -17% | 319.2 6% | 1.026 -100% |

| 3DMark 11 - 1280x720 Performance GPU | |
| Lenovo ThinkPad E570-20H6S00000 | |
| Fujitsu Lifebook A557 | |
| HP Pavilion 14-al103ng | |
| Dell Latitude 5580 | |
| Acer Aspire 3 A315-51-55E4 | |
| 3DMark | |
| 1280x720 Cloud Gate Standard Graphics | |
| Lenovo ThinkPad E570-20H6S00000 | |
| Fujitsu Lifebook A557 | |
| Dell Latitude 5580 | |
| Acer Aspire 3 A315-51-55E4 | |
| 1920x1080 Fire Strike Graphics | |
| Lenovo ThinkPad E570-20H6S00000 | |
| Fujitsu Lifebook A557 | |
| Dell Latitude 5580 | |
| Acer Aspire 3 A315-51-55E4 | |
| 3DMark 11 Performance | 1146 puntos | |
| 3DMark Cloud Gate Standard Score | 5046 puntos | |
| 3DMark Fire Strike Score | 566 puntos | |
ayuda | ||
| BioShock Infinite | |
| 1920x1080 Ultra Preset, DX11 (DDOF) | |
| HP Pavilion 14-al103ng | |
| Fujitsu Lifebook A557 | |
| Acer Aspire 3 A315-51-55E4 | |
| 1366x768 High Preset | |
| HP Pavilion 14-al103ng | |
| Fujitsu Lifebook A557 | |
| Acer Aspire 3 A315-51-55E4 | |
| 1366x768 Medium Preset | |
| Dell Latitude 5580 | |
| Fujitsu Lifebook A557 | |
| HP Pavilion 14-al103ng | |
| Acer Aspire 3 A315-51-55E4 | |
| 1280x720 Very Low Preset | |
| Dell Latitude 5580 | |
| HP Pavilion 14-al103ng | |
| Fujitsu Lifebook A557 | |
| Acer Aspire 3 A315-51-55E4 | |
| Thief | |
| 1920x1080 Very High Preset AA:FXAA & High SS AF:8x | |
| Acer Aspire 3 A315-51-55E4 | |
| 1366x768 High Preset AA:FXAA & Low SS AF:4x | |
| Acer Aspire 3 A315-51-55E4 | |
| 1366x768 Normal Preset AA:FX | |
| Acer Aspire 3 A315-51-55E4 | |
| 1024x768 Very Low Preset | |
| Acer Aspire 3 A315-51-55E4 | |
| Rise of the Tomb Raider | |
| 1920x1080 Very High Preset AA:FX AF:16x | |
| Acer Aspire 3 A315-51-55E4 | |
| 1920x1080 High Preset AA:FX AF:4x | |
| Fujitsu Lifebook A557 | |
| Acer Aspire 3 A315-51-55E4 | |
| 1366x768 Medium Preset AF:2x | |
| Dell Latitude 5580 | |
| Fujitsu Lifebook A557 | |
| Acer Aspire 3 A315-51-55E4 | |
| 1024x768 Lowest Preset | |
| Dell Latitude 5580 | |
| Acer Aspire 3 A315-51-55E4 | |
| Fujitsu Lifebook A557 | |
| bajo | medio | alto | ultra | |
|---|---|---|---|---|
| BioShock Infinite (2013) | 34.63 | 20.7 | 16.76 | 5.46 |
| Thief (2014) | 16.6 | 9.9 | 8.3 | 3.8 |
| Rise of the Tomb Raider (2016) | 15.84 | 8.94 | 4.64 | 3.61 |
Ruido
| Ocioso |
| 30.2 / 30.2 / 31.2 dB(A) |
| HDD |
| 0 dB(A) |
| Carga |
| 34.5 / 34.5 dB(A) |
 | ||
30 dB silencioso 40 dB(A) audible 50 dB(A) ruidosamente alto |
||
min: | ||
(+) La temperatura máxima en la parte superior es de 37.7 °C / 100 F, frente a la media de 34.3 °C / 94 F, que oscila entre 21.2 y 62.5 °C para la clase Office.
(+) El fondo se calienta hasta un máximo de 35.4 °C / 96 F, frente a la media de 36.8 °C / 98 F
(+) En reposo, la temperatura media de la parte superior es de 24.9 °C / 77# F, frente a la media del dispositivo de 29.5 °C / 85 F.
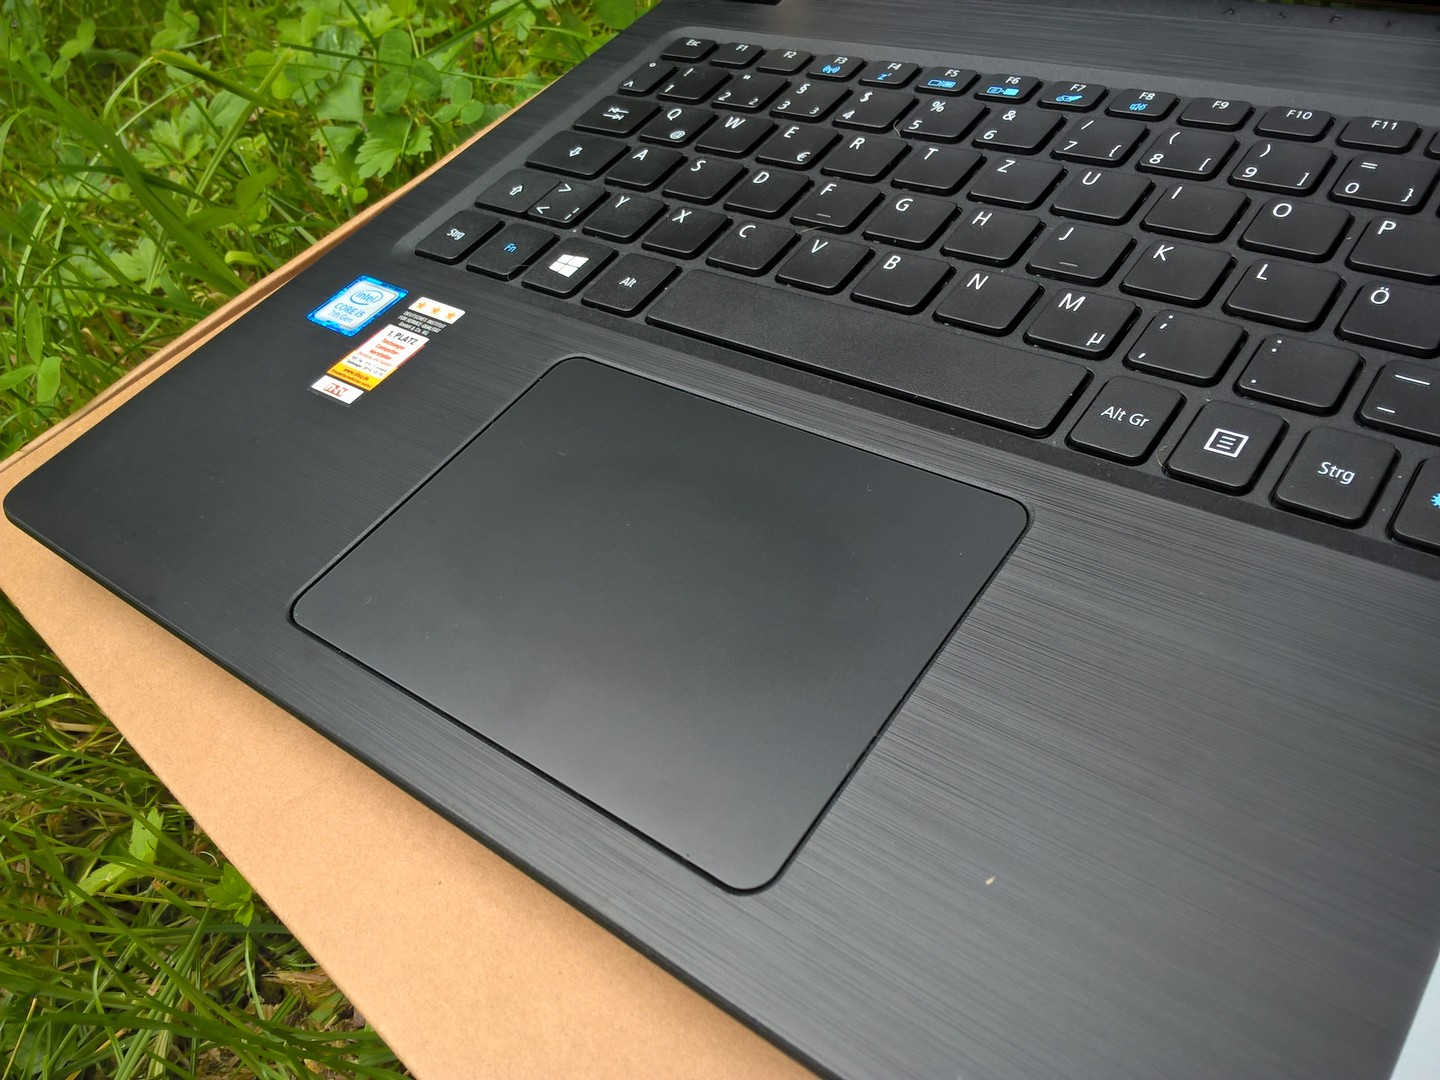
(+) El reposamanos y el panel táctil están a una temperatura inferior a la de la piel, con un máximo de 23.2 °C / 73.8 F y, por tanto, son fríos al tacto.
(+) La temperatura media de la zona del reposamanos de dispositivos similares fue de 27.5 °C / 81.5 F (+4.3 °C / 7.7 F).
Acer Aspire 3 A315-51-55E4 análisis de audio
(±) | la sonoridad del altavoz es media pero buena (72 dB)
Graves 100 - 315 Hz
(-) | casi sin bajos - de media 23.3% inferior a la mediana
(±) | la linealidad de los graves es media (9.3% delta a frecuencia anterior)
Medios 400 - 2000 Hz
(±) | medias más altas - de media 7.4% más altas que la mediana
(±) | la linealidad de los medios es media (13.3% delta respecto a la frecuencia anterior)
Altos 2 - 16 kHz
(+) | máximos equilibrados - a sólo 3.6% de la mediana
(±) | la linealidad de los máximos es media (7.5% delta a frecuencia anterior)
Total 100 - 16.000 Hz
(±) | la linealidad del sonido global es media (27.9% de diferencia con la mediana)
En comparación con la misma clase
» 87% de todos los dispositivos probados de esta clase eran mejores, 3% similares, 10% peores
» El mejor tuvo un delta de 7%, la media fue 21%, el peor fue ###max##%
En comparación con todos los dispositivos probados
» 85% de todos los dispositivos probados eran mejores, 3% similares, 12% peores
» El mejor tuvo un delta de 4%, la media fue 24%, el peor fue ###max##%
Apple MacBook 12 (Early 2016) 1.1 GHz análisis de audio
(+) | los altavoces pueden reproducir a un volumen relativamente alto (#83.6 dB)
Graves 100 - 315 Hz
(±) | lubina reducida - en promedio 11.3% inferior a la mediana
(±) | la linealidad de los graves es media (14.2% delta a frecuencia anterior)
Medios 400 - 2000 Hz
(+) | medios equilibrados - a sólo 2.4% de la mediana
(+) | los medios son lineales (5.5% delta a la frecuencia anterior)
Altos 2 - 16 kHz
(+) | máximos equilibrados - a sólo 2% de la mediana
(+) | los máximos son lineales (4.5% delta a la frecuencia anterior)
Total 100 - 16.000 Hz
(+) | el sonido global es lineal (10.2% de diferencia con la mediana)
En comparación con la misma clase
» 7% de todos los dispositivos probados de esta clase eran mejores, 2% similares, 91% peores
» El mejor tuvo un delta de 5%, la media fue 18%, el peor fue ###max##%
En comparación con todos los dispositivos probados
» 5% de todos los dispositivos probados eran mejores, 1% similares, 94% peores
» El mejor tuvo un delta de 4%, la media fue 24%, el peor fue ###max##%
Lenovo ThinkPad E570-20H6S00000 análisis de audio
(±) | la sonoridad del altavoz es media pero buena (80.7 dB)
Graves 100 - 315 Hz
(-) | casi sin bajos - de media 16.8% inferior a la mediana
(-) | los graves no son lineales (16.4% delta a la frecuencia anterior)
Medios 400 - 2000 Hz
(±) | medias más altas - de media 5.1% más altas que la mediana
(±) | la linealidad de los medios es media (9.5% delta respecto a la frecuencia anterior)
Altos 2 - 16 kHz
(+) | máximos equilibrados - a sólo 2.7% de la mediana
(+) | los máximos son lineales (6.5% delta a la frecuencia anterior)
Total 100 - 16.000 Hz
(±) | la linealidad del sonido global es media (19.6% de diferencia con la mediana)
En comparación con la misma clase
» 64% de todos los dispositivos probados de esta clase eran mejores, 7% similares, 29% peores
» El mejor tuvo un delta de 5%, la media fue 17%, el peor fue ###max##%
En comparación con todos los dispositivos probados
» 49% de todos los dispositivos probados eran mejores, 7% similares, 44% peores
» El mejor tuvo un delta de 4%, la media fue 24%, el peor fue ###max##%
HP Pavilion 14-al103ng análisis de audio
(±) | la sonoridad del altavoz es media pero buena (72 dB)
Graves 100 - 315 Hz
(-) | casi sin bajos - de media 29.2% inferior a la mediana
(±) | la linealidad de los graves es media (7.9% delta a frecuencia anterior)
Medios 400 - 2000 Hz
(+) | medios equilibrados - a sólo 2.1% de la mediana
(+) | los medios son lineales (6.2% delta a la frecuencia anterior)
Altos 2 - 16 kHz
(±) | máximos más altos - de media 5.3% más altos que la mediana
(±) | la linealidad de los máximos es media (7.9% delta a frecuencia anterior)
Total 100 - 16.000 Hz
(±) | la linealidad del sonido global es media (24.5% de diferencia con la mediana)
En comparación con la misma clase
» 71% de todos los dispositivos probados de esta clase eran mejores, 8% similares, 21% peores
» El mejor tuvo un delta de 7%, la media fue 21%, el peor fue ###max##%
En comparación con todos los dispositivos probados
» 74% de todos los dispositivos probados eran mejores, 6% similares, 20% peores
» El mejor tuvo un delta de 4%, la media fue 24%, el peor fue ###max##%
Fujitsu Lifebook A557 análisis de audio
(-) | altavoces no muy altos (#67 dB)
Graves 100 - 315 Hz
(-) | casi sin bajos - de media 26.8% inferior a la mediana
(+) | el bajo es lineal (6.2% delta a la frecuencia anterior)
Medios 400 - 2000 Hz
(±) | medias más altas - de media 6.8% más altas que la mediana
(-) | los medios no son lineales (15% delta respecto a la frecuencia anterior)
Altos 2 - 16 kHz
(+) | máximos equilibrados - a sólo 3.5% de la mediana
(±) | la linealidad de los máximos es media (8.7% delta a frecuencia anterior)
Total 100 - 16.000 Hz
(-) | el sonido global no es lineal (33.6% de diferencia con la mediana)
En comparación con la misma clase
» 96% de todos los dispositivos probados de esta clase eran mejores, 2% similares, 3% peores
» El mejor tuvo un delta de 7%, la media fue 21%, el peor fue ###max##%
En comparación con todos los dispositivos probados
» 92% de todos los dispositivos probados eran mejores, 1% similares, 6% peores
» El mejor tuvo un delta de 4%, la media fue 24%, el peor fue ###max##%
Dell Latitude 5580 análisis de audio
(-) | altavoces no muy altos (#70.2 dB)
Graves 100 - 315 Hz
(±) | lubina reducida - en promedio 12.5% inferior a la mediana
(±) | la linealidad de los graves es media (10.4% delta a frecuencia anterior)
Medios 400 - 2000 Hz
(+) | medios equilibrados - a sólo 4.6% de la mediana
(±) | la linealidad de los medios es media (8.9% delta respecto a la frecuencia anterior)
Altos 2 - 16 kHz
(±) | máximos más altos - de media 5.1% más altos que la mediana
(±) | la linealidad de los máximos es media (9.9% delta a frecuencia anterior)
Total 100 - 16.000 Hz
(±) | la linealidad del sonido global es media (24.6% de diferencia con la mediana)
En comparación con la misma clase
» 73% de todos los dispositivos probados de esta clase eran mejores, 7% similares, 21% peores
» El mejor tuvo un delta de 7%, la media fue 21%, el peor fue ###max##%
En comparación con todos los dispositivos probados
» 75% de todos los dispositivos probados eran mejores, 5% similares, 20% peores
» El mejor tuvo un delta de 4%, la media fue 24%, el peor fue ###max##%
| Off / Standby | |
| Ocioso | |
| Carga |
|
Clave:
min: | |
| Acer Aspire 3 A315-51-55E4 i5-7200U, HD Graphics 620, Micron 1100 MTFDDAV256TBN, TN LED, 1920x1080, 15.6" | Dell Latitude 5580 i5-7200U, HD Graphics 620, Seagate ST500LM021-1KJ15, TN LED, 1366x768, 15.6" | Fujitsu Lifebook A557 i5-7200U, HD Graphics 620, Samsung MZ7TN512HDHP-00000, a-Si TFT-LCD , LCM, 1920x1080, 15.6" | Lenovo ThinkPad E570-20H6S00000 i5-7200U, GeForce GTX 950M, Toshiba THNSF5256GPUK, IPS LED, 1920x1080, 15.6" | HP Pavilion 14-al103ng i5-7200U, HD Graphics 620, Western Digital Scorpio Blue WD5000LPCX-24C6HT0, IPS, 1920x1080, 14" | |
|---|---|---|---|---|---|
| Power Consumption | 7% | 10% | -32% | -10% | |
| Idle Minimum * (Watt) | 4.1 | 3.5 15% | 2.9 29% | 2.8 32% | 5.5 -34% |
| Idle Average * (Watt) | 7.5 | 6 20% | 6.4 15% | 6.3 16% | 8.2 -9% |
| Idle Maximum * (Watt) | 8.9 | 7.3 18% | 6.9 22% | 6.9 22% | 8.9 -0% |
| Load Average * (Watt) | 28.1 | 30.8 -10% | 31.8 -13% | 51.6 -84% | 29.1 -4% |
| Load Maximum * (Watt) | 28.3 | 31 -10% | 29 -2% | 69.7 -146% | 29.4 -4% |
* ... más pequeño es mejor
| Acer Aspire 3 A315-51-55E4 i5-7200U, HD Graphics 620, 37 Wh | Dell Latitude 5580 i5-7200U, HD Graphics 620, 68 Wh | Fujitsu Lifebook A557 i5-7200U, HD Graphics 620, 49 Wh | Lenovo ThinkPad E570-20H6S00000 i5-7200U, GeForce GTX 950M, 41 Wh | |
|---|---|---|---|---|
| Duración de Batería | 62% | 34% | 31% | |
| Reader / Idle (h) | 14.3 | 18.4 29% | 16.5 15% | 14.7 3% |
| WiFi v1.3 (h) | 5.8 | 11.6 100% | 8.8 52% | 7.7 33% |
| Load (h) | 1.4 | 2.2 57% | 1.9 36% | 2.2 57% |
| H.264 (h) | 7.6 |
Pro
Contra
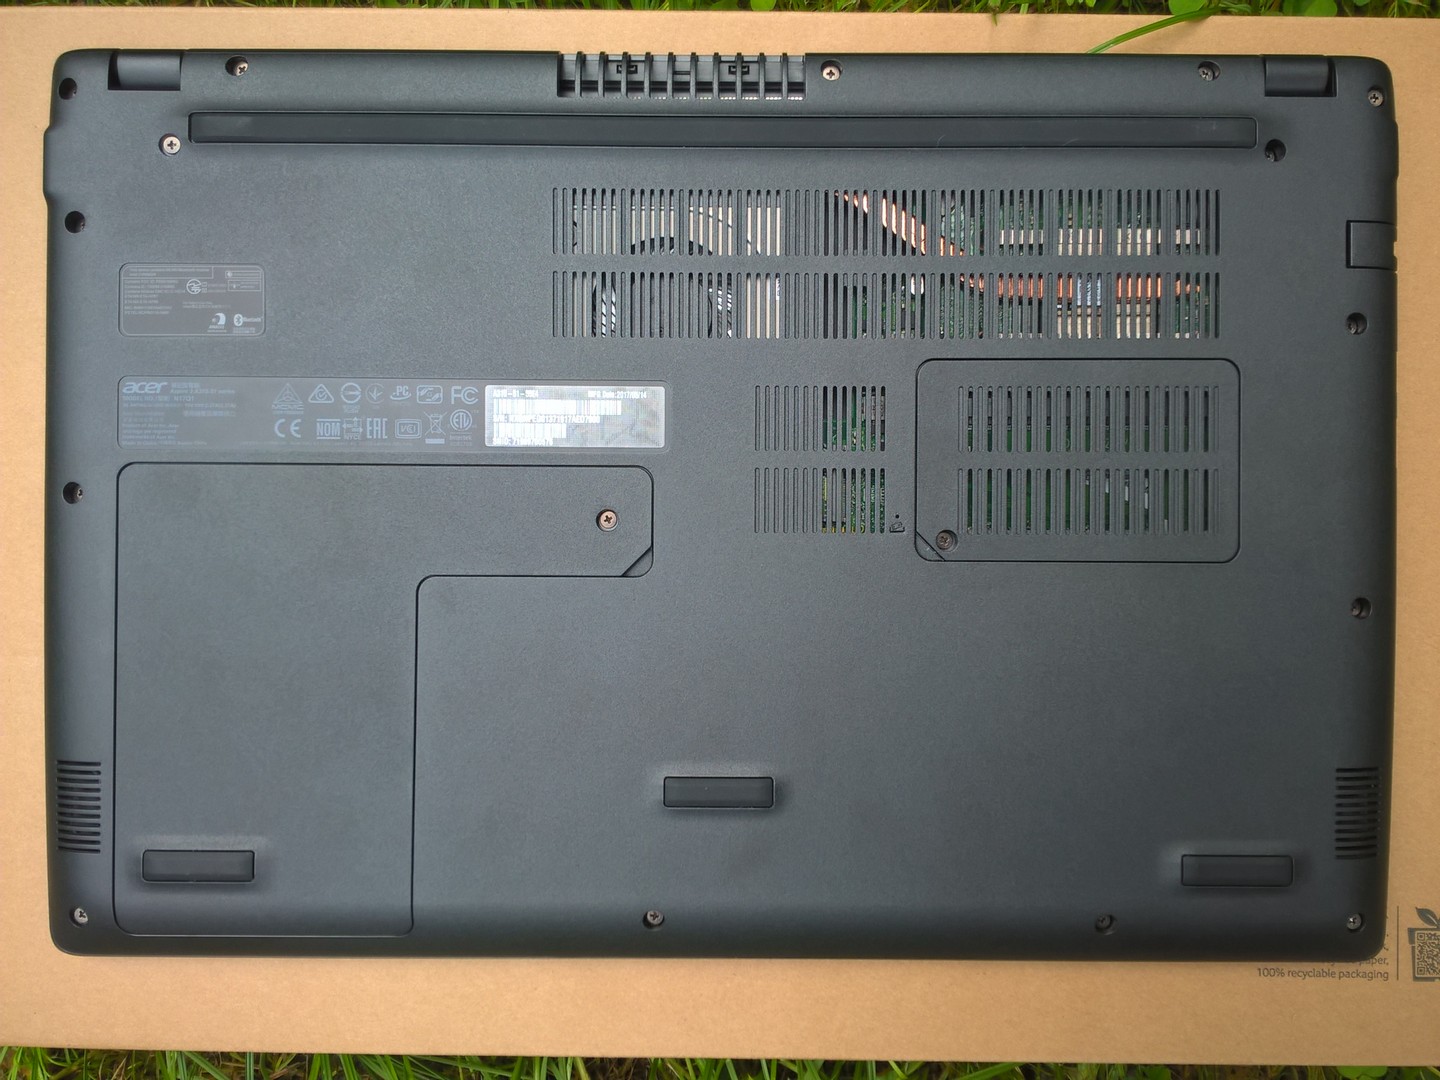
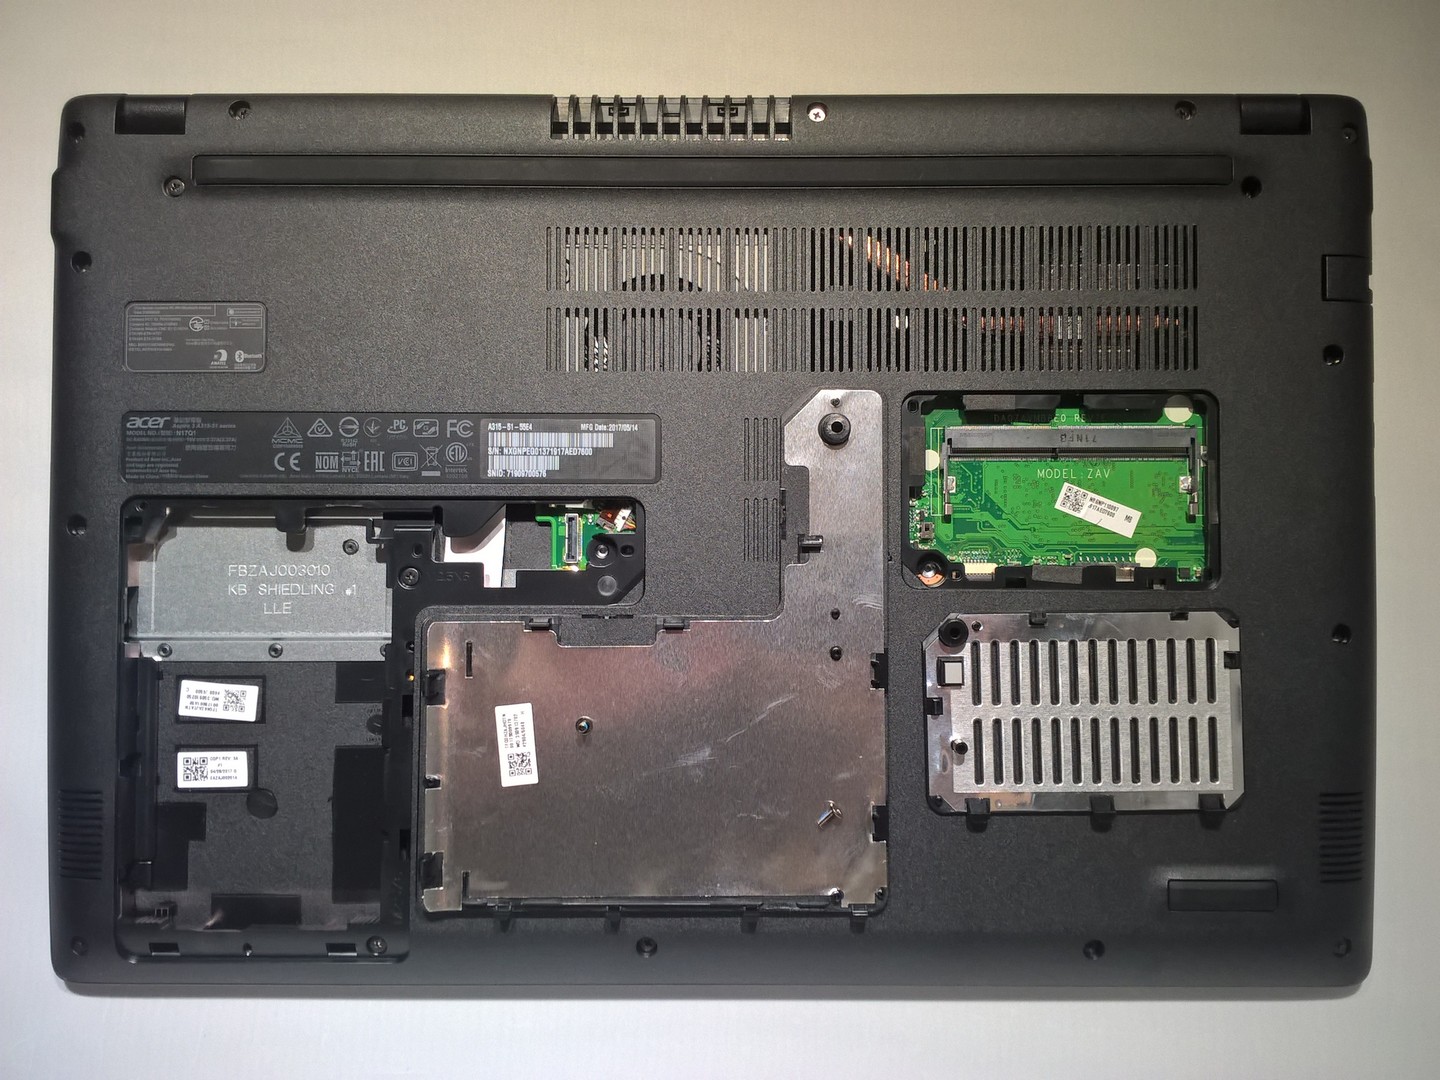
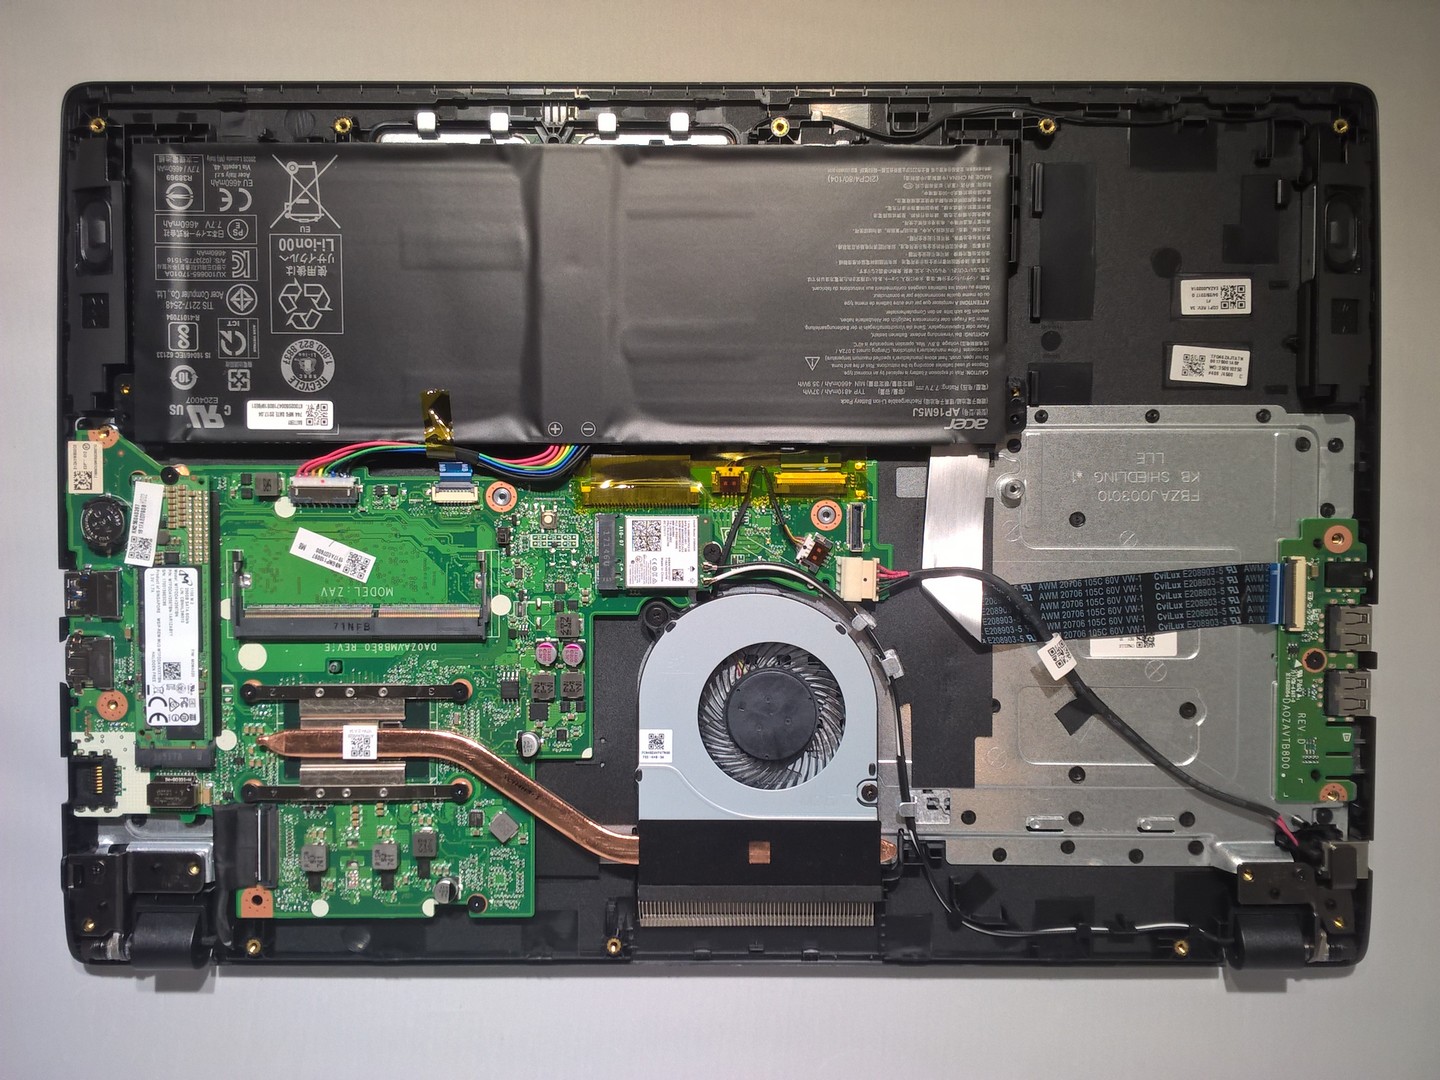
El Aspire 3 de Acer es un buen dispositivo básico que puede gestionar más que simples procesos en el uso cotidiano y sabe manejar la multitarea. Incluso se puede utilizar para una sencilla edición de imagen, pero aparte de eso no debes esperar demasiado del portátil. Nos gustó las posibilidades de mejora que proporcionan las escotillas de mantenimiento para el dispositivo de almacenamiento y memoria RAM, pero la batería no se debe "caer" fuera de la carcasa cuando se quita la cubierta inferior. Esto puede causar rápidamente daños en o dentro del dispositivo.
El Aspire 3 es un buen dispositivo básico que se adapta a la mayoría de las actividades cotidianas.
El Aspire 3 es un candidato adecuado para todos los que buscan un portátil de 15 " asequible con un rendimiento y un potencial de actualización suficientes. Si vas a utilizar tu dispositivo muy lejos de un enchufe o cuando viajes, es posible que tengas algunos problemas con la corto aguante de la batería.
Ésta es una versión acortada del análisis original. Puedes leer el análisis completo en inglés aquí.
Acer Aspire 3 A315-51-55E4
- 09/06/2017 v6 (old)
Mike Wobker