Brevé análisis del portátil HP 15-ay116ng
| SD Card Reader | |
| average JPG Copy Test (av. of 3 runs) | |
| Dell Latitude 14 Rugged 5414 | |
| HP 250 G5 SP X0N33EA | |
| Acer Extensa 2520-59CD | |
| Dell Latitude 15-3570 | |
| HP 15-ay116ng | |
| Lenovo B50-50 80S2000QGE | |
| maximum AS SSD Seq Read Test (1GB) | |
| Dell Latitude 14 Rugged 5414 | |
| Lenovo B50-50 80S2000QGE | |
| Acer Extensa 2520-59CD | |
| HP 15-ay116ng | |
| Dell Latitude 15-3570 | |
| Networking | |
| iperf Server (receive) TCP 1 m | |
| HP 250 G5 SP X0N33EA (jseb) | |
| HP 15-ay116ng (jseb) | |
| iperf Client (transmit) TCP 1 m | |
| Acer Extensa 2520-59CD | |
| HP 250 G5 SP X0N33EA (jseb) | |
| HP 15-ay116ng (jseb) | |
| |||||||||||||||||||||||||
iluminación: 89 %
Brillo con batería: 241 cd/m²
Contraste: 566:1 (Negro: 0.44 cd/m²)
ΔE ColorChecker Calman: 11.71 | ∀{0.5-29.43 Ø4.72}
ΔE Greyscale Calman: 13.13 | ∀{0.09-98 Ø4.97}
56% sRGB (Argyll 1.6.3 3D)
36% AdobeRGB 1998 (Argyll 1.6.3 3D)
38.58% AdobeRGB 1998 (Argyll 3D)
56.2% sRGB (Argyll 3D)
37.34% Display P3 (Argyll 3D)
Gamma: 2.57
CCT: 15273 K
| HP 15-ay116ng TN LED, 1920x1080, 15.6" | HP 250 G5 SP X0N33EA TN, 1920x1080, 15.6" | Acer Extensa 2520-59CD TN LED, 1366x768, 15.6" | Lenovo B50-50 80S2000QGE TN LED, 1366x768, 15.6" | Dell Latitude 15-3570 TN LED, 1366x768, 15.6" | |
|---|---|---|---|---|---|
| Display | -2% | 9% | 0% | 9% | |
| Display P3 Coverage (%) | 37.34 | 36.51 -2% | 40.71 9% | 37.24 0% | 40.61 9% |
| sRGB Coverage (%) | 56.2 | 55 -2% | 61.1 9% | 56 0% | 61.1 9% |
| AdobeRGB 1998 Coverage (%) | 38.58 | 37.72 -2% | 42.07 9% | 38.48 0% | 41.96 9% |
| Response Times | 2% | -33% | -31% | -27% | |
| Response Time Grey 50% / Grey 80% * (ms) | 40 ? | 40 ? -0% | 52 ? -30% | 58 ? -45% | 37 ? 7% |
| Response Time Black / White * (ms) | 23 ? | 22 ? 4% | 31 ? -35% | 27 ? -17% | 37 ? -61% |
| PWM Frequency (Hz) | 1000 | ||||
| Screen | -4% | -0% | -7% | -11% | |
| Brightness middle (cd/m²) | 249 | 219 -12% | 211 -15% | 204 -18% | 202 -19% |
| Brightness (cd/m²) | 234 | 222 -5% | 200 -15% | 198 -15% | 211 -10% |
| Brightness Distribution (%) | 89 | 85 -4% | 83 -7% | 85 -4% | 88 -1% |
| Black Level * (cd/m²) | 0.44 | 0.39 11% | 0.43 2% | 0.48 -9% | 0.62 -41% |
| Contrast (:1) | 566 | 562 -1% | 491 -13% | 425 -25% | 326 -42% |
| Colorchecker dE 2000 * | 11.71 | 12.67 -8% | 10.53 10% | 11.62 1% | 12.35 -5% |
| Colorchecker dE 2000 max. * | 19.51 | 20.99 -8% | 17.79 9% | 19.97 -2% | 19.9 -2% |
| Greyscale dE 2000 * | 13.13 | 13.82 -5% | 11.85 10% | 12.3 6% | 13.46 -3% |
| Gamma | 2.57 86% | 2.63 84% | 2.25 98% | 2.22 99% | 2.44 90% |
| CCT | 15273 43% | 15633 42% | 13758 47% | 13244 49% | 15217 43% |
| Color Space (Percent of AdobeRGB 1998) (%) | 36 | 35 -3% | 39 8% | 36 0% | 39 8% |
| Color Space (Percent of sRGB) (%) | 56 | 55 -2% | 61 9% | 56 0% | 61 9% |
| Media total (Programa/Opciones) | -1% /
-3% | -8% /
-3% | -13% /
-9% | -10% /
-9% |
* ... más pequeño es mejor
Parpadeo de Pantalla / PWM (Pulse-Width Modulation)
| Parpadeo de Pantalla / PWM no detectado | ||
Comparación: 52 % de todos los dispositivos testados no usaron PWM para atenuar el display. Si se usó, medimos una media de 7769 (mínimo: 5 - máxmo: 343500) Hz. | ||
Tiempos de respuesta del display
| ↔ Tiempo de respuesta de Negro a Blanco | ||
|---|---|---|
| 23 ms ... subida ↗ y bajada ↘ combinada | ↗ 7 ms subida | 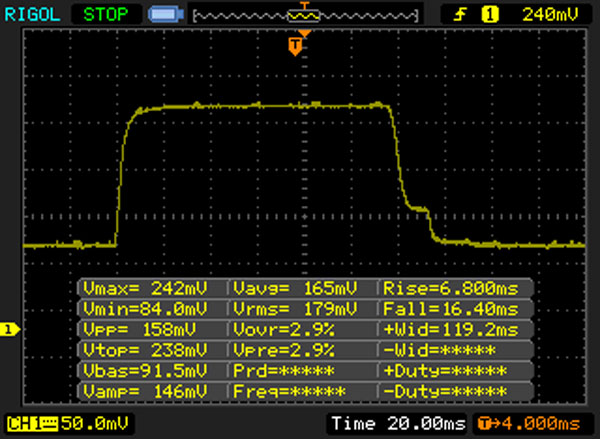 |
| ↘ 16 ms bajada | ||
| La pantalla mostró buenos tiempos de respuesta en nuestros tests pero podría ser demasiado lenta para los jugones competitivos. En comparación, todos los dispositivos de prueba van de ##min### (mínimo) a 240 (máximo) ms. » 52 % de todos los dispositivos son mejores. Eso quiere decir que el tiempo de respuesta es peor que la media (19.8 ms) de todos los dispositivos testados. | ||
| ↔ Tiempo de respuesta 50% Gris a 80% Gris | ||
| 40 ms ... subida ↗ y bajada ↘ combinada | ↗ 20 ms subida | 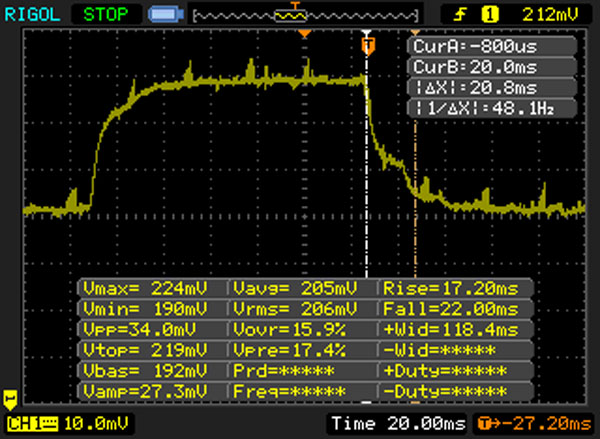 |
| ↘ 20 ms bajada | ||
| La pantalla mostró tiempos de respuesta lentos en nuestros tests y podría ser demasiado lenta para los jugones. En comparación, todos los dispositivos de prueba van de ##min### (mínimo) a 636 (máximo) ms. » 61 % de todos los dispositivos son mejores. Eso quiere decir que el tiempo de respuesta es peor que la media (31 ms) de todos los dispositivos testados. | ||
| Cinebench R10 | |
| Rendering Multiple CPUs 32Bit | |
| HP 15-ay116ng | |
| Acer Extensa 2520-59CD | |
| Lenovo B50-50 80S2000QGE | |
| Lenovo Ideapad 500-15ACZ | |
| Lenovo G51-35 80M8002HGE | |
| Rendering Single 32Bit | |
| HP 15-ay116ng | |
| Acer Extensa 2520-59CD | |
| Lenovo B50-50 80S2000QGE | |
| Lenovo Ideapad 500-15ACZ | |
| Lenovo G51-35 80M8002HGE | |
| Geekbench 3 | |
| 32 Bit Single-Core Score | |
| HP 15-ay116ng | |
| Acer Extensa 2520-59CD | |
| Lenovo Ideapad 500-15ACZ | |
| Lenovo B50-50 80S2000QGE | |
| 32 Bit Multi-Core Score | |
| HP 15-ay116ng | |
| Acer Extensa 2520-59CD | |
| Lenovo Ideapad 500-15ACZ | |
| Lenovo B50-50 80S2000QGE | |
| Geekbench 4.0 | |
| 64 Bit Single-Core Score | |
| HP 15-ay116ng | |
| 64 Bit Multi-Core Score | |
| HP 15-ay116ng | |
| JetStream 1.1 - 1.1 Total | |
| HP 15-ay116ng | |
| HP 250 G5 SP X0N33EA | |
| Acer Extensa 2520-59CD | |
| Lenovo B50-50 80S2000QGE | |
| Lenovo Ideapad 500-15ACZ | |
| Lenovo G51-35 80M8002HGE | |
| Octane V2 - Total Score | |
| HP 15-ay116ng | |
| Lenovo B50-50 80S2000QGE | |
| Lenovo Ideapad 500-15ACZ | |
| HP 250 G5 SP X0N33EA | |
| Mozilla Kraken 1.1 - Total | |
| HP 250 G5 SP X0N33EA | |
| Lenovo Ideapad 500-15ACZ | |
| Lenovo B50-50 80S2000QGE | |
| HP 15-ay116ng | |
* ... más pequeño es mejor
| PCMark 7 Score | 4977 puntos | |
| PCMark 8 Home Score Accelerated v2 | 3315 puntos | |
| PCMark 8 Creative Score Accelerated v2 | 4338 puntos | |
| PCMark 8 Work Score Accelerated v2 | 4587 puntos | |
ayuda | ||
| PCMark 8 | |
| Home Score Accelerated v2 | |
| Dell Latitude 15-3570 | |
| HP 250 G5 SP X0N33EA | |
| HP 15-ay116ng | |
| Lenovo B50-50 80S2000QGE | |
| Acer Extensa 2520-59CD | |
| Work Score Accelerated v2 | |
| HP 15-ay116ng | |
| Dell Latitude 15-3570 | |
| HP 250 G5 SP X0N33EA | |
| Lenovo B50-50 80S2000QGE | |

| HP 15-ay116ng Samsung CM871a MZNTY256HDHP | HP 250 G5 SP X0N33EA SanDisk Z400s SD8SNAT-256G | Acer Extensa 2520-59CD Toshiba MQ01ABF050 | Lenovo B50-50 80S2000QGE Toshiba MQ02ABF050H (SSHD 500 + 8 GB) | Dell Latitude 15-3570 Samsung CM871 MZNLF128HCHP | |
|---|---|---|---|---|---|
| CrystalDiskMark 3.0 | -21% | -92% | -92% | -56% | |
| Read Seq (MB/s) | 501 | 509 2% | 104.7 -79% | 102.5 -80% | 453.2 -10% |
| Write Seq (MB/s) | 483.9 | 322.1 -33% | 95.7 -80% | 90.7 -81% | 137.7 -72% |
| Read 512 (MB/s) | 413.8 | 321.2 -22% | 33 -92% | 32.58 -92% | 308.5 -25% |
| Write 512 (MB/s) | 294.9 | 289.4 -2% | 38.3 -87% | 35.65 -88% | 134.1 -55% |
| Read 4k (MB/s) | 34.91 | 20.99 -40% | 0.375 -99% | 0.426 -99% | 19.06 -45% |
| Write 4k (MB/s) | 95.7 | 88 -8% | 0.782 -99% | 0.64 -99% | 21.31 -78% |
| Read 4k QD32 (MB/s) | 370.9 | 141.3 -62% | 0.675 -100% | 0.987 -100% | 93.5 -75% |
| Write 4k QD32 (MB/s) | 243.6 | 228.5 -6% | 0.769 -100% | 0.645 -100% | 23.3 -90% |
| 3DMark 06 Standard Score | 8012 puntos | |
| 3DMark 11 Performance | 1511 puntos | |
| 3DMark Ice Storm Standard Score | 49743 puntos | |
| 3DMark Cloud Gate Standard Score | 5542 puntos | |
| 3DMark Fire Strike Score | 744 puntos | |
ayuda | ||
| 3DMark 11 - 1280x720 Performance GPU | |
| HP Pavilion 15-aw004ng | |
| HP ProBook 470 G3 | |
| HP 15-ay116ng | |
| Dell Latitude 15-3570 | |
| HP 250 G5 SP X0N33EA | |
| Acer Extensa 2520-59CD | |
| Lenovo B50-50 80S2000QGE | |
| 3DMark | |
| 1280x720 Cloud Gate Standard Graphics | |
| HP 15-ay116ng | |
| HP 250 G5 SP X0N33EA | |
| HP Pavilion 15-aw004ng | |
| HP ProBook 470 G3 | |
| Dell Latitude 15-3570 | |
| Lenovo B50-50 80S2000QGE | |
| 1920x1080 Fire Strike Graphics | |
| HP ProBook 470 G3 | |
| HP Pavilion 15-aw004ng | |
| HP 15-ay116ng | |
| Lenovo B50-50 80S2000QGE | |
| bajo | medio | alto | ultra | |
|---|---|---|---|---|
| Tomb Raider (2013) | 67.6 | 33.9 | 19.5 | 9.6 |
| BioShock Infinite (2013) | 45.3 | 25.3 | 20.9 | 6.5 |
| Battlefield 4 (2013) | 31.1 | 24.9 | 16.4 | 5 |
Ruido
| Ocioso |
| 31.3 / 31.3 / 31.3 dB(A) |
| DVD |
| 38.4 / dB(A) |
| Carga |
| 35.6 / 36.15 dB(A) |
 | ||
30 dB silencioso 40 dB(A) audible 50 dB(A) ruidosamente alto |
||
min: | ||
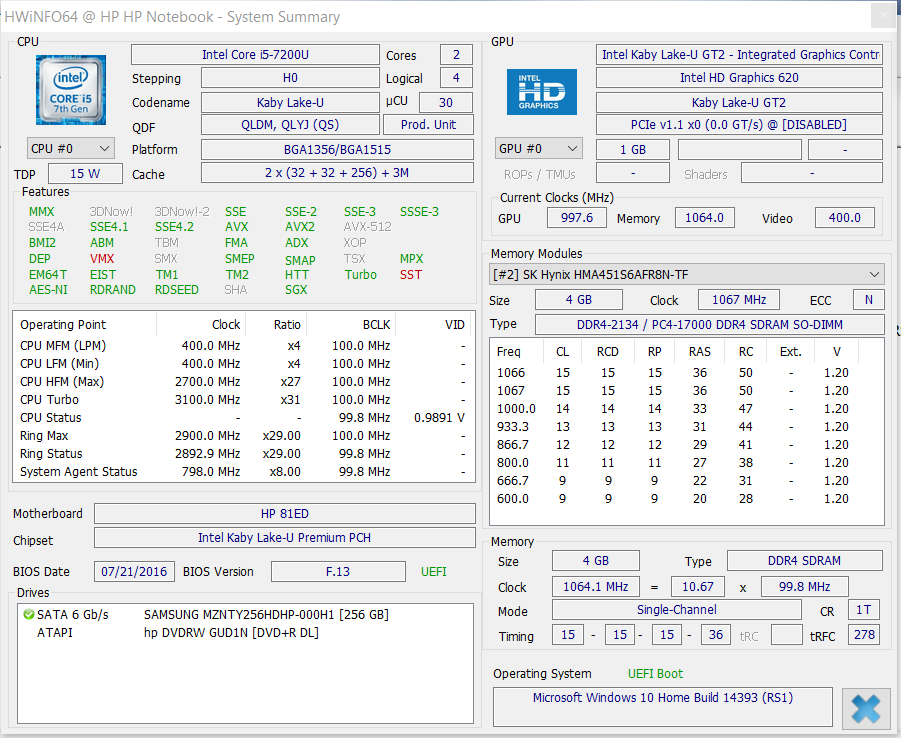
| HP 15-ay116ng i5-7200U, HD Graphics 620 | HP 250 G5 SP X0N33EA 6200U, HD Graphics 520 | Acer Extensa 2520-59CD 6200U, HD Graphics 520 | Lenovo B50-50 80S2000QGE 5005U, HD Graphics 5500 | Dell Latitude 15-3570 6200U, HD Graphics 520 | |
|---|---|---|---|---|---|
| Noise | -8% | -1% | -1% | 2% | |
| apagado / medio ambiente * (dB) | 30.5 | 31.6 -4% | 31.2 -2% | 31.2 -2% | 31 -2% |
| Idle Minimum * (dB) | 31.3 | 34.5 -10% | 31.5 -1% | 32.5 -4% | 31 1% |
| Idle Average * (dB) | 31.3 | 34.5 -10% | 31.9 -2% | 32.5 -4% | 31 1% |
| Idle Maximum * (dB) | 31.3 | 34.5 -10% | 31.9 -2% | 32.7 -4% | 31 1% |
| Load Average * (dB) | 35.6 | 39 -10% | 34.2 4% | 34.2 4% | 34.2 4% |
| Load Maximum * (dB) | 36.15 | 38.3 -6% | 36.8 -2% | 34.6 4% | 34.3 5% |
* ... más pequeño es mejor
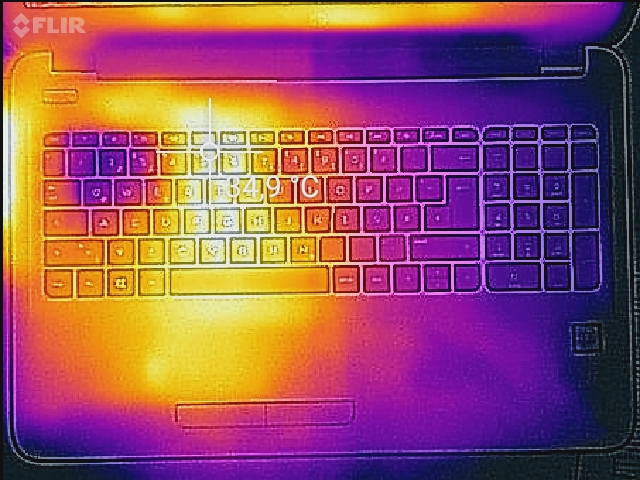
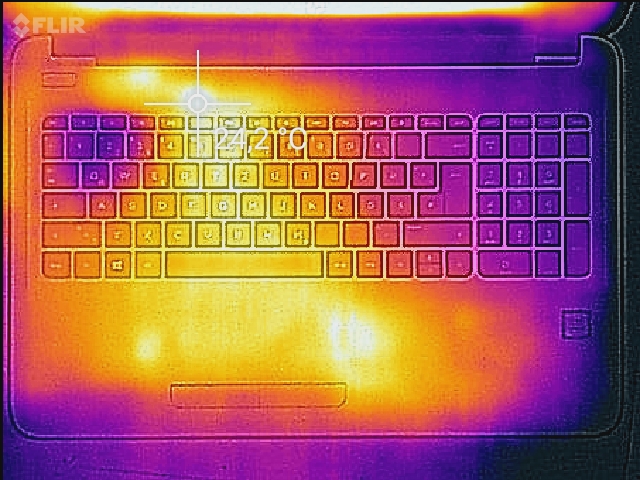
(+) La temperatura máxima en la parte superior es de 33.8 °C / 93 F, frente a la media de 34.3 °C / 94 F, que oscila entre 21.2 y 62.5 °C para la clase Office.
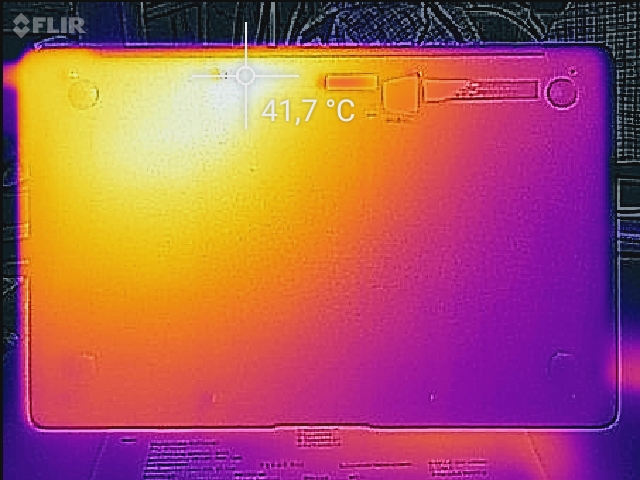
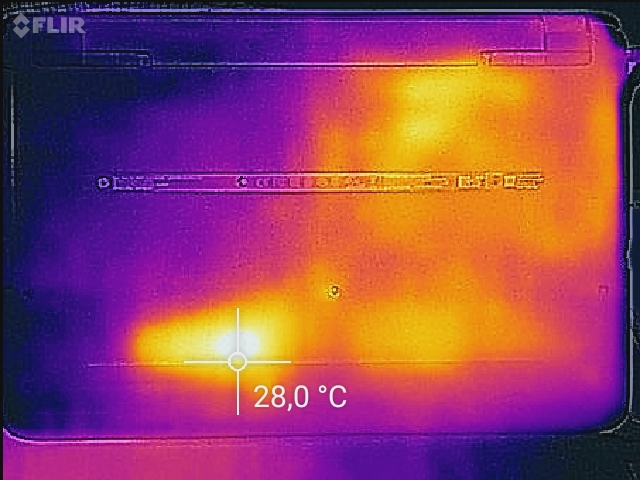
(+) El fondo se calienta hasta un máximo de 36.6 °C / 98 F, frente a la media de 36.8 °C / 98 F
(+) En reposo, la temperatura media de la parte superior es de 22.4 °C / 72# F, frente a la media del dispositivo de 29.5 °C / 85 F.
(+) El reposamanos y el panel táctil están a una temperatura inferior a la de la piel, con un máximo de 31.9 °C / 89.4 F y, por tanto, son fríos al tacto.
(-) La temperatura media de la zona del reposamanos de dispositivos similares fue de 27.5 °C / 81.5 F (-4.4 °C / -7.9 F).
| HP 15-ay116ng i5-7200U, HD Graphics 620 | HP 250 G5 SP X0N33EA 6200U, HD Graphics 520 | Acer Extensa 2520-59CD 6200U, HD Graphics 520 | Lenovo B50-50 80S2000QGE 5005U, HD Graphics 5500 | Dell Latitude 15-3570 6200U, HD Graphics 520 | |
|---|---|---|---|---|---|
| Heat | 7% | -14% | -5% | -27% | |
| Maximum Upper Side * (°C) | 33.8 | 31.1 8% | 33.2 2% | 34.6 -2% | 36.1 -7% |
| Maximum Bottom * (°C) | 36.6 | 31.8 13% | 37.3 -2% | 35.6 3% | 47 -28% |
| Idle Upper Side * (°C) | 23.6 | 22.9 3% | 28.7 -22% | 26.7 -13% | 31.7 -34% |
| Idle Bottom * (°C) | 23.8 | 22.6 5% | 32 -34% | 26 -9% | 32.9 -38% |
* ... más pequeño es mejor
HP 15-ay116ng análisis de audio
(±) | la sonoridad del altavoz es media pero buena (75 dB)
Graves 100 - 315 Hz
(-) | casi sin bajos - de media 27.3% inferior a la mediana
(±) | la linealidad de los graves es media (14.7% delta a frecuencia anterior)
Medios 400 - 2000 Hz
(+) | medios equilibrados - a sólo 2.6% de la mediana
(+) | los medios son lineales (5.8% delta a la frecuencia anterior)
Altos 2 - 16 kHz
(±) | máximos más altos - de media 6.9% más altos que la mediana
(+) | los máximos son lineales (5.4% delta a la frecuencia anterior)
Total 100 - 16.000 Hz
(±) | la linealidad del sonido global es media (23.4% de diferencia con la mediana)
En comparación con la misma clase
» 66% de todos los dispositivos probados de esta clase eran mejores, 8% similares, 26% peores
» El mejor tuvo un delta de 7%, la media fue 21%, el peor fue ###max##%
En comparación con todos los dispositivos probados
» 70% de todos los dispositivos probados eran mejores, 6% similares, 24% peores
» El mejor tuvo un delta de 4%, la media fue 24%, el peor fue ###max##%
Apple MacBook 12 (Early 2016) 1.1 GHz análisis de audio
(+) | los altavoces pueden reproducir a un volumen relativamente alto (#83.6 dB)
Graves 100 - 315 Hz
(±) | lubina reducida - en promedio 11.3% inferior a la mediana
(±) | la linealidad de los graves es media (14.2% delta a frecuencia anterior)
Medios 400 - 2000 Hz
(+) | medios equilibrados - a sólo 2.4% de la mediana
(+) | los medios son lineales (5.5% delta a la frecuencia anterior)
Altos 2 - 16 kHz
(+) | máximos equilibrados - a sólo 2% de la mediana
(+) | los máximos son lineales (4.5% delta a la frecuencia anterior)
Total 100 - 16.000 Hz
(+) | el sonido global es lineal (10.2% de diferencia con la mediana)
En comparación con la misma clase
» 7% de todos los dispositivos probados de esta clase eran mejores, 2% similares, 91% peores
» El mejor tuvo un delta de 5%, la media fue 18%, el peor fue ###max##%
En comparación con todos los dispositivos probados
» 5% de todos los dispositivos probados eran mejores, 1% similares, 94% peores
» El mejor tuvo un delta de 4%, la media fue 24%, el peor fue ###max##%
| Off / Standby | |
| Ocioso | |
| Carga |
|
Clave:
min: | |
| HP 15-ay116ng i5-7200U, HD Graphics 620 | HP 250 G5 SP X0N33EA 6200U, HD Graphics 520 | Acer Extensa 2520-59CD 6200U, HD Graphics 520 | Lenovo B50-50 80S2000QGE 5005U, HD Graphics 5500 | Dell Latitude 15-3570 6200U, HD Graphics 520 | |
|---|---|---|---|---|---|
| Power Consumption | 0% | -54% | -20% | -14% | |
| Idle Minimum * (Watt) | 3.2 | 3.6 -13% | 5.8 -81% | 5.5 -72% | 4.9 -53% |
| Idle Average * (Watt) | 6.3 | 6 5% | 12.6 -100% | 7.6 -21% | 7.2 -14% |
| Idle Maximum * (Watt) | 7.4 | 6.4 14% | 12.8 -73% | 8.5 -15% | 7.5 -1% |
| Load Average * (Watt) | 24 | 26 -8% | 27.6 -15% | 24.5 -2% | 25.4 -6% |
| Load Maximum * (Watt) | 29 | 28.1 3% | 30 -3% | 25.4 12% | 28 3% |
* ... más pequeño es mejor
| HP 15-ay116ng i5-7200U, HD Graphics 620, 41 Wh | HP 250 G5 SP X0N33EA 6200U, HD Graphics 520, 41 Wh | Acer Extensa 2520-59CD 6200U, HD Graphics 520, 37 Wh | Lenovo B50-50 80S2000QGE 5005U, HD Graphics 5500, 32 Wh | Dell Latitude 15-3570 6200U, HD Graphics 520, 65 Wh | |
|---|---|---|---|---|---|
| Duración de Batería | -13% | -23% | -29% | 40% | |
| Reader / Idle (h) | 14.5 | 10.6 -27% | 17.1 18% | ||
| H.264 (h) | 7.2 | 5.2 -28% | |||
| WiFi v1.3 (h) | 6.9 | 5.8 -16% | 5.3 -23% | 4.9 -29% | 9 30% |
| Load (h) | 1.5 | 1.8 20% | 2.6 73% |
Pro
Contra
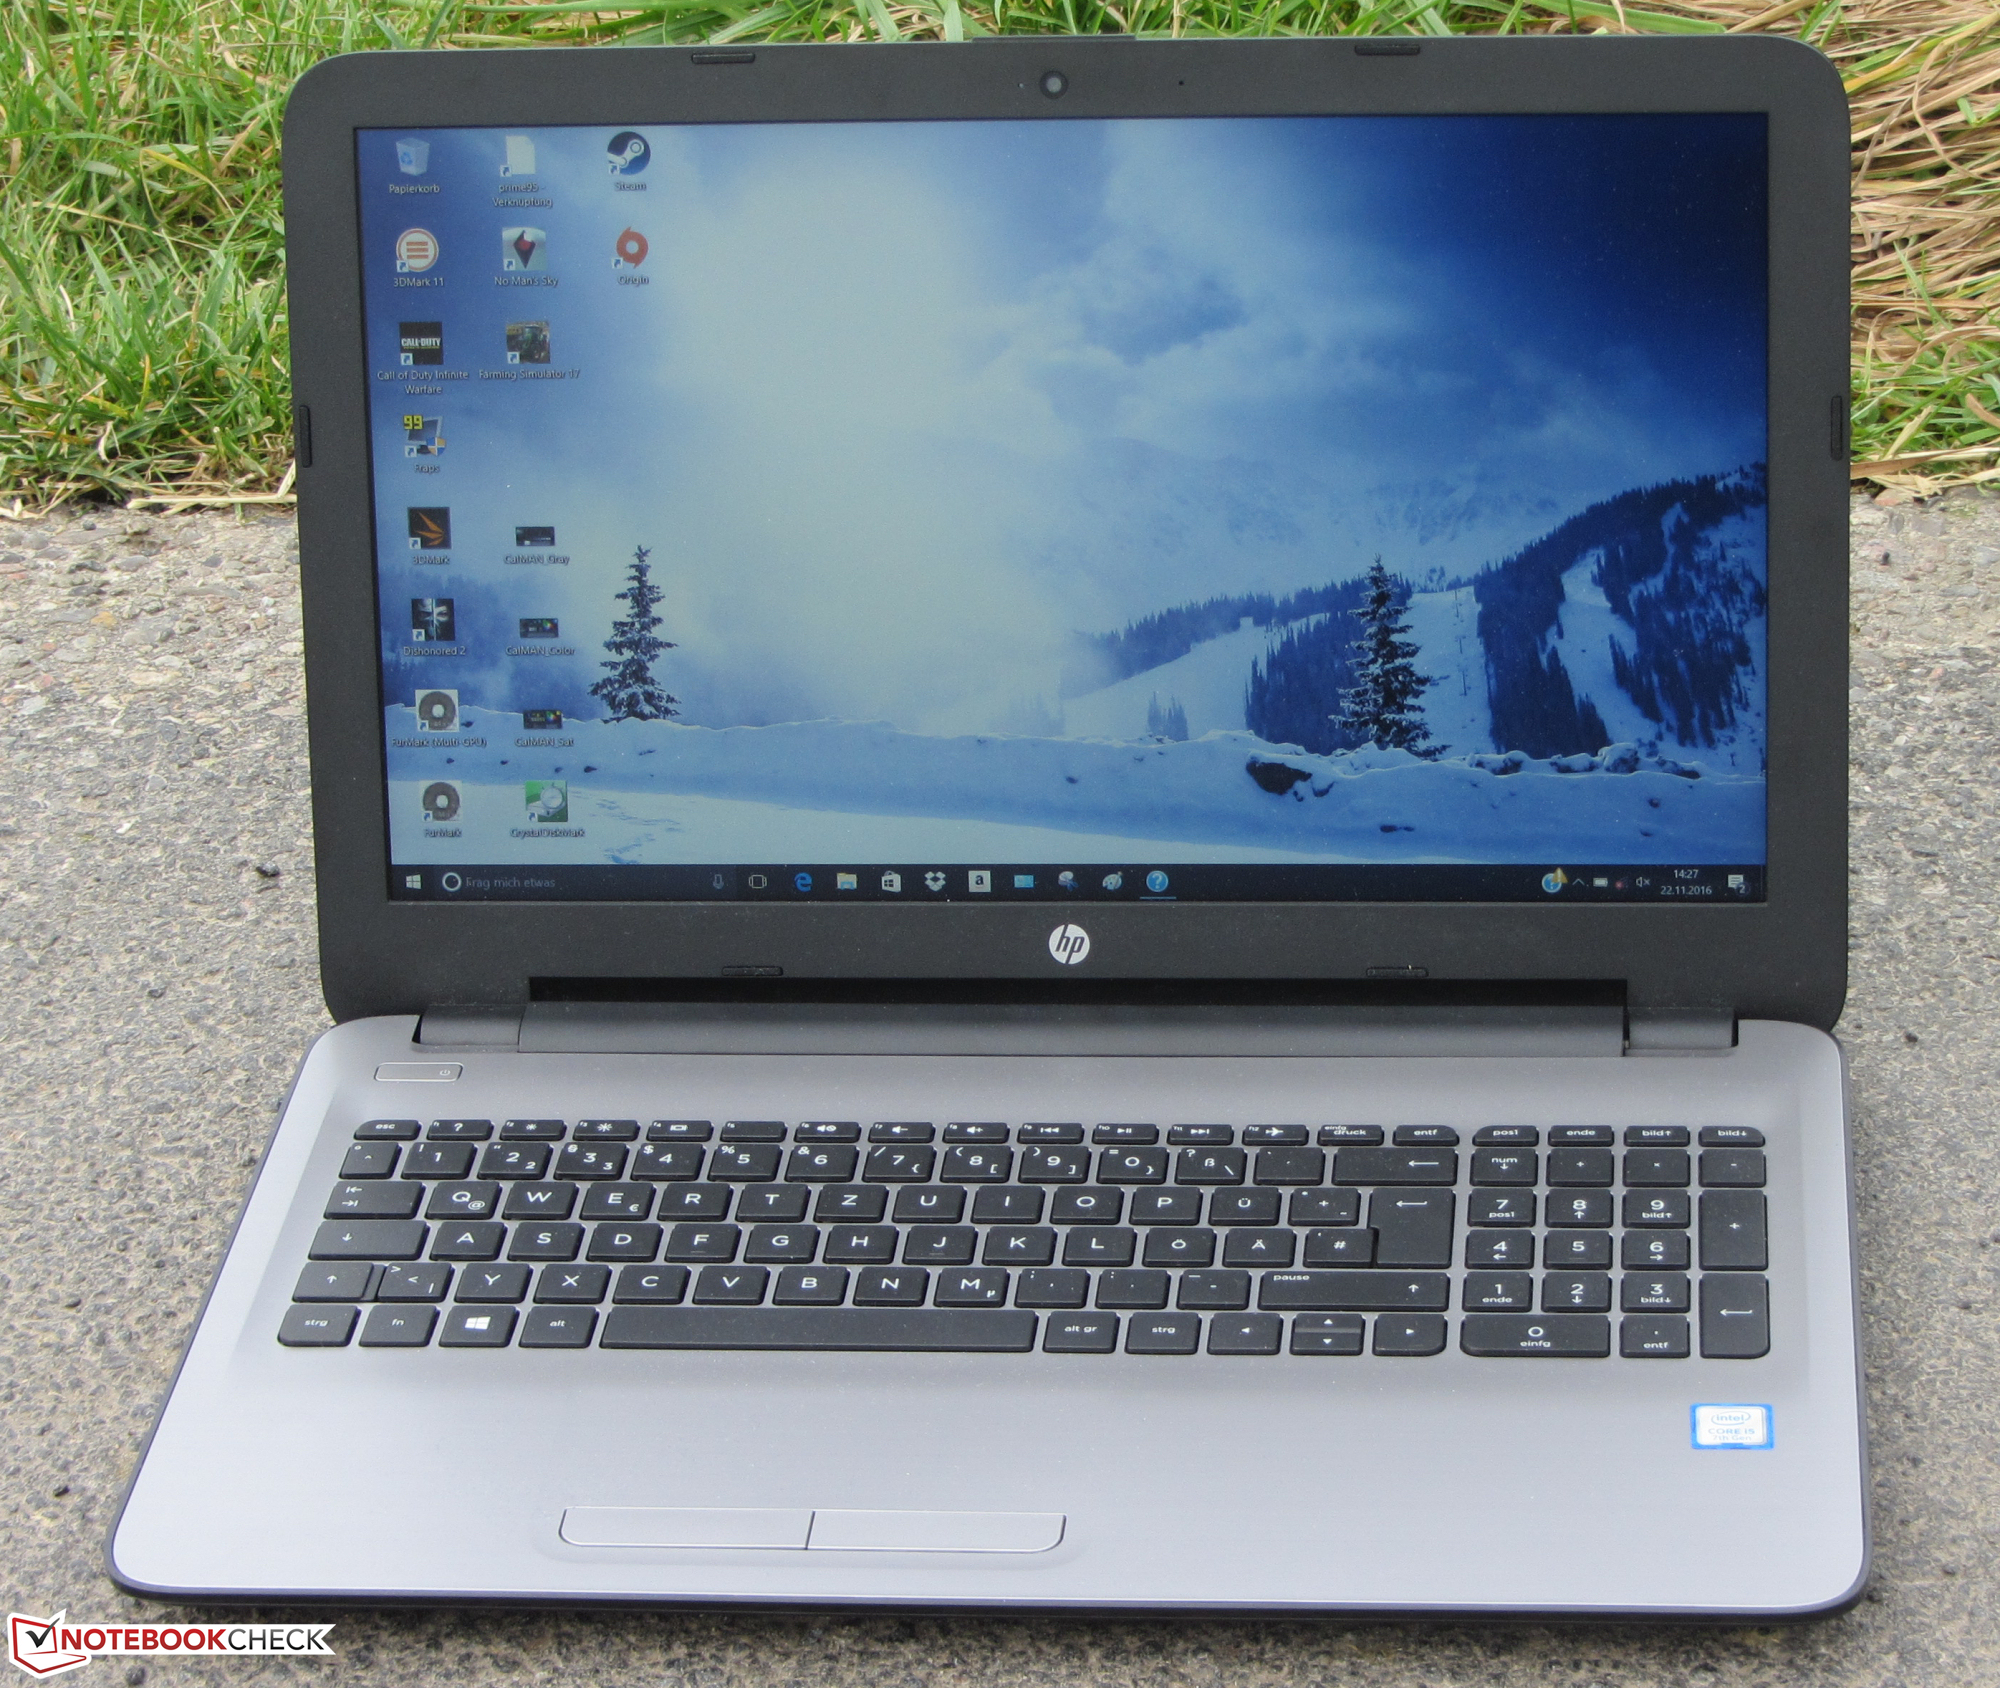
El portátil de 15.6 pulgadas de HP deja una impresión global positiva. Gracias al procesador Kaby Lake, el portátil es adecuado para la mayoría de posibles usos -actualmente y en los próximos años. El portátil se mantiene relativamente frío a pesar de la potente CPU. Un rápido SSD mantiene el buen funcionamiento del sistema. Reemplazar el SSD es posible, pero requeriría abrir la carcasa. El teclado instalado es adecuado para su uso doméstico. Puede decirse lo mismo de la duración de la batería. De la pantalla mate nos ha gustado la resolución Full HD, pero es muy oscura y tiene poco contraste. Además, los ángulos de visión no son amplios. Sin embargo, la pantalla es aceptable si se tiene en cuenta el precio del portátil.
Con el 15-ay116ng, HP añade a su catálogo un todoterreno con una muy buena relación precio - rendimiento.
Este portátil cuesta 500 euros. Bastante de los cuales se van al procesador, la pantalla y el SSD. Esto signigica que ha habido que recortar en otros aspectos: el portátil solo tiene un año de garantía. Incluso en el segmento más económico dos años son ya estándar. Además, el portátil solo tiene Fast Ethernet. Si necesitas Ethernet Gigabit, deberás buscar una alternativa. El portátil carece también de un modulo WiFi con soporte para el estándar AC.
Ésta es una versión acortada del análisis original. Puedes leer el análisis completo en inglés aquí.
HP 15-ay116ng
- 11/25/2016 v5.1 (old)
Sascha Mölck