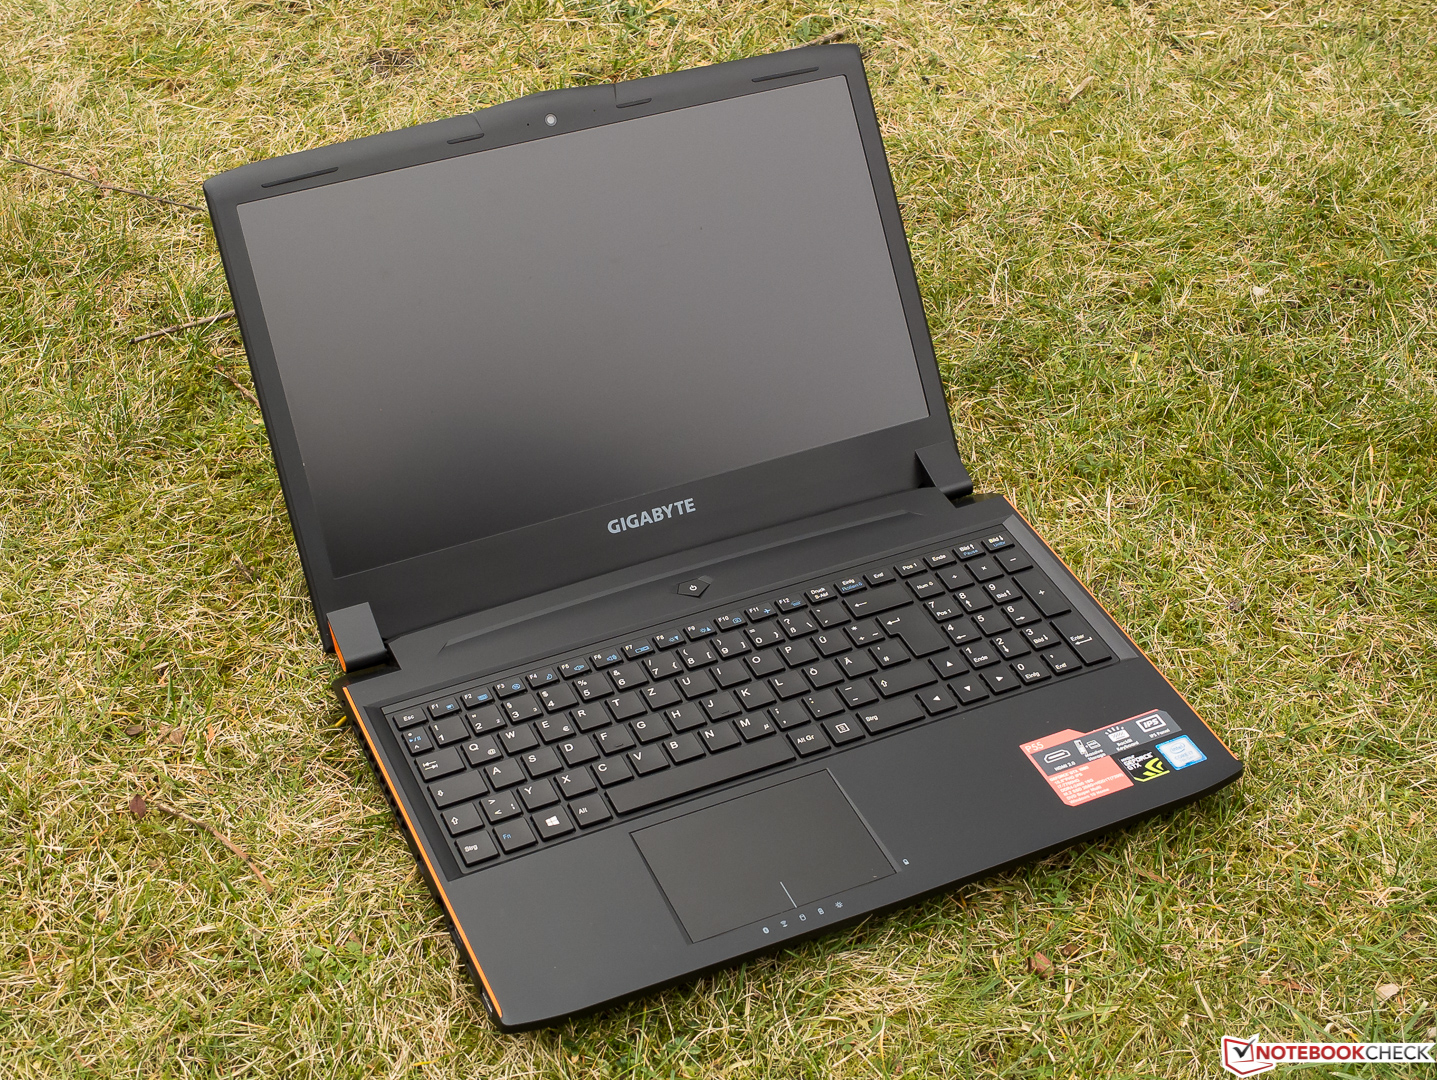
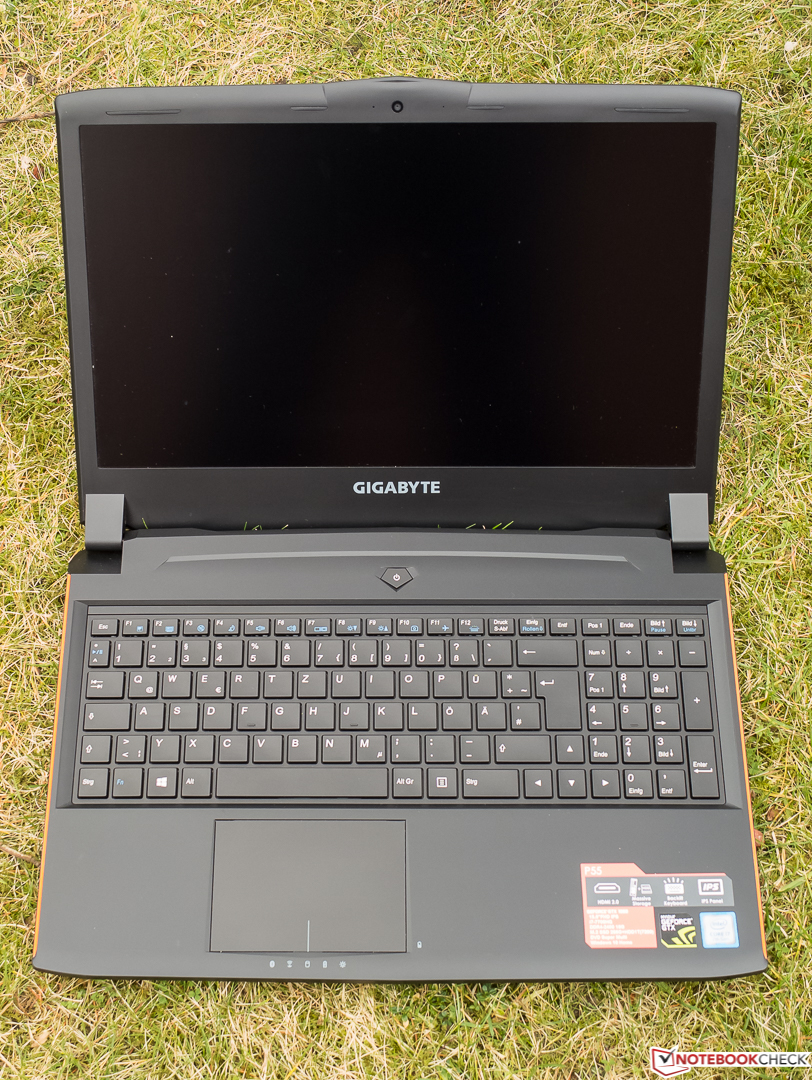
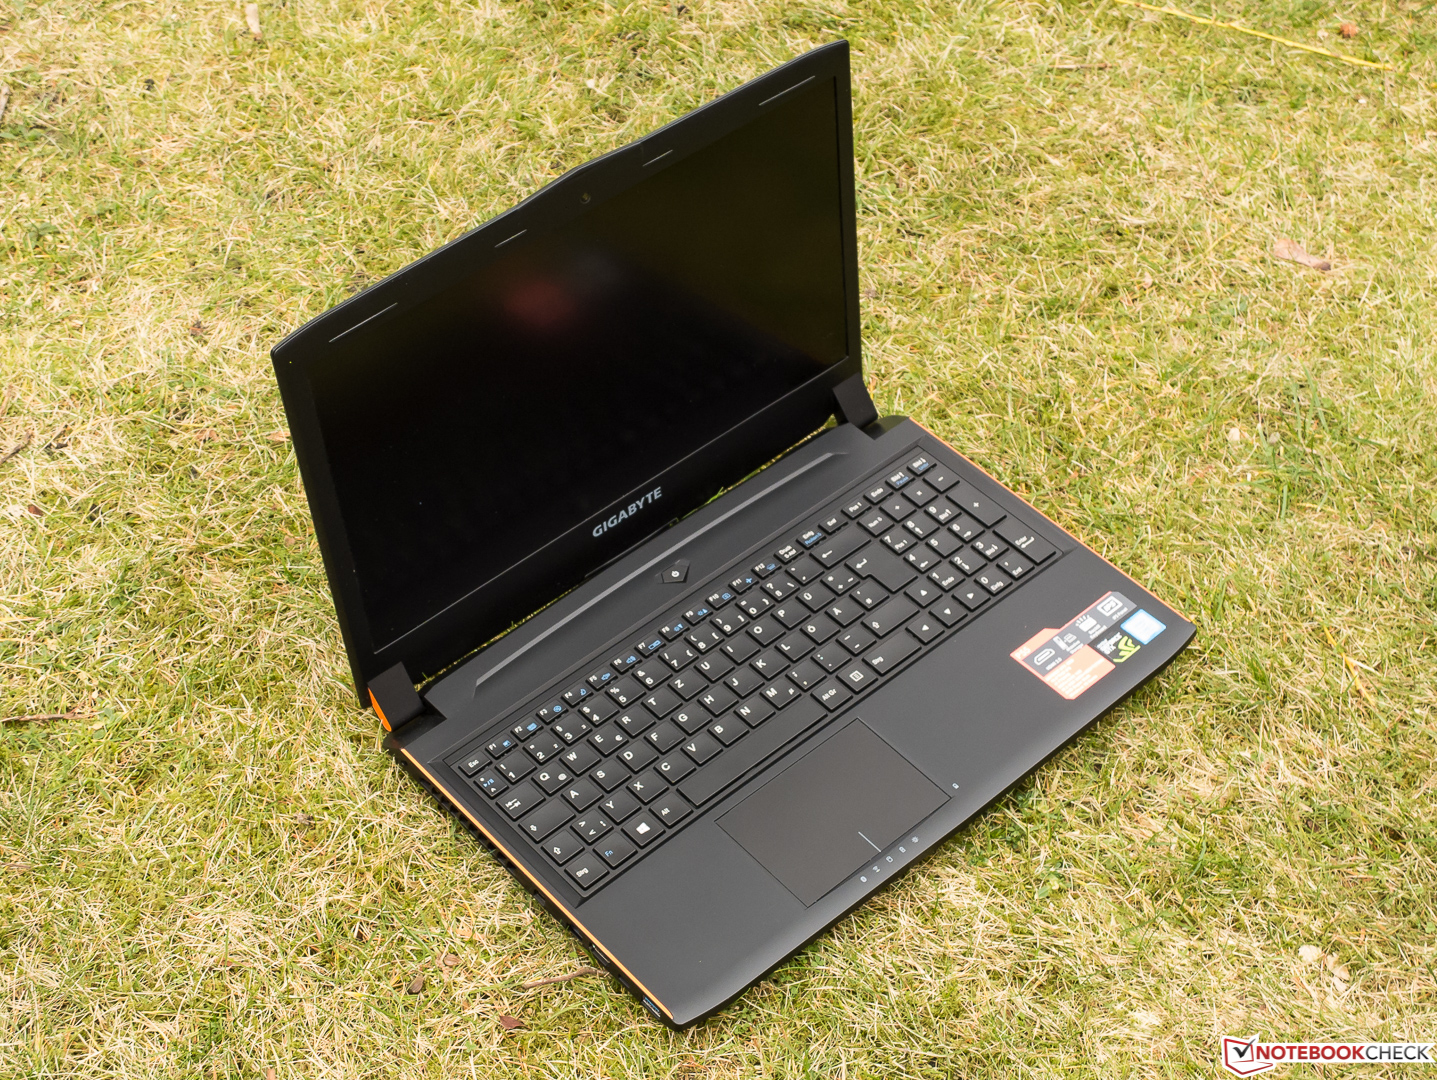
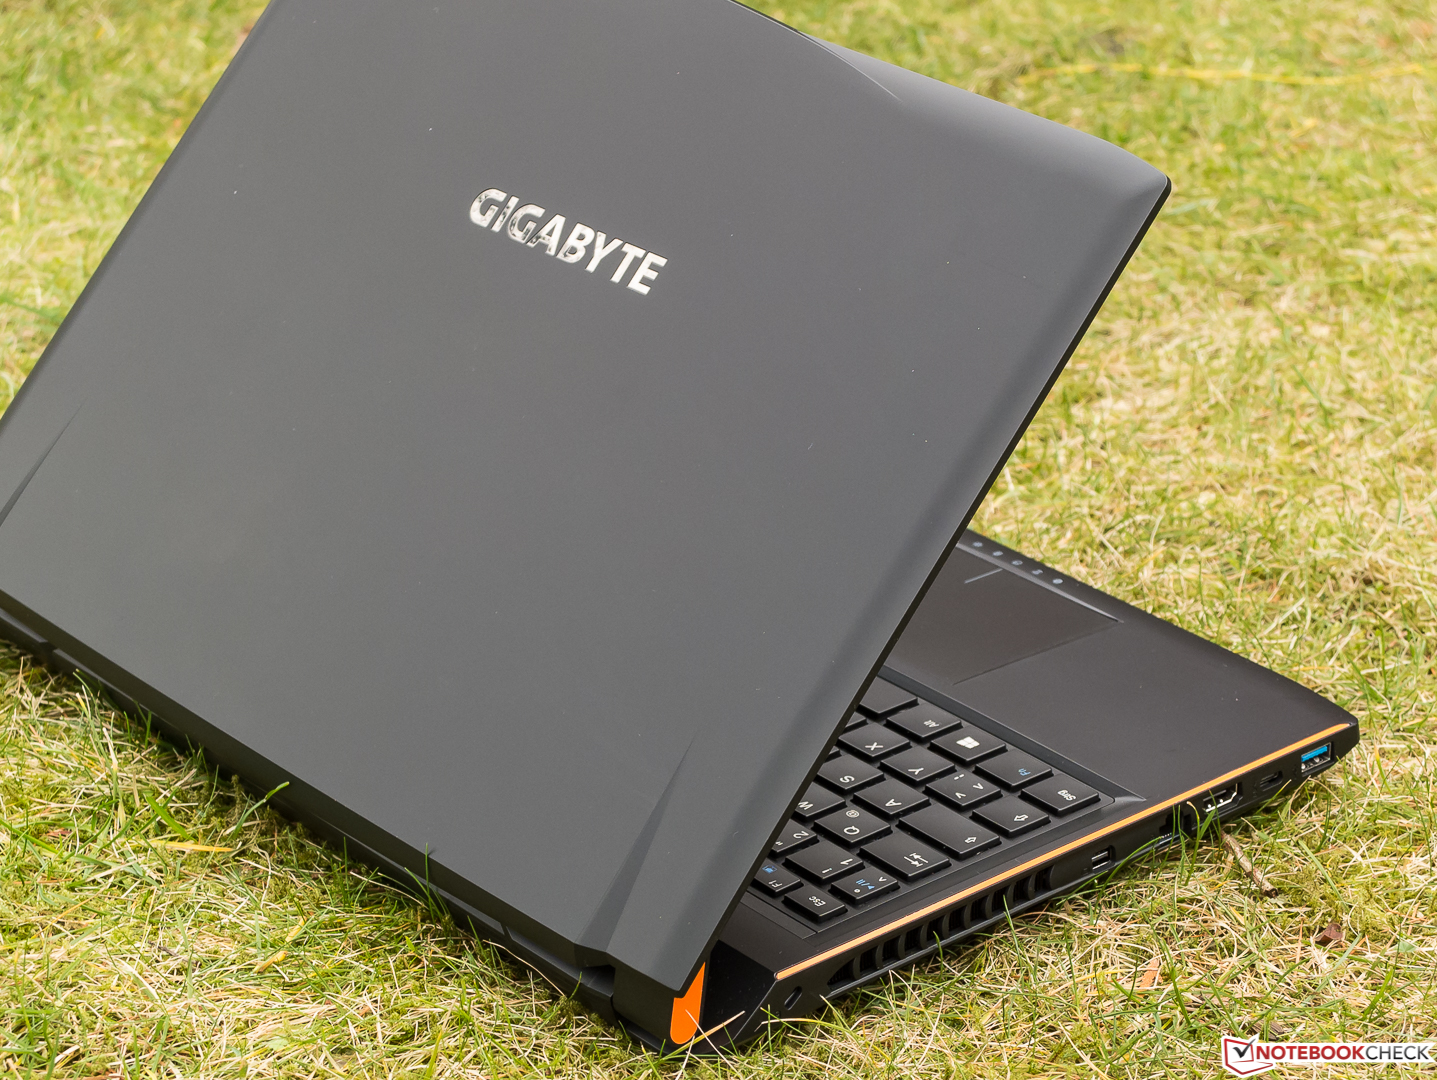
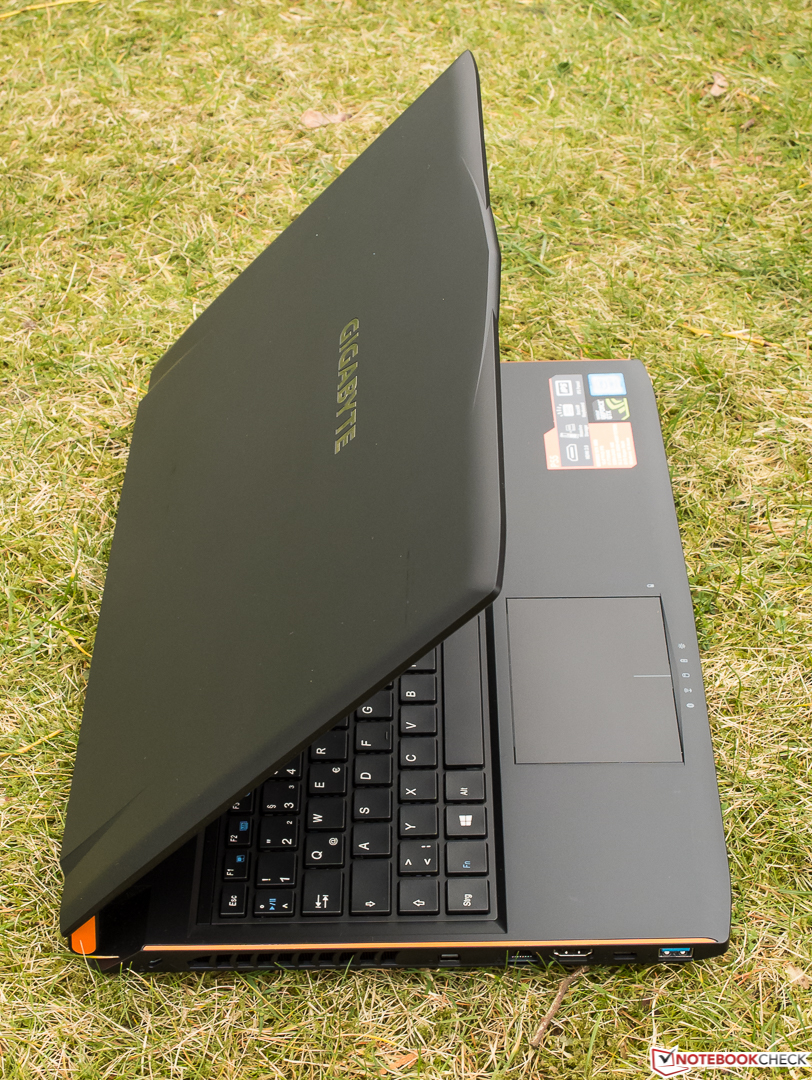
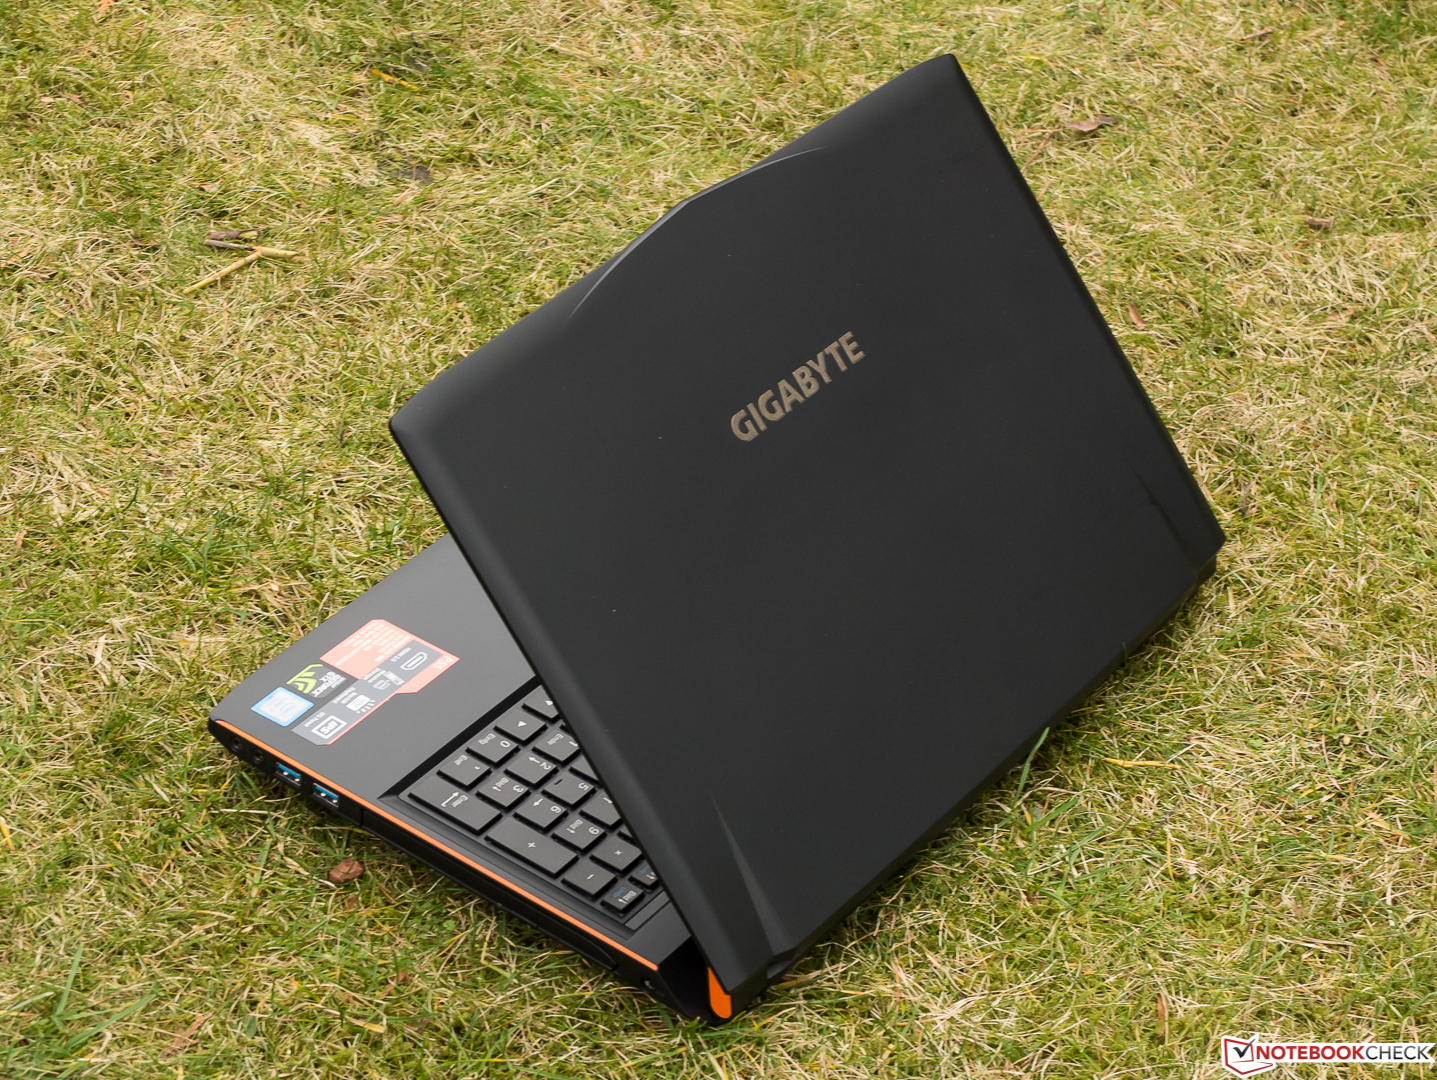
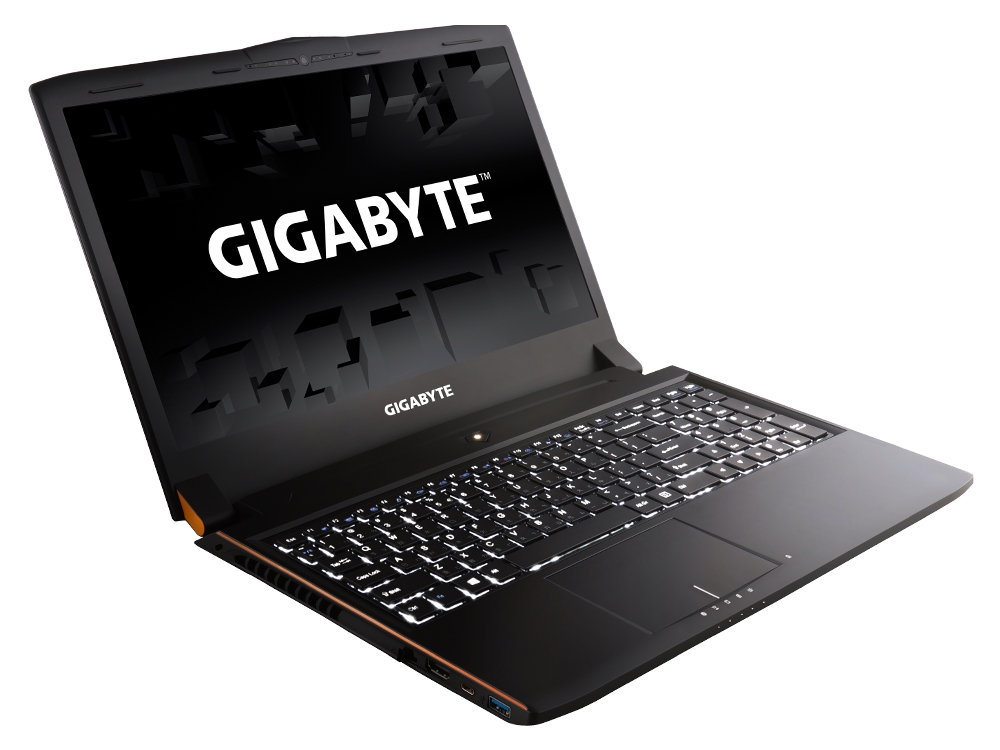
Breve análisis del portátil Gigabyte P55W v7

| SD Card Reader | |
| average JPG Copy Test (av. of 3 runs) | |
| Schenker XMG P507 | |
| Gigabyte P55W v7 | |
| Asus Strix GL502VM-FY039T | |
| Gigabyte P55W v6 | |
| MSI GE62VR 6RF-001US | |
| maximum AS SSD Seq Read Test (1GB) | |
| Gigabyte P55W v7 | |
| Gigabyte P55W v6 | |
| Schenker XMG P507 | |
| Asus Strix GL502VM-FY039T | |
| MSI GE62VR 6RF-001US | |
| Networking | |
| iperf3 transmit AX12 | |
| Asus Strix GL502VM-FY039T | |
| Gigabyte P55W v6 | |
| Gigabyte P55W v7 | |
| iperf3 receive AX12 | |
| Asus Strix GL502VM-FY039T | |
| Gigabyte P55W v7 | |
| Gigabyte P55W v6 | |
| |||||||||||||||||||||||||
iluminación: 87 %
Brillo con batería: 287 cd/m²
Contraste: 990:1 (Negro: 0.29 cd/m²)
ΔE ColorChecker Calman: 4.92 | ∀{0.5-29.43 Ø4.71}
ΔE Greyscale Calman: 3.66 | ∀{0.09-98 Ø4.96}
82% sRGB (Argyll 1.6.3 3D)
54% AdobeRGB 1998 (Argyll 1.6.3 3D)
59.9% AdobeRGB 1998 (Argyll 3D)
82% sRGB (Argyll 3D)
63.5% Display P3 (Argyll 3D)
Gamma: 2.32
CCT: 6482 K
| Gigabyte P55W v7 LG Philips LP156WF6 (LGD046F), 1920x1080, 15.6" | Asus Strix GL502VM-FY039T LG Philips LP156WF6-SPB6 (LGD046F), 1920x1080, 15.6" | MSI GE62VR 6RF-001US 1920x1080, 15.6" | Schenker XMG P507 LG Philips LP156WF6 (LGD046F), 1920x1080, 15.6" | Gigabyte P55W v6 LG Philips LP156WF4 (LGD040E), 1920x1080, 15.6" | |
|---|---|---|---|---|---|
| Display | 2% | 3% | 2% | -1% | |
| Display P3 Coverage (%) | 63.5 | 64.5 2% | 65.6 3% | 64.5 2% | 63.2 0% |
| sRGB Coverage (%) | 82 | 83.4 2% | 84.3 3% | 83.4 2% | 80.6 -2% |
| AdobeRGB 1998 Coverage (%) | 59.9 | 60.9 2% | 61.7 3% | 61 2% | 59 -2% |
| Response Times | -4% | -3% | 6% | -38% | |
| Response Time Grey 50% / Grey 80% * (ms) | 37 ? | 40 ? -8% | 36.8 ? 1% | 36 ? 3% | 56 ? -51% |
| Response Time Black / White * (ms) | 25 ? | 25 ? -0% | 26.4 ? -6% | 23 ? 8% | 31 ? -24% |
| PWM Frequency (Hz) | |||||
| Screen | 3% | 16% | -1% | -6% | |
| Brightness middle (cd/m²) | 287 | 321 12% | 302 5% | 288 0% | 280 -2% |
| Brightness (cd/m²) | 289 | 296 2% | 303 5% | 292 1% | 294 2% |
| Brightness Distribution (%) | 87 | 88 1% | 87 0% | 87 0% | 82 -6% |
| Black Level * (cd/m²) | 0.29 | 0.33 -14% | 0.169 42% | 0.3 -3% | 0.46 -59% |
| Contrast (:1) | 990 | 973 -2% | 1787 81% | 960 -3% | 609 -38% |
| Colorchecker dE 2000 * | 4.92 | 4.42 10% | 4.61 6% | 5.1 -4% | 4.48 9% |
| Colorchecker dE 2000 max. * | 11 | 9.78 11% | 9.98 9% | 9.44 14% | 10.16 8% |
| Greyscale dE 2000 * | 3.66 | 3.34 9% | 3.32 9% | 4.43 -21% | 2.69 27% |
| Gamma | 2.32 95% | 2.4 92% | 2.24 98% | 2.46 89% | 2.37 93% |
| CCT | 6482 100% | 6213 105% | 6358 102% | 6687 97% | 6455 101% |
| Color Space (Percent of AdobeRGB 1998) (%) | 54 | 55 2% | 55.4 3% | 55 2% | 53 -2% |
| Color Space (Percent of sRGB) (%) | 82 | 83 1% | 84.4 3% | 83 1% | 80 -2% |
| Media total (Programa/Opciones) | 0% /
2% | 5% /
11% | 2% /
0% | -15% /
-9% |
* ... más pequeño es mejor
Tiempos de respuesta del display
| ↔ Tiempo de respuesta de Negro a Blanco | ||
|---|---|---|
| 25 ms ... subida ↗ y bajada ↘ combinada | ↗ 5 ms subida | 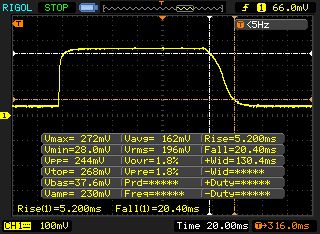 |
| ↘ 20 ms bajada | ||
| La pantalla mostró tiempos de respuesta relativamente lentos en nuestros tests pero podría ser demasiado lenta para los jugones. En comparación, todos los dispositivos de prueba van de ##min### (mínimo) a 240 (máximo) ms. » 59 % de todos los dispositivos son mejores. Eso quiere decir que el tiempo de respuesta es peor que la media (19.8 ms) de todos los dispositivos testados. | ||
| ↔ Tiempo de respuesta 50% Gris a 80% Gris | ||
| 37 ms ... subida ↗ y bajada ↘ combinada | ↗ 15 ms subida | 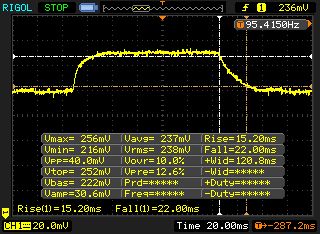 |
| ↘ 22 ms bajada | ||
| La pantalla mostró tiempos de respuesta lentos en nuestros tests y podría ser demasiado lenta para los jugones. En comparación, todos los dispositivos de prueba van de ##min### (mínimo) a 636 (máximo) ms. » 53 % de todos los dispositivos son mejores. Eso quiere decir que el tiempo de respuesta es peor que la media (30.9 ms) de todos los dispositivos testados. | ||
Parpadeo de Pantalla / PWM (Pulse-Width Modulation)
| Parpadeo de Pantalla / PWM no detectado | 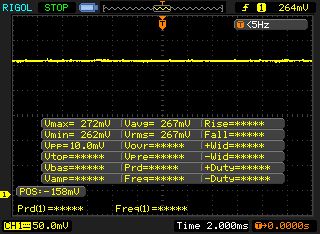 | ||
Comparación: 52 % de todos los dispositivos testados no usaron PWM para atenuar el display. Si se usó, medimos una media de 7741 (mínimo: 5 - máxmo: 343500) Hz. | |||
| PCMark 8 | |
| Home Score Accelerated v2 | |
| Asus Strix GL502VM-FY039T | |
| MSI GE62VR 6RF-001US | |
| Gigabyte P55W v6 | |
| Gigabyte P55W v7 | |
| Work Score Accelerated v2 | |
| Gigabyte P55W v7 | |
| Asus Strix GL502VM-FY039T | |
| MSI GE62VR 6RF-001US | |
| Gigabyte P55W v6 | |
| PCMark 8 Home Score Accelerated v2 | 4013 puntos | |
| PCMark 8 Work Score Accelerated v2 | 5317 puntos | |
ayuda | ||
| Gigabyte P55W v7 Liteonit CV3-8D256 | Asus Strix GL502VM-FY039T Micron SSD 1100 (MTFDDAV256TBN) | MSI GE62VR 6RF-001US Samsung SM951 MZVPV512HDGL m.2 PCI-e | Schenker XMG P507 Samsung SM951 MZVPV256HDGL m.2 PCI-e | Gigabyte P55W v6 Transcend MTS800 128GB M.2 (TS128GMTS800) | |
|---|---|---|---|---|---|
| CrystalDiskMark 3.0 | 28% | 249% | 227% | -6% | |
| Read Seq (MB/s) | 466.2 | 462.5 -1% | 1696 264% | 1857 298% | 511 10% |
| Write Seq (MB/s) | 261.9 | 462.7 77% | 1584 505% | 1240 373% | 161.1 -38% |
| Read 512 (MB/s) | 252.5 | 335 33% | 1044 313% | 971 285% | 338 34% |
| Write 512 (MB/s) | 254.8 | 407.1 60% | 1562 513% | 1239 386% | 160.8 -37% |
| Read 4k (MB/s) | 25.4 | 25.61 1% | 50.8 100% | 54.1 113% | 26.2 3% |
| Write 4k (MB/s) | 55 | 86.3 57% | 139.2 153% | 167.4 204% | 76.7 39% |
| Read 4k QD32 (MB/s) | 358.5 | 246.7 -31% | 591 65% | 695 94% | 264.7 -26% |
| Write 4k QD32 (MB/s) | 240.1 | 301.5 26% | 422.8 76% | 386.8 61% | 160.3 -33% |

| 3DMark - 1920x1080 Fire Strike Graphics | |
| MSI GE62VR 6RF-001US | |
| Asus Strix GL502VM-FY039T | |
| Gigabyte P55W v7 | |
| Gigabyte P55W v6 | |
| Schenker XMG P507 | |
| 3DMark 11 - 1280x720 Performance GPU | |
| MSI GE62VR 6RF-001US | |
| Asus Strix GL502VM-FY039T | |
| Gigabyte P55W v6 | |
| Gigabyte P55W v7 | |
| Schenker XMG P507 | |
| 3DMark 11 Performance | 11778 puntos | |
| 3DMark Cloud Gate Standard Score | 21839 puntos | |
| 3DMark Fire Strike Score | 9669 puntos | |
ayuda | ||
| bajo | medio | alto | ultra | |
|---|---|---|---|---|
| The Witcher 3 (2015) | 70.4 | 38.4 | ||
| Rise of the Tomb Raider (2016) | 72.6 | 61.8 | ||
| Battlefield 1 (2016) | 77.6 | 73.6 | ||
| Dishonored 2 (2016) | 80.2 | 60.2 | 46.5 | |
| Resident Evil 7 (2017) | 98.5 | 83 |
Ruido
| Ocioso |
| 33 / 34 / 35 dB(A) |
| HDD |
| 34 dB(A) |
| DVD |
| 37 / dB(A) |
| Carga |
| 39 / 50 dB(A) |
 | ||
30 dB silencioso 40 dB(A) audible 50 dB(A) ruidosamente alto |
||
min: | ||
(-) La temperatura máxima en la parte superior es de 49.6 °C / 121 F, frente a la media de 40.4 °C / 105 F, que oscila entre 21.2 y 68.8 °C para la clase Gaming.
(-) El fondo se calienta hasta un máximo de 47.7 °C / 118 F, frente a la media de 43.2 °C / 110 F
(+) En reposo, la temperatura media de la parte superior es de 22.8 °C / 73# F, frente a la media del dispositivo de 33.9 °C / 93 F.
(-) El reposamanos y el touchpad pueden calentarse mucho al tacto con un máximo de 45.1 °C / 113.2 F.
(-) La temperatura media de la zona del reposamanos de dispositivos similares fue de 28.8 °C / 83.8 F (-16.3 °C / -29.4 F).
Gigabyte P55W v7 análisis de audio
(±) | la sonoridad del altavoz es media pero buena (79 dB)
Graves 100 - 315 Hz
(-) | casi sin bajos - de media 15.9% inferior a la mediana
(±) | la linealidad de los graves es media (11.3% delta a frecuencia anterior)
Medios 400 - 2000 Hz
(+) | medios equilibrados - a sólo 4.7% de la mediana
(±) | la linealidad de los medios es media (8.8% delta respecto a la frecuencia anterior)
Altos 2 - 16 kHz
(+) | máximos equilibrados - a sólo 3.6% de la mediana
(±) | la linealidad de los máximos es media (10.1% delta a frecuencia anterior)
Total 100 - 16.000 Hz
(±) | la linealidad del sonido global es media (18.8% de diferencia con la mediana)
En comparación con la misma clase
» 62% de todos los dispositivos probados de esta clase eran mejores, 8% similares, 30% peores
» El mejor tuvo un delta de 6%, la media fue 18%, el peor fue ###max##%
En comparación con todos los dispositivos probados
» 44% de todos los dispositivos probados eran mejores, 8% similares, 49% peores
» El mejor tuvo un delta de 4%, la media fue 23%, el peor fue ###max##%
Asus Strix GL502VM-FY039T análisis de audio
(±) | la sonoridad del altavoz es media pero buena (76 dB)
Graves 100 - 315 Hz
(-) | casi sin bajos - de media 19.1% inferior a la mediana
(-) | los graves no son lineales (18.1% delta a la frecuencia anterior)
Medios 400 - 2000 Hz
(+) | medios equilibrados - a sólo 2.9% de la mediana
(+) | los medios son lineales (4% delta a la frecuencia anterior)
Altos 2 - 16 kHz
(±) | máximos más altos - de media 5.6% más altos que la mediana
(±) | la linealidad de los máximos es media (8% delta a frecuencia anterior)
Total 100 - 16.000 Hz
(±) | la linealidad del sonido global es media (23% de diferencia con la mediana)
En comparación con la misma clase
» 83% de todos los dispositivos probados de esta clase eran mejores, 5% similares, 12% peores
» El mejor tuvo un delta de 6%, la media fue 18%, el peor fue ###max##%
En comparación con todos los dispositivos probados
» 69% de todos los dispositivos probados eran mejores, 5% similares, 26% peores
» El mejor tuvo un delta de 4%, la media fue 23%, el peor fue ###max##%
MSI GE62VR 6RF-001US análisis de audio
(±) | la sonoridad del altavoz es media pero buena (76.9 dB)
Graves 100 - 315 Hz
(±) | lubina reducida - en promedio 13.1% inferior a la mediana
(±) | la linealidad de los graves es media (12% delta a frecuencia anterior)
Medios 400 - 2000 Hz
(+) | medios equilibrados - a sólo 3% de la mediana
(±) | la linealidad de los medios es media (12% delta respecto a la frecuencia anterior)
Altos 2 - 16 kHz
(+) | máximos equilibrados - a sólo 4.4% de la mediana
(±) | la linealidad de los máximos es media (10.1% delta a frecuencia anterior)
Total 100 - 16.000 Hz
(±) | la linealidad del sonido global es media (18.6% de diferencia con la mediana)
En comparación con la misma clase
» 61% de todos los dispositivos probados de esta clase eran mejores, 9% similares, 31% peores
» El mejor tuvo un delta de 6%, la media fue 18%, el peor fue ###max##%
En comparación con todos los dispositivos probados
» 42% de todos los dispositivos probados eran mejores, 8% similares, 50% peores
» El mejor tuvo un delta de 4%, la media fue 23%, el peor fue ###max##%
Schenker XMG P507 análisis de audio
(±) | la sonoridad del altavoz es media pero buena (75 dB)
Graves 100 - 315 Hz
(-) | casi sin bajos - de media 20.7% inferior a la mediana
(±) | la linealidad de los graves es media (8.8% delta a frecuencia anterior)
Medios 400 - 2000 Hz
(+) | medios equilibrados - a sólo 2.2% de la mediana
(±) | la linealidad de los medios es media (7.6% delta respecto a la frecuencia anterior)
Altos 2 - 16 kHz
(+) | máximos equilibrados - a sólo 2.3% de la mediana
(+) | los máximos son lineales (5.3% delta a la frecuencia anterior)
Total 100 - 16.000 Hz
(±) | la linealidad del sonido global es media (19% de diferencia con la mediana)
En comparación con la misma clase
» 64% de todos los dispositivos probados de esta clase eran mejores, 8% similares, 28% peores
» El mejor tuvo un delta de 6%, la media fue 18%, el peor fue ###max##%
En comparación con todos los dispositivos probados
» 45% de todos los dispositivos probados eran mejores, 7% similares, 47% peores
» El mejor tuvo un delta de 4%, la media fue 23%, el peor fue ###max##%
| Off / Standby | |
| Ocioso | |
| Carga |
|
Clave:
min: | |
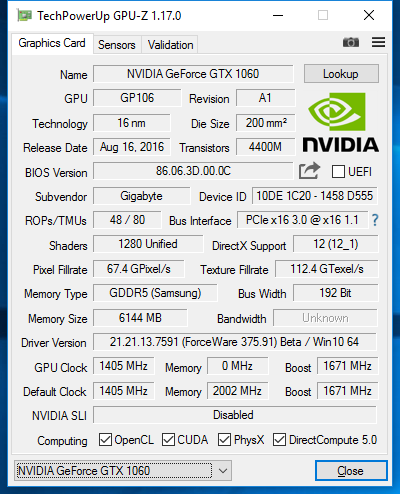
| Gigabyte P55W v7 i7-7700HQ, GeForce GTX 1060 Mobile | Asus Strix GL502VM-FY039T 6700HQ, GeForce GTX 1060 Mobile | MSI GE62VR 6RF-001US 6700HQ, GeForce GTX 1060 Mobile | Schenker XMG P507 6700HQ, GeForce GTX 1060 Mobile | Gigabyte P55W v6 6700HQ, GeForce GTX 1060 Mobile | |
|---|---|---|---|---|---|
| Power Consumption | -35% | -97% | -21% | -0% | |
| Idle Minimum * (Watt) | 8 | 16 -100% | 25.4 -218% | 11 -38% | 8 -0% |
| Idle Average * (Watt) | 13 | 19 -46% | 30.3 -133% | 16 -23% | 13 -0% |
| Idle Maximum * (Watt) | 18 | 23 -28% | 31.5 -75% | 21 -17% | 17 6% |
| Load Average * (Watt) | 76 | 68 11% | 111.8 -47% | 80 -5% | 71 7% |
| Load Maximum * (Watt) | 143 | 157 -10% | 163.2 -14% | 174 -22% | 165 -15% |
* ... más pequeño es mejor
| Gigabyte P55W v7 i7-7700HQ, GeForce GTX 1060 Mobile, 63 Wh | Asus Strix GL502VM-FY039T 6700HQ, GeForce GTX 1060 Mobile, 64 Wh | MSI GE62VR 6RF-001US 6700HQ, GeForce GTX 1060 Mobile, 51 Wh | Schenker XMG P507 6700HQ, GeForce GTX 1060 Mobile, 60 Wh | Gigabyte P55W v6 6700HQ, GeForce GTX 1060 Mobile, 63 Wh | |
|---|---|---|---|---|---|
| Duración de Batería | -34% | -72% | -13% | -7% | |
| Reader / Idle (h) | 13.2 | 5.3 -60% | 2.3 -83% | 6.8 -48% | 10.2 -23% |
| WiFi v1.3 (h) | 5.8 | 3.7 -36% | 1.7 -71% | 4.6 -21% | 5.9 2% |
| Load (h) | 1.6 | 1.5 -6% | 0.6 -63% | 2.1 31% | 1.6 0% |
| H.264 (h) | 3.9 | 5.6 |
Pro
Contra
Gigabyte ha recortado en los lugares adecuados y nos ofrece un portátil para juegos más que aceptable. La carencia de algunas características como el puerto Thunderbolt 3 o G-Sync hace posible ahorrar unos pocos cientos de Euros sin comprometer el rendimiento.
Considerando el bajo precio, nos han gustado los dispositivos de entrada y, con algunas puntualizaciones, el panel IPS. Ocurre lo mismo con la sólida carcasa de plástico con su base fácilmente extraíble. La situación de los puertos, la lenta respuesta de la pantalla y el SSD no son puntos tan favorables. Los ruidos que se escuchan cuando el sistema está bajo carga intensa son el punto débil del P55W v7. Sin embargo, no es algo realmente importante, por tanto el portátil obtiene una clara recomendación de compra.
Ésta es una versión acortada del análisis original. Puedes leer el análisis completo en inglés aquí.
Gigabyte P55W v7
- 02/28/2017 v6 (old)
Sven Kloevekorn