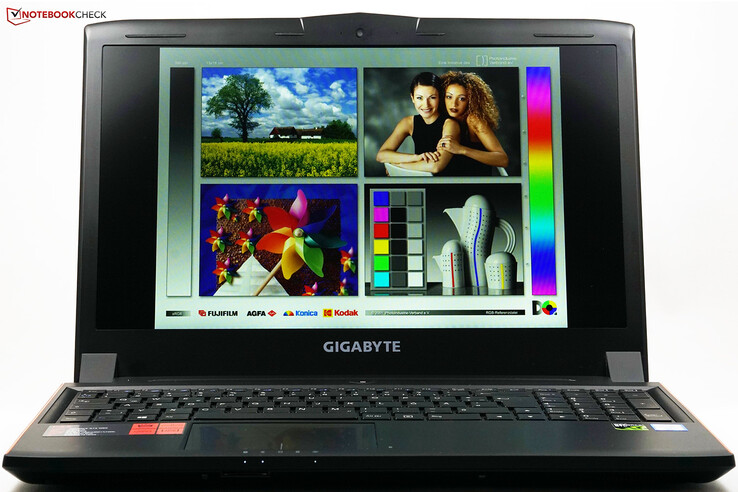
Breve análisis del portátil Gigabyte P55W v6
Top 10 Análisis
» Top 10 Portátiles Multimedia
» Top 10 Portátiles de Juego
» Top 10 Portátiles de Juego ligeros
» Top 10 Portátiles Asequibles de Oficina/Empresa
» Top 10 Portátiles de Juego Ligeros
» Top 10 Portátiles de Oficina/Empresa Premium
» Top 10 Estaciones de Trabajo
» Top 10 Subportátiles
» Top 10 Ultrabooks
» Top 10 Convertibles
» Top 10 Tablets
» Top 10 Tablets Windows
» Top 10 Tablets de menos de 250 Euros
» Top 10 Phablets (>5.5")
» Top 10 Smartphones
» Top 10 Smartphones (≤5")
» Top 10 Smartphones de menos de 300 Euros
» Top 10 Smartphones de menos de 120 Euros
» Top 10 Portátiles de menos de 1000 Euros
» Top 10 Portátiles de menos de 500 Euros
» Top 10 Portátiles de menos de 300 Euros
» Los Mejores Displays de Portátiles Analizados por Notebookcheck
| SD Card Reader | |
| average JPG Copy Test (av. of 3 runs) | |
| Acer Predator 15 G9-593-765Q | |
| Asus Strix GL502VM-FY039T | |
| Gigabyte P55W v6 | |
| Gigabyte P55W v5 | |
| MSI GS63VR-6RF16H22 Stealth Pro | |
| maximum AS SSD Seq Read Test (1GB) | |
| Acer Predator 15 G9-593-765Q | |
| Gigabyte P55W v6 | |
| Asus Strix GL502VM-FY039T | |
| Gigabyte P55W v5 | |
| MSI GS63VR-6RF16H22 Stealth Pro | |
| Networking | |
| iperf3 transmit AX12 | |
| Acer Predator 15 G9-593-765Q | |
| Asus Strix GL502VM-FY039T | |
| Gigabyte P55W v6 | |
| iperf3 receive AX12 | |
| Asus Strix GL502VM-FY039T | |
| Acer Predator 15 G9-593-765Q | |
| Gigabyte P55W v6 | |
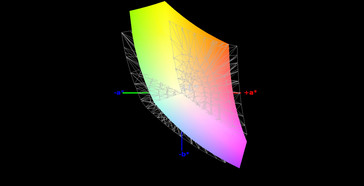
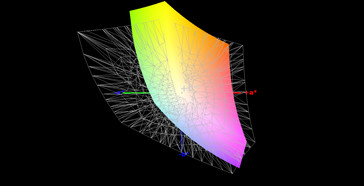
| |||||||||||||||||||||||||
iluminación: 82 %
Brillo con batería: 280 cd/m²
Contraste: 609:1 (Negro: 0.46 cd/m²)
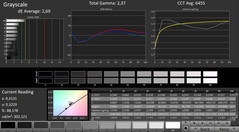
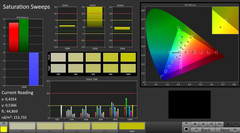
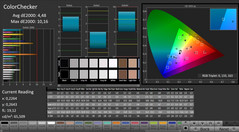
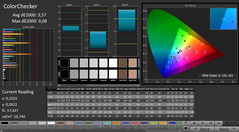
ΔE ColorChecker Calman: 4.48 | ∀{0.5-29.43 Ø4.76}
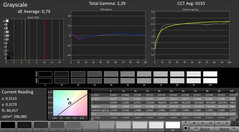
ΔE Greyscale Calman: 2.69 | ∀{0.09-98 Ø5}
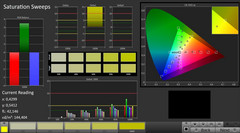
80% sRGB (Argyll 1.6.3 3D)
53% AdobeRGB 1998 (Argyll 1.6.3 3D)
59% AdobeRGB 1998 (Argyll 3D)
80.6% sRGB (Argyll 3D)
63.2% Display P3 (Argyll 3D)
Gamma: 2.37
CCT: 6455 K
| Gigabyte P55W v6 LG Philips LP156WF4 (LGD040E), 1920x1080 | Gigabyte P55W v5 LG Philips LP156WF4-SPH1, 1920x1080 | Asus Strix GL502VM-FY039T LG Philips LP156WF6-SPB6 (LGD046F), 1920x1080 | MSI GS63VR-6RF16H22 Stealth Pro Samsung 156HL01-104 (SDC324C) , 1920x1080 | Acer Predator 15 G9-593-765Q LG Philips LP156WF6-SPP1 (LGD04D5), 1920x1080 | |
|---|---|---|---|---|---|
| Display | -14% | 3% | 15% | 3% | |
| Display P3 Coverage (%) | 63.2 | 50.1 -21% | 64.5 2% | 67.8 7% | 63.6 1% |
| sRGB Coverage (%) | 80.6 | 73.5 -9% | 83.4 3% | 97.4 21% | 83.9 4% |
| AdobeRGB 1998 Coverage (%) | 59 | 51.2 -13% | 60.9 3% | 69.7 18% | 61.3 4% |
| Response Times | 17% | 24% | 16% | 28% | |
| Response Time Grey 50% / Grey 80% * (ms) | 56 ? | 44 ? 21% | 40 ? 29% | 35 ? 37% | |
| Response Time Black / White * (ms) | 31 ? | 27 ? 13% | 25 ? 19% | 26 ? 16% | 25 ? 19% |
| PWM Frequency (Hz) | 202 ? | ||||
| Screen | 6% | 10% | 14% | 13% | |
| Brightness middle (cd/m²) | 280 | 254 -9% | 321 15% | 293 5% | 273 -2% |
| Brightness (cd/m²) | 294 | 267 -9% | 296 1% | 279 -5% | 267 -9% |
| Brightness Distribution (%) | 82 | 89 9% | 88 7% | 84 2% | 83 1% |
| Black Level * (cd/m²) | 0.46 | 0.28 39% | 0.33 28% | 0.33 28% | 0.27 41% |
| Contrast (:1) | 609 | 907 49% | 973 60% | 888 46% | 1011 66% |
| Colorchecker dE 2000 * | 4.48 | 4.28 4% | 4.42 1% | 3.59 20% | 3.77 16% |
| Colorchecker dE 2000 max. * | 10.16 | 10.6 -4% | 9.78 4% | 5.79 43% | 10.64 -5% |
| Greyscale dE 2000 * | 2.69 | 2.77 -3% | 3.34 -24% | 3.86 -43% | 2.48 8% |
| Gamma | 2.37 93% | 2.28 96% | 2.4 92% | 2.53 87% | 2.37 93% |
| CCT | 6455 101% | 6284 103% | 6213 105% | 7229 90% | 6854 95% |
| Color Space (Percent of AdobeRGB 1998) (%) | 53 | 47 -11% | 55 4% | 63 19% | 55 4% |
| Color Space (Percent of sRGB) (%) | 80 | 73 -9% | 83 4% | 97 21% | 84 5% |
| Media total (Programa/Opciones) | 3% /
3% | 12% /
10% | 15% /
14% | 15% /
13% |
* ... más pequeño es mejor
Tiempos de respuesta del display
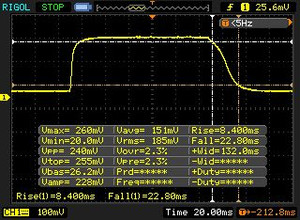
| ↔ Tiempo de respuesta de Negro a Blanco | ||
|---|---|---|
| 31 ms ... subida ↗ y bajada ↘ combinada | ↗ 8 ms subida | |
| ↘ 23 ms bajada | ||
| La pantalla mostró tiempos de respuesta lentos en nuestros tests y podría ser demasiado lenta para los jugones. En comparación, todos los dispositivos de prueba van de ##min### (mínimo) a 240 (máximo) ms. » 83 % de todos los dispositivos son mejores. Eso quiere decir que el tiempo de respuesta es peor que la media (20.1 ms) de todos los dispositivos testados. | ||
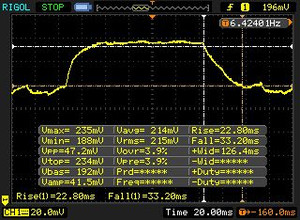
| ↔ Tiempo de respuesta 50% Gris a 80% Gris | ||
| 56 ms ... subida ↗ y bajada ↘ combinada | ↗ 23 ms subida | |
| ↘ 33 ms bajada | ||
| La pantalla mostró tiempos de respuesta lentos en nuestros tests y podría ser demasiado lenta para los jugones. En comparación, todos los dispositivos de prueba van de ##min### (mínimo) a 636 (máximo) ms. » 92 % de todos los dispositivos son mejores. Eso quiere decir que el tiempo de respuesta es peor que la media (31.5 ms) de todos los dispositivos testados. | ||
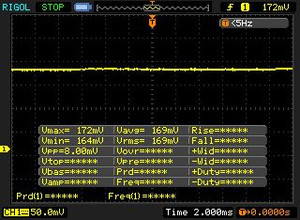
Parpadeo de Pantalla / PWM (Pulse-Width Modulation)
| Parpadeo de Pantalla / PWM no detectado | |||
Comparación: 53 % de todos los dispositivos testados no usaron PWM para atenuar el display. Si se usó, medimos una media de 8023 (mínimo: 5 - máxmo: 343500) Hz. | |||
| PCMark 7 Score | 5715 puntos | |
| PCMark 8 Home Score Accelerated v2 | 4014 puntos | |
| PCMark 8 Creative Score Accelerated v2 | 4897 puntos | |
| PCMark 8 Work Score Accelerated v2 | 4784 puntos | |
ayuda | ||
| Gigabyte P55W v6 Transcend MTS800 128GB M.2 (TS128GMTS800) | Gigabyte P55W v5 Samsung SM951 MZVPV128 NVMe | Asus Strix GL502VM-FY039T Micron SSD 1100 (MTFDDAV256TBN) | MSI GS63VR-6RF16H22 Stealth Pro Samsung SM951 MZVPV256HDGL m.2 PCI-e | Acer Aspire VX5-591G-D0DD SK Hynix Canvas SC300 512GB M.2 (HFS512G39MND) | Acer Predator 15 G9-593-765Q LiteOn CV1-8B512 | |
|---|---|---|---|---|---|---|
| CrystalDiskMark 3.0 | 166% | 53% | 298% | 50% | 55% | |
| Read Seq (MB/s) | 511 | 1356 165% | 462.5 -9% | 1973 286% | 494.2 -3% | 517 1% |
| Write Seq (MB/s) | 161.1 | 657 308% | 462.7 187% | 1292 702% | 449.6 179% | 449.7 179% |
| Read 512 (MB/s) | 338 | 1044 209% | 335 -1% | 1279 278% | 348.1 3% | 355.3 5% |
| Write 512 (MB/s) | 160.8 | 642 299% | 407.1 153% | 1288 701% | 418.2 160% | 433.7 170% |
| Read 4k (MB/s) | 26.2 | 50.8 94% | 25.61 -2% | 52.3 100% | 16.97 -35% | 27.69 6% |
| Write 4k (MB/s) | 76.7 | 142.7 86% | 86.3 13% | 153.2 100% | 38.36 -50% | 72.9 -5% |
| Read 4k QD32 (MB/s) | 264.7 | 588 122% | 246.7 -7% | 464.4 75% | 394.9 49% | 290.9 10% |
| Write 4k QD32 (MB/s) | 160.3 | 236.3 47% | 301.5 88% | 384.4 140% | 317.4 98% | 273.8 71% |
| 3DMark | |
| 1280x720 Cloud Gate Standard Graphics | |
| Acer Predator 15 G9-593-765Q | |
| Asus Strix GL502VM-FY039T | |
| Gigabyte P55W v6 | |
| MSI GS63VR-6RF16H22 Stealth Pro | |
| Acer Aspire VX5-591G-D0DD | |
| Gigabyte P55W v5 | |
| 1920x1080 Fire Strike Graphics | |
| Acer Predator 15 G9-593-765Q | |
| MSI GS63VR-6RF16H22 Stealth Pro | |
| Asus Strix GL502VM-FY039T | |
| Gigabyte P55W v6 | |
| Acer Aspire VX5-591G-D0DD | |
| Gigabyte P55W v5 | |
| 3DMark 11 - 1280x720 Performance GPU | |
| Acer Predator 15 G9-593-765Q | |
| Asus Strix GL502VM-FY039T | |
| MSI GS63VR-6RF16H22 Stealth Pro | |
| Gigabyte P55W v6 | |
| Gigabyte P55W v5 | |
| Acer Aspire VX5-591G-D0DD | |
| 3DMark 11 Performance | 12433 puntos | |
| 3DMark Cloud Gate Standard Score | 22706 puntos | |
| 3DMark Fire Strike Score | 9527 puntos | |
| 3DMark Fire Strike Extreme Score | 4963 puntos | |
ayuda | ||
| The Witcher 3 | |
| 1920x1080 Ultra Graphics & Postprocessing (HBAO+) | |
| Acer Predator 15 G9-593-765Q | |
| MSI GS63VR-6RF16H22 Stealth Pro | |
| Gigabyte P55W v6 | |
| Acer Aspire VX5-591G-D0DD | |
| 1920x1080 High Graphics & Postprocessing (Nvidia HairWorks Off) | |
| Acer Predator 15 G9-593-765Q | |
| MSI GS63VR-6RF16H22 Stealth Pro | |
| Gigabyte P55W v6 | |
| Acer Aspire VX5-591G-D0DD | |
| Deus Ex Mankind Divided | |
| 1920x1080 High Preset AF:4x | |
| Acer Predator 15 G9-593-765Q | |
| Gigabyte P55W v6 | |
| MSI GS63VR-6RF16H22 Stealth Pro | |
| 1920x1080 Ultra Preset AA:2xMS AF:8x | |
| Acer Predator 15 G9-593-765Q | |
| Gigabyte P55W v6 | |
| MSI GS63VR-6RF16H22 Stealth Pro | |
| BioShock Infinite - 1920x1080 Ultra Preset, DX11 (DDOF) | |
| Asus Strix GL502VM-FY039T | |
| MSI GS63VR-6RF16H22 Stealth Pro | |
| Gigabyte P55W v6 | |
| Gigabyte P55W v5 | |
| bajo | medio | alto | ultra | |
|---|---|---|---|---|
| BioShock Infinite (2013) | 189 | 176.2 | 151.7 | 99.7 |
| The Witcher 3 (2015) | 166.1 | 127.2 | 63.3 | 37.8 |
| Deus Ex Mankind Divided (2016) | 116.1 | 98.4 | 54.6 | 28 |
Ruido
| Ocioso |
| 35 / 36 / 37 dB(A) |
| HDD |
| 37 dB(A) |
| DVD |
| 39 / dB(A) |
| Carga |
| 41 / 52 dB(A) |
 | ||
30 dB silencioso 40 dB(A) audible 50 dB(A) ruidosamente alto |
||
min: | ||
| Gigabyte P55W v6 GeForce GTX 1060 Mobile, 6700HQ | Gigabyte P55W v5 GeForce GTX 970M, 6700HQ | Asus Strix GL502VM-FY039T GeForce GTX 1060 Mobile, 6700HQ | MSI GS63VR-6RF16H22 Stealth Pro GeForce GTX 1060 Mobile, 6700HQ | Acer Predator 15 G9-593-765Q GeForce GTX 1070 Mobile, 6700HQ | |
|---|---|---|---|---|---|
| Noise | 4% | 3% | 8% | 3% | |
| apagado / medio ambiente * (dB) | 31 | 31 -0% | 30 3% | 30 3% | |
| Idle Minimum * (dB) | 35 | 33 6% | 32 9% | 32 9% | 31 11% |
| Idle Average * (dB) | 36 | 34 6% | 33 8% | 33 8% | 35 3% |
| Idle Maximum * (dB) | 37 | 35 5% | 34 8% | 34 8% | 38 -3% |
| Load Average * (dB) | 41 | 43 -5% | 44 -7% | 37 10% | 43 -5% |
| Load Maximum * (dB) | 52 | 49 6% | 53 -2% | 46 12% | 49 6% |
* ... más pequeño es mejor
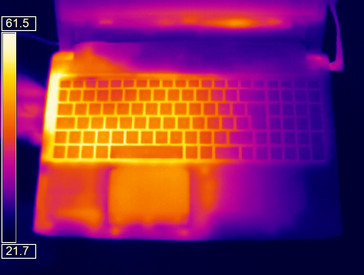
(-) La temperatura máxima en la parte superior es de 47.7 °C / 118 F, frente a la media de 40.4 °C / 105 F, que oscila entre 21.2 y 68.8 °C para la clase Gaming.
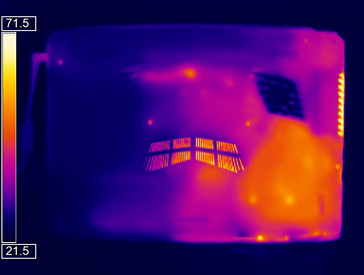
(-) El fondo se calienta hasta un máximo de 51.2 °C / 124 F, frente a la media de 43.3 °C / 110 F
(+) En reposo, la temperatura media de la parte superior es de 28 °C / 82# F, frente a la media del dispositivo de 33.9 °C / 93 F.
(-) El reposamanos y el touchpad pueden calentarse mucho al tacto con un máximo de 45.2 °C / 113.4 F.
(-) La temperatura media de la zona del reposamanos de dispositivos similares fue de 28.8 °C / 83.8 F (-16.4 °C / -29.6 F).
| Gigabyte P55W v6 GeForce GTX 1060 Mobile, 6700HQ | Gigabyte P55W v5 GeForce GTX 970M, 6700HQ | Asus Strix GL502VM-FY039T GeForce GTX 1060 Mobile, 6700HQ | MSI GS63VR-6RF16H22 Stealth Pro GeForce GTX 1060 Mobile, 6700HQ | Acer Predator 15 G9-593-765Q GeForce GTX 1070 Mobile, 6700HQ | |
|---|---|---|---|---|---|
| Heat | 5% | -17% | 5% | 18% | |
| Maximum Upper Side * (°C) | 47.7 | 50 -5% | 65.3 -37% | 45.3 5% | 40.5 15% |
| Maximum Bottom * (°C) | 51.2 | 57.7 -13% | 64.4 -26% | 62.6 -22% | 42 18% |
| Idle Upper Side * (°C) | 32.1 | 25.7 20% | 35.4 -10% | 25.3 21% | 28.2 12% |
| Idle Bottom * (°C) | 32.8 | 27.2 17% | 31.6 4% | 27.3 17% | 24.3 26% |
* ... más pequeño es mejor
Gigabyte P55W v6 análisis de audio
(+) | los altavoces pueden reproducir a un volumen relativamente alto (#83 dB)
Graves 100 - 315 Hz
(-) | casi sin bajos - de media 24.9% inferior a la mediana
(±) | la linealidad de los graves es media (8.7% delta a frecuencia anterior)
Medios 400 - 2000 Hz
(±) | medias más altas - de media 7% más altas que la mediana
(±) | la linealidad de los medios es media (8.9% delta respecto a la frecuencia anterior)
Altos 2 - 16 kHz
(±) | máximos más altos - de media 6% más altos que la mediana
(±) | la linealidad de los máximos es media (7.8% delta a frecuencia anterior)
Total 100 - 16.000 Hz
(±) | la linealidad del sonido global es media (25.2% de diferencia con la mediana)
En comparación con la misma clase
» 90% de todos los dispositivos probados de esta clase eran mejores, 3% similares, 7% peores
» El mejor tuvo un delta de 6%, la media fue 18%, el peor fue ###max##%
En comparación con todos los dispositivos probados
» 77% de todos los dispositivos probados eran mejores, 5% similares, 18% peores
» El mejor tuvo un delta de 4%, la media fue 24%, el peor fue ###max##%
Asus Strix GL502VM-FY039T análisis de audio
(±) | la sonoridad del altavoz es media pero buena (76 dB)
Graves 100 - 315 Hz
(-) | casi sin bajos - de media 19.1% inferior a la mediana
(-) | los graves no son lineales (18.1% delta a la frecuencia anterior)
Medios 400 - 2000 Hz
(+) | medios equilibrados - a sólo 2.9% de la mediana
(+) | los medios son lineales (4% delta a la frecuencia anterior)
Altos 2 - 16 kHz
(±) | máximos más altos - de media 5.6% más altos que la mediana
(±) | la linealidad de los máximos es media (8% delta a frecuencia anterior)
Total 100 - 16.000 Hz
(±) | la linealidad del sonido global es media (23% de diferencia con la mediana)
En comparación con la misma clase
» 83% de todos los dispositivos probados de esta clase eran mejores, 5% similares, 12% peores
» El mejor tuvo un delta de 6%, la media fue 18%, el peor fue ###max##%
En comparación con todos los dispositivos probados
» 68% de todos los dispositivos probados eran mejores, 6% similares, 26% peores
» El mejor tuvo un delta de 4%, la media fue 24%, el peor fue ###max##%
| Off / Standby | |
| Ocioso | |
| Carga |
|
Clave:
min: | |
| Gigabyte P55W v6 GeForce GTX 1060 Mobile, 6700HQ | Gigabyte P55W v5 GeForce GTX 970M, 6700HQ | Asus Strix GL502VM-FY039T GeForce GTX 1060 Mobile, 6700HQ | MSI GS63VR-6RF16H22 Stealth Pro GeForce GTX 1060 Mobile, 6700HQ | Acer Predator 15 G9-593-765Q GeForce GTX 1070 Mobile, 6700HQ | |
|---|---|---|---|---|---|
| Power Consumption | -4% | -34% | -56% | -65% | |
| Idle Minimum * (Watt) | 8 | 9 -13% | 16 -100% | 18 -125% | 18 -125% |
| Idle Average * (Watt) | 13 | 13 -0% | 19 -46% | 22 -69% | 24 -85% |
| Idle Maximum * (Watt) | 17 | 17 -0% | 23 -35% | 30 -76% | 29 -71% |
| Load Average * (Watt) | 71 | 81 -14% | 68 4% | 77 -8% | 86 -21% |
| Load Maximum * (Watt) | 165 | 152 8% | 157 5% | 165 -0% | 201 -22% |
* ... más pequeño es mejor
| Gigabyte P55W v6 GeForce GTX 1060 Mobile, 6700HQ, 63 Wh | Gigabyte P55W v5 GeForce GTX 970M, 6700HQ, 61 Wh | Asus Strix GL502VM-FY039T GeForce GTX 1060 Mobile, 6700HQ, 64 Wh | MSI GS63VR-6RF16H22 Stealth Pro GeForce GTX 1060 Mobile, 6700HQ, 65 Wh | Acer Predator 15 G9-593-765Q GeForce GTX 1070 Mobile, 6700HQ, Wh | |
|---|---|---|---|---|---|
| Duración de Batería | -1% | -30% | -30% | -4% | |
| Reader / Idle (h) | 10.2 | 10.1 -1% | 5.3 -48% | 6 -41% | |
| H.264 (h) | 5.6 | 5.5 -2% | 3.9 -30% | 4.5 -20% | 5 -11% |
| WiFi v1.3 (h) | 5.9 | 5.8 -2% | 3.7 -37% | 3.5 -41% | 4.8 -19% |
| Load (h) | 1.6 | 1.6 0% | 1.5 -6% | 1.3 -19% | 1.9 19% |
Pro
Contra
Las diferentes ediciones del Gigabyte P55W siempre han conseguido mantenerse en un buen equilibrio entre rendimiento y precio - y esta versión, la sexta, lo mantiene. El cambio de una GeForce GTX 970 a una GTX 1060 se traduce en un incremento de un 50% de rendimiento 3D sin haber aumentado el precio (1600 euros). Más potencia por el mismo precio.
La apariencia externa no ha cambiado en absoluto - el chasis y la buena selección de puertos físicos, los buenos dispositivos de entrada y los altavoces "así así" se mantienen. De nuevo, Gigabyte usa una CPU Skylake con 16 GB de RAM, de forma que el sistema tiene potencia de sobra y puede gestionar tareas complejas sin problemas. La duración de batería tampoco se ha visto afectada.
Comparado con su antecesor, el nuevo portátil parece haber retrocedido en algunos aspectos. La pantalla tiene mucho menos contraste y la distribución de brillo ha empeorado. Esto es remarcable ya que los paneles, al menos según su número de modelo y tipo, son idénticos. El SSD super veloz que equipaba la v5 del P55W ha dejado paso a una unidad mucho más lenta de Trascend. El ruido generado se ha incrementado, llegando a ser muy molesto cuando el sistema se exprime.
Con todo, el P55W v6 es una buena evolución - y por 1600 euros, el usuario obtiene un muy buen rendimiento 3D. El Asus ROG Strix GL502VM de iguales características es el único otro dispositivo con el mismo ratio precio-rendimiento. Los usuarios que no necesiten tanta potencia de cálculo pueden ahorrar un montón de dinero si optaran por un Acer Aspire VX5-591G que cuesta unos 1000 euros. Los jugones que exijan más rendimiento del que ofrece el P55W v6 deben prepararse para gastar un montón de dinero: el Acer Predator 15 G9-593, por ejemplo, se vende por 2500 euros.
Ésta es una versión acortada del análisis original. Puedes leer el análisis completo en inglés aquí.
Gigabyte P55W v6
- 01/31/2017 v6 (old)
Oliver Moebel


